a max-margin framework for supervised graph completionandrews/pub/stu-andrews-networks-wrkshp... ·...
TRANSCRIPT

A max-margin frameworkfor supervised graph
completion
Stuart Andrews and Tony JebaraColumbia University
2
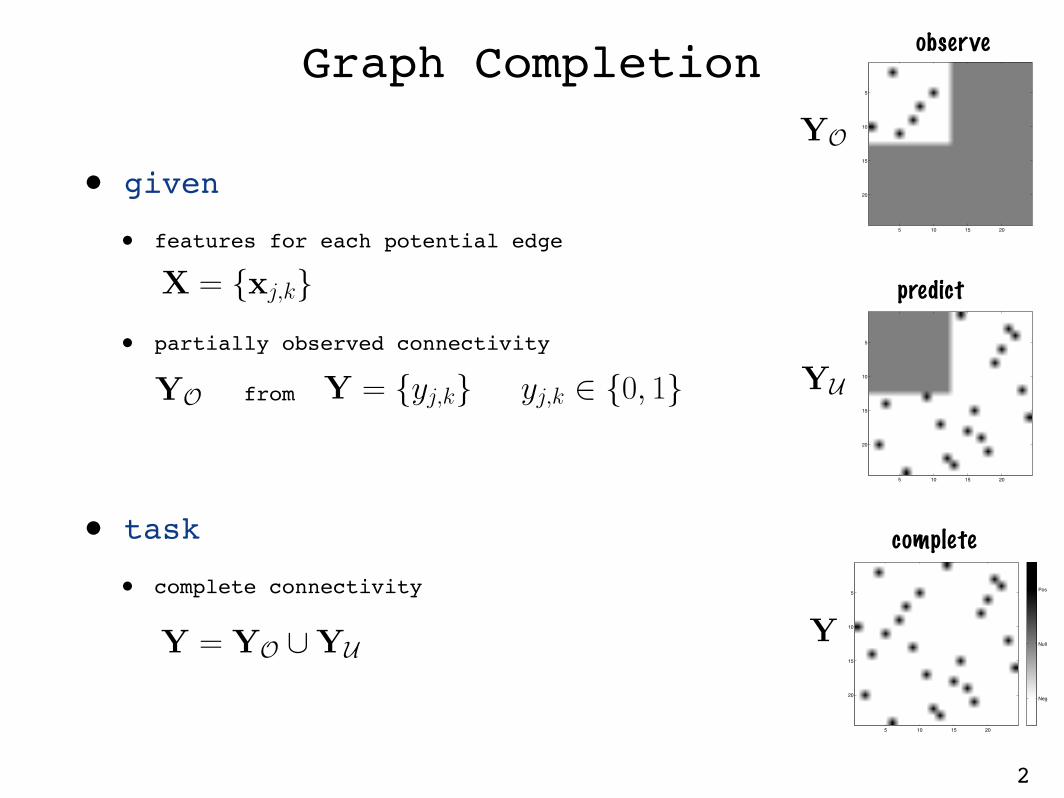
• given
• features for each potential edge
• partially observed connectivity
from
• task
• complete connectivity
YY = YO ∪YU
Graph Completion
Y ! {0, 1}n2
5 10 15 20
5
10
15
20
observe
5 10 15 20
5
10
15
20
predict
5 10 15 20
5
10
15
20Neg
Null
Pos
complete
X = {xi}
Y = {yi} ∈ Y
YO
YUyj,k ∈ {0, 1}Y = {yj,k}YO
X = {xj,k}

3
!""
!"!
!"#
!"!$
!"!#
!"!!
%&'(&&)%*+,(*-.,*/0
1/')2
11/')3425
4 4.5 5 5.5 6 6.5 7 7.5 8 8.5 9
0.05
0.1
0.15
0.2
0.25
0.3
0.35
degree distribution
kp(k
)
!""
!"!
!"#
!"!$
!"!#
!"!!
%&'(&&)%*+,(*-.,*/0
1/')2
11/')3425
• approach 1: topology
• topology of complete connectivity is similar to observed connectivity
• e.g. Liben-Nowell and Kleinberg, 2003
• approach 2: attribute-value learning
• “on” / “off” property of edges is related to their features
• e.g. Yamanishi, Vert, and Kanehisa, 2003
• idea: a marriage of structured-output models and degree-constrained subgraphs
Graph Completion
δoutiδin
i
4
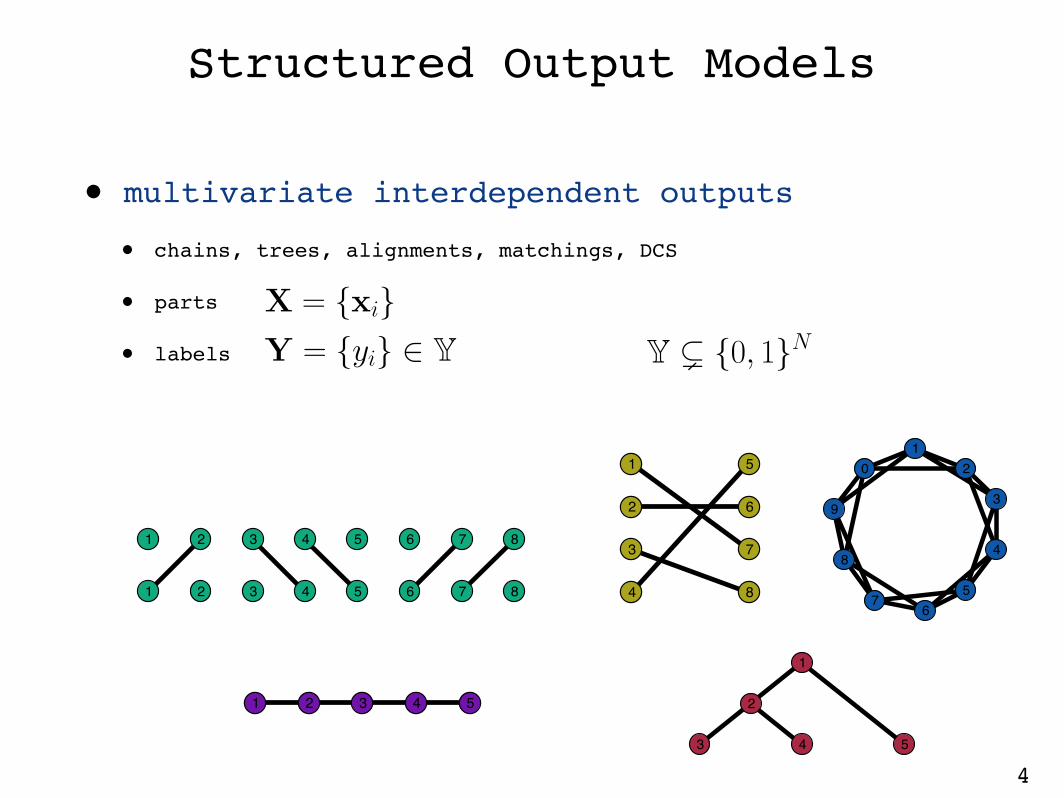
• multivariate interdependent outputs
• chains, trees, alignments, matchings, DCS
• parts
• labels
6 7543
6543
8
7
2
1 2
1
8 4
5
3
2
1
8
7
6
Structured Output Models
X = {xi}Y = {yi} ∈ Y Y ! {0, 1}N
Z = {zi}
V = {vi}
4 5321
1
0
9
8
76
5
4
3
2
3 5
1
2
4
5
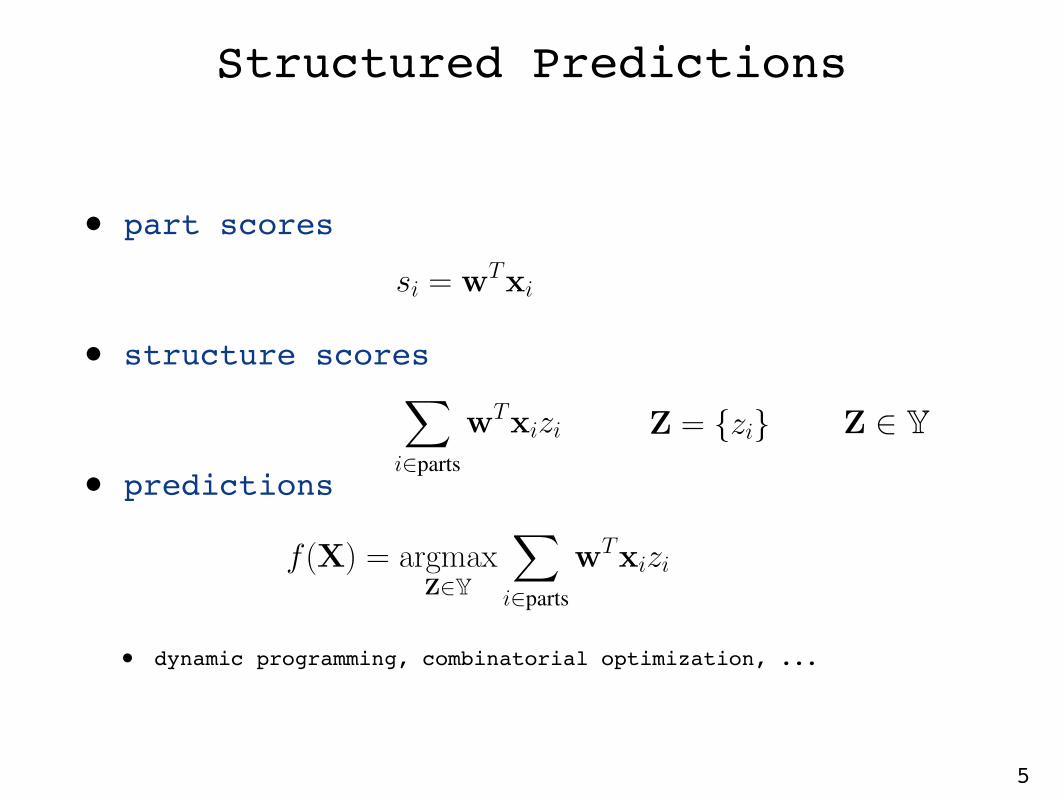
• part scores
• structure scores
• predictions
• dynamic programming, combinatorial optimization, ...
Structured Predictions
X = {xi} Y = {yi} ∈ Y Y ! {0, 1}N
Z = {zi}
V = {vi}
f (X) = argmaxZ∈Y
∑i∈parts
wTxizi
si = wTxi
∑i∈parts
wTxizi Z ∈ Y
6
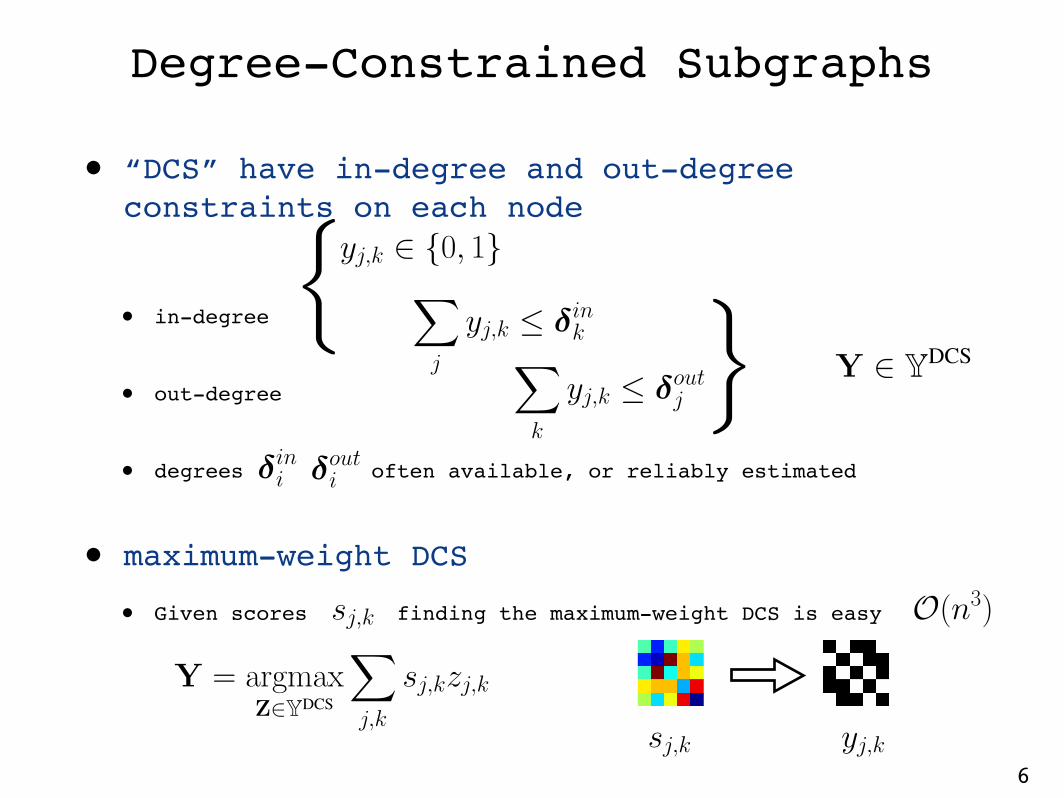
Degree-Constrained Subgraphs
• “DCS” have in-degree and out-degree constraints on each node
• in-degree
• out-degree
• degrees often available, or reliably estimated
• maximum-weight DCS
• Given scores finding the maximum-weight DCS is easy
Y = {yj,k}
YDCS
yj,k ∈ {0, 1}∑j
yj,k ≤ δink∑
k
yj,k ≤ δoutj
Y ∈ YDCS
}}
O(n3)sj,k
yj,ksj,k
Y = argmaxZ∈YDCS
∑j,k
sj,kzj,k
δoutiδin
i
7
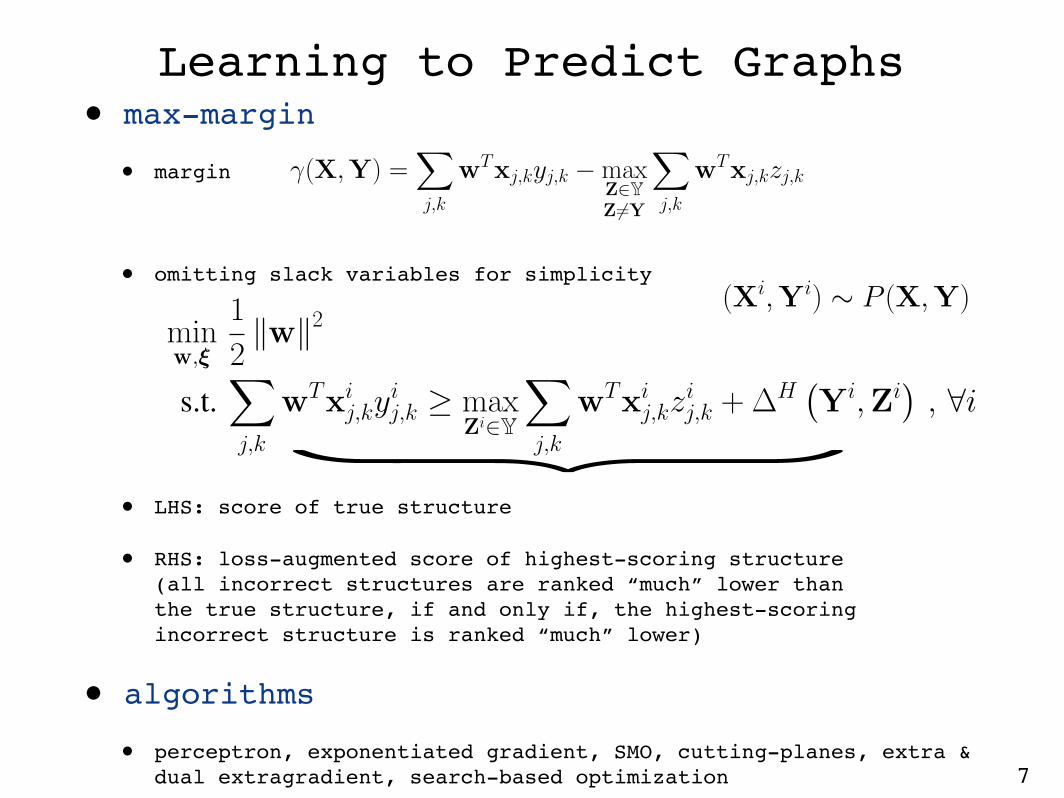
Learning to Predict Graphs• max-margin
• margin
• omitting slack variables for simplicity
• LHS: score of true structure
• RHS: loss-augmented score of highest-scoring structure(all incorrect structures are ranked “much” lower than the true structure, if and only if, the highest-scoring incorrect structure is ranked “much” lower)
• algorithms
• perceptron, exponentiated gradient, SMO, cutting-planes, extra & dual extragradient, search-based optimization
Xj
Yj = f (Xj)
γ(X,Y) =∑
i∈parts
wTxiyi − maxZ∈Y,Z#=Y
∑i∈parts
wTxizi
f (X)
(Xi,Yi) ∼ P (X,Y)minw,ξ
1
2‖w‖2
s.t.∑j,k
wTxij,ky
ij,k ≥ max
Zi∈Y
∑j,k
wTxij,kz
ij,k + ∆H
(Yi,Zi
), ∀i}γ(X,Y) =
∑j,k
wTxj,kyj,k −maxZ∈YZ#=Y
∑j,k
wTxj,kzj,k
8
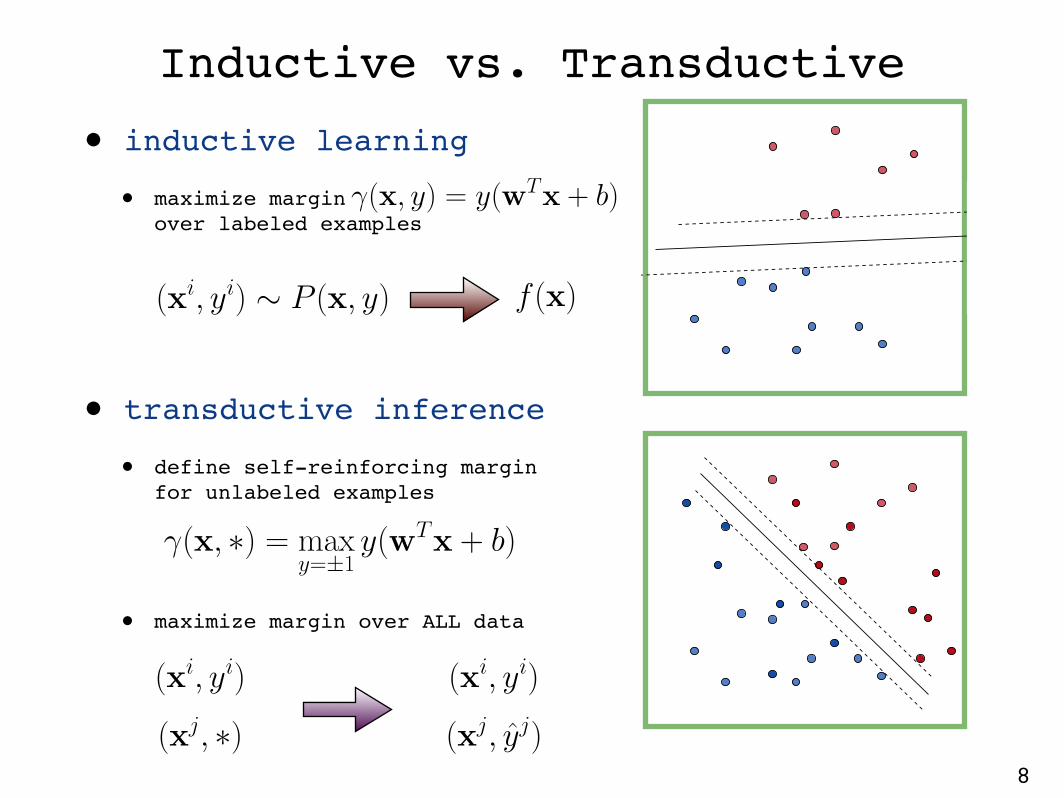
• inductive learning
• maximize margin over labeled examples
• transductive inference
• define self-reinforcing marginfor unlabeled examples
• maximize margin over ALL data
(xi, yi) ∼ P (x, y) f (x)
Inductive vs. Transductive
γ(x, y) = y(wTx + b)
(xi, yi)
(xj, ∗) (xj, yj)
(xi, yi)
γ(x, ∗) = maxy=±1
y(wTx + b)
9
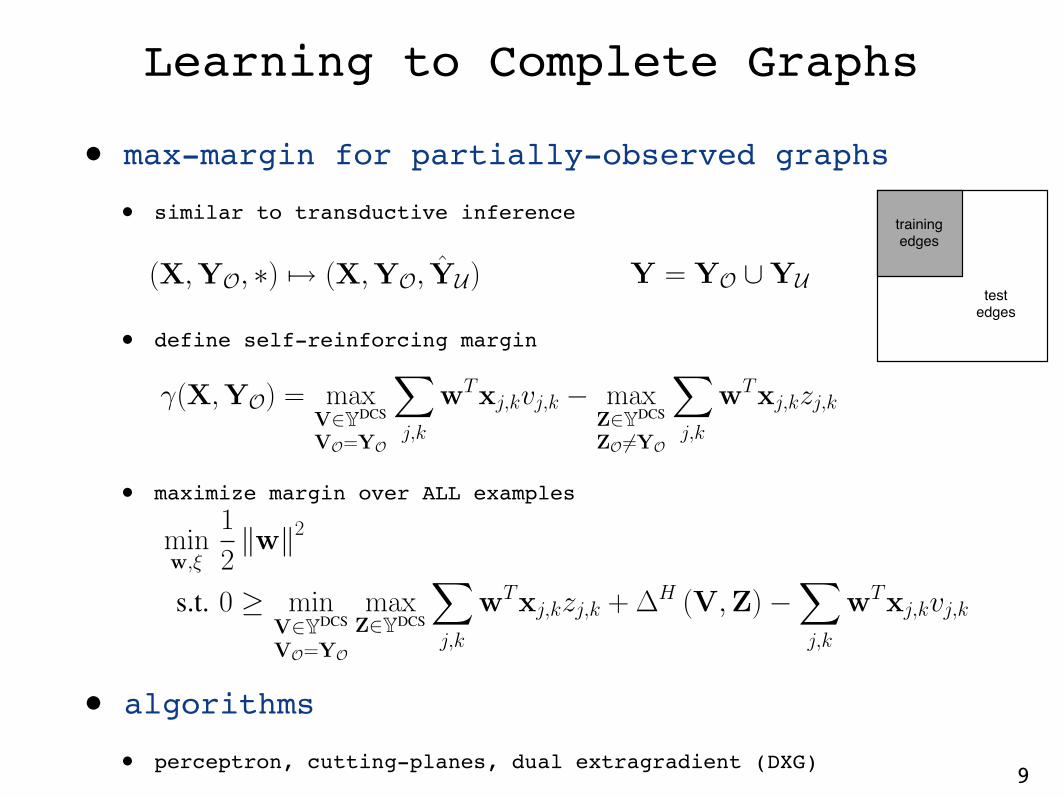
Learning to Complete Graphs
• max-margin for partially-observed graphs
• similar to transductive inference
• define self-reinforcing margin
• maximize margin over ALL examples
• algorithms
• perceptron, cutting-planes, dual extragradient (DXG)
minw,ξ
1
2‖w‖2
s.t. 0 ≥ minV∈YDCS
VO=YO
maxZ∈YDCS
∑j,k
wTxj,kzj,k + ∆H (V,Z)−∑j,k
wTxj,kvj,k
Y = YO ∪YU(X,YO, ∗) "→ (X,YO, YU)
trainingedges
test edges
γ(X,YO) = maxV∈YDCS
VO=YO
∑j,k
wTxj,kvj,k − maxZ∈YDCS
ZO #=YO
∑j,k
wTxj,kzj,k
10
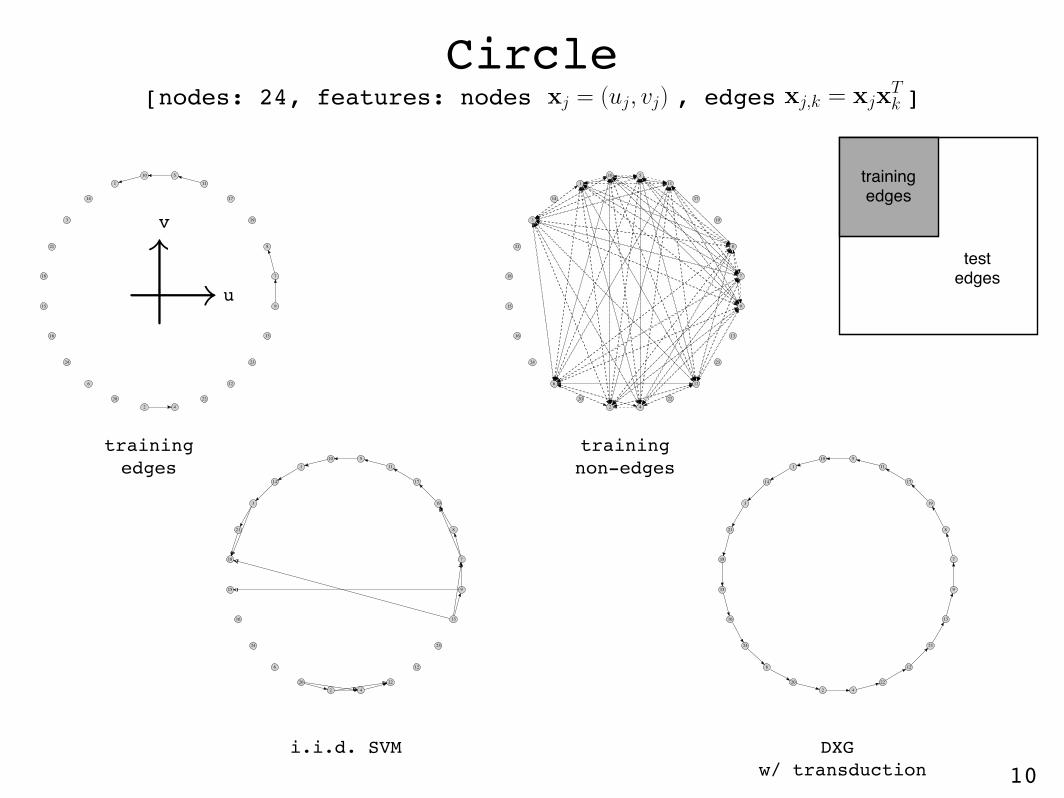
Circle[nodes: 24, features: nodes , edges ]
1
2
3
4
5
6
7
8
9
1011
12
13
14
15
16
17
18
19
20
21
22
2324
1
2
3
4
5
6
7
8
9
1011
12
13
14
15
16
17
18
19
20
21
22
2324
i.i.d. SVM DXG w/ transduction
trainingedges
test edges
1
2
3
4
5
6
7
8
9
1011
12
13
14
15
16
17
18
19
20
21
22
2324
1
2
3
4
5
6
7
8
9
1011
12
13
14
15
16
17
18
19
20
21
22
2324
trainingedges
trainingnon-edges
−→−→ u
v
xj = (uj, vj) xj,k = xjxTk

11
1 2 3 4 5 6 7 8 9 10 11
500
1000
1500
2000
2500
3000
3500
4000
4500
5000
signaling molecules
sam
ple
s
1 2 3 4 5 6 7 8 9 10 11
500
1000
1500
2000
2500
3000
3500
4000
4500
5000
Signal Transduction
• flow cytometry expression levels and intervention states
• consensus network
• published by Karen Sachs et al. Science 308, 523 (2005)[formatted by Eaton and Murphy, AISTAT, 2007]
xj
yj,k
xj
12
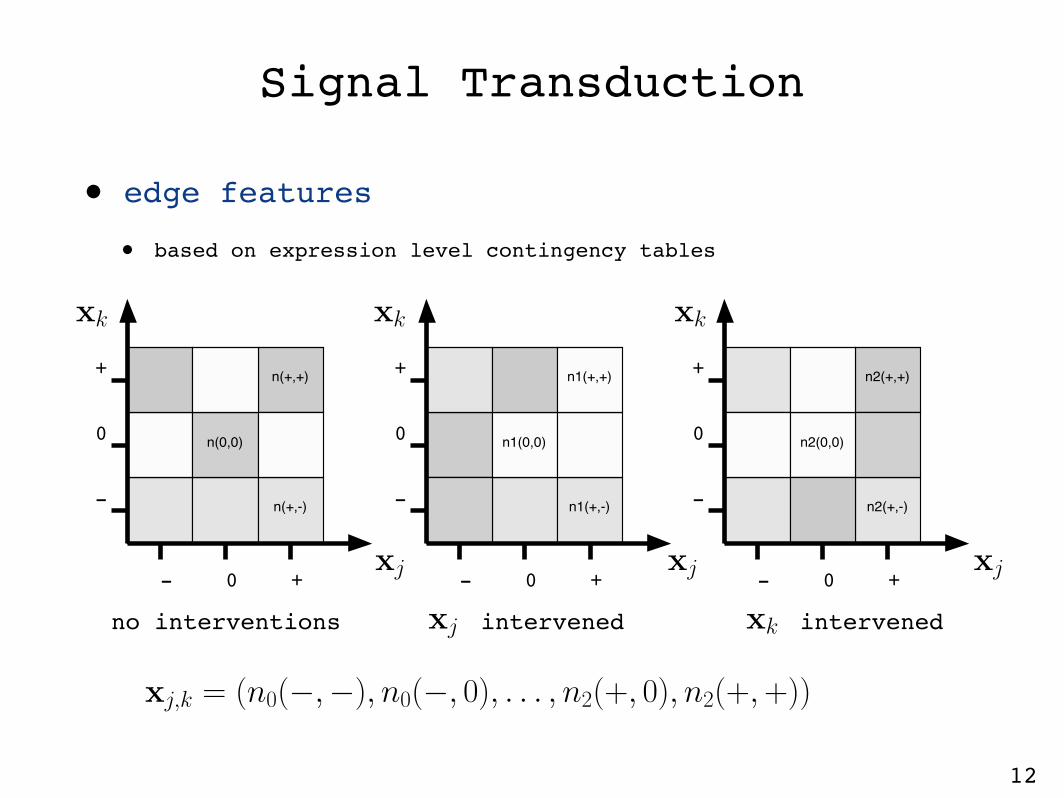
Signal Transduction
• edge features
• based on expression level contingency tables
xj,k = (n0(−,−), n0(−, 0), . . . , n2(+, 0), n2(+, +))
n2(+,+)
n2(+,-)
n2(0,0)
- 0 +
-
0
+
n1(+,-)
n1(0,0)
n1(+,+)
- 0 +
-
0
+n(+,+)
n(+,-)
n(0,0)
- 0 +
-
0
+
xk xk xk
xj xj xj
no interventions intervenedxj intervenedxk
13
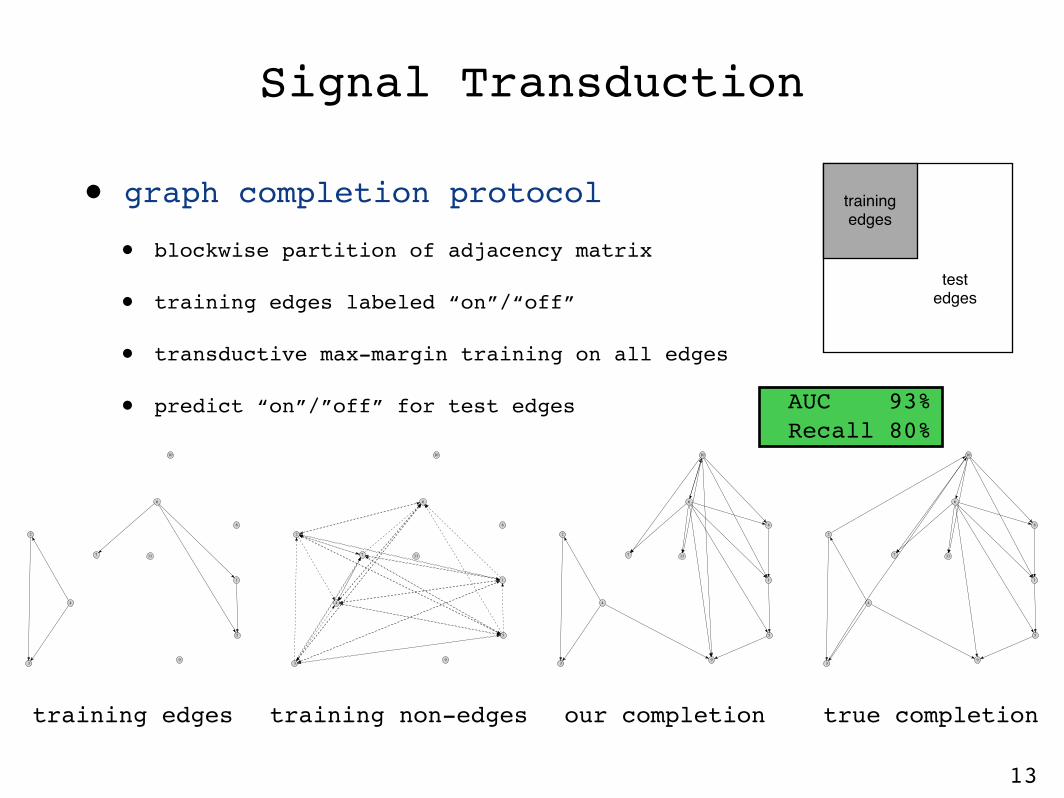
Signal Transduction
• graph completion protocol
• blockwise partition of adjacency matrix
• training edges labeled “on”/“off”
• transductive max-margin training on all edges
• predict “on”/”off” for test edges
1
2
3
4
5
6
7
8
9
10
11
1
2
3
4
5
6
7
8
9
10
11
1
2
3
4
5
6
7
8
9
10
11
1
2
3
4
5
6
7
8
9
10
11
training edges training non-edges our completion true completion
trainingedges
test edges
AUC 93%Recall 80%
14
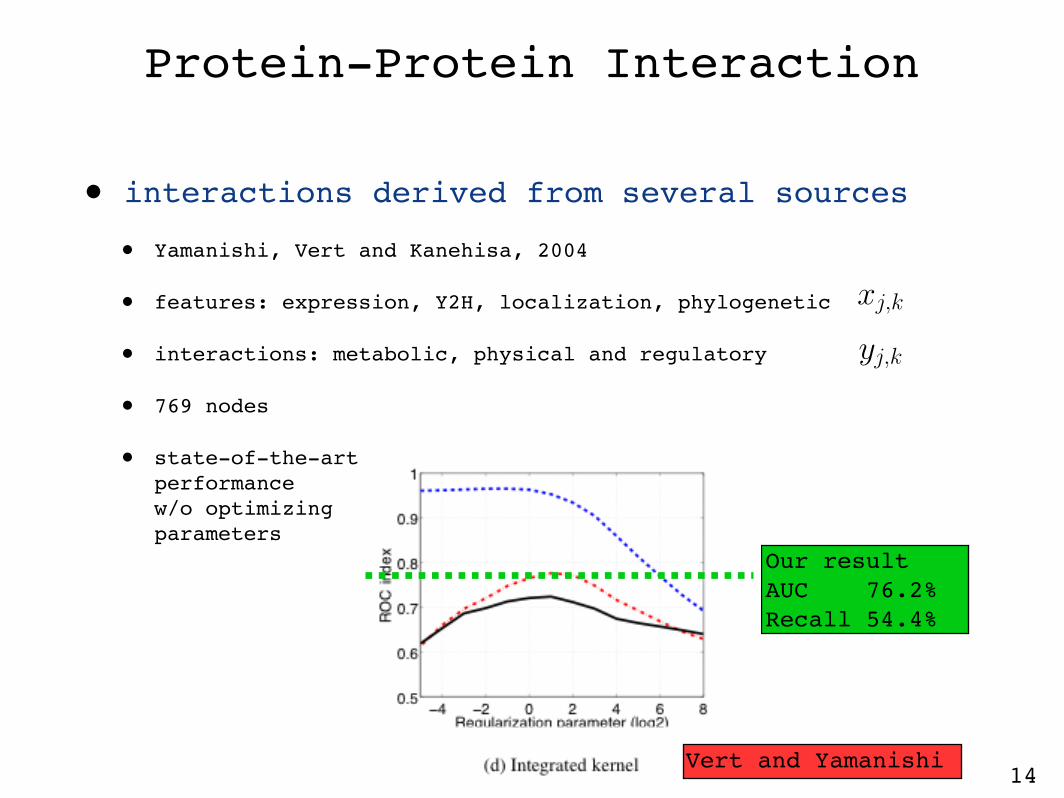
Our resultAUC 76.2%Recall 54.4%
Protein-Protein Interaction
yj,k
xj,k
Vert and Yamanishi
• interactions derived from several sources
• Yamanishi, Vert and Kanehisa, 2004
• features: expression, Y2H, localization, phylogenetic
• interactions: metabolic, physical and regulatory
• 769 nodes
• state-of-the-artperformancew/o optimizingparameters

15
Summary
• a marriage of structured-output models and degree-constrained subgraphs
• topology and attribute-value learning
• evaluation on synthetic and real-world networks
• task 1: complete circle network using x,y node positions
• task 2: complete cell signaling network using flow cytometry expressions
• task 3: complete protein-protein interactions using expression, Y2H, localization and phylogenetic features