a mathematical model to predict the performance of ... · a mathematical model to predict the...
TRANSCRIPT

A mathematical model to predict theperformance of advanced therapies inwound healing
J. Ko, S. Dickman & V. Li
Abstract
Wound healing is a complex, dynamic process. The ability to simulate this processusing mathematical models that incorporate quantitative data on growth factors,tissue repair cells and matrix components would be a powerful tool to predict,analyze, and optimize new therapies. We present such a mathematical frameworkbased on a system of ordinary differential equations and wound healing parametervalues from the established literature. In contrast to conventional therapy, advancedmodalities can augment certain components of the healing process in a measurablefashion. The performance of specific wound therapies can be simulated and com-pared to other therapies. We have enhanced the model by incorporating parametersof clinical practice used in the real world setting. This approach has application topredictive performance analysis and optimization of new advanced modalities anddetermination of best clinical practice.
1 Introduction
Wound healing is a complex process involving the interaction of many cell typesand signaling molecules. In the U.S. alone, 6 million patients have chronic wounds.In many conditions, such as diabetes, the wound healing process is complicated bybiochemical imbalances that often lead to wounds that do not heal. Each year,5% of diabetics develop a leg ulcer, of which 53% do not heal even after 20weeks. Several mathematical models have been proposed to predict healing behav-ior for normal vs. diabetic wounds. These models have been proposed to be ableto estimate the effectiveness of various clinical treatments such as skin grafts andgrowth factor therapy. Little work has been done, however, to compare these mod-els with clinical evidence and to ensure that the models and the parameter values
accurately represent the current best clinical practices. In addition, recent clinicaland laboratory research findings call for revision to previous models.
2 Model description
We describe here a general framework for a wound healing system based on themodels of Waugh and Sherratt. Each of the numerous variables in the woundhealing process – cell types, matrix components, growth factors, and other sig-naling molecules – are modeled as concentrations over time. Adapting the classicpredator-prey population model, the rate of change of a cell population is mod-eled by the rate of cell migration, cell mitosis and cell death. Similarly, the rate ofchange of a growth factor, matrix component or chemical mediator population ismodeled by the rate of production minus the rate of decay.
The basic mathematical model in [1] is given by the following system of equa-tions:
⎧⎪⎨⎪⎩
φI = αK(T ) + k1k2φI (1 − k3(φI + φR)) − d1φI
φR = (1 − α)K(T ) + k1k2φR(1 − k3(φI + φR)) − d1φR
T = k4φI − d2T
(1)
where the variables φI , φR and T are the densities of inflammatory macrophages,repair macrophages and the growth factor TGF-β, respectively; ki, d1 are growthand decay rates of the variables; K(T ) is the effect of monocyte migration dueto TGF-β as seen in controlled-interaction studies; α ∈ [0, 1] is the fraction ofmonocytes becoming inflammatory macrophages and will also be seen to be abifurcation parameter for this system.
This system attempts to capture an essential part of the wound healing pro-cess, as illustrated in Figure 1. Significantly, the system uses a surrogate endpointof healing– the “zero equilibrium point”– at which the inflammatory macrophagepopulation has stabilized to its pre-wound level. This zero equilibrium point gener-ally corresponds to the cessation of wound inflammation and proliferative activitythat accompanies closure of the wound cavity and surface. The contributions ofepidermal keratinocytes, platelets, and blood vessel endothelial cells – ignored inprevious models – can be captured their impact on TGF-β, fibroblasts and PDGF.
A bifurcation analysis of this model shows that there exists an α∗ such that forα ∈ [0, α∗), there is one stable equilibrium and for α ∈ [α∗, 1], there are threeequilibria, with a sequence of stable-unstable-stable. This analysis underlies theinitial choice of α in the model: an initial choice of α ∈ [0, α∗) corresponds towound healing in normal skin and α ∈ [α∗, 1] corresponds to healing in diabeticskin.
A subsequent 7-variable revision in [3] builds upon this basic model, with theadditional variables of the densities of fibroblasts (F ), hyaluronan (HA), colla-gen (C), and PDGF (P ). An equilibrium analysis shows a similar bifurcationstructure as in the simplified model (1). Fixing a value of αnormal = 0.5 and

Fibroblasts
MonocytesKeratinocytes
PDGF
TGF-ß1
Collagen I, III, VProteoglycansFibronectinAngiogenesisEpithelialization
MØRepair
MØInflamm
HA
MMPs TIMP
( )
Platelets
Figure 1: Modeled interactions in the wound healing process. Adapted from [2].
αdiabet ic = 0.8, and substituting all parameter values, we can solve for the equi-librium points (φI , φR, T , P, F,C,H). In both cases, we found more than 100equilibrium points. Most equilibrium points were disregarded because they con-tained complex coordinates and were thus nonphysical. Moreover, equilibriumpoints with negative coordinates could also be disregarded, as these too represent anonphysical representation. Restricting to real-valued equilibrium points, a linearanalysis readily shows that the situation is similar to that of (1): for α = αnormal,the one real-valued equilibrium is stable, and for α = αdiabetic, three real-valuedequilibria exist, with the sequence being stable-unstable-stable.
A persistent feature of this revised model is the relative magnitude of the quan-tities φI , φR, T at each of the equilibrium points in the diabetic case relative tomagnitude at the normal state. The first diabetic equilibrium point has coordinatevalues similar to those of the stable equilibrium point in the normal case. Thisfirst equilibrium point shows that diabetic wounds are capable of reaching a heal-ing state. The second equilibrium point corresponds to the chronic inflammationstate. The last equilibrium point, which has elevated levels of macrophages φI , φR
(where φI � φR), T , and P relative to the levels at equilibrium in the normal case, corresponds to a chronic non-healing wound.
In this paper, we describe a model which reflects ongoing clinical research find-ings. Our model is a system which incorporates the effect of suppressed levels ofPDGF in diabetic wounds and the presence of epidermal keratinocytes in one ofthe skin graft therapies (Apligraf) by modeling its effect on TGF-β. Importantly,

we show how data from controlled experiments can be incorporated into this modelin lieu of modeling the evolution of a variable for which only limited informationis known. Our model is given by the following system of equations:
⎧⎪⎪⎪⎪⎪⎪⎪⎪⎪⎪⎪⎨⎪⎪⎪⎪⎪⎪⎪⎪⎪⎪⎪⎩
φI = αK(T ) + k1k2φI (1 − k3(φI + φR) − k5F − k6C) − d1φI
φR = (1 − α)K(T ) + k1k2φR(1 − k3(φI + φR) − k5F − k6C) − d1φR
T = k4φI + k7KC(t)F − d2T
P = k8(α)(φI + φR) + k9F − d3P (2)
F = M(P) + k10F(1 − k3(φI + φR) − k5F − k6C) − d4F
C = k11F + Ff (T )g(C) − d5FC
H = k12F − d6H
where ki, di refer to growth and decay rates, M(P), f (T ), g(C) are measuredmigration effects as seen in controlled-interaction studies, and KC , which isnonzero only for the treatment Apligraf, is the measured effect of keratinocyteson TGF-β in the presence of fibroblasts. Exact parameter values used in the simu-lations are provided in the Appendix.
3 Testing the model against clinical data
As an initial test for our model, we compared data from wound healing clinicaltrials with predictions made by our wound healing model.
3.1 Topical growth factor therapy for diabetic ulcers
One clinical trial was designed to examine the effectiveness of rhPDGF-BB 0.01%gel (becaplermin, Systagenix, London), a topical growth factor therapy which dra-matically increases local PDGF levels at the wound site, in treating diabetic ulcers.The ulcers had been unhealed for at least 60 days before treatment began. Onegroup of patients was treated with the medication daily for 20 weeks, while a con-trol group was given placebo control. Applying these conditions, our model pre-dicts that wounds in the control group remains at an unhealed steady state, whilethe wounds receiving the topical growth factor reaches the stable equilibrium in 23weeks (Figure 2). This is in good agreement to the results of the clinical trial, inwhich patients receiving medication healed significantly (P = 0.01) faster than thecontrol group. Roughly 50% of patients receiving medication were healed within20 weeks, compared to 25% of those in the control group, demonstrating a 43%increase in the incidence of healing (P = 0.007) [4].
3.2 Topical growth factor therapy for acute wounds
Another clinical trial was undertaken to examine the effectiveness of PDGF growthfactor therapy (becaplermin gel) on acute, non-diabetic wounds, compared to the

Unhealed
for 60 d
Daily PDGF x 20 wks
Days
pg/mm3
Equilibrium at zero reached
at 23 weeks
Days
Figure 2: Topical PDGF therapy for chronic diabetic ulcers. Left: dosing; right:time to surrogate endpoint for healing.
Daily PDGF x 3 weeks
Days
pg/mm3
Equilibrium reached 20% earlier
Days
Figure 3: Topical PDGF therapy for acute wounds.
topical antibiotic bacitracin. Participants in the experimental group received dailyapplications of PDGF for three weeks immediately following the wound event.Figure 3 shows the prediction of our model: the group receiving growth factortherapy achieves equilibrium 20% earlier than the control group. Clinical data, bycomparison, showed that growth factor therapy helped achieve complete woundclosure 32% faster than bacitracin [5].
3.3 Dermagraft therapy for diabetic ulcers
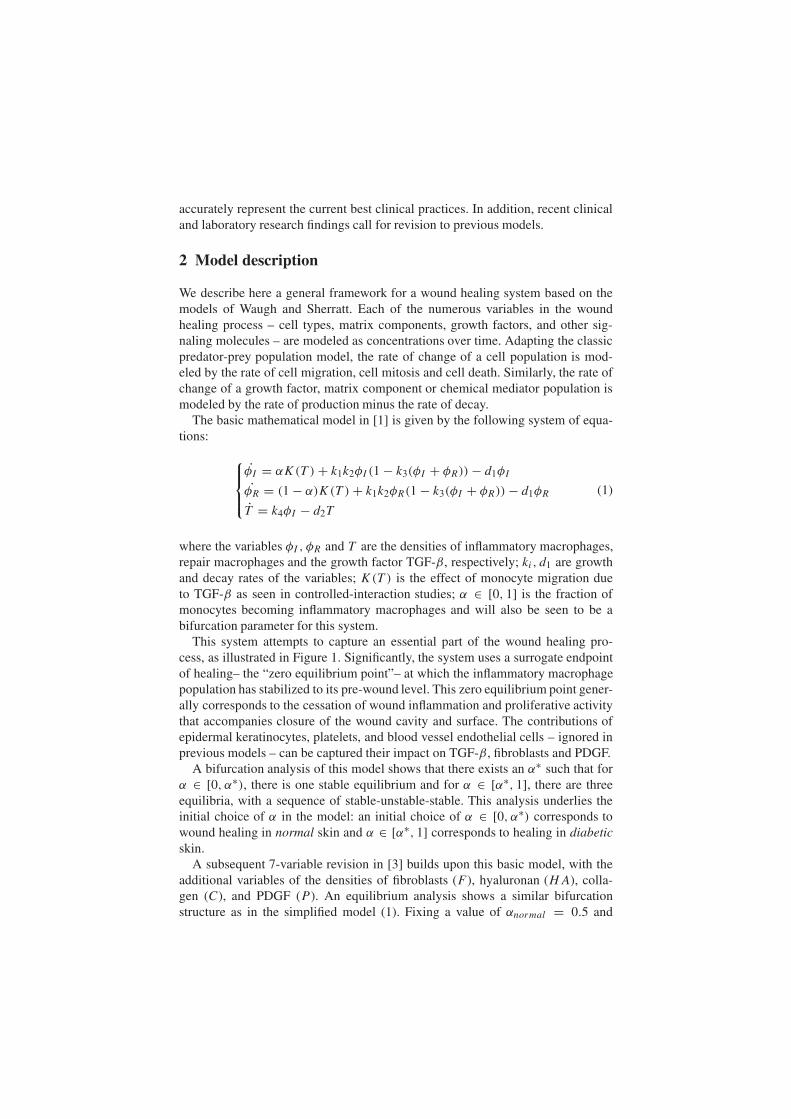
A clinical trial was designed to test the effectiveness of Dermagraft (AdvancedBioHealing, Westport, CT), a bioengineered cryopreserved dermal fibroblast skinconstruct used to treat chronic diabetic wounds. In this trial, patients with diabeticfoot ulcers which had remained unhealed for at least six weeks were random-ized into a control group and a treatment group receiving Dermagraft. Figure 4
Days
zero equilibrium reached
at 14 wks
Figure 4: Bioengineered cryopreserved dermal fibroblast therapy for chronic dia-betic ulcers and time to surrogate endpoint for healing.
shows the prediction of our model: patients receiving Dermagraft treatment reachthe surrogate healing endpoint at week 14 of treatment. In comparison, the clini-cal trial data showed that after 12 weeks of treatment, 30% of patients receivingDermagraft had completely healed, compared to 18.3% of patients in the controlgroup [6].
3.4 Apligraf therapy for diabetic ulcers
Apligraf (Graftskin, Organogenesis, Canton, MA) is a bioengineered, cultured,bilayered living skin construct consisting of both epidermal keratinocytes and der-mal fibroblasts. A clinical trial was conducted to examine the effectiveness ofApligraft treatment on diabetic foot ulcers. In our model, Apligraf was appliedmonthly over three months, following current best clinical practice, to ulcers whichhad been unhealed for at least six weeks. In this case, it is noteworthy to com-pare our results with those using the Waugh-Sherratt model in [3], which appliedApligraf weekly, not monthly and did not take into consideration the contribu-tion of epidermal keratinocytes in Apligraf. These differences may account forthe previous model’s inability to predict wound closure using Apligraf, insteadachieving an unhealed steady state. Our model, taking into account the effect ofkeratinocytes on TGF-β, predicts that the zero equilibrium point is reached after140 days (Figure 5). These results are consistent with actual clinical data. The piv-otal trial showed that with three monthly applications, 56% of patients receivingApligraft treatment had achieved complete wound closure at 12 weeks (84 days),

Days
Apligraf applied monthly x 3
Fibroblasts + Keratinocytes effects
Persistence of Apligraf cells 1 mo
Unhealed
for 6 wks
Days
Previous model:
no zero equilibrium
New model w/ keratinocyte effects:
zero equilibrium achieved
Figure 5: Bioengineered cultured bilayered skin therapy for chronic diabeticulcers. Left: dosing of Apligraf; right: comparison of results predictedby previous model [3] and our model.
compared to 39% in the control group, a P = 0.0026 difference [7]. A separatestudy found that Apligraft treatment led to 70% of patients achieving completewound healing with an average of two applications [8].
4 Discussion and future work
Our wound healing model uses a population-based system of equations to predictthe level of certain cell types and chemicals as functions of time. By comparingpredictions from the model with clinical data, we have shown that the model cap-tures certain key features of the wound healing process. By looking at currentclinical research findings, we were able to improve how the model predicts thebehavior of specific treatments on healing. This type of calibration is critical andshould be an ongoing process in light of new research findings. In addition, a thor-ough review of all equation coefficients and parameters was undertaken to increasethe accuracy of the model’s predictions. The system does not model the spatial dis-tribution of tissue cells within the healing wound. Thus, the effect of cells such asepidermal keratinocytes are manifest in its influence on TGF-β levels.
Multiple factors may impair the wound healing process. For instance, proteoly-sis can be stimulated by bacterial infection. In turn, excessive enzymatic proteoly-sis will disrupt the healing process. Other factors which slow the healing processinclude cellular senescence, sustained inflammation, moisture imbalance, physicalpressure, compromised patient status, impaired perfusion, insufficient angiogene-sis, and deficient growth factors [9]. The deficiencies of growth factors like PDFGand TGF-β can also impair wound healing.
All mathematical models which attempt to approximate a complex biologicalprocess like wound healing have limitations. Not all the variables included in this

model have known accurate values. In addition, the heterogeneity between individ-ual patients is a difficult factor to incorporate into a mathematical model. Futureplanned work are: (i) continually improve the accuracy of the parameter values asnew data emerges from scientific and clinical studies; (ii) to introduce more vari-ables into the model that can better represent the complexity of wound healing (eg.MMP, other growth factors); (iii) address directly the endpoint of healing via thespatio-temporal dynamics.
In summary, this model can provide important insights into the fundamentaldrivers that affect wound healing. This model can also be used to understand howperturbations in certain parameters can optimize healing. A practical use for thismodel might eventually be to guide the rational design of drug and device prior tosignificant investment in commercial research and development.
Appendix A
A.1 Variables
The variables in this model are the same as those used in [3], and are describedbelow:φI : Inflammatory macrophages (cells/mm3)φR: Repair macrophages (cells/mm3)α: Proportion of migrating monocytes differentiating into φI (cells/mm3)k1: % macrophages undergoing mitosisk2: macrophages growth ratek3: inverse max macrophage density (/cells/mm3)k4: macrophage TGF-β production rateK(T ): monocyte migration due to TGF-βP : PDGF (pg/mm3)d3: PDGF decay rate(/day)T : TGF-β (pg/mm3)k7: TGF-β production rate by fibroblasts (pg/cells/day)KC(t): scaled effect of keratinocytes on TGF-β in the presence of fibroblastsk4: TGF-β production rate by macrophages (pg/cells/day)d2: TGF-β decay rate (/day)F : fibroblasts (cells/mm3)k10: fibroblast growth rate (/day)d4: fibroblast death rate (/day)k5: inverse max fibroblast density (/cells/mm3)k9: fibroblast PDGF production rate (pg/cells/day)k8: macrophage PDGF production rate (pg/cells/day)M(P): fibroblast migration due to PDGFC: collagen (μg/mm3)k11: fibroblast collagen rate (μg/cells/day)f (T ): fibroblast synthesis of collagen due to TGF-βg(C): collagen synthesis due to collagen density

Days
1.2
1.1
1.0
0.9
0.8
0.7
0.6
0.5
0.4
0.3
0.2
kf(t)
0 5 10 15 20 25 30
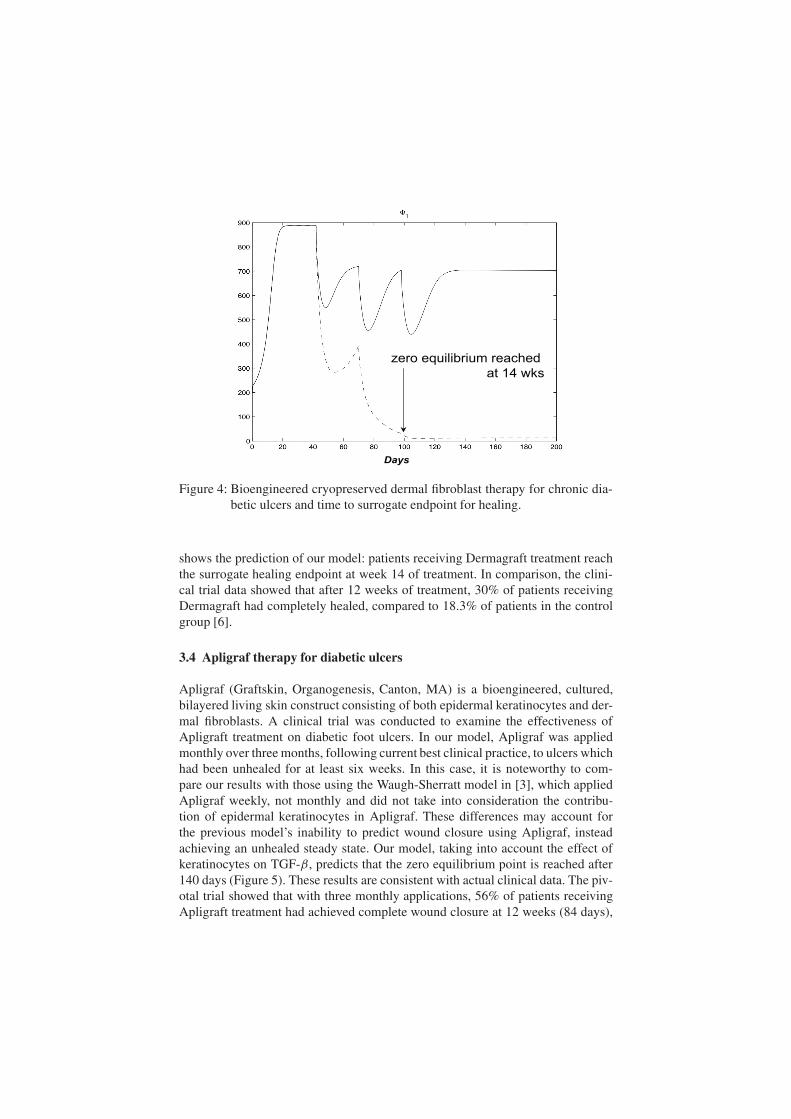
Figure 6: kf (t), the measured effect of keratinocytes on TGF-β in the presence offibroblasts.
k6: inverse max collagen density (μg/mm3)d5: collagen remodeling rate (/day)H : hyaluronank12: hyaluronan synthesis by fibroblasts (μg/cells/day)d6: hyaluronan decay rate (/day)
A.2 Determination and refinement in parameter values
We describe here any changes to parameters that were also used in [3] as well asthe determination of new parameter values in our model.
– Start treatment time points are defined at a point where the wound hasbecome chronic (e.g. one month = 28 days), which is the inclusion crite-ria for most clinical trials in wound healing.
– k8 = k8(α): Recent research in [10] shows that diabetic limb tissues aredeficient in the growth factor PDGF by up to 40%.
– The number of fibroblasts and collagen in Apligraf and Dermagraft weredetermined based on the fibroblast density and thickness of the product,according to personal communication with Katie Faria, Organognesis andGary Gentzkow (Advanced Tissue Sciences)
– The effect of PDGF on fibroblast migration was determined by calculatingcells per field (400x magnification) in studies [11].
– The concentration of PDGF was determined through personal communica-tion with Liza Ovington, Johnson & Johnson Wound Management.
– KC(t): the presence of keratinocytes in one product (Apligraf) is taken intoconsideration through its effect on suppressed TGF-β production by fibrob-lasts in studies of co-cultures [12]. To find KC(t), we take the curve kf =

Table 1: Parameter values used in simulations.
Variable Initial Normal Diabetic Apligraf Dermagraft Regranex
φI 200
φR 200
α (initial) 0.5 0.8
k1 0.05 0.05
k2 0.693 0.693
k3 0.002 0.002
k4 0.07 0.07
d1 0.2 0.2
P 2 1 1 650
d3 4.0 4 .2
T 6 4 0.4
k7 0.004 0.004
k4 0.07 0.07
d2 9.1 9.1
F 6 5100 14000
k10 0.924 0.924
d4 1.0 2.5
k5 0.0025 0.0025
k9 0.0015 0.0015
k8 0.015 0.003
C 10 2.5 0.015 9.1 8.5
k11 20 5
k6 0.0004 0.0004
d5 1.50e-05 1.50e-05
H 0.01 7.45 80
d6 0.7 0.7
k12 0.008 0.001
kf (t) derived from the curve that measures the effect of keratinocytes andfibroblasts on TGF-β normalized by the base curve that measures the effectof fibroblasts alone over the course of 30 days. The curve for kf used in our
simulations is shown in Figure 6. KC(t) can be taken to be:
KC(t) = ((kf )(t) + 1
k7(kf )′(t))ek7∗t
In our simulations, we take the variable functions α(H),K(T ),M(P), f (T ) andg(C) to be the same as in [3].
Acknowledgement
Many thanks to Jonathan Sherratt for his interest, his expertise, and his generosity.
References
[1] Waugh, H.V. & Sherratt, J.A., Macrophage dynamics in diabetic wound heal-ing. Bull Math Biol, 68(1), pp. 197–207, 2006.
[2] Pierce, G.F., Mustoe, T.A. & Lingelbach, J.et al.., Platelet-derived growthfactor and transforming growth factor-beta enhance tissue repair activities byunique mechanisms. J Cell Biol, 109, pp. 429–440, 1989.
[3] Waugh, H.V. & Sherratt, J.A., Modelling the effects of treating diabeticwounds with engineered skin substitutes. Wound Rep Reg, 15(1), pp. 556–565, 2007.
[4] Wieman, T., Smiell, J. & Su, Y., Efficacy and safety of a topical gel formula-tion of recombinant human platelet-derived growth factor-BB (becaplermin)in patients with chronic neuropathic diabetic ulcers. a phase iii randomizedplacebo-controlled double-blind study. Diabetes Care, 21(5), pp. 822–827,1998.
[5] Li, V.W., Ma, J. & Ko, J.et al.., Dynamics of acute wound healing followingtopical rhPDGF therapy. J Am Acad Dermatol, 52(3), p. P213, 2005.
[6] Marston, W.A., Hanft, J., Norwood, P. & Pollak, R., The efficacy and safetyof Dermagraft in improving the healing of chronic diabetic foot ulcers: resultsof a prospective randomized trial. Diabetes Care, 26, pp. 1701–1705, 2003.
[7] Veves, A., Falanga, V., Armstrong, D.G. & et al., Graftskin, a human skinequivalent, is effective in the management of noninfected neuropathic dia-betic foot ulcers: a prospective randomized multicenter clinical trial. Dia-betes Care, 24, pp. 290–295, 2001.
[8] Novartis US08 Non-Controlled Study. Unpublished.[9] CMS Medical Coverage Advisory Committee Meeting on Usual Care of
Chronic wounds. Baltimore, MD, 2005.[10] Tanii, M., Yonemitsu, Y. & Fujii, T.et al.., Diabetic microangiopathy in
ischemic limb is a disease of disturbance of the platelet-derived growthfactor-BB/protein kinase C axis but not of impaired expression of angiogenicfactors. Circ Res, 98, pp. 55–62, 2006.
[11] Facchiano, A., De Marchis, F. & Turchetti, E.et al.., The chemotactic andmitogenic effects of platelet-derived growth factor-BB on rat aorta smooth

muscle cells are inhibited by basic fibroblast growth factor. J Cell Sci, 113 (Pt 16), pp. 2855–2863, 2000.
[12] Le Poole, I.C. & Boyce, S.T., Keratinocytes suppress transforming growthfactor-beta1 expression by fibroblasts in cultured skin substitutes. Br J Der-matol, 140, pp. 409–416, 1999.