a machine learning-based methodology for …
TRANSCRIPT

UNIVERSIDADE FEDERAL DE PERNAMBUCO
CENTRO DE TECNOLOGIA E GEOCIÊNCIAS
DEPARTAMENTO DE ENGENHARIA DE PRODUÇÃO
PROGRAMA DE PÓS-GRADUAÇÃO EM ENGENHARIA DE PRODUÇÃO
JULY BIAS MACÊDO
A MACHINE LEARNING-BASED METHODOLOGY FOR AUTOMATED
CLASSIFICATION OF RISKS IN AN OIL REFINERY
Recife
2019
JULY BIAS MACÊDO
A MACHINE LEARNING-BASED METHODOLOGY FOR AUTOMATED
CLASSIFICATION OF RISKS IN AN OIL REFINERY
Dissertação apresentada ao Programa de Pós-
Graduação em Engenharia de Produção da
Universidade Federal de Pernambuco, como
requisito parcial para a obtenção do título de
Mestre em Engenharia de Produção.
Área de concentração: Pesquisa Operacional.
Orientador: Profº. Dr. Márcio José das Chagas Moura.
Recife
2019

Catalogação na fonte
Bibliotecária Maria Luiza de Moura Ferreira, CRB-4 / 1469
M141m Macêdo, July Bias.
A machine learning-based methodology for automated classification of risks in an
oil refinery / July Bias Macêdo. - 2019.
51 folhas, il. e tabs.
Orientador. Prof. Dr. Márcio José das Chagas Moura.
Dissertação (Mestrado) – Universidade Federal de Pernambuco. CTG. Programa
de Pós-Graduação em Engenharia de Produção, 2019.
Inclui Referências e Apêndice.
1. Engenharia de Produção. 2. Avaliação de risco. 3. Aprendizagem de máquina.
4. Máquina de vetores de suporte. 5. Refinarias de petróleo. I. Moura, Márcio José das
Chagas (Orientador). II. Título.
UFPE
658.5 CDD (22. ed.) BCTG/2019-167
JULY BIAS MACÊDO
A MACHINE LEARNING-BASED METHODOLOGY FOR AUTOMATED
CLASSIFICATION OF RISKS IN AN OIL REFINERY
Dissertação apresentada ao Programa de Pós-
Graduação em Engenharia de Produção da
Universidade Federal de Pernambuco, como
requisito parcial para a obtenção do título de
Mestre em Engenharia de Produção.
Aprovada em: 19/02/2019.
BANCA EXAMINADORA
_________________________________________________
Profº. Dr. Márcio José das Chagas Moura (Orientador)
Universidade Federal de Pernambuco
_________________________________________________
Profª. Dra. Isis Didier Lins (Examinador Interno)
Universidade Federal de Pernambuco
_________________________________________________
Prof. Dr. Savio Souza Venancio Vianna (Examinador Externo)
Universidade Estadual de Campinas

ACKNOWLEDGMENTS
I would like to offer a special thank you to my vovó Maria, who was always proud of
me and gave me all the love she could.
I am grateful to my family, specially my parents, Lindaci and Nelson, my brother
Shalom and my sister-in-law Gabi for their support and to encourage me to follow my dreams.
I wish to give my sincere thank you to Caio, who is always by my side, although the
stress caused by this research, for his support, patience, and love.
I would like to express my deep gratitude to Professor Márcio Moura for the
opportunities offered, his guidance and constructive advices.
I would also like to extend my thanks to Professora Isis Lins, for the comments during
the development of this dissertation. To Caio Maior, for the valuable discussions about
important topics of the work. And all friends from CEERMA, Mona, João and Lucas, who were
always available to help me.
Ale, Bella, Júlia, Lili, Thaisa and Ricardinho, my dearest friends, who shared special
moments with me, for all the companionship and support.
This study was financed in part by the Coordenação de Aperfeiçoamento de Pessoal de
Nível Superior - Brasil (CAPES) - Finance Code 001.

ABSTRACT
Oil refineries process hazardous substances at extreme operational conditions to
produce valuable products. The necessary and required risk assessment is generally rather time-
consuming and involves a multidisciplinary group of experts to identify potential accidental
hypotheses, and compute their frequency and severity. With respect to this context, in this work,
we present a machine learning method to mine out useful knowledge and information from
available data of past risk assessments. The aim is at automatically classifying possible accident
scenarios that may occur in oil refinery processing units by using SVM (support vector
machines). Data from a previous qualitative risk assessment of an ADU (atmospheric
distillation unit) of a real oil refinery is used to demonstrate the applicability of the SVM-based
approach. The test classification was made with an F1 score of 89.95%. In this way, the results
obtained showed that the proposed method is promising for efficiently performing automated
risk assessment of oil refineries.
Keywords: Risk assessment. Machine learning. Support vector machines. Oil refineries.

RESUMO
Refinarias de petróleo processam substâncias perigosas em condições operacionais
extremas para produzir produtos valiosos. A execução da necessária e exigida avaliação de
riscos é geralmente bastante demorada e envolve um grupo multidisciplinar de especialistas
para identificar possíveis hipóteses acidentais e calcular suas frequências e a severidade de suas
consequências. Com relação a este contexto, neste trabalho, apresenta-se um método de
aprendizagem de máquina para extrair conhecimento e informações úteis a partir de avaliações
anteriores de riscos. O objetivo é classificar automaticamente os possíveis cenários acidentais
que possam ocorrer em unidades de processamento de refinaria de petróleo usando máquina de
vetores de suporte. Os dados de uma avaliação de risco qualitativa previamente elaborada de
uma ADU (unidade de destilação atmosférica) de uma refinaria de petróleo real são usados para
demonstrar a aplicabilidade da abordagem baseada em SVM. A classificação dos dados de teste
foi feita com um escore F1 de 89,95%. Os resultados obtidos demonstraram que o método
proposto é promissor para realizar eficientemente avaliações automáticas de risco de refinarias
de petróleo.
Palavras-chave: Avaliação de risco. Aprendizagem de ráquina. Máquina de vetores de suporte.
Refinarias de petróleo.

LIST OF FIGURES
Figure 1 – Framework with the general steps to execute a risk assessment……………. 12
Figure 2 – Steps to perform a qualitative risk assessment through the proposed model.. 13
Figure 3 – Generic process flow diagram from a distillation unit……………………… 16
Figure 4 – Inference of a classifier at supervised learning……………………………... 22
Figure 5 – Three different classifiers trained with a data set with two classes………… 23
Figure 6 – Separation hyperplane for linearly separable data………………………….. 24
Figure 7 – General view of the developed model………………………………………. 28
Figure 8 – Confusion matrix relative to SVC1 for test samples prediction……………. 36
Figure 9 – Confusion matrix relative to SVC2 for test samples prediction……………. 37
LIST OF TABLES
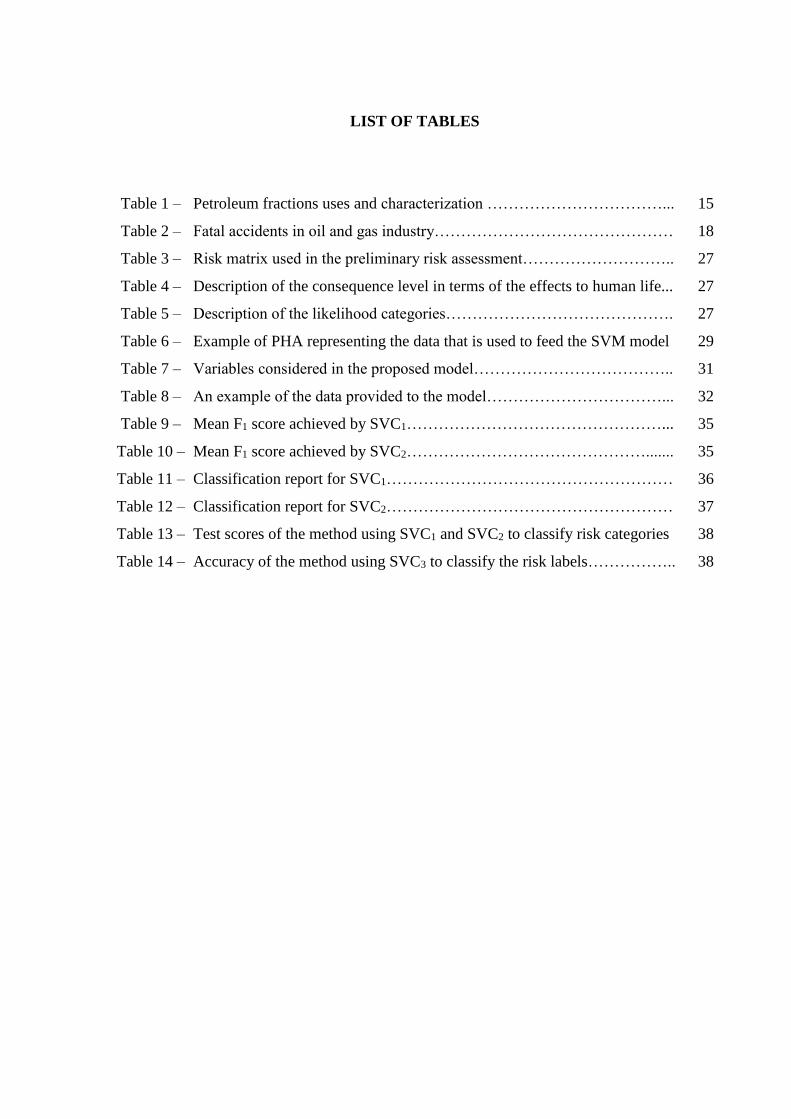
Table 1 – Petroleum fractions uses and characterization ……………………………... 15
Table 2 – Fatal accidents in oil and gas industry……………………………………… 18
Table 3 – Risk matrix used in the preliminary risk assessment……………………….. 27
Table 4 – Description of the consequence level in terms of the effects to human life... 27
Table 5 – Description of the likelihood categories……………………………………. 27
Table 6 – Example of PHA representing the data that is used to feed the SVM model 29
Table 7 – Variables considered in the proposed model……………………………….. 31
Table 8 – An example of the data provided to the model……………………………... 32
Table 9 – Mean F1 score achieved by SVC1…………………………………………... 35
Table 10 – Mean F1 score achieved by SVC2………………………………………....... 35
Table 11 – Classification report for SVC1……………………………………………… 36
Table 12 – Classification report for SVC2……………………………………………… 37
Table 13 – Test scores of the method using SVC1 and SVC2 to classify risk categories 38
Table 14 – Accuracy of the method using SVC3 to classify the risk labels…………….. 38

SUMMARY
1 INTRODUCTION……………………………………………………………… 10
1.1 JUSTIFICATION.................................................................................................. 12
1.2 OBJECTIVES........................................................................................................ 13
1.2.1 General Objectives................................................................................................. 14
1.2.2 Specific Objectives................................................................................................. 14
1.3 DISSERTATION STRUCTURE........................................................................... 14
2 THEORETICAL BACKGROUND AND LITERATURE REVIEW……….. 15
2.1 OIL AND GAS REFINERIES…………………………………………………... 15
2.1.1 Atmospheric Distillation Unit (ADU).................................................................... 16
2.2 BRIEF HISTORY OF ACCIDENTS IN OIL REFINERIES……………………. 17
2.3 RISK ANALYSIS.................................................................................................. 18
2.4 MACHINE LEARNING (ML).............................................................................. 22
2.4.1 Support Vector Machines (SVM)........................................................................... 23
2.4.2 Model Selection..................................................................................................... 26
3 METHODOLOGY............................................................................................... 27
3.1 DATA COLLETION............................................................................................. 29
3.2 FEATURE SELECTION....................................................................................... 30
3.3 MODELING PROCESS........................................................................................ 32
4 RESULTS AND DISCUSSION........................................................................... 34
5 CONCLUSIONS.................................................................................................. 39
REFERENCES..................................................................................................... 41
APPENDIX A – DADOS UTILIZADOS NO MODELO................................. 47

10
1 INTRODUCTION
Petroleum has an impressive value to society. It is widely used as raw material to produce
cosmetics, fuels, clothes, chemical for industry, and other useful materials. However, in its raw
state, the crude oil does not have many useful applications. For this reason, it is essential to
convert the crude oil into its products to explore all of its potential.
In this context, oil refineries are complex (and expensive) industrial systems whose main
purpose is to separate the petroleum into more valuable and useful fractions to meet society
needs (DEMIRBAS; BAMUFLEH, 2017). Three basic activities characterize the operation of
petroleum refineries: separation, conversion and treatment. These activities involve handling
hazardous materials, characterized by their explosiveness, flammability, and toxicity, which
may cause catastrophic accidents.
Major accidents with severe effects to either humans or environment can be generated
from the release of large amounts of energy or hazardous materials over a short lapse of time.
In particular, they concern the occurrence of fires, explosions and atmospheric dispersion of
toxic products. The consequences of these undesirable scenarios, then, depend on the nature of
the released material and its physical state, and the conditions of the environment (CASAL,
2017; EL-HARBAWI et al., 2008; GEORGIADOU et al., 2010).
On one hand , the concern with human safety and the increasing complexity of industrial
systems on the other, make indispensable the assessment of the risks of catastrophic accidents
from industrial facilities. As a matter of fact, nowadays, national and international regulatory
standards exist, that require organizations to adopt procedures to manage and minimize the
potential risk related to the operation of industrial facilities (COX, 2009; HU et al., 2018;
MURAKAMI, 2016).
Different techniques of risk analysis have been developed and applied, and they can be
classified as qualitative, quantitative or semi-quantitative (KHAN; HASHEMI, 2017). Usually,
qualitative methods are elaborated by means of good engineering judgement and know-how. In
general, they are easy to apply, even though they can be very time-consuming (CCPS, 1992;
SILVA et al., 2014). Amundrud and Aven (2015) pointed out that knowledge gain on risk takes
time, but it is absolutely necessary to their prevention and mitigation. Besides, it composes the
basis for the elaboration of emergency and safety measures.
In fact, to perform a qualitative risk analysis, a large number of documents should be
consider, such as equipment and material lists, with the objective of characterizing the analyzed

11
system (CARRASQUILLA; MELKO, 2017). Next, it is necessary to identify the potential
hazards, which is usually done through the application of some qualitative techniques by a
multidisciplinary team. Then, the risks are categorized by analyzing the likelihood of causes
and severity of consequences of the possible accidental scenarios (TNO, 2005a). This approach
is often used to prioritize the risks, which allows efforts to be directed more effectively.
Silva and Jacinto (2012) pointed at the growing quantity of available data and information
about industrial accidents and the need to explore novel techniques and statistical tools for
mining knowledge from these data and information, with the aim at finding hidden details that
could assist to understand the phenomena of interest. Ale (2016) also argued that the processing
and analysis of the increasingly available information help predict accidents and allow for more
founded decision making.
In this context, ML (machine learning) techniques have been successfully used to mine
knowledge from information and data in different fields, such as, computer-vision, medicine,
cyber security and so on (SINGH; ROY; MOHAN, 2017). For instance, Pang, Lee and
Vaithyanathan (2002) analyzed the efficiency of different ML models to perform a sentiment
classification, which usually involves intuition of experts, and thus pointed out that SVM
(support vector machines) is effective to text categorization. Furthermore, Jiang and Chen
(2014) indicated that there are well-established methods for chemical process risk management,
such as HazOp, that can be adapted to supply chain networks, and then proposed an approach
based on SVM to evaluate the supply chain’s risk, transforming it into a risk rating problem.
More recently, Liu et al. (2018) utilized and compared different ML methods for fault diagnosis
of rotating machinery.
Indeed, the ability of ML to deal with large volumes of data, and to successfully identify
and classify information makes the application of these techniques attractive to the risk
assessment context in order to reduce necessary efforts to perform it. Therefore, this Master’s
dissertation proposes an SVM-based model for automated classification of risks. The proposed
model is tailored for oil refining processes, which begin at the ADU (atmospheric distillation
unit), where the crude oil is converted into more valuable products.
ADU contains different dangerous chemical products, such as fuels and residues from the
process. Moreover, the separation that takes place in ADU requires the application of heat and
involves a series of evaporation and condensation of the liquid mixture (KINSARA;
DEMIRBAS, 2016). Thus, this dissertation presents a practical example, in order to illustrate
the applicability of the developed SVM model to an ADU of an oil refinery, which contains
12
hazardous materials and is characterized by propitious conditions that may lead to catastrophic
accidents.
1.1 JUSTIFICATION
Although the increasing efforts to prevent major accidents, they are far from being
eradicate. Thus, it is indispensable to develop new methods to support risk studies. The
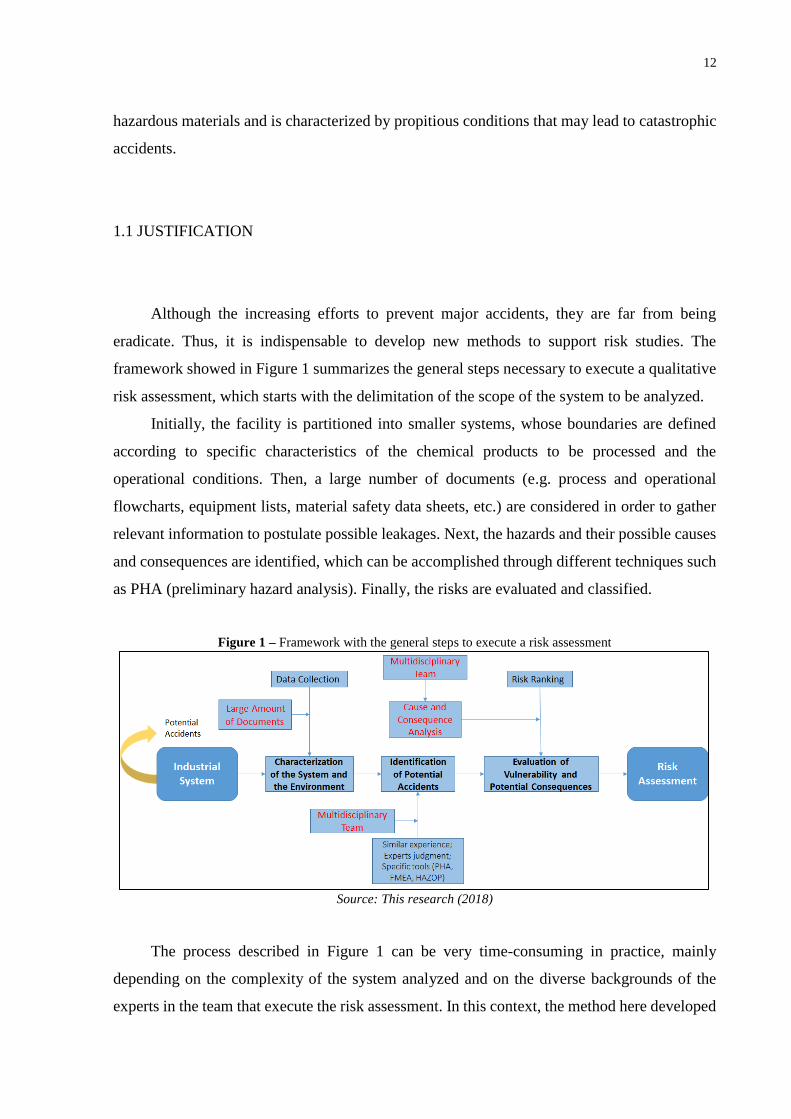
framework showed in Figure 1 summarizes the general steps necessary to execute a qualitative
risk assessment, which starts with the delimitation of the scope of the system to be analyzed.
Initially, the facility is partitioned into smaller systems, whose boundaries are defined
according to specific characteristics of the chemical products to be processed and the
operational conditions. Then, a large number of documents (e.g. process and operational
flowcharts, equipment lists, material safety data sheets, etc.) are considered in order to gather
relevant information to postulate possible leakages. Next, the hazards and their possible causes
and consequences are identified, which can be accomplished through different techniques such
as PHA (preliminary hazard analysis). Finally, the risks are evaluated and classified.
Figure 1 – Framework with the general steps to execute a risk assessment
Source: This research (2018)
The process described in Figure 1 can be very time-consuming in practice, mainly
depending on the complexity of the system analyzed and on the diverse backgrounds of the
experts in the team that execute the risk assessment. In this context, the method here developed

13
aims at reducing the efforts required to perform risk assessments. Information about the
potential accidents, which can be extracted from documents is provided to an ML model. Then,
it learns the relationships among the operating conditions, potential accidents, their causes and
consequences, and finally the identified risks could be automatically assessed by using the ML
classifier. This procedure can be illustrated in Figure 2.
Figure 2 – Steps to perform a qualitative risk assessment through the proposed model
Source: This research (2018)
Comparing Figure 2 to Figure 1, the proposed model may reduce the time and manpower
required to perform risk assessment. However, it is important to emphasize that the critical
judgment of the risk analyst would still be necessary to evaluate the coherence of classifications
obtained, the proposed model is not intended to replace the risk analyst, but to ease this process
of risk assessment. Therefore, this dissertation proposes a method based on SVM to classify
automatically the risks associated with an ADU from an oil refinery, which contains hazardous
materials and is characterized by propitious conditions that may lead to fatal accidents.
1.2 OBJECTIVES
In this section the main objective of this dissertation is described and specific objectives
related with this work are presented in the following sections.

14
1.2.1 General Objective
The main purpose of this study is to develop a method able to classify automatically risks
related to an ADU, by means of the implementation of an SVM classifier model, which will be
fed with information collected through the evaluation of previous elaborated PHA documents.
1.2.2 Specific Objectives
- Data collection: Previously prepared PHAs documents for the ADU were provided to
this study. They were evaluated in order to extract information essential for the learning
process;
- Characterization of the potential accidents: Identification of features relative to the
potential accidents to build the set of input-output pairs to feed the SVM model;
- Algorithm implementation: Implementation of SVM classifiers;
- Hyper-parameters optimization: Attainment of the hyper-parameters that lead to the
model with best accuracy;
- Risk classification: Provide test data as input to the classifier to obtain the related risk
classification.
1.3 DISSERTATION STRUCTURE
The remainder of this research is organized as follows:
- Chapter 2 describes the process involved in the ADU, introduces important concepts
used in risk analysis, and explains the theory that backs up SVM;
- Chapter 3 presents the SVM-based proposed methodology to classify automatically
risks;
- Chapter 4 applies the proposed method to an ADU;
- Chapter 5 provides some concluding remarks.

15
2 THEORETICAL BACKGROUND AND LITERATURE REVIEW
In this chapter, we present the definitions and explanation about the key topics and
concepts of this dissertation. Furthermore, a review of the current researches in the area is
presented.
2.1 OIL AND GAS REFINERIES
Petroleum is a complex liquid mixture, whose composition varies according to its origin,
but it consists basically of different hydrocarbons (over 80% of its composition), and a lower
portion of contaminants, such as ammonia, sulfur, and some of their derivatives. Given that, the
separation of the crude oil into pure compounds, or even into a mixture with exactly known
composition, is almost impossible (SPEIGHT, 2015).
These products are more useful, and their value is higher than the value of the oil in its
original state (AL-MUSLIM; DINCER, 2005). Table 1 shows these fractions and summarizes
their composition, in terms of number of carbon atoms that represent the group of hydrocarbons,
and typical boiling range, and the general applications of each fraction.
Table 1 - Petroleum fractions uses and characterization
Fraction Boiling Point (°C) Composition Main Uses
Residual gas - C1 – C2 fuel
Liquefied petroleum gas < 40 C3 – C4 bottled gas
Gasoline 40 – 175 C5 – C10 automobile fuel
Kerosene 175 – 235 C11 – C12 lamp oil, jet fuel
Light fuel oil 235 – 305 C13 - C17 diesel fuel
Heavy fuel oil 305 – 400 C18 - C25 fuel, lubricants production
Mineral oil 400 – 510 C26 - C38 lubricants
Residue > 510 C38 + asphalt, tar
Source: THOMAS et al. (2004)
The refining process initiates in the ADU, which represents the main process in oil and
gas refineries, where the raw oil is heated and transferred to distillation columns. Then, the

16
crude oil is converted into different fractions. Therefore, the products obtained in the ADU may
be either treated as final products or they may be conducted to feed downstream units. Each
fraction corresponds to a group composed of hydrocarbons, which are organic compounds
consisting of carbon and hydrogen, with similar molecular weight and boiling points
(OSUOLALE; ZHANG, 2017; SZKLO; ULLER; BONFÁ, 2012).
2.1.1 Atmospheric Distillation Unit (ADU)
The separation that takes place in the ADU, illustrated in Figure 3, involves petroleum’s
heating, vaporization, fractionation, condensation and cooling. Distillation is a physical
separation process that involves heat and mass transfer, and it is based on the equilibrium
between the liquid and vapor phases, which are obtained when a liquid mixture is heated, due
to partial vaporization. The distillation towers usually work continuously, and it can be operated
under hazardous conditions, i.e. very high/low temperature and/or pressure (SPEIGHT, 2015;
AL-SAHHAF, ELKILANI; FAHIM, 2011).
Figure 3 - Generic process flow diagram from a distillation unit
Source: adapted from Al-sahhaf, Elkilani and Fahim (2011)
Part of the load vaporizes, and thus the light vapors move to the top of the column while
the liquid content moves to the bottom. The liquid arrives by a downcomer in the tray and comes

17
in contact with the vapor that passes through holes, bubblers, or valves, that exist in the trays
producing a foam. Then, the foam spread through the plate until it reaches another downcomer,
where it coalesces and the liquid, without air, passes into the lower tray and the vapor remains
on the tray. Thus, the distilled products are removed from the side of the column at different
points, known as sidecuts, which are related to a boiling range. After the collection of fractions,
they are condensed at different temperatures and, subsequently, processed in downstream units
(AL-MUSLIM; DINCER, 2005; WAHEED et al., 2014).
2.2 BRIEF HISTORY OF ACCIDENTS IN OIL REFINERIES
Over the years there has been a growing demand of petroleum derivative products and a
consequent increase of the amount of hazardous components stored, transported and processed,
with also an increase in the risk of major accidents. (AMYOTTE et al., 2016; KHAN;
HASHEMI, 2017). In the last years, diverse catastrophic industrial accidents have been
occurred. In 1972, at REDUC (Duque de Caxias Refinery) occurred the explosion of three LPG
(liquefied petroleum gas) storage tanks killing 42 people. These tanks contain valves to remove
the liquid that forms inside. When the liquid is completely removed, the LPG starts to escape
and the valve must be closed. The accident was caused by a worker that had opened the valve
of one of the tanks and had gone for a break. When he returned, he could not close the valve
because it was frozen. The gas spread quickly and, then, a fire started. As result, the LPG tanks
exploded (COSTA, 2011).
In 1984, in Cubatão, Brazil, an operational failure caused the rupture of an oil pipeline
spreading over 700,000 liters of gasoline through the mangrove. Then, a fire broke out a few
hours later, leading to the death of 93 people (PORTO, 2016). In August 2012, an accident,
involving an oil pipeline from ADU at Chevron Refinery, USA/California, occurred. As
consequence of the high operating temperatures, the pipe suffered corrosion, leading to the
leakage of diesel. A series of errors were committed in the attempt to stop the leakage without
interrupting the production process, due to the lack of blocking valves between the leak and the
valve. These mistakes led to the pipeline rupture. Then, a hydrocarbon vapor cloud was formed
and rapidly expanded. Next, the cloud reached an ignition source. Although the accident did

18
not cause fatalities, more than 15,000 people went to the near hospitals with respiratory
problems (LUSCHEK, 2012).
Early 2018, an explosion of tanks of the distillation column at Bayernoil Refinery, in
Bavaria, Germany, injured 8 people and more than 1,800 had to be evacuated. After the
explosions, a large fire erupted and the overpressure provoked by the explosions damaged the
roofs and the windows of the houses in the residential area near the refinery (HÜSER; STARK,
2018). In addition, Table 2 lists a few more cases of recent fatal accidents that occurred in
oil and gas refineries, their causes and number of deaths.
Table 2 – Fatal accidents in oil and gas industry
Deaths Cause Company Year
1 Air compressor failure PFB Energy 2015
2 Reboiler failure CVR Refining 2013
2 Heat exchanger failure ExxonMobil 2013
1 Furnace failure Valero Energy Corp. 2013
7 Heat exchanger failure Tesoro 2010
2 Welder failure within a tank HollyFrontier 2010
2 Pipeline rupture Delek Refining Ltd. 2008
Source: Malewitz et al. (2015)
2.3 RISK ANALYSIS
Khakzad, Khan and Paltrinieri (2014) described major accident as critical events that can
lead to various fatalities and catastrophic impacts to people and environment or severe property
damage. In the process industries, they can be defined as large-scale leakages, fires and
explosions that may provoke multiple deaths and/or structural losses (AMYOTTE et al., 2016).
The consequences and impacts of major accidents are directly related to the nature of the
released material.
Indeed, when a flammable material gets in contact with an oxidant, they may react
producing thermal energy and, then, a combustion process can result in either fire or explosion,
where the latter occurs when there is a mixture of oxygen with the fuel gas in a certain
proportion. This value is defined by the LFL (lower flammable limits) and UFL (upper
flammable limits), where LFL represents the concentration value of the substance below which

19
the mixture is still not able to ignite, whereas above the UFL the mixture is excessively rich
with the substance to lead to a combustion (HAUPTMANNS, 2015; DOBASHI, 2017).
Moreover, toxic emissions may also spread as clouds in the air, and the severity and extent
of these clouds depend on the physicochemical and toxicological properties of the released
substance, and on the atmospheric and geographical conditions. Then, there are possible
different consequences of major accidents. Some of them are described as follows, according
to Casal (2017), TNO (2005b) and CCPS (2010a, 2010b):
- Pool fire: Stable combustion of a vapor from a layer of flammable liquid;
- Vapor cloud explosion: Takes place when a flammable vapor cloud reaches an ignition
source and the flames accelerate to sufficiently high velocities. Flame acceleration
only occurs in the presence of congestion, a high-momentum release, or a combination
of both;
- Flash fire: Combustion of a flammable vapor cloud in which there is no increase in
combustion rate, i.e. the flame propagation occurs under near-laminar conditions and,
thus, the flame speeds are not sufficient to produce significant blast effects;
- Toxic vapor cloud: Results from the release of toxic products into the atmosphere.
International and national regulatory standards, which demand the execution of RA (risk
analysis) for hazardous facilities, such as oil and gas industry, have been required by several
governments to prevent the aforementioned undesirable accidents (CAMERON et al., 2017;
HAIMES, 2015).
Regulatory standards are established to provide information and develop scientific
knowledge for decision-making, despite the uncertainties inherent in the risk assessment.
Furthermore, these standards determine acceptance levels according to the tolerance for specific
hazards (MURAKAMI, 2016; WILLIS, 2007). Then, the main purpose of the analysis consists
in providing knowledge and information that aid to make decisions on layout changes,
operation, maintenance, emergency preparation and risk management.
According to Aven (2012), risk assessment is the operative process of RA, where the
accidental scenarios are characterized, through the methodical use of data and knowledge for
describing and identifying accidents causes, probabilities and consequences, and the risk
evaluation follows, where the risks are compared against given risk criteria. Weber et al. (2012)
emphasized that risk assessment requires systematic research of accidental scenarios, and, in
general, can be classified as qualitative, quantitative or semi-quantitative.
20
Generally, safety studies initiate with the detection of the possible hazards, and its main
purpose can be achieved through a PHA (preliminary hazard analysis). This step is considered
fundamental to risk assessment and risk management, for establishing effective safeguards
(CAMERON et al., 2017; SILVA et al., 2014). PHA is applied early in the system life cycle,
generally focusing on the hazardous materials present in the plant. This technique requires
documents such as plant design, equipment and/or material specifications, and other sources of
information (CCPS, 1992).
Generally, the final results of a PHA are given in the form of risk matrices, which are a
methodical approach frequently used in qualitative risk assessment to categorize the different
hazardous situations. The consideration of pre-defined categories of consequence and
likelihood provides the risk ranking of a hazard (MARHAVILAS; KOULOURIOTIS;
GEMENI, 2011). Thus, risk matrices are widely used to prioritize accidental scenarios in order
to develop efficient measures to reduce or mitigate the risk. Also, the most critical scenarios
can be further analyzed in detail by a quantitative method (BENEKOS; DIAMANTIDIS, 2017;
Mannan et al., 2016).
However, the identification of hazards and their evaluation involves the analysis of
numerous documents and the judgment of experts from different disciplines (TNO, 2005). This
step usually represents an exhausting task in risk assessment studies. In fact, Cameron et al.
(2017), Weber et al., (2012) and Pasman (2015) pointed at different methods that have been
developed to automate the process of hazard identification and assessment, in an effort to reduce
the time-consumption and labor required to perform PHA. For instance, Suokas, Heino and
Karvonen (1990) developed a rule-based expert system, HAZOPEX, to support safety analysis.
Srinivasan and Venkatasubramanian (1998) presented a method, which uses digraph-based
models, dynamic mathematical approaches and fault tree methods to automate the processes
during the execution of PHA for continuous processing in chemical industries. Then, the
method was extended to batch processes (VISWANATHAN; SHAH;
VENKATASUBRAMANIAN, 2002).
Lavasani et al. (2011) applied fuzzy risk assessment to quantify the risks levels related to
hazardous events in offshore wells. Furthermore, Ifelebuegu et al. (2018) utilized generic data
from different sources for a subsea gas compression system to improve the estimation of risk
frequency through a Bayesian logic methodology. Markowski and Mannan (2008) developed a
fuzzy logic approach to reduce the uncertainty and imprecision related with the application of
risk matrices. Their methodology uses the estimated risk and efficacy indices (related to the
21
protective level of the system) as input data, which are mapped into a risk index through a fuzzy
logic system. This methodology was applied to a distillation column unit aiming to obtain a
more reliable result, compared to traditional risk assessment matrix. Further, Markowski and
Siuta (2017) adopted the same methodology to select the representative accidental scenarios
from a liquid petroleum gas (LPG) storage facility. However, these authors focused on
eliminating the vagueness and subjectivity of the analysis, but did not take into account the
efforts and the time consumption involved in the process. Tan, Ortiz-Gallardo and Perrons
(2016) pointed at the fact that data analytics tools could help overcome persistent fatality and
injury rates in the oil and gas industry, by revealing hidden patterns and trends that could lead
to accidental scenarios.
In this context, the application of Artificial Intelligence (AI) techniques seems attractive
to simplify and improve the process of risk assessment. As argued by Jordan and Mitchell
(2015), developers of AI systems for diverse applications, it is simpler to train a system by
providing it a set of instances that represent the desired behavior, and then, program it by
predicting the response to new input, rather than building physical models. To that end, different
Machine Learning (ML) techniques are applied, supervised learning methods being the most
widely used, where instances are given with known labels (KOTSIANTIS; ZAHARAKIS;
PINTELAS, 2006).
The ability of Support Vector Machine (SVM) to successfully solve classification
problems makes this learning method interesting for risk analysis (HUANG et al., 2012). In
fact, recent researches have already applied computer vision and ML techniques in this context
to provide new tools to identify potential hazards through images extracted from webcams and
surveillance cameras (MAIOR et al., 2017; MAIOR et al., 2018). However, these works were
not focused in the efforts required to perform risk analysis. In this work, SVM is applied to
replicate the process of qualitative risk assessment, aiming to reduce the efforts and time
consumption involved. Thus, SVM will act as an aiding tool for decision-making purposes.
However, at the best of the authors’ knowledge, there is a lack of works related to the
application of ML to decrease the efforts involved in performing RA. Considering this, the
development of an SVM-based model may provide a useful tool to support risk analysis,
reducing the manpower and time required to execute the studies. Then, to next section
introduces important definitions and concepts on SVM to provide essential knowledge for
understanding the model proposed in this dissertation.

22
2.4 MACHINE LEARNING (ML)
Kumar (2017) mentioned that AI techniques have been developed to reproduce human
abilities as perception, analysis, reasoning, learning, exchange information, and decision-
making. (LI; ZHANG, 2017). According to Jordan and Mitchell (2015), these techniques aim
at improving a performance measure (e.g. the accuracy of a classifier) by means of any kind of
training practice. In other words, ML detects and obtains knowledge from the real world
through computers to reproduce the learning ability (PORTUGAL; ALENCAR; COWAN,
2018).
ML methods apply inductive inference to obtain knowledge from the environment from
a set of examples, in general, they are classified as supervised or unsupervised learning. The
first, uses set of 𝑛 training examples, 𝐷 = {(𝒙𝟏, 𝑦1), (𝒙𝟐, 𝑦2), … , (𝒙𝒏, 𝑦𝑛)}, to infer a function
𝑓, through the mapping of the input values into the output value. Each example (or instance) is
a pair consisting of an input, usually a vector of 𝑚 features, 𝒙, and an output value, 𝑦.
(CHAPELLE et al., 2002; LINS et al., 2013). Moreover, the learning problem can be defined
based on the type of the output 𝑦:
- Regression problems: 𝑦 assumes real values.
- Classification problems: 𝑦 assumes discrete values that represent categories.
Moreover, they can be binary problems, where there are only two classes, or multi-
classification cases.
In classification problems the supervised leaning algorithm extracts a classifier from a
given set of examples, the inference process described and the concepts mentioned are
illustrated in Figure 4.
Figure 4 – Inference of a classifier at supervised learning
Source: adapted from Lorena and Carvalho (2007)

23
SVM is a supervised learning method trained with an algorithm of Mathematical
Optimization and that implement a limit derived from Statistical Learning Theory (VAPNIK;
IZMAILOV, 2017; VAPNIK, 1999). Thus, we have developed a method based on SVM
classifiers to perform the automated qualitative risk assessment.
2.4.1 Support Vector Machines (SVM)
It is widely used to solve both classification and regression problems, as the proposed
model in this dissertation uses support vector classifiers (SVC), this section describes the theory
with an emphasis on classification problems.
As illustrated in Figure 5, the objective of the learning process is to find a classifier
(decision surface) able to separate the different data classes, which are indicated by different
symbols. It is possible to draw numerous lines to separate the two classes, this fact leads to an
optimization problem that consists in determining which is the best line. The first classifier
(Figure 5a) is not able adjust to fit the training data, thus it does not accurately separate the two
classes. The second (Figure 5b), has an intermediate complexity and correctly classifies the
most part of the training examples. The last (Figure 5c), does not make errors, however, it may
not be able to correctly classify new (unseen) data due its high specificity.
Figure 5 – Three different classifiers trained with a data set with two classes
Source: adapted from Lorena and Carvalho (2007)
The Statistical Learning Theory (SLT) is a mathematical formulation of the general
concept of learning, as defined by Steinwart and Christmann (2008), it establishes mathematical

24
conditions that support the selection of a particular classifier from a set of training data. It is not
the aim of this research to go into details over SLT, for more information check Vapnik (2013).
In particular, SVM training involves the optimization of a quadratic convex function,
which main purpose is to find a hyperplane able to separate different data classes by maximizing
the distance between the hyperplane and the instances on both sides.
Figure 6 illustrates important concepts to define a linear classifier. Considering set of 𝑛
training examples 𝐷 = {(𝒙𝟏, 𝑦1), (𝒙𝟐, 𝑦2), … , (𝒙𝒏, 𝑦𝑛)}, each 𝑥𝑖 belongs to one of the two
classes, thus providing a label 𝑦𝑖 ∈ {−1,1}. It is assumed that there is a hyperplane able to
separate positive from negative instances. A hyperplane is defined by the set of 𝒙 that satisfies
𝒘𝑇𝒙 + 𝑏 = 0, these points are perpendicular to 𝒘 and pass through the origin. Where 𝒘 is the
weight vector and |𝑏|/‖𝑤‖ is the perpendicular distance from the hyperplane to the origin
(JIANG; CHEN, 2014; KOTSIANTIS; ZAHARAKIS; PINTELAS, 2006).
Figure 6 – Separation hyperplane for linearly separable data
Source: adapted from Lorena and Carvalho (2007)
The decision boundary of the classifier is the boundary between the two regions separated
by the hyperplane. To extend this idea to generate nonlinear decision boundaries, a nonlinear
function 𝜙 in used to map 𝒙 into a vector of feature space, 𝐹, of higher dimension. Thus, the
discriminant function in 𝐹 is defined as in Equation 2.3.1.
𝑓(𝒙) = 𝒘𝑇∅(𝒙) + 𝑏 (2.3.1)
However, the determination of the adequate mapping can be difficult. Moreover, the
increase of dimensionality may be computationally demanding. This problem is solved by
Kernel methods, which avoid the explicit mapping of the data to 𝐹. Firstly, assume that the
weight vector can be expressed by linear combination of the training examples (Equation 2.3.2),
where α is the dual representation of the decision boundary.

25
𝑤 = ∑ 𝛼𝑖𝑥𝑖𝑛𝑖=1 (2.3.2)
Then, considering the kernel function (Equation 2.3.3), which is defined in the input
space, the inner product in feature space is calculated directly through 𝑘(𝑥𝑖 , 𝑥𝑗) and, thus, it can
be efficiently computed.
𝑘(𝑥𝑖 , 𝑥𝑗) = ∅(𝑥𝑖)𝑇∅(𝑥𝑗) (2.3.3)
Finally, 𝑓 can be written in terms of the kernel function as
𝑓(𝒙) = ∑ 𝛼𝑖𝑘(𝑥𝑖, 𝑥𝑗) + 𝑏𝑛𝑖,𝑗=1 (2.3.4)
The maximum margin is determined by solving the dual Lagrangian problem formulated
as follows in Equations 2.3.7, subject to the constrains represented in Equations 2.3.5 and 2.3.7
(AL-YASEEN; OTHMAN; NAZRI, 2017):
𝑚𝑎𝑥 𝐿𝐷(𝛼) = ∑ 𝛼𝑖 −1
2∑ ∑ 𝛼𝑖
𝑛𝑗=1
𝑛𝑖=1
𝑛𝑖=1 𝛼𝑗𝑦𝑖𝑦𝑗𝑘(𝑥𝑖 , 𝑥𝑗) (2.3.5)
subject to
∑ 𝛼𝑖𝑦𝑖𝑛𝑖=1 = 0, (2.3.6)
0 ≤ 𝛼𝑖 ≤ 𝐶, ∀𝑖 (2.3.7)
where 𝛼 is the dual variable, 𝐶 is the soft margin parameter, 𝑛 is the number of training
instances, and ),( x jxik is the kernel function, responsible for separating the data’s instances
into different classes. The RBF (radial basis function) kernel is given as Equation 2.3.8:
𝑘(𝑥𝑖 , 𝑥𝑗) = 𝑒𝑥𝑝 [−𝛾(𝑥𝑖 − 𝑥𝑗)2
] (2.3.8)
where 𝛾 > 0 is the kernel parameter. According to Kotsiantis, Zaharakis, and Pintelas (2006),
the selection of the adequate kernel function and the tuning of its parameters are fundamental,
since they determine the feature space, where the training data instance will be classified.
To automatically classify the risks associated with an ADU two different SVM classifiers
were developed, SVC1 and SVC2. The input, 𝒙, contain useful information to characterize the
hazards. Indeed, each instance registered in the input vector contains the operational conditions,
besides features to characterize a hypothetical accidental scenario. Both SVC1 and SVC2, were
feed with the same input vector. While the output for SVC1, 𝑦1, is the likelihood rating, and for
SVC2, 𝑦2, is the consequence level. Then, the predictions were combined to provide the risk
classification according to a risk matrix (that is further described under Chapter 3).
26
2.4.2 Model Selection
It is widely known that the hyper-parameters, 𝐶 and 𝛾, represent a key factor to the SVM
performance (CHAPELLE, 2002). A common problem, considering these models, is that they
can present satisfactory results on training set, at the same time they might also not classify
unseen data correctly. The tuning of SVM hyper-parameters is known as model selection
problem, as Lins (2009) stated. Then, it is essential to select 𝐶 and 𝛾 meticulously.
The most common and reliable procedure is to perform an exhaustive GS (grid search)
over the entire search space. However, it can be unpractical and time consuming if there are
several parameters and/or possible combinations. To execute GS, it is necessary to select a finite
set of values for 𝐶 and 𝛾, considering the fact they are continuous. Next, an SVM is trained
with all pairs that resulted from the combination of both parameters and, then, GS returns the
set relative to the highest scores obtained during the validation (WITTEN et al., 2016).
Usually, CV (cross-validation) is used to estimate the performance of the model, aiming
to find the best approach appropriate for the available data. There are different methods to
achieve this purpose. For instance, k-fold CV consists in splitting the data into k equal parts
and, then, the training is proceeded on k-1 parts and the test is done in the part that is left out.
Next, this process is repeated alternating the testing portion until all k parts has been tested
(YADAV; SHUKLA, 2016). In this research, we applied a 10-fold-cross-validation method to
select the best pair of hyper-parameters for each SVC model. Next Chapter describes the details
of the proposed method.

27
3 METHODOLOGY
The aim of the classification model is to reduce the efforts made by the multidisciplinary
teams during the development of PHAs. To that end, a method based on the supervised machine
learning technique, SVM, has been developed by using information obtained through previous
PHAs.
Generally, during the elaboration of PHA, the potential risks are classified according to a
risk matrix based on ISO 31000 (2018) (Table 3) as moderate (M), tolerable (T) and non-
tolerable (NT). The risk category of a possible accident is determined by combining its
consequence level (Table 4) with its likelihood rating (Table 5), which respectively represent
the expected severity of the effects related to a respective scenario and the expected frequency
of occurrence of the causes of the accident.
Table 3 - Risk matrix used in the preliminary risk assessment
Risk Matrix
Consequence level Likelihood rating
A B C D
IV T M M NT
III T M M M
II T T T M
I T T T T Source: ISO 31000 (2018)
Table 4 - Description of the consequence level in terms of the effects to human life
Consequence level
Category Effects
I low without injuries or first aid cases
II significant serious injuries inside or mild injuries outside the facility
III high fatality inside or serious injuries outside the facility
IV very high multiple deaths inside or outside the facility Source: ISO 31000 (2018)
Table 5 - Description of the likelihood categories
Likelihood rating
Category Description
A very rare conceptually possible, but there are no records in the literature
B rare unlikely to occur in normal conditions
C possible may occur sometime
D likely expected to occur Source: ISO 31000 (2018)

28
Firstly, as depicts in Figure 7, information about the accidental scenarios, such as the
material released and operating conditions, are extracted from PHAs elaborated for an ADU of
an oil refinery and analyzed in order to define a set of input-output data, where each pair is
related to a potential accident. Then, this information is provided to two different SVM models
that are implemented to classify both the likelihood rating (SVC1) and the consequence level
(SVC2). Next, the categories are combined and the risk is classified as T, M or NT according
to Table 3. In this way, the proposed model represents a shorter path to perform risk assessment.
Thus, the SVM-based models are able to perform the classification of the risks associated to
potential accidents in a more efficient way.
Figure 7 - General view of the developed model
Source: This research (2018)
Next, Section 3.1 describes the process executed to collect information for the SVM
models construction. Then, Section 3.2 defines how these data are organized and provided as
input to the SVM. Finally, Section 3.3 explains the implementation of the SVM classifier to
assign the risk categories to the identified hazards.

29
3.1 DATA COLLETION
The SVM learning process requires a reasonable quantity of good quality input data to
comprehend the reasoning adopted to classify the risks during PHA by the multidisciplinary
group, composed by engineers and technicians from different fields. Thus, PHA documents of
an ADU of petroleum refinery were evaluated to extracted information to build the data set used
in this study. For example, Table 6 contains the description of potential accidents, associated to
the release of petroleum from a pipeline, which were taken into account by the experts during
PHA. The pipe is located on the exit of the desalters and a mass flow rate of 760,000 𝑘𝑔. ℎ−1
passes through it at 160°𝐶 and 5.0 𝑘𝑔𝑓. 𝑐𝑚−2 under normal conditions.
Small and large leakages were considered to occur and their causes were either human
failure, abnormal operating conditions or corrosion, where the former is expected to occur (D)
and the latter is very rare (A); see Table 5. In this case, each failure mode might lead to three
potential accidents (pool fire, flash fire or toxic vapor cloud), which have different impacts to
human life. For example, in these operating conditions, the severity of the consequences of a
pool fire caused by a small leakage was categorized as significant (II), while the ones associated
to a large leakage as high (III); see Table 4. Finally, the risk of these possible accidents were
respectively classified as M and T according to Table 3.
Table 6 - Example of PHA representing the data that is used to feed the SVM model
Subsystem Petroleum pipeline on the exit of the desalters
Operating
Conditions
Temperature Pressure Flow Rate
160 °𝐶 5.0 𝑘𝑔𝑓. 𝑐𝑚−2 760,000 𝑘𝑔. ℎ−1
Chemical
Product
Failure
Mode
Possible
Causes
Potential
Accidents
Likelihood
rating
Consequence
level to human
Risk
category
Petroleum Small
leakage
- Human failure
- Abnormal
operating
conditions
- Corrosion
Pool fire D II M
Flash fire D II M
Toxic vapor D I T
Large
leakage Pool fire A III T
Flash fire A IV T
Toxic vapor A IV T
Source: This research (2018)
Taking into account the given example, PHA allowed for extracting important
information related to the events of interest. Then, it is necessary to select which information

30
to use as the SVM model input variables. Next Section describes these variables and the
relations among them.
3.2 FEATURE SELECTION
In this study, four hypothetical accidental scenarios (AS) were considered: pool fire, flash
fire, vapor cloud explosion and toxic vapor cloud. For each one, there is a respective
combination of likelihood rating (LR) and consequence level (CL), which are dependent on
different variables, such as chemical materials and/or thermodynamic parameters. These
conditions are considered by the experts for classifying LR and CL, and for this reason, are also
included in the SVM models.
We have analyzed two initiating events (IE): 1) when a small amount of chemical product
leaks, e.g. through a hole in the pipeline, valves, etc., and, 2) the other IE contemplates
situations where a large quantity escapes, such as due to rupture of a pipeline. These
assumptions were represented by including in the input data a binary variable (IE), where 0
means small holes and 1 indicates ruptures. Thus, IE qualitatively represents the amount of the
material that escapes. This characteristic directly affects the surface area of the leaked product,
which in turn determines the rate of evaporation. The assessment of two different IE for the
same subsystem implies diverse accidental scenarios and, consequently, different risk classes.
For instance, when a material is released through a small hole, if the release rate is lower than
the rate of evaporation, it would not result in a pool fire.
The effects of an uncontrollable leakage depend on the nature of the material and its
physical state, determined by the operational conditions and the presence of adverse situations,
e.g. ignition sources and contaminants. In this context, it is important to have in mind the
influence of some variables, such as temperature (T), pressure (P) and mass flow rate (FR) on
the physical effects produced by major accidents. In fact, T and P play an important role to
determine if the chemical product (CP) is liquid or gaseous. Additionally, combined with FR,
they are necessary to determine the vaporizing rate and the pool area or vapor cloud (TNO,
2005; TNO, 2005b). Moreover, T and P determine the UFL and LFL values, which are
fundamental to characterize fires and explosions (TNO, 2005).
31
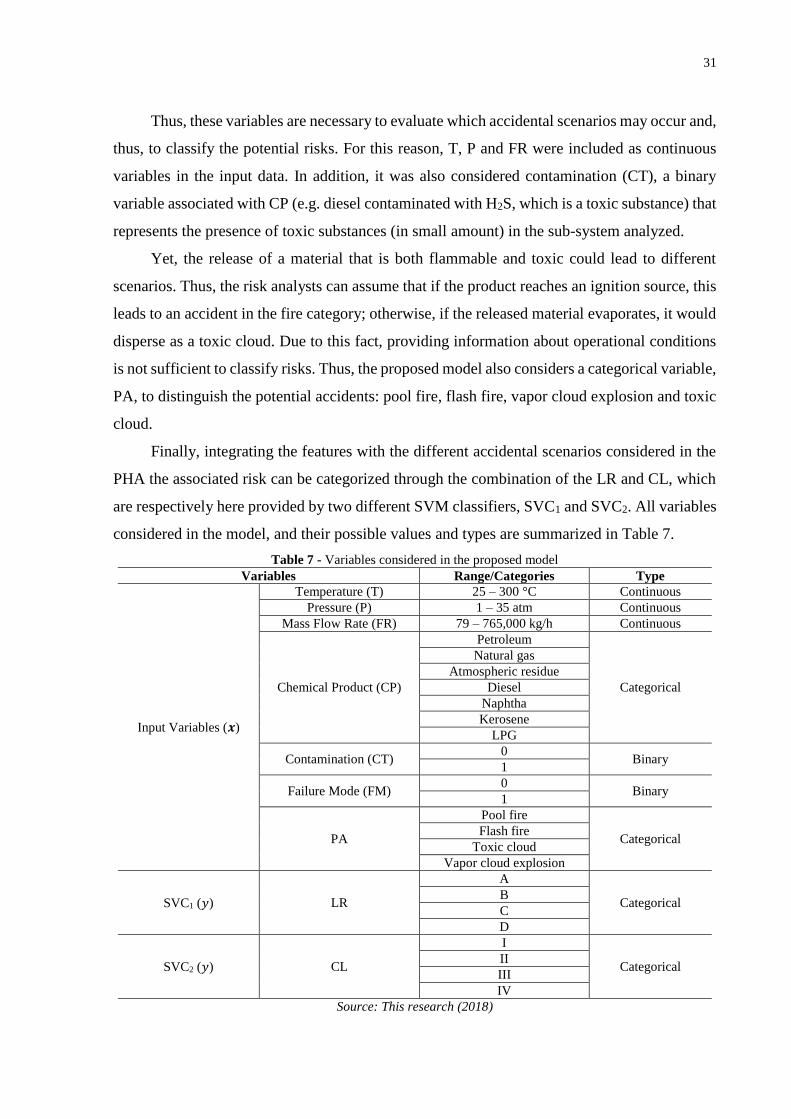
Thus, these variables are necessary to evaluate which accidental scenarios may occur and,
thus, to classify the potential risks. For this reason, T, P and FR were included as continuous
variables in the input data. In addition, it was also considered contamination (CT), a binary
variable associated with CP (e.g. diesel contaminated with H2S, which is a toxic substance) that
represents the presence of toxic substances (in small amount) in the sub-system analyzed.
Yet, the release of a material that is both flammable and toxic could lead to different
scenarios. Thus, the risk analysts can assume that if the product reaches an ignition source, this
leads to an accident in the fire category; otherwise, if the released material evaporates, it would
disperse as a toxic cloud. Due to this fact, providing information about operational conditions
is not sufficient to classify risks. Thus, the proposed model also considers a categorical variable,
PA, to distinguish the potential accidents: pool fire, flash fire, vapor cloud explosion and toxic
cloud.
Finally, integrating the features with the different accidental scenarios considered in the
PHA the associated risk can be categorized through the combination of the LR and CL, which
are respectively here provided by two different SVM classifiers, SVC1 and SVC2. All variables
considered in the model, and their possible values and types are summarized in Table 7.
Table 7 - Variables considered in the proposed model
Variables Range/Categories Type
Input Variables (𝒙)
Temperature (T) 25 – 300 °C Continuous
Pressure (P) 1 – 35 atm Continuous
Mass Flow Rate (FR) 79 – 765,000 kg/h Continuous
Chemical Product (CP)
Petroleum
Categorical
Natural gas
Atmospheric residue
Diesel
Naphtha
Kerosene
LPG
Contamination (CT) 0
Binary 1
Failure Mode (FM) 0
Binary 1
PA
Pool fire
Categorical Flash fire
Toxic cloud
Vapor cloud explosion
SVC1 (𝑦) LR
A
Categorical B
C
D
SVC2 (𝑦) CL
I
Categorical II
III
IV
Source: This research (2018)

32
3.3 MODELING PROCESS
For the implementation of both SVCs, a free machine learning library, scikit-learn
(PEDREGOSA et al., 2011), was adopted. Both SVC1 and SVC2 take the same 7-order vector
as input 𝒙 and return 𝑦 (either LR for SVC1 or CL for SVC2) as output. Both 𝒙 and 𝑦 are 𝑛-
sized, where 𝑛 represents the number of training samples. Then, the information extracted from
previous PHA was used to train both classifiers, and an example of how these data were
structured to feed the models is presented in Table 8, which shows the codification of the PHA
contained in Table 6.
Table 8 - An example of the data provided to the model
Input Output
CP CT T P FR IE AS SVC1 SVC2
LR CL
1 0 0.30569 0.170787 1 0 1 D II
1 0 0.30569 0.170787 1 0 2 D II
1 0 0.30569 0.170787 1 0 3 D I
1 0 0.30569 0.170787 1 1 1 A III
1 0 0.30569 0.170787 1 1 2 A IV
1 0 0.30569 0.170787 1 1 3 A IV Source: This research (2018)
The SVM functions require that categorical variables are transformed into dummies. To
that end, CP and AS were respectively converted to 5 and 3 dummy variables, where the
resulting number of dummies is related to the number of categories of each variable minus 1.
Notice that we have normalized the real-valued variables T and P.
RBF was adopted as the non-linear SVM kernel. Next, a 10-fold cross-validation was
performed to select the hyper-parameters of the SVM models. The idea is to partition the data
in order to train the model with one portion of the data and, then, test the model on the remaining
part of the data set. In the 10-fold cross-validation, the data is equally divided into 10 parts,
where 9 are used for training and 1 for validation purposes. Then, this process is executed 10
times, changing the validation portion, until all data has been used (YADAV; SHUKLA, 2016).
Thus, the metrics provided by this method are the averages of the values over 10 runs
and the hyper-parameters that lead to the highest mean score were selected. In this work, the
performance of the model on the test set was evaluated through the F1 score (Equation 3.3.1),
which is the harmonic average between two other measures (precision and recall), calculated,

33
respectively, by Equations 3.3.2, that take into account false negative rate, and Equations 3.3.3,
that consider the false (see FLACH; KULL, 2015):
𝐹1 = 2 × {(𝑃𝑟𝑒𝑐𝑖𝑠𝑖𝑜𝑛 × 𝑅𝑒𝑐𝑎𝑙𝑙)/(𝑃𝑟𝑒𝑐𝑖𝑠𝑖𝑜𝑛 + 𝑅𝑒𝑐𝑎𝑙𝑙)} (3.3.1)
𝑃𝑟𝑒𝑐𝑖𝑠𝑖𝑜𝑛 = 𝐶𝐶𝑗
𝑃𝑗, ∀𝑗 (3.3.2)
𝑅𝑒𝑐𝑎𝑙𝑙 = 𝐶𝐶𝑗
𝑂𝑗, ∀𝑗 (3.3.3)
where 𝐶𝐶𝑗, 𝑃𝑗 and 𝑂𝑗 are the number of correct classifications, the total number of predictions
and the number of observed instances with label 𝑗 respectively.
Thus, the F1 score represents how precise and robust the model is (Pedregosa et al., 2011).
by measuring both how many instances are correctly classified and how many classifications
the model does not miss. The accuracy, Equation 3.3.4, which represents the percentage of
correct classification, was also used to compare the results obtained during the training and test
in order to detect possible overfitting.
𝐴𝑐𝑐𝑢𝑟𝑎𝑐𝑦 = ∑ 𝐶𝐶𝑗
∑ 𝑂𝑗× 100, ∀𝑗 (3.3.4)
After the selection of the hyper-parameters, 80% of the samples were used for learning
purposes, while the rest was adopted for testing evaluation. Then, the trained SVC functions
were used to give the risk label for the remaining samples. This classification is performed by
both methods, SVC1 and SVC2, and thus the risk label is obtained through the risk matrix given
in Table 3. The results are discussed in next Chapter.

34
4 RESULTS AND DISCUSSION
Firstly, we divided ADU into subsystems, which are characterized by different chemical
products and operating conditions and, thus, they might lead to different accidental scenarios.
Each sample extracted from previous PHA is composed by a pair input-output that represents
an accidental scenario with respective LR and CL. Then, a data set composed of 151 samples
was provided to the model, and it is presented in Appendix A. To achieve a good performance,
SVM hyper-parameters 𝐶 and 𝛿 were obtained by adopting a 10-fold cross-validation and using
80% of the data set (PEDREGOSA et al., 2011).
Tables 9 and 10 present F1 scores achieved by SVC1 and SVC2 with different pairs of 𝐶
and 𝛿. Other values were also tested, but we here present only some of them for sake of
illustration. Then, we selected the hyper-parameters that yield the best results (the highest F1
score), which are highlighted in the tables.
Table 9 - Mean F1 score achieved by SVC1
𝐶
𝛿
100 1,000 10,000 100,000
0.1 0.720 0.720 0.720 0.720
0.01 0.843 0.785 0.785 0.785
0.001 0.755 0.808 0.867 0.805
0.0001 0.735 0.780 0.808 0.794 Source: This research (2018)
Table 10 - Mean F1 score achieved by SVC2
𝐶
𝛿
100 1,000 10,000 100,000
0.1 0.688 0.679 0.679 0.653
0.01 0.679 0.691 0.680 0.666
0.001 0.610 0.588 0.689 0.700
0.0001 0.570 0.610 0.638 0.605 Source: This research (2018)
For SVC1 the test predictions were obtained with an accuracy of 83.87%, while the
training accuracy was 96.67%. As expected, the training score was higher, but the results for
testing are still considered satisfactory. The performance of the SVC1 on test data was evaluated
trough F1 score, precision and recall, the results are presented in Table 11. Note that the average
F1 score was influenced by the lower recall for categories A and D, and the lower precision to
predict C. Despite that, the model presented better scores to predict B, which alone made up

35
42.38% of all instances. Thus, as expected, the higher number of samples provided to the model
clearly benefited the learning process of that respective category.
Table 11 - Classification report for SVC1
Number of Observations Precision
(%)
Recall
(%)
F1 score
(%) Training Set Test Set
A 15 7 100.00 71.43 83.33
B 54 10 83.33 100.00 90.91
C 20 7 70.00 100.00 82.36
D 31 7 100.00 57.14 72.72
Total/Average 120 31 88.33 82.14 82.33 Source: This research (2018)
Figure 8 shows the SVC1 confusion matrix for prediction of test samples, where the rows
and columns indicate the actual and predicted likelihood categories respectively. Then, the
number of correct predictions is shown in the main diagonal. It is clear that SVC1 have made
mistakes between classes A and B, and between C and D, which is acceptable considering the
subtle difference of meaning of these categories (Table 5), that makes it difficult even in
traditional evaluation to make a distinction between these classes. Despite that, the model did
not classify very rare/rare scenarios as possible/likely and vice versa.
Figure 8 - Confusion matrix relative to SVC1 for test samples prediction
Source: This research (2018)
36
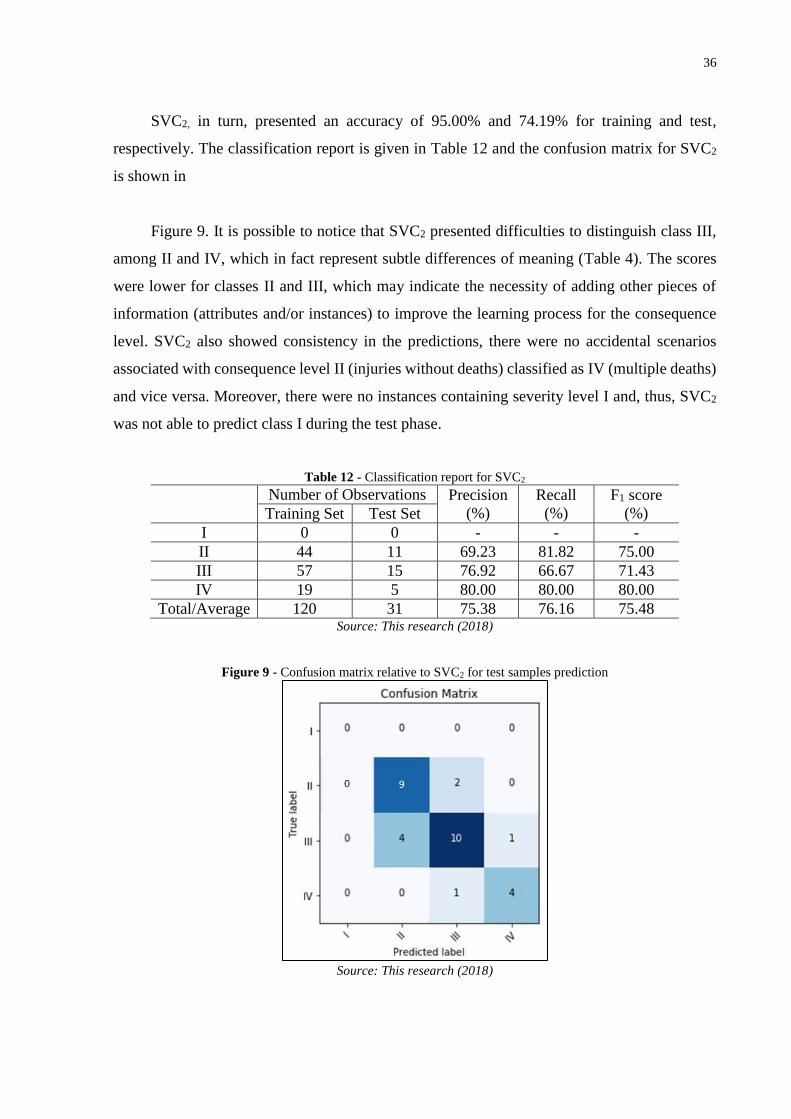
SVC2, in turn, presented an accuracy of 95.00% and 74.19% for training and test,
respectively. The classification report is given in Table 12 and the confusion matrix for SVC2
is shown in
Figure 9. It is possible to notice that SVC2 presented difficulties to distinguish class III,
among II and IV, which in fact represent subtle differences of meaning (Table 4). The scores
were lower for classes II and III, which may indicate the necessity of adding other pieces of
information (attributes and/or instances) to improve the learning process for the consequence
level. SVC2 also showed consistency in the predictions, there were no accidental scenarios
associated with consequence level II (injuries without deaths) classified as IV (multiple deaths)
and vice versa. Moreover, there were no instances containing severity level I and, thus, SVC2
was not able to predict class I during the test phase.
Table 12 - Classification report for SVC2
Number of Observations Precision
(%)
Recall
(%)
F1 score
(%) Training Set Test Set
I 0 0 - - -
II 44 11 69.23 81.82 75.00
III 57 15 76.92 66.67 71.43
IV 19 5 80.00 80.00 80.00
Total/Average 120 31 75.38 76.16 75.48 Source: This research (2018)
Figure 9 - Confusion matrix relative to SVC2 for test samples prediction
Source: This research (2018)

37
Finally, the combination of the outputs of SVC1 and SVC2 provided the risk label
following the rules presented in Table 3. Then, Table 13 shows the predictions achieved through
this method as compared with the actual risk labels for the test data. The estimated F1 scores
were 88.00% for T and 91.9% for M. Given that, a mean F1 score of 89.95% was obtained.
There were neither training nor test instances containing the risk label NT and expectedly the
model never classified risks as NT, which yields a precision of 100% for this class, once the
combination of the predictions obtained with SVC1 and SVC2 could lead to this class label. The
values for precision and recall are also reported in Table 13.
Table 13 - Test scores of the method using SVC1 and SVC2 to classify risk categories
Label Observed
Risk Labels Predictions
Correct
Predictions
Precision
(%)
Recall
(%)
F1 score
(%)
T 11 14 11 78.57 100.00 88.00
M 20 17 17 100.00 85.00 91.90
NT 0 0 0 100.00 - -
Total/Average 31 31 28 92.86 92.50 89.95 Source: This research (2018)
We also considered a third model, SVC3, which aims at directly predicting the risk label
instead of using SVC1 and SVC2 for the intermediate evaluation of likelihood and
consequences. In other words, the output vector, 𝑦, for SVC3 is the risk label, while 𝒙 is the
same as that of SVC1 and SVC2. The hyper-parameters, 𝐶 and 𝛿, were selected with the same
procedure as SVC1 and SVC2, and the values adopted were 1,000 and 0.1 respectively. The
results are shown in Table 14. The F1 score relative to each risk label was 80% for T and 90.47%
for M.
Table 14 - Accuracy of the method using SVC3 to classify the risk labels
Label Observed
Risk Labels Predictions
Correct
Predictions
Precision
(%)
Recall
(%)
F1 score
(%)
T 11 9 8 88.89 71.73 80.00
M 20 22 19 86.36 95.00 90.47
NT 0 0 0 - - -
Total/Average 31 31 25 87.62 83.36 85.23 Source: This research (2018)
The mean F1 score of SVC3 was 85.23%, which is lower than the results obtained by using
both SVC1 and SVC2. This performance decrease indicates that SVC3 model is not fed with
enough information to learn the subtleties of the risk evaluation and, thus, the prediction of
likelihood and severity categories through SVC1 and SVC2 are essential. Moreover, apart from

38
the lower precision and recall to classify some categories through SVC1 and SVC2, the joint
model replicates, with satisfactory scores, the same reasoning executed during PHAs by the risk
experts, who postulate the likelihood and consequence categories, and not directly the risk
category as SVC3 does.

39
5 CONCLUSIONS
Risk studies are fundamental and, thus, required to prevent catastrophic accidents and
avoid economic losses and fatalities that could result from their occurrence. However, it is a
rather resource-expensive and time-consuming activity that requires multidisciplinary expertise
and the application of different tools and methodologies. In this context, there are different AI
techniques that could be allied to these objectives and would help to create a solution to perform
effectively the assessment.
In this research, we have developed an SVM model based on data related to hypothetical
accidents postulated in previous PRA. ML methods can, thus, learn the attributes of potential
accidental scenarios of an industrial system for performing a risk assessment, with reduced
efforts. However, we emphasize that the utilization of these methods can never completely
replace the reasoning of risk experts, since it will always be necessary to analyze and review
the results obtained by the automated approaches. Indeed, the idea is that the ML models can
be a practical tool to support risk analysts, providing a starting point for more elaborated studies.
Information on the process, such as the operational conditions and chemical products,
were considered as inputs to characterize the potential accident scenarios. The selected features
allowed for feeding the SVM model with knowledge about the identified hazards, and then
evaluate their consequences and likelihood, providing as output the classification of the risk as
tolerable, moderate or non-tolerable. In further studies different ML models can be applied in
order to compare with the performance obtained with the proposed model.
The approach was applied for the automated classification of the potential accidental
scenarios of a complex industrial system, known as ADU, where different hazardous chemical
products are manipulated and processed. In the application, we combined two SVM models to
classify likelihood and severity categories, and then map them into risk labels, according to a
risk matrix rule.
The information was extracted manually and exclusively from PRA related to a particular
ADU, but different documents can be analyzed to provide additional information to the SVM,
increasing the dimension of the data set. Moreover, the addition of information related to
different processing units may be useful to generalize the proposed method for the whole oil
refinery. In this situation, deep learning methods could be applied to avoid manual feature

40
extraction, allowing computer to automatically build complex features (GOODFELLOW,
2016). Thus, the learning process can be improved in further studies.
To conclude, ML methods can, thus, learn the attributes of potential accidental scenarios
related to an industrial system for performing a risk assessment, with reduced efforts. However,
we emphasize that the utilization of these methods can never completely replace the reasoning
of risk experts, since it will always be necessary to analyze and review the results obtained by
the automated approaches. Indeed, the idea is that the ML models can be a practical tool to
support risk analysts, providing a starting point for more elaborated studies.

41
REFERENCES
ADEDIGBA, Sunday A.; KHAN, Faisal; YANG, Ming. Dynamic failure analysis of process
systems using principal component analysis and Bayesian network. Industrial & Engineering
Chemistry Research, v. 56, n. 8, p. 2094-2106, 2017.
ALE, Ben. Risk analysis and big data. In: Safety and Reliability. Taylor & Francis, 2016. p.
153-165.
AL‐MUSLIM, Husain; DINCER, Ibrahim. Thermodynamic analysis of crude oil distillation
systems. International Journal of Energy Research, v. 29, n. 7, p. 637-655, 2005.
AL-YASEEN, Wathiq Laftah; OTHMAN, Zulaiha Ali; NAZRI, Mohd Zakree Ahmad. Multi-
level hybrid support vector machine and extreme learning machine based on modified K-means
for intrusion detection system. Expert Systems with Applications, v. 67, p. 296-303, 2017.
AMYOTTE, Paul R. et al. Why major accidents are still occurring. Current Opinion in
Chemical Engineering, v. 14, p. 1-8, 2016.
AMUNDRUD, Øystein; AVEN, Terje. On how to understand and acknowledge risk.
Reliability Engineering & System Safety, v. 142, p. 42-47, 2015.
AVEN, Terje. Foundations of risk analysis. John Wiley & Sons, 2012.
BENEKOS, I.; DIAMANTIDIS, D. On risk assessment and risk acceptance of dangerous goods
transportation through road tunnels in Greece. Safety science, v. 91, p. 1-10, 2017.
CAMERON, Ian et al. Process hazard analysis, hazard identification and scenario definition:
Are the conventional tools sufficient, or should and can we do much better? Process Safety
and Environmental Protection, v. 110, p. 53-70, 2017.
CARRASQUILLA, Juan; MELKO, Roger G. Machine learning phases of matter. Nature
Physics, v. 13, n. 5, p. 431, 2017.
CASAL, Joaquim. Evaluation of the effects and consequences of major accidents in
industrial plants. Elsevier, 2017.
CCPS – Center for Chemical Process Safety. Guidelines for Hazard Evaluation Procedures.
2. ed. New Jersey, USA: John Wiley & Sons, 1992.
CCPS – Center for Chemical Process Safety. Basic Principles of Vapor Cloud Explosions. In:
Guidelines for Evaluating the Characteristics of Vapor Cloud Explosions, Flash Fires,
and BLEVEs. Hoboken, New Jersey, USA: AIChE. John Wiley & Sons, 2010. p. 69-145.
CCPS – Center for Chemical Process Safety. Basic Principles of Flash Fires. In: Guidelines
for Evaluating the Characteristics of Vapor Cloud Explosions, Flash Fires, and BLEVEs. Hoboken, New Jersey, USA: John Wiley & Sons, 2010. p. 147-156.

42
CHAPELLE, O. et al. Choosing multiple parameters for support vector machines. Machine
learning, v. 46, n. 1-3, p. 131-159, 2002.
COX, L. What’s wrong with Hazard-Raking Systems? An Expository Note. Risk Analysis, v.
29, n. 7, p. 933-1057, 2009.
COSTA, Pierre. O MAIOR ACIDENTE DA REFINARIA DUQUE DE CAXIAS (RJ)-
BRASIL: UM ESTUDO GEOGRÁRICO-HISTÓRICO. Revista Geográfica de América
Central, v. 2, p. 1-11, 2011.
DEMIRBAS, Ayhan; BAMUFLEH, Hisham S. Optimization of crude oil refining products to
valuable fuel blends. Petroleum Science and Technology, v. 35, n. 4, p. 406-412, 2017.
DOBASHI, Ritsu. Studies on accidental gas and dust explosions. Fire Safety Journal, v. 91,
p. 21-27, 2017.
FAHIM, Mohammed A.; AL-SAHHAF, Taher A.; ELKILANI, Amal S. Introdução ao refino
de petróleo. Editora Campus: São Paulo, 2012.
FLACH, Peter; KULL, Meelis. Precision-recall-gain curves: PR analysis done right. In:
Advances in Neural Information Processing Systems. 2015. p. 838-846.
GEORGIADOU, Paraskevi S. et al. Multi-objective evolutionary emergency response
optimization for major accidents. Journal of Hazardous Materials, v. 178, n. 1-3, p. 792-803,
2010.
GOODFELLOW, Ian; BENGIO, Yoshua; COURVILLE, Aaron. Deep learning. MIT press,
2016.
GUENTHER, Nick; SCHONLAU, Matthias. Support vector machines. The Stata Journal, v.
16, n. 4, p. 917-937, 2016.
HAIMES, Yacov. Risk modeling, assessment, and management. John Wiley & Sons, 2015.
HAUPTMANNS, Ulrich. Hazardous Properties of Materials. In: Process and Plant Safety.
Berlin, Springer Vieweg, 2015. p. 11-67.
HARBAWI, Mohanad. et al. Rapid analysis of risk assessment using developed simulation of
chemical industrial accidents software package. International Journal of Environmental
Science & Technology, v. 5, n. 1, p. 53-64, 2008.
HU, Xinsheng et al. Land‐use planning risk estimates for a chemical industrial park in China –A longitudinal study. Process Safety Progress, v. 37, n. 2, p. 124-133, 2018.
HUANG, Guang-Bin et al. Extreme learning machine for regression and multiclass
classification. IEEE Transactions on Systems, Man, and Cybernetics, Part B
(Cybernetics), v. 42, n. 2, p. 513-529, 2012.

43
HÜSER, T.; STARK, A. Explosion at Bayernoil Refinery in Bavaria. Process Worldwide,
Germany, 9 Apr. 2018. Available at: <https://www.process-worldwide.com/explosion-at-
bayernoil-refinery-in-bavaria-a-750131>. Accessed at: 17 Oct. 2018.
IFELEBUEGU, Augustine O. et al. The application of Bayesian–Layer of Protection Analysis
method for risk assessment of critical subsea gas compression systems. Process Safety and
Environmental Protection, v. 113, p. 305-318, 2018.
ISO 31000: 2018 - Risk management — Principles and Guidelines.
LINS, Isis Didier. Support vector machines and particle swarm optimization applied to
reliability prediction. 2009.
LINS, Isis Didier et al. Prediction of sea surface temperature in the tropical Atlantic by support
vector machines. Computational Statistics & Data Analysis, v. 61, p. 187-198, 2013.
LI, Xiuquan; ZHANG, Tao. An exploration on artificial intelligence application: From security,
privacy and ethic perspective. In: 2017 IEEE 2nd International Conference on Cloud
Computing and Big Data Analysis (ICCCBDA). IEEE, 2017. p. 416-420.
LIU, Ruonan et al. Artificial intelligence for fault diagnosis of rotating machinery: A review.
Mechanical Systems and Signal Processing, v. 108, p. 33-47, 2018.
LORENA, Ana Carolina; DE CARVALHO, André CPLF. Uma introdução às support vector
machines. Revista de Informática Teórica e Aplicada, v. 14, n. 2, p. 43-67, 2007.
LUSCHEK, Matthew. Fire Erupts at Richmond California Refinery. NBC, Los Angeles, 6 Aug.
2012. Available at: <www.nbclosangeles.com/news/local/Fire-Erupts-at-Richmond-Refinery-
165216686.html>. Accessed at: 17 Oct. 2018.
LAVASANI, Miri et al. Fuzzy risk assessment of oil and gas offshore wells. Process Safety
and Environmental Protection, v. 89, n. 5, p. 277-294, 2011.
MAIOR, Caio et al. Personal protective equipment detection in industrial facilities using camera
video streaming. In: Safety and Reliability–Safe Societies in a Changing World. CRC Press,
2018. p. 2863-2868.
MAIOR, Caio et al. SVM Classification for Drowsiness Detection Using Eye Aspect Ratio. In:
Congresso da Associação Brasileira de Análise de Risco, Segurança de Processos e
Confiabilidade - ABRISCO, 2017, Rio de Janeiro. Anais do Congresso Abrisco, 2017.
KHAN, Faisal.; HASHEMI, Seyed. Introduction. In: Methods in Chemical Process Safety.
Elsevier, 2017. v. 1, cap 1, p.1-3.
KHAKZAD, Nima; KHAN, Faisal; PALTRINIERI, Nicola. On the application of near accident
data to risk analysis of major accidents. Reliability Engineering & System Safety, v. 126, p.
116-125, 2014.

44
KINSARA, Rami A.; DEMIRBAS, Ayhan. Upgrading of crude oil via distillation processes.
Petroleum Science and Technology, v. 34, n. 14, p. 1300-1306, 2016.
KOTSIANTIS, Sotiris B.; ZAHARAKIS, Ioannis D.; PINTELAS, Panayiotis E. Machine
learning: a review of classification and combining techniques. Artificial Intelligence Review,
v. 26, n. 3, p. 159-190, 2006.
KUMAR, Leo. State of the art-intense review on artificial intelligence systems application in
process planning and manufacturing. Engineering Applications of Artificial Intelligence, v.
65, p. 294-329, 2017.
JIANG, Fan; CHEN, Junfei. A hybrid support vector machines and two-dimensional risk matrix
model for supply chain risk assessment. Research Journal of Applied Sciences, Engineering
and Technology, v. 7, n. 11, p. 2193-2199, 2014.
JORDAN, Michael I.; MITCHELL, Tom M. Machine learning: Trends, perspectives, and
prospects. Science, v. 349, n. 6245, p. 255-260, 2015.
MALEWITZ, Jim et al. A Deadly Industry. EHS Today, 31 Mar. 2015. Available at:
<www.ehstoday.com/safety/deadly-industry>. Accessed at: 17 Oct. 2018.
MANNAN, Sam et al. The evolution of process safety: current status and future direction.
Annual review of chemical and biomolecular engineering, v. 7, p. 135-162, 2016.
MARKOWSKI, Adam S.; MANNAN, M. Sam. Fuzzy risk matrix. Journal of hazardous
materials, v. 159, n. 1, p. 152-157, 2008.
MARKOWSKI, Adam S.; MANNAN, M. Sam. Fuzzy risk matrix. Journal of hazardous
materials, v. 159, n. 1, p. 152-157, 2008.
MURAKAMI, Michio. Risk analysis as regulatory science: Toward the establishment of
standards. Radiation protection dosimetry, v. 171, n. 1, p. 156-162, 2016.
MARHAVILAS, Pan-K.; KOULOURIOTIS, D.; GEMENI, V. Risk analysis and assessment
methodologies in the work sites: On a review, classification and comparative study of the
scientific literature of the period 2000–2009. Journal of Loss Prevention in the Process
Industries, v. 24, n. 5, p. 477-523, 2011.
OSUOLALE, Funmilayo N.; ZHANG, Jie. Thermodynamic optimization of atmospheric
distillation unit. Computers & Chemical Engineering, v. 103, p. 201-209, 2017.
PANG, Bo; LEE, Lillian; VAITHYANATHAN, Shivakumar. Thumbs up?: sentiment
classification using machine learning techniques. In: Proceedings of the ACL-02 conference
on Empirical methods in natural language processing-Volume 10. Association for
Computational Linguistics, 2002. p. 79-86.
PASMAN, H. J. et al. Is risk analysis a useful tool for improving process safety? Journal of
Loss Prevention in the Process Industries, v. 22, n. 6, p. 769-777, 2009.
45
PEDREGOSA, Fabian et al. Scikit-learn: Machine learning in Python. Journal of machine
learning research, v. 12, n. Oct, p. 2825-2830, 2011.
PORTUGAL, Ivens; ALENCAR, Paulo; COWAN, Donald. The use of machine learning
algorithms in recommender systems: A systematic review. Expert Systems with Applications,
v. 97, p. 205-227, 2018.
PORTO, Marcelo Firpo de Souza. A tragédia da mineração e do desenvolvimento no Brasil:
desafios para a saúde coletiva. Cadernos de Saúde Pública, v. 32, p. e00211015, 2016.
SILVA, Joaquim F.; JACINTO, Celeste. Finding occupational accident patterns in the
extractive industry using a systematic data mining approach. Reliability Engineering &
System Safety, v. 108, p. 108-122, 2012.
SILVA, Maisa Mendonça et al. A multidimensional approach to information security risk
management using FMEA and fuzzy theory. International Journal of Information
Management, v. 34, n. 6, p. 733-740, 2014.
SINGH, Dinesh; ROY, Debaditya; MOHAN, C. Krishna. Dip-svm: distribution preserving
kernel support vector machine for big data. IEEE Transactions on Big Data, v. 3, n. 1, p. 79-
90, 2017.
SPEIGHT, James G. Handbook of petroleum product analysis. John Wiley & Sons, 2015.
SRINIVASAN, Rajagopalan; VENKATASUBRAMANIAN, Venkat. Multi-perspective
models for process hazards analysis of large scale chemical processes. Computers & chemical
engineering, v. 22, p. S961-S964, 1998.
STEINWART, Ingo; CHRISTMANN, Andreas. Support vector machines. Springer Science
& Business Media, 2008.
SUOKAS, J.; HEINO, P.; KARVONEN, I. Expert systems in safety management. Journal of
occupational accidents, v. 12, n. 1-3, p. 63-78, 1990.
SZKLO, ALEXANDRE; ULLER, Victor Cohen; BONFÁ, M. H. P. Fundamentos do refino de
petróleo: tecnologia e economia. Rio de Janeiro: interciência, v. 200, 2008.
TAN, Kim Hua; ORTIZ-GALLARDO, Victor G.; PERRONS, Robert K. Using Big Data to
manage safety-related risk in the upstream oil & gas industry: A research agenda. Energy
Exploration & Exploitation, v. 34, n. 2, p. 282-289, 2016.
TNO – THE NETHERLANDS ORGANISATION. Purple Book - Guideline for quantitative
risk assessment. 3 ed. The Hague, Committee for Prevention of Disasters, 2005.
TNO – THE NETHERLANDS ORGANISATION. Yellow Book – Methods for the
calculation of physical effects. 3. ed. The Hague, Committee for Prevention of Disasters, 2005.
VAPNIK, Vladimir N. An overview of statistical learning theory. IEEE transactions on
neural networks, v. 10, n. 5, p. 988-999, 1999.

46
VAPNIK, Vladimir. The nature of statistical learning theory. Springer science & business
media, 2013.
VAPNIK, Vladimir; IZMAILOV, Rauf. Knowledge transfer in SVM and neural networks.
Annals of Mathematics and Artificial Intelligence, v. 81, n. 1-2, p. 3-19, 2017.
VISWANATHAN, S.; SHAH, N.; VENKATASUBRAMANIAN, V. Hybrid framework for
hazard identification and assessment in batch processes. AIChE journal, v. 48, n. 8, p. 1765-
1774, 2002.
WAHEED, M. A. et al. Thermoeconomic and environmental assessment of a crude oil
distillation unit of a Nigerian refinery. Applied Thermal Engineering, v. 66, n. 1-2, p. 191-
205, 2014.
WAHEED, M.; ONI, A. Performance improvement of a crude oil distillation unit. Applied
Thermal Engineering, v. 75, p. 315-324, 2015.
WEBER, Philippe et al. Overview on Bayesian networks applications for dependability, risk
analysis and maintenance areas. Engineering Applications of Artificial Intelligence, v. 25, n.
4, p. 671-682, 2012.
WILLIS, Henry H. Guiding resource allocations based on terrorism risk. Risk Analysis: An
International Journal, v. 27, n. 3, p. 597-606, 2007.
WITTEN, Ian H. et al. Data Mining: Practical machine learning tools and techniques.
Morgan Kaufmann, 2016.
YADAV, Sanjay; SHUKLA, Sanyam. Analysis of k-fold cross-validation over hold-out
validation on colossal datasets for quality classification. In: 2016 IEEE 6th International
Conference on Advanced Computing (IACC). IEEE, 2016. p. 78-83.
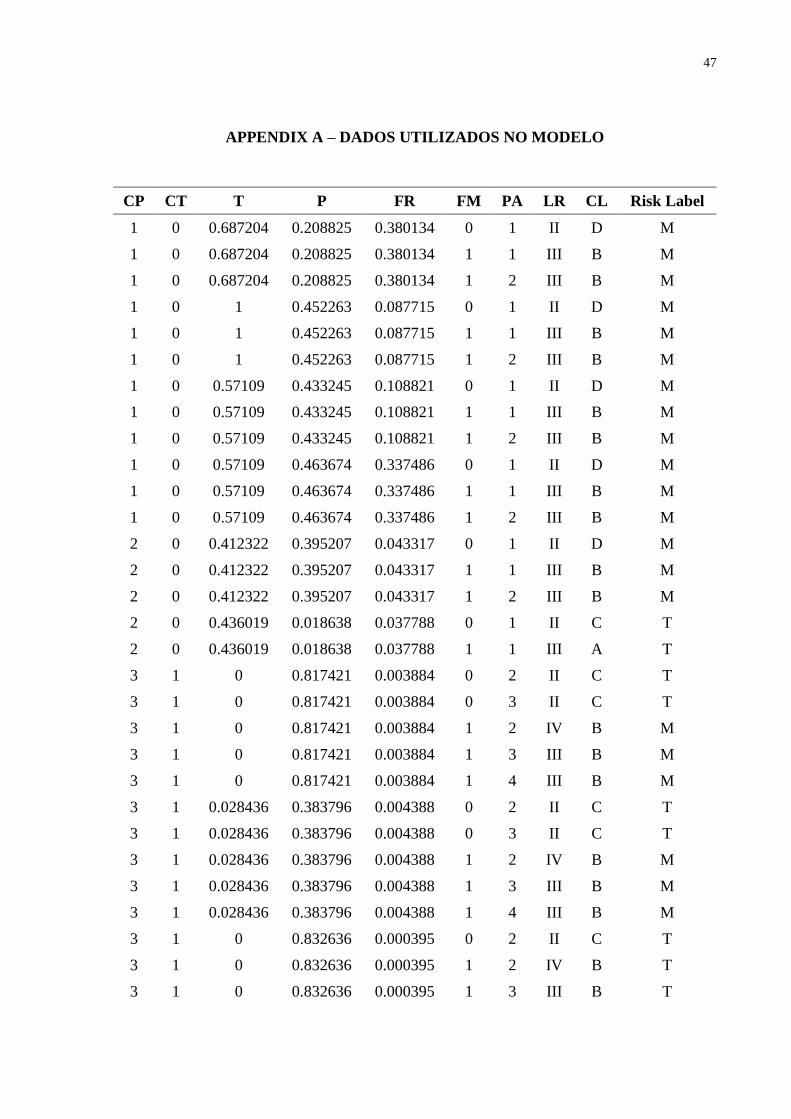
47
APPENDIX A – DADOS UTILIZADOS NO MODELO
CP CT T P FR FM PA LR CL Risk Label
1 0 0.687204 0.208825 0.380134 0 1 II D M
1 0 0.687204 0.208825 0.380134 1 1 III B M
1 0 0.687204 0.208825 0.380134 1 2 III B M
1 0 1 0.452263 0.087715 0 1 II D M
1 0 1 0.452263 0.087715 1 1 III B M
1 0 1 0.452263 0.087715 1 2 III B M
1 0 0.57109 0.433245 0.108821 0 1 II D M
1 0 0.57109 0.433245 0.108821 1 1 III B M
1 0 0.57109 0.433245 0.108821 1 2 III B M
1 0 0.57109 0.463674 0.337486 0 1 II D M
1 0 0.57109 0.463674 0.337486 1 1 III B M
1 0 0.57109 0.463674 0.337486 1 2 III B M
2 0 0.412322 0.395207 0.043317 0 1 II D M
2 0 0.412322 0.395207 0.043317 1 1 III B M
2 0 0.412322 0.395207 0.043317 1 2 III B M
2 0 0.436019 0.018638 0.037788 0 1 II C T
2 0 0.436019 0.018638 0.037788 1 1 III A T
3 1 0 0.817421 0.003884 0 2 II C T
3 1 0 0.817421 0.003884 0 3 II C T
3 1 0 0.817421 0.003884 1 2 IV B M
3 1 0 0.817421 0.003884 1 3 III B M
3 1 0 0.817421 0.003884 1 4 III B M
3 1 0.028436 0.383796 0.004388 0 2 II C T
3 1 0.028436 0.383796 0.004388 0 3 II C T
3 1 0.028436 0.383796 0.004388 1 2 IV B M
3 1 0.028436 0.383796 0.004388 1 3 III B M
3 1 0.028436 0.383796 0.004388 1 4 III B M
3 1 0 0.832636 0.000395 0 2 II C T
3 1 0 0.832636 0.000395 1 2 IV B T
3 1 0 0.832636 0.000395 1 3 III B T

48
CP CT T P FR FM PA LR CL Risk Label
3 1 0 0.832636 0.000395 1 4 III B M
4 0 0.331754 0.303918 0.605058 0 1 II D M
4 0 0.331754 0.303918 0.605058 0 2 II D M
4 0 0.331754 0.303918 0.605058 1 1 III B M
4 0 0.331754 0.303918 0.605058 1 2 III B M
4 0 0.331754 0.303918 0.605058 1 4 IV B M
4 1 0.28673 0.011031 0.1709 0 2 III C M
4 1 0.28673 0.011031 0.1709 0 3 III C M
4 1 0.28673 0.011031 0.1709 1 3 IV B M
4 1 0.28673 0.011031 0.1709 1 2 III B M
4 1 0.28673 0.011031 0.1709 1 4 III B M
4 1 0.182464 0.231647 0.074088 0 2 II D M
4 1 0.182464 0.231647 0.07409 0 3 II D M
4 1 0.182464 0.231647 0.074091 1 4 III B M
4 1 0.182464 0.231647 0.074092 1 3 III B M
4 1 0.182464 0 0.096463 0 2 III C M
4 1 0.182464 0 0.096463 0 3 III C M
4 1 0.182464 0 0.096463 1 4 IV B M
4 1 0.182464 0 0.096463 1 3 III B M
4 1 0.182464 0 0.096463 1 2 III B M
4 1 0.028436 0.61202 0.053753 0 2 II D M
4 1 0.028436 0.61202 0.053755 0 3 II D M
4 1 0.028436 0.61202 0.053756 1 2 III B M
4 1 0.028436 0.61202 0.053757 1 3 III B M
4 1 0.028436 0.61202 0.053759 1 4 IV B M
4 0 0.481043 0.391404 0.076133 0 2 II C T
4 0 0.481043 0.391404 0.076133 1 2 III B M
4 0 0.481043 0.391404 0.076133 1 4 III B M
4 0 0.481043 0.391404 0.052528 0 2 II C T
4 0 0.481043 0.391404 0.052528 1 2 III B M
4 0 0.481043 0.391404 0.052528 1 4 III B M
5 1 0.274882 0.011031 0.186277 0 1 II C T
5 1 0.274882 0.011031 0.186277 0 2 II C T
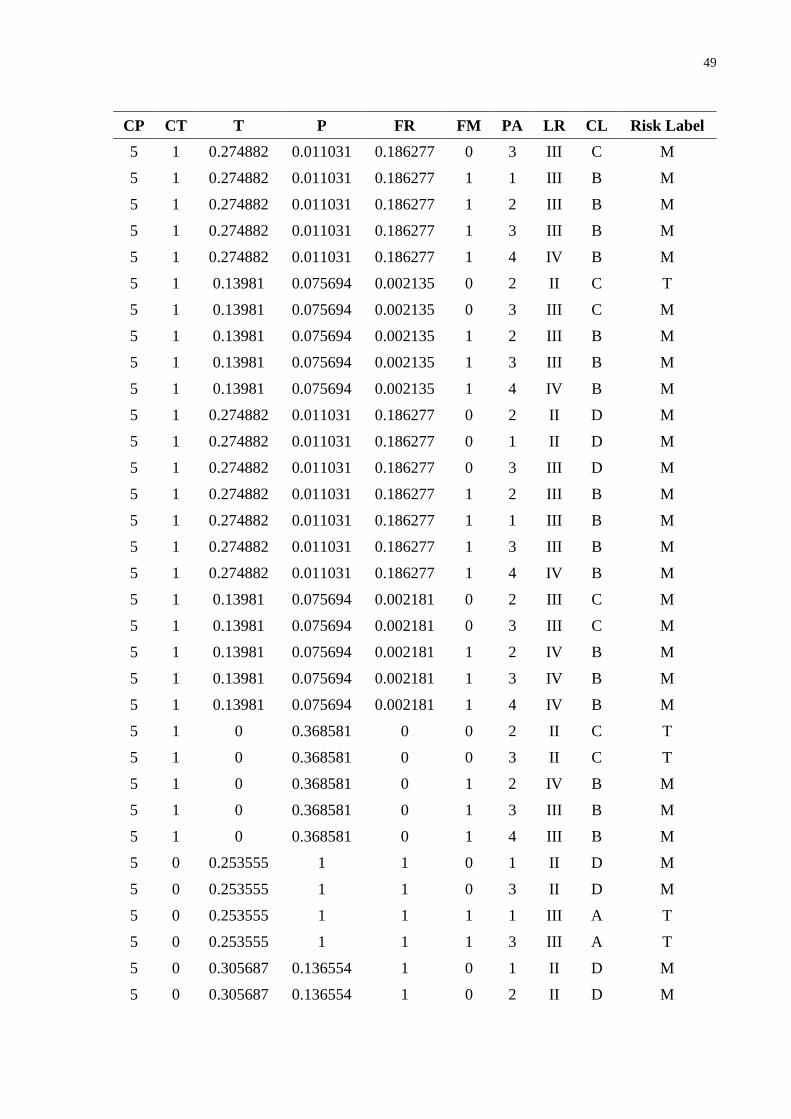
49
CP CT T P FR FM PA LR CL Risk Label
5 1 0.274882 0.011031 0.186277 0 3 III C M
5 1 0.274882 0.011031 0.186277 1 1 III B M
5 1 0.274882 0.011031 0.186277 1 2 III B M
5 1 0.274882 0.011031 0.186277 1 3 III B M
5 1 0.274882 0.011031 0.186277 1 4 IV B M
5 1 0.13981 0.075694 0.002135 0 2 II C T
5 1 0.13981 0.075694 0.002135 0 3 III C M
5 1 0.13981 0.075694 0.002135 1 2 III B M
5 1 0.13981 0.075694 0.002135 1 3 III B M
5 1 0.13981 0.075694 0.002135 1 4 IV B M
5 1 0.274882 0.011031 0.186277 0 2 II D M
5 1 0.274882 0.011031 0.186277 0 1 II D M
5 1 0.274882 0.011031 0.186277 0 3 III D M
5 1 0.274882 0.011031 0.186277 1 2 III B M
5 1 0.274882 0.011031 0.186277 1 1 III B M
5 1 0.274882 0.011031 0.186277 1 3 III B M
5 1 0.274882 0.011031 0.186277 1 4 IV B M
5 1 0.13981 0.075694 0.002181 0 2 III C M
5 1 0.13981 0.075694 0.002181 0 3 III C M
5 1 0.13981 0.075694 0.002181 1 2 IV B M
5 1 0.13981 0.075694 0.002181 1 3 IV B M
5 1 0.13981 0.075694 0.002181 1 4 IV B M
5 1 0 0.368581 0 0 2 II C T
5 1 0 0.368581 0 0 3 II C T
5 1 0 0.368581 0 1 2 IV B M
5 1 0 0.368581 0 1 3 III B M
5 1 0 0.368581 0 1 4 III B M
5 0 0.253555 1 1 0 1 II D M
5 0 0.253555 1 1 0 3 II D M
5 0 0.253555 1 1 1 1 III A T
5 0 0.253555 1 1 1 3 III A T
5 0 0.305687 0.136554 1 0 1 II D M
5 0 0.305687 0.136554 1 0 2 II D M

50
CP CT T P FR FM PA LR CL Risk Label
5 0 0.305687 0.136554 1 0 3 II D M
5 0 0.305687 0.136554 1 1 1 III A T
5 0 0.305687 0.136554 1 1 2 IV A T
5 0 0.305687 0.136554 1 1 3 IV A T
5 0 0.305687 0.151769 1 0 1 II D M
5 0 0.305687 0.151769 1 0 2 II D M
5 0 0.305687 0.151769 1 0 3 II D M
5 0 0.305687 0.151769 1 1 1 III A T
5 0 0.305687 0.151769 1 1 2 IV A T
5 0 0.305687 0.151769 1 1 3 IV A T
5 0 0.632701 0.562571 1 0 1 II D M
5 0 0.632701 0.562571 1 0 2 II D M
5 0 0.632701 0.562571 1 0 3 II D M
5 0 0.632701 0.562571 1 1 1 III A T
5 0 0.632701 0.562571 1 1 2 IV A T
5 0 0.632701 0.562571 1 1 3 IV A T
5 0 0.222749 0.003423 0.186277 0 1 II D M
5 0 0.222749 0.003423 0.186279 0 3 II D M
5 0 0.222749 0.003423 0.18628 1 1 III A T
5 0 0.222749 0.003423 0.186281 1 3 III A T
5 0 0.305687 0.170787 0.95449 0 1 II D M
5 0 0.305687 0.170787 0.95449 1 1 III A T
5 1 0.317536 0.121339 0.011538 0 1 II D M
5 1 0.317536 0.121339 0.011538 0 2 II D M
5 1 0.317536 0.121339 0.011538 0 3 II D M
5 1 0.317536 0.121339 0.011538 1 1 III B M
5 1 0.317536 0.121339 0.011538 1 2 IV B M
5 1 0.317536 0.121339 0.011538 1 3 III B M
5 0 0.632701 0.790795 0.939593 0 1 II D M
5 0 0.632701 0.790795 0.939593 0 2 II D M
5 0 0.632701 0.790795 0.939593 1 1 III B M
5 0 0.632701 0.790795 0.939593 1 2 III B M
5 0 0.632701 0.790795 0.939593 1 4 IV B M

51
CP CT T P FR FM PA LR CL Risk Label
5 1 0.819905 0.052872 0.951504 0 1 II C T
5 1 0.819905 0.052872 0.951504 0 2 III C M
5 1 0.819905 0.052872 0.951504 0 3 II C T
5 1 0.819905 0.052872 0.951504 1 1 III A T
5 1 0.819905 0.052872 0.951504 1 4 III A T
5 1 0.819905 0.052872 0.951504 1 3 III A T
5 0 0.751185 0.144161 0.073429 0 1 II D M
5 0 0.751185 0.144161 0.073429 1 1 III A T
6 0 0.765403 0.532141 0.654075 0 2 II D M
6 0 0.765403 0.532141 0.654075 0 1 II D M
6 0 0.765403 0.532141 0.654075 0 3 II D M
6 0 0.765403 0.532141 0.654075 1 2 IV B M
6 0 0.765403 0.532141 0.654075 1 1 III B M
6 0 0.765403 0.532141 0.654075 1 3 III B M
6 0 0.549763 0.170787 0.654075 0 2 II C T
6 0 0.549763 0.170787 0.654075 0 1 II C T
6 0 0.549763 0.170787 0.654075 0 3 II C T
6 0 0.549763 0.170787 0.654075 1 2 IV A T
6 0 0.549763 0.170787 0.654075 1 1 III A T
6 0 0.549763 0.170787 0.654075 1 3 III A T
6 0 0.765403 0.657665 0.653995 0 1 II D M
6 0 0.765403 0.657665 0.653995 1 1 III B M