a m p l i fi c a t i o n e f fi c i e n c y o f taqman gene expression assays€¦ · ·...
TRANSCRIPT

APPLICATION NOTETaqMan® Gene Expression Assays
Amplifi cation effi ciency of TaqMan® Gene Expression AssaysAssays tested extensively for qPCR efficiency
Two types of experiments have been performed to evaluate the amplifi cation effi ciency of TaqMan® Gene Expression Assays. First, we determined the amplifi cation effi ciency of a large sampling of assays using statistically relevant methods. Second, we evaluated the effect of amplifi cation effi ciency on the ability to determine a difference in the relative quantity of a transcript expressed in two different samples. Our results indicate that
the amplifi cation effi ciency of assays designed using our bioinformatics pipeline is essentially 100%. Additionally, our results show that the ∆∆Ct method for relative quantitation gives better correlation between expected and calculated fold changes in gene expression than methods using predetermined amplifi cation effi ciency values for individual assays.
Key factors that affect effi ciency
• Effi ciency estimates can vary signifi cantly if a rigorous measurement protocol is not followed
• Measurements must be obtained over a broad dilution range (5–6 logs) and include replicates to decrease the effects of laboratory errors (e.g., pipetting accuracy)
• PCR effi ciency can be affected by substances known to inhibit PCR, such as heme and detergents; users must ensure that cDNA templates are free of inhibitors
IntroductionLife Technologies has designed and manufactured over 680,000 real-time PCR assays for measuring the expression of human, mouse, rat, Arabidopsis, Drosophila, and C. elegans genes. TaqMan® Gene Expression Assays each consist of a fl uorescently labeled TaqMan® probe and forward and reverse amplifi cation primers in a single-tube formulation.
One of users’ major concerns regarding any real-time PCR–based assay product is the amplifi cation effi ciency of the PCR reaction. Life Technologies has done extensive R&D validation of our TaqMan® Gene Expression Assays to address this concern.

A key attribute of any real-time PCR reaction is the amplification efficiency of the PCR. Specifically, there should be a doubling of PCR product in every cycle [1,2]. The equation that describes the exponential amplification of PCR is Equation 1:
Xn = Xo * (1 + Ex)n
where:
Xn = number of target molecules at cycle n
Xo = initial number of target molecules
EX = efficiency of target amplification
n = number of cycles
For real-time amplification using TaqMan® probes, Xn is proportional to the reporter fluorescence R, so Equation 1 can be rewritten as Equation 2:
Rn = Ro * (1 + Ex)n
where:
Rn = reporter fluorescence at cycle n
Ro = initial reporter fluorescence
Ex = efficiency of target amplification
n = number of cycles
In order to use the ∆∆Ct method for relative quantitation as outlined in the “Relative quantitation of gene expression: ABI Prism® 7700 Sequence Detection System” [Livak (2007), Life Technologies User Bulletin #2, Rev. B; part number 777802-002], the efficiency (Ex) of amplification of the target and of the endogenous control must be approximately equal (see Reference 1 for derivation of the ∆∆Ct equations).
The results described in this application note show that all of the
TaqMan® Gene Expression Assays have equivalent amplification efficiencies, because they all have an efficiency (Ex) of 1.0.
MethodsEfficiency measurements In this study, efficiency values were measured using the Ct slope method. This method involves generating a dilution series of the target template and determining the Ct for each dilution. A plot of Ct vs. log cDNA concentration is constructed. With this method, the expected slope for a 10-fold dilution series of template DNA is –3.32 when Ex = 1.0.
Assay designsAll TaqMan® Gene Expression Assays have been designed by the Life Technologies genome-aided probe and primer design pipeline. Design parameters such as %GC content, Tm, and amplicon length were optimized to ensure that all TaqMan® Gene Expression Assays have high amplification efficiency. Additionally, genome-aided QC of all assays assures specificity for the target gene. This minimizes nonspecific amplification—a factor that could contribute to decreased amplification efficiency of the true target.
Testing across a broad template dilution rangeTotal RNA from Stratagene Universal Human Reference RNA was reverse transcribed using random primers (High Capacity cDNA Reverse Transcription Kit) to generate cDNA. For each assay tested, 100 ng of cDNA was amplified with TaqMan® Universal PCR Master Mix and the TaqMan® Gene Expression Assay in a 50 µL reaction volume for 40 cycles using universal cycling conditions (95ºC for 15 seconds, 60ºC for 1 minute, for 40 cycles) on the Applied Biosystems® 7000 Real-Time PCR
System. This initial amplification was performed to produce sufficient template in the form of PCR product to enable the generation of a broad template dilution range.
A total of 5 µL of each PCR product was run on a 4% agarose gel (NuSieve®/SeaKem®) with size and quantitation standards (25 bp ladder) to estimate the amount of product generated. The remaining 45 µL of each PCR product was loaded on a purification column (QIAquick® PCR purification kit; Qiagen®) and purified according to the manufacturer’s directions. Bound DNA was eluted in 100 µL of elution buffer. Then, 10 µL of the eluate was used for PicoGreen® staining (PicoGreen® dsDNA Quantitation Kit) to estimate cDNA concentration.
A 6-log range was generated using 10-fold serial dilutions of the PCR product. Each of these dilutions was subjected to real-time PCR as previously described, using TaqMan® Universal PCR Master Mix without AmpErase® UNG on the 7900HT Fast Real-Time PCR System. The Ct values obtained over this 6-log range were plotted against cDNA concentration (Figure 1). Reactions with a Ct higher than 35 were not included in the results because Ct values greater than 35 approach the sensitivity limits of the real-time PCR system. Amplification efficiency was calculated from the slope of this graph using Equation 3:
Ex = 10(-1/slope) – 1
For example, if the slope of the line is –3.33, then the amplification efficiency is:
Ex = 10(-1/-3.33) – 1
= 10 0.30 – 1
= 1.995 – 1
= 0.995, or 99.5%

Use of the comparative Ct method for determination of fold change in gene expressionStratagene Universal Human Reference RNA (100 ng/µL) was reverse transcribed as previously described to obtain cDNA. The cDNA was diluted in a 100-fold range to obtain a dilution series with known amounts of cDNA. A constant amount of cDNA reverse transcribed from a nonhuman transcript (not detected in the Stratagene RNA pool) was used as a control to measure fold change. This transcript was made by T7 transcription of a 227 bp fragment from the hepatitis C virus 5́ UTR inserted into a TOPO®-TA plasmid. Each of the Universal Human Reference cDNA dilutions was subjected to real-time PCR amplification as described above, using TaqMan® Universal PCR Master Mix without AmpErase® UNG on the 7900HT Fast Real-Time PCR System. The relative quantities of diluted target cDNA vs. hepatitis C cDNA were determined by either the ∆∆Ct method or by inserting the predetermined efficiency values for target and endogenous control into Equation 4:
(1 + ER)Ct,R R0,T / R0,R = (1 + ET)Ct,T
For derivation of this equation, see Reference 2. The calculated fold change from each method was plotted against the expected fold change, and the correlation between calculated and expected results was determined.
ResultsDetermination of amplification efficiencies of TaqMan® Gene Expression AssaysInitial testing of 30 assays using a 1-log dilution range (with three concentrations: 10, 5, and 1 ng/µL) and a 3-log dilution range (with four concentrations: 10, 1, 0.1, and 0.01 ng/µL) indicated there were statistical problems with these narrow dilution ranges when measuring amplification efficiencies. Narrow dilution ranges are often used because of the limited amount of cDNA available to do the experiment, especially when quantitating low–copy number transcripts within a cDNA sample.
The use of a broad dilution range and more data points significantly altered the distribution of amplification efficiency values. The use of a broader dilution range, however, requires the generation of PCR product or other high-concentration template such as
a cDNA clone. Therefore, the best protocol for determining amplification efficiency is more difficult to implement.
The initial data indicated that accurate determination of efficiency is extremely sensitive to both the number of data points and the dilution range used in a single experiment. Replicate experiments indicated that the precision of an amplification efficiency measurement increases when the experiment is performed over a broader range of template concentrations.
To further define the variability associated with measuring amplification efficiencies, we tested one assay targeting the glyceraldehyde-3-phosphate dehydrogenase (GAPDH) transcript using either a 2-log (cDNA template) or 5-log (PCR product) dilution series with 5 and 6 concentration points, respectively. Multiple measurements were performed, and the results are shown in Figure 2. The 2-log series exhibited a much broader range of efficiency values, from 82% to 115% (avg. = 97.6%). The 5-log series exhibited much less variability, ranging from 92% to 105% efficiency (avg. = 98.4%). Note that the average efficiency values were not significantly different between the two dilution ranges, and were close to 100%.
The data show how dramatically the variability in efficiency measurement can increase (possibly giving very misleading results) over a small dilution range (2–3 log) vs. a larger dilution range (5–6 log). The increase is due to the fact that the effect of Ct variation (from pipetting error, for example) is minimized when using larger dilution ranges.
The initial data from the first 30 assays and GAPDH allowed us to design the optimal protocol for measuring amplification efficiency
Figure 1. Determination of efficiency (EX) of assay Hs00171135_m1 (to the exon 3–4 boundary of human CXCL14 mRNA) using the Ct slope method with 7 concentrations covering a 6-log range. The calculated efficiency for this assay is 99.3%.
40
35
30
25
20
15
10
5
0
10 32 54 76 8
log Concentration
E�ciency Hs00171135_m1C
t
y = -3.3386x + 39.574
R2 = 0.9933

of a statistically significant sample of over 750 TaqMan® Gene Expression Assays.
The tested assays represented a wide range of oligonucleotide compositions; for example, base composition (26–79% GC), amplicon length (53–186 bp), and secondary structural features (free energy 0 to –19.36 Kcal/mol). Results from sample assays are shown in Figure 3. Our assay design pipeline ensures that the amplicon sizes are the shortest possible, and avoids designs that have larger amplicon sizes.
The assays tested had amplification efficiency values ranging from 90% to 110% with very few (four) outliers. Repeat testing of these outliers
resulted in values in the 90% to 110% range. The distribution of efficiency is shown in Figure 4 and approximates a normal distribution with a mean of 98.73%.
Determination of fold changeFold change in transcript levels for target templates present in the Stratagene Universal Reference RNA dilution series were determined using a spiked nonhuman transcript (NHT) as an invariant endogenous control. The results obtained for GAPDH are shown in Figure 5. The
fold change results obtained using the ∆∆Ct method showed better correlation to the expected fold change (slope = 0.94; expected slope = 1.0).
The ∆∆Ct method assumes that the amplification efficiency for both assays (GAPDH and NHT) is very similar and close to 100%. The fold change calculated using measured efficiency values (GAPDH assay efficiency = 97.5% and NHT = 94%) had a poor correlation to the expected fold change (slope = 0.78; expected slope = 1.0). The data points to the potential hazard of using “predetermined” efficiency values to do relative quantitation calculations. If the efficiency determinations used in the equations are inaccurate, then the
error is propagated to the relative quantitation calculations, i.e., the more biologically relevant results.
Conclusions and recommendationsOur results show that when you use TaqMan® Gene Expression Assays, calculated fold change values correlate better to expected fold change values when the ∆∆Ct method for relative quantitation is used. This is because all of our assay products meet the assumptions necessary to use this simplified equation. In other
words, the amplification efficiency of all TaqMan® Gene Expression Assays are equivalent to any other target assay because they all have amplification efficiencies very close to 1.
Therefore, when using TaqMan® Gene Expression Assays, it is not necessary to measure efficiency. We have extensively tested our design parameters and are confident that the resulting assays will have 100% efficiency (± 10%) when measured over a 6-log dilution range, in samples that are free of PCR inhibitors. Determination of amplification efficiency (EX) using a template dilution series can generate highly variable results depending on the conditions employed. Small differences in measured Ct values can translate into significant changes in calculated efficiency, especially when few points over a narrow dilution range are used to generate the Ct vs. log concentration plot, and thus calculate a Ct slope.
When using custom designed TaqMan® probe and primer sets that are not a part of the TaqMan® Gene Expression Assays product line, we recommend:
• To obtain reliable efficiency values, use a 5–6 log (105–106 fold) dilution range of template DNA.
• Use at least 5 points in this dilution range to generate the Ct vs. log concentration plot.
• Use a DNA template with high enough target template concentration to create a 5–6 log dilution series that will generate Ct values of less than 36 on a Applied Biosystems® real-time PCR system.
30
25
20
15
10
5
0
90 – 9585 – 90 105 – 110100 – 10595 – 100 110 –115
Ex
GAPDH e�ciency
Num
ber o
f rep
licat
es
115 – 12080 – 85
2-log
5-log
Figure 2. Assay efficiency ranges were measured for the GAPDH assay over a 2-log (in blue) and 5-log (in red) dilution series. The 2-log range = 82%–115% (avg. = 97.6%, n = 76), and 5-log range = 92%–105% (avg. = 98.4%, n = 22).
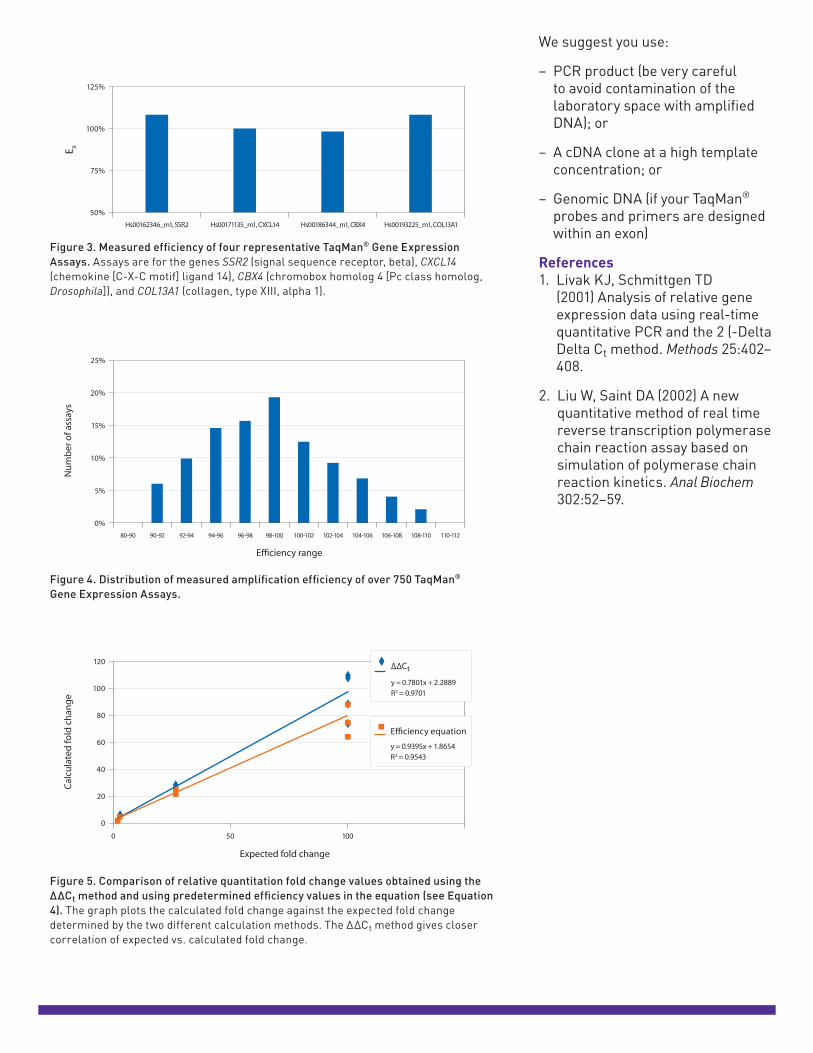
We suggest you use:
– PCR product (be very careful to avoid contamination of the laboratory space with amplified DNA); or
– A cDNA clone at a high template concentration; or
– Genomic DNA (if your TaqMan® probes and primers are designed within an exon)
References 1. Livak KJ, Schmittgen TD
(2001) Analysis of relative gene expression data using real-time quantitative PCR and the 2 (-Delta Delta Ct method. Methods 25:402–408.
2. Liu W, Saint DA (2002) A new quantitative method of real time reverse transcription polymerase chain reaction assay based on simulation of polymerase chain reaction kinetics. Anal Biochem 302:52–59.
Figure 4. Distribution of measured amplification efficiency of over 750 TaqMan® Gene Expression Assays.
25%
20%
15%
10%
5%
0%
E�ciency range
Distribution of assay e�ciency
Num
ber o
f ass
ays
92-9490-92 100-10296-9894-96 98-100 102-104 104-106 106-108 108-110 110-11280-90
125%
100%
75%
50%Hs00186344_m1, CBX4 Hs00193225_m1, COL13A1Hs00171135_m1, CXCL14
Measured e�ciencyE X
Hs00162346_m1, SSR2
Figure 3. Measured efficiency of four representative TaqMan® Gene Expression Assays. Assays are for the genes SSR2 (signal sequence receptor, beta), CXCL14 (chemokine [C-X-C motif] ligand 14), CBX4 (chromobox homolog 4 [Pc class homolog, Drosophila]), and COL13A1 (collagen, type XIII, alpha 1).
Figure 5. Comparison of relative quantitation fold change values obtained using the ∆∆Ct method and using predetermined efficiency values in the equation (see Equation 4). The graph plots the calculated fold change against the expected fold change determined by the two different calculation methods. The ΔΔCt method gives closer correlation of expected vs. calculated fold change.
120
100
80
60
40
20
0
500 100
Expected fold change
Comparison of relative quantitation (fold change)
Calc
ulat
ed fo
ld c
hang
e
∆∆Ct
y = 0.7801x + 2.2889R2 = 0.9701
E�ciency equation
y = 0.9395x + 1.8654R2 = 0.9543

lifetechnologies.comFor Research Use Only. Not for use in diagnostic procedures. ©2012 Life Technologies Corporation. All rights reserved. The trademarks mentioned herein are the property of Life Technologies Corporation or their respective owners. TaqMan® is a registered trademark of Roche Molecular Systems, Inc., used under permission and license. CO111653 1012