a loss reduction of fin welding process using oee ... · a loss reduction of fin welding process...
TRANSCRIPT
. . 2556 16-18 2556
A LOSS REDUCTION OF FIN WELDING PROCESS USING OEE TECHNIQUE
A CASE STUDY OF FRAME MANUFACTURING
1* 2 1,2
E-mail: [email protected]*
Kiatbullung Kidmai1* Rapee Kanchana2 1,2Department of Industrial Engineering, Faculty of Engineering, Rajamangala University of
Technology Thanyaburi E-mail: [email protected]*
OEE 77.88%
OEE
3
why-why (TPM)
OEE 82.85% 30.57%
Why-Why
Abstract
Eliminating waste in the production system is a technique commonly used in industry to increase
productivity and efficiency in operations in order to respond the customers� needs quickly and with
quality. A case study plant faced with the speed losses in the frame production due to frequency breakdown and failure of machine. This leads to the average OEE which equals to 77.88%. From overall
process consideration, it found that the bottleneck process located at welding process in which machine

. . 2556 16-18 2556
was specific use and very important in frame production. The loss in this process caused high impact on the overall performance. Therefore, the method of loss reduction in the frame production is needed. The
techniques of OEE analysis is also used to considering 3 important parts; availability, performance efficiency and quality rate as well as the why-why analysis technique is also used to investigate the root
cause of the problem of machine failure. Besides this, the technical maintenance; Total Productive Maintenance (TPM), is applied to take corrective action. After implementation, the results showed that the
OEE increase to 82.85%. Based on this improvement, the overall cost of the loss of frame production
lines is down to 30.57%. Keywords: Losses, Fin welding, overall equipment effectiveness, Why-Why Analysis.
1.
OEE 85%
OEE = 85% (oee.com) 1
1
1.1
OEE
OEE 4 %
2.
2.1 6
1.
2. 3.
4. 5.
6.
2.2
(Total Productive Maintenance : TPM)
�
(Loss) �[1]
TPM
. . 2556 16-18 2556
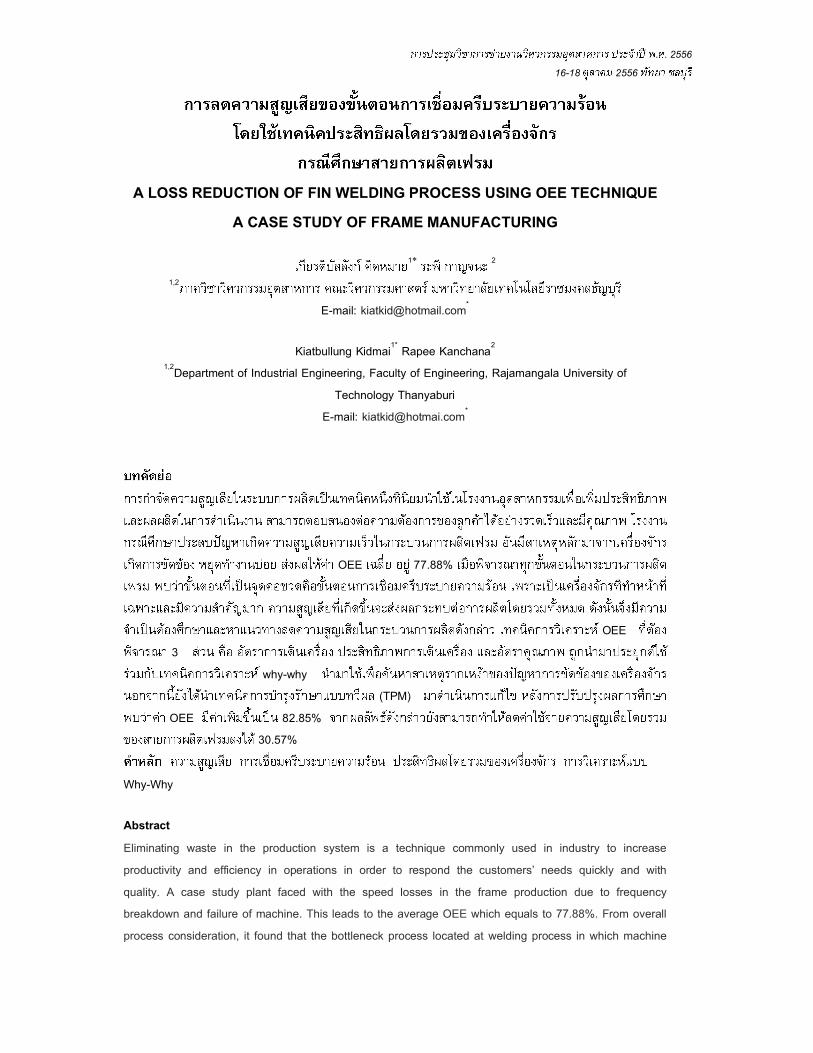
2 8 TPM
8 8 5
2
1. (Focused
Improvement) (Loss)
(Autonomous Backup) (Small Group)
2. (Autonomous Maintenance)
( 1 2 )
3. ( Planned Maintenance)
4.
(Education and Training)
5. /
(Early/Initial Phase Management)
6. ( Quality Maintenance)
(Defect) 4Ms (Material) (Machine) (Method)
(Man) 4 Ms
7. TPM (Office TPM)
TPM
3
TPM Focused Improvement,
Autonomous Maintenance, Education/Training
8.
(Safety, Health and Environment)
2.3 (Pareto Diagram)
(Overall Equipment Effectiveness : OEE) 80 : 20
80%
2.4 Why-Why Analysis
Why Why Analysis
TPM 8 Pillars
5S

. . 2556 16-18 2556
[5]
3 Why-Why Analysis
Why Why Analysis 3
NG OK NG
� � NG
2.5 (Overall
Equipment Effectiveness : OEE)[2]
TPM
3 (Availability)
= X 100 (1)
(Performance Efficiency)
= X 100 (2)
= X 100 (3)
OEE = X X (4)
OEE = 85% ( http://www.oee.com/world-class-oee.html)
90% X
95% X 99%
2.6
( 2553)
Failure Mode
and Effect Analysis : FMEA why why
(2550)
(2550) (Total Productive Maintenance : TPM)
8 1. 2. 3.
4. 5 .
/ 6. 7. TPM (Office TPM) 8.
(2550)
3
TPM (OEE)
3
1. 2. 3.
OK
NG
NG

. . 2556 16-18 2556
64%
80% 78%
17,481
3.
3.1
7 3
4
4
10
3.2
1
OEE
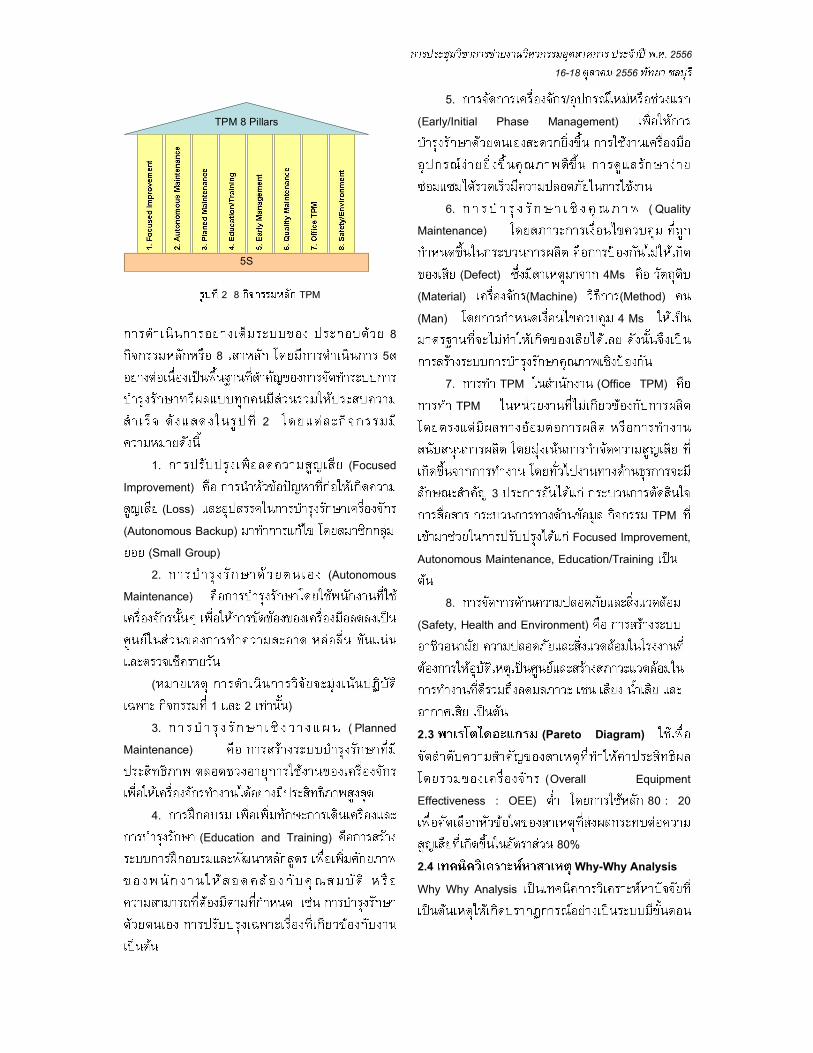
2555 2556 OEE OEE
77.88% 85%
1
. . 2555 . . 2556
3.3
OEE
95%( )
2555 2556
(Pareto Diagram) 80 : 20 2 3

. . 2556 16-18 2556
Why Why Analysis
2
. . 2555 . . 2556
1 Frame Eject Alarm ( ) 82 82 17.8
2 Dividing Motor Alarm 68 150 32.5
3 Fin Feeder Alarm 57 207 44.9
4 Alarm Opener 54 261 56.6
5 Fin Setting Alarm 44 305 66.2
6 Alarm Setting 43 348 75.5
7 Cover Spray Tank ( ) 25 373 80.9
8 Fin Carier Alarm 24 397 86.1
9 Frame Clamp ( ) 13 410 88.9
10 Alarm Tank Spray Unit 13 423 91.8
11 Fin 200/15 ( ) 11 434 94.1
12 Chuck Hanging Seat Alarm 8 442 95.9
13 Fin ( Pump ) Stroke Carier 5 447 97.0
14 Alarm Clamp Supply Unit 4 451 97.8
15 Alarm Supply Advance (Seting ) 3 454 98.5
16 Alarm Centering Model 3 457 99.1
17 (R) Electrode Shift Alarm 2 459 99.6
18 Fin Supply Alarm 1 460 99.8
19 Setting 1 461 100
461
%
82 68 57 54 44 4325 24
13 13 11 8 5 4 3 3 2 1 10
20
40
60
80
100
0
100
200
300
400
500
%
5
Why Why (Small Group) 4,5,5,7
3.4
1. 7
2 Why Why
- Frame Eject Alarm Frame Eject Alarm Sensor
Sensor
Sensor 6 7
6 Why Why Frame Eject Alarm
7 Why Why
- Motor Dividing Alarm
Motor
Bearing 8 9
8 Why Why Motor Dividing Alarm
9 Why Why
Motor Dividing Alarm

. . 2556 16-18 2556
2.
, ,
3 (Visual Control)
, ,
8
match mark
match mark
8 [3]
- 9
marking
9 [3]
4.
(Visual Control)
4.1
OEE OEE
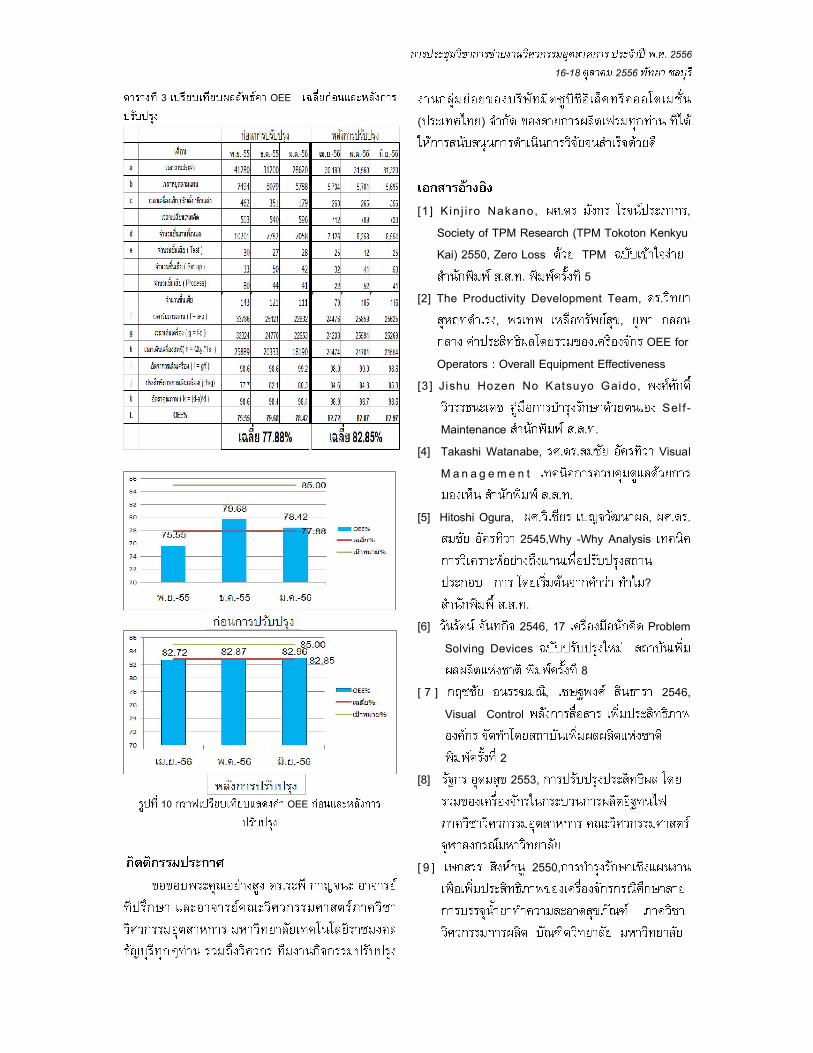
77.88% 82.85% 4.2
198,667.18 / 137,939.60 / 60,727.58 / 30.57% 4.3
5.
OEE 3 10
7
2
OEE
. . 2556 16-18 2556
3 OEE
10 OEE
.
( )
[1 ] K in j i ro Nakano, . ,
Society of TPM Research (TPM Tokoton Kenkyu Kai) 2550, Zero Loss TPM
. . . 5 [2] The Productivity Development Team, .
, , OEE for
Operators : Overall Equipment Effectiveness [3 ] Jishu Hozen No Katsuyo Gaido,
Sel f - Maintenance . . .
[4] Takashi Watanabe, . . Visual
M a n a g e m e n t . . .
[5] Hitoshi Ogura, . , . . 2545,Why -Why Analysis
?
. . . [6] 2546, 17 Problem
Solving Devices
8 [ 7 ] , 2546,
Visual Control
2 [8] 2553,
[ 9 ] 2550,

. . 2556 16-18 2556
[10] 2550, TPM