a literature review of soil carbon under pasture, horticulture and
TRANSCRIPT

A literature review of soil carbon under pasture, horticulture and
arable land uses
Report prepared for AGMARDT
October 2009
A literature review of soil carbon under pasture,
horticulture and arable land uses
Report prepared for AGMARDT
October 2009
Anwar Ghani, Alec Mackay, Brent Clothier, Denis Curtin and Graham Sparling
DISCLAIMER: While all reasonable endeavour has been made to ensure the accuracy of the investigations and the information contained in this report, AgResearch expressly disclaims any and all liabilities contingent or otherwise that may arise from the use of the information.
COPYRIGHT: All rights are reserved worldwide. No part of this publication may be
copied, photocopied, reproduced, translated, stored in a retrieval system, or transmitted in any form or by any means, electronic, mechanical, photocopying, recording, or otherwise, without the prior written permission of AgResearch Ltd.

3
Soil Carbon Report prepared for AGMARDT
Table of Contents
1. Executive Summary ................................................................................................................... 6
2. Carbon: a global perspective .................................................................................................... 9
2.1 Carbon and our world ...................................................................................................... 9
2.2 Carbon cycling in terrestrial environments .................................................................... 10
2.3 Carbon content of New Zealand Soils ........................................................................... 11
2.4 Why is soil carbon important? ....................................................................................... 16
2.4.1 Physical characteristics ................................................................................................. 16
2.4.2 Chemical characteristics ............................................................................................... 17
2.4.3 Biological characteristics ............................................................................................... 18
2.5 How is soil organic carbon measured? ......................................................................... 18
2.5.1 Soil sampling for carbon measurements....................................................................... 19
2.5.2 Preferred units ............................................................................................................... 22
2.6 Characterising soil organic matter ................................................................................. 23
2.7 Climate change and soil carbon .................................................................................... 25
2.8 Soil carbon and soil quality ............................................................................................ 25
2.9 Sustaining the soils carbon ............................................................................................ 26
2.10 Why is it so difficult to increase the soil carbon content over the long term? ............... 29
3. Carbon cycling in grassland/pasture systems .....................................................................30
Suggestions for increasing soil carbon under pastoral agriculture ......................................... 30
3.1 Soil carbon in grassland and pasture soil – A global view ............................................ 31
3.2 Carbon cycle in grazed pastures ................................................................................... 32
3.3 What are the levels of soil carbon in temperate pastures? ........................................... 34
3.4 Soil carbon changes, turnover and half-life in NZ pastures .......................................... 35
3.5 Effects of livestock on soil carbon ................................................................................. 37
3.6 Effects of irrigation ......................................................................................................... 38
3.7 Effects of effluent application ......................................................................................... 39
3.8 Effects of fertilisers ........................................................................................................ 40
3.9 Effects of drainage of wetlands ..................................................................................... 41
3.10 Effects of farm systems (organic, biodynamic, conventional) ....................................... 42

4
Soil Carbon Report prepared for AGMARDT
3.11 Total Vs. labile carbon as indicator of early changes in soil carbon ............................. 44
4. Carbon cycling in horticultural systems................................................................................45
Suggestion for improving C in soils under horticulture land use ............................................. 45
4.1 Soil carbon in horticultural soils – A world view ............................................................ 46
4.2 Soil carbon in horticultural soils – A New Zealand view ................................................ 46
4.3 Land use and land-use change and impacts on soil carbon ......................................... 47
4.4 Carbon stocks and flows: The Big Three - Kiwifruit, Grapes, and Apples .................... 51
4.4.1 Kiwifruit .......................................................................................................................... 51
4.4.2 Grapes ........................................................................................................................... 53
4.4.3 Apples ............................................................................................................................ 54
4.5 Understorey management ............................................................................................. 57
4.6 Irrigation ......................................................................................................................... 57
4.7 Cultivation ...................................................................................................................... 58
4.8 Production systems: Integrated and Organic ................................................................ 59
4.9 Soil carbon and its impact on soil functioning and soil quality ...................................... 60
5. Arable Soils ...............................................................................................................................64
Suggestions for increasing soil Carbon under cropping ......................................................... 64
5.1 Carbon cycling in arable soils ........................................................................................ 65
5.2 Soil carbon in arable soils – world view ......................................................................... 66
5.3 Soil carbon in NZ arable soils ........................................................................................ 67
5.4 Effect of cultivation practices ......................................................................................... 68
5.5 Effects of irrigation ......................................................................................................... 69
5.6 Effects of fertiliser .......................................................................................................... 69
5.7 Effect of plant type and crop rotation ............................................................................. 69
5.8 Effects of farm systems (organic and conventional) on soil carbon .............................. 69
5.9 Vegetable production and soil carbon ........................................................................... 70
5.10 Predicting effects of management practices on soil carbon .......................................... 74
6. Opportunities for increasing carbon sequestration .............................................................76
6.1 Bio-solids, green wastes, manures ............................................................................... 76
6.1.1 Availability of organic solid and semi-solid waste materials in NZ ............................... 77

5
Soil Carbon Report prepared for AGMARDT
6.1.2 Carbon accumulation in soils through application of waste .......................................... 78
6.1.3 Co-benefits of carbon sequestration in soils ................................................................. 78
6.1.4 Risks association with addition of organic carbon in soils ............................................ 79
6.2 Pastoral fallow................................................................................................................ 79
6.3 Tree pasture systems .................................................................................................... 80
6.4 Managing soil carbon sequestering through biochar .................................................... 81
6.4.1 Stability of biochar in soils ............................................................................................. 82
6.4.2 Net reduction of equivalent CO2 emissions due to the use of biochar ......................... 83
6.4.3 Practicality and cost-effectiveness of biochar use ........................................................ 83
6.4.4 Possible short- or long-term consequences of biochar applications ............................ 84
6.4.5 Impact of biochar on physical and chemical soil properties ......................................... 85
7. Soil carbon as a soil quality indicator and soil natural capital and ecosystems
services .....................................................................................................................................86
7.1 Soil carbon and soil quality indicators ........................................................................... 87
7.1.1 Soil quality indicators..................................................................................................... 87
7.1.2 Soil quality indicators for NZ soils ................................................................................. 88
7.1.3 Soil carbon as a soil quality indicator ............................................................................ 88
7.2 Natural capital and ecosystems services ...................................................................... 90
7.2.1 Soil Natural Capital ........................................................................................................ 90
7.3 Classifying and measuring soil natural capital and ecosystem services ...................... 93
7.4 Application of soil Natural capital in land management................................................. 92
8. References ................................................................................................................................97
9. Glossary ..................................................................................................................................113
10. Appendix 1 PAS 2050 protocol ............................................................................................118
6
Soil Carbon Report prepared for AGMARDT
1. Executive Summary
Carbon (C) is an essential constituent of biological life on earth. Most C on earth is not in living
organisms but is present in vast amounts in rocks such as limestone, and in dead organic matter.
For terrestrial ecosystems, there is more C in soil organic matter (SOM), than in the living plants
and animals, and the atmosphere. It has been estimated that soil contains 1,200–1,550 Pg C to a
depth of 1 m, and 2,370–2,450 Pg C to a depth of 2 m. Comparative estimates of organic C
contained in living biomass (560 Pg) and atmospheric CO2-C (760 Pg) indicates that a small shift
in the soil organic C pool has the potential to have a significant impact on atmospheric C
concentrations.
Organic matter helps soils to retain and store water and plant nutrients, to resist erosion, form
stable aggregates, improve water infiltration and drainage, and provide a food source and habitat
for soil dwelling organisms. The C in organic matter is from a complex mix of different compounds
that is undergoing constant change as fresh organic matter is added, and organic matter
decomposes. Once lost from the soil organic C pool, replenishment can take many years, even
centuries. For New Zealand soils the total C content, measured by high temperature combustion,
provides a reliable measure of the organic C content. Important considerations for estimating C
stocks in a soil are a representative sample, the depth of sampling and bulk densities. This
literature review summarizes the impacts of different land uses namely pasture, arable and
horticulture on soil C levels. It also covers options for increasing C sequestration in soils through
adaptation of soil and crop management and organic inputs, soil C as a soil quality indicator and
emerging approaches for valuing soil C.
Nearly 1/3 of the terrestrial C stock is stored in pasture and rangeland soils. At present, for most
pastoral soils in New Zealand production gains are unlikely from increasing soil C levels above
current levels. They are in general described as being ―rich‖ in organic C ranging between 3.5-
15% C (w/w). Recent study in New Zealand indicates that in intensive lowland livestock systems,
soils have lost C over the last approximately 2 decades, while in hill land soil C levels have
increased. Both were unexpected findings. Further work is required to identify the reasons for the
measured losses of soil C under intensive livestock farming and establish if these losses are
ongoing. While numerous international studies show inputs such as fertilisers, irrigation and
lenient grazing can increase C sequestration, many of these come from native grasslands and
degraded rangelands with low initial soil C contents. This is not the general case in New Zealand
with many of our pasture soils already ―rich‖ in organic matter. The opportunity for increasing C
sequestration in soil is therefore likely to be limited primarily to hill land. Retaining existing soil C
contents may pose more of a challenge on flat and lowland pastures.

7
Soil Carbon Report prepared for AGMARDT
Horticultural production systems are often managed to increase the production of the fruiting part
of the plant, rather than the vegetative component. Thus soils with low soil C and with limited
fertility are favoured for horticulture to ensure quality production of fruit. The combination of
naturally low vegetative vigour, pruning practices, and high harvest index in horticultural systems,
return low amounts of C to the soil, resulting in observed losses in soil C. Because soil C is
critical for soil functioning and health (e.g. aeration and N mineralization), it is imperative that C
levels be maintained even if this is at levels lower than pastoral soils. In orchards and vineyards
this can be achieved through mulches and composts, and in the future there is the possibility of
gains from using biochar (charcoal produced by pyrolysis of woody plant biomass).
Levels of C in arable and, especially, vegetable-producing soils are much lower than in pastoral
soils. To raise soil C levels, it is necessary to either increase C inputs from crop residues or
decrease the rate of decomposition. Switching from intensive cultivation to low-disturbance tillage
may be beneficial in increasing C in soils with low C contents, though further work is needed to
quantify the C sequestration potential of no tillage under New Zealand conditions. Although a
reduction in tillage intensity can sometimes increase C inputs (by improving yield), the effect of
tillage on soil C is mainly related to its influence on the rate of decomposition. Managing crops to
maximise yields (e.g., by providing adequate nutrition for the crop) should also maximise C
returns in post-harvest residues. Crop type has a strong influence on C returns in plant residues,
with perennial grasses (pasture) returning largest amounts, vegetable crops the least, and small-
grain cereals being intermediate. In the long-term, burning of crop residues can cause depletion
of soil C.
Environmental benefits of sequestering greater quantities of C in soils are well documented but
are harder to quantify. Other than some subtle land management options that slow down
decomposition of SOM, regular inputs of low cost materials that are rich in organic C can improve
soil C stocks. These include addition of organic wastes (e.g. biosolids, pulp and paper waste,
green waste, manures), fallowing, and the inclusion of spaced-tree in pasture systems as part of
a soil conservation practice and for providing shade, shelter and fodder. More recently addition of
agrichar or biochar in agricultural soils has also been suggested. It is too early to comment on the
potential value and the practical challenges associated with use of these compounds.
Because of the pivotal role soil C plays in soil function, it is a very useful soil quality indicator for a
wider range of soil services. For each of the major soil orders and land uses, there is an optimum
range of soil C to achieve the desired production and environmental goals. There is also a
significant range in that optimum target range for which there appears to be little measurable
change in production or environmental outcomes. For example for the allophanic soil the optimum
range under a pastoral use varies from 4-9% soil C. Inclusion of soil C as a potential C-offset for
greenhouse gas emissions, will require a rethink of the current target range or fit-for-purpose
definition for this soil quality indicator and a revision of the provisional targets for state-of-the-

8
Soil Carbon Report prepared for AGMARDT
environment indicators published in Provisional targets for soil quality indicators in New Zealand.
A limitation of soil quality indicators is that they only inform us about the characteristics or
condition of the soil. Linked to soil processes and built into an ecosystems service framework an
insight into the influence of a change in soil C on a wider range of soil services could be
quantified and ultimately valued, help to highlight just how closely our well-being is linked to the C
economy.

9
Soil Carbon Report prepared for AGMARDT
2. Carbon: a global perspective
Summary Carbon (C) is an essential constituent of biological life on earth; our bodies are built up of a huge
range of different complex organic molecules. But on a global scale, most C on earth is not in
living organisms but is present in vast amounts in rocks such as limestone, and in dead organic
matter. For terrestrial ecosystems, there is more C in soil organic matter, than in the living plants
and animals, plus the atmosphere. Soils form an important role in the global C balance.
Organic matter modifies the characteristics of soil, usually in ways that benefit human use.
Organic matter helps soils retain and store plant nutrients, resist erosion, form stable aggregates,
store and retain moisture, improve drainage and water infiltration, and provide a food source and
habitat for soil dwelling organisms.
Most organic matter C is concentrated in the surface layers of soil (0-300 mm) and has taken
many hundreds of years to form. Soil C is not a single compound but a complex mix of different
compounds that is constantly undergoing change as fresh organic matter is added, and older
organic matter decomposes. Once lost from soil, organic C can take many years, even centuries,
to be restored. For New Zealand soils the total C content, measured by high temperature
combustion, provides a reliable measure of the organic C content.
2.1 Carbon and our world
Carbon (C) is the major chemical constituent of all organic matter and all life on our planet. This C
comes in a vast range of forms from the living tissues of your body to non-living forms such as
coal and oil and diamonds. The amount present as living plants and animals or as dead plants
and animals (litter, organic matter and fossil fuel deposits) is very small compared to inorganic
forms in rocks such as limestone and sediments (Table 1.1). The C stored in soil organic matter
is an important component in the global C balance. The organic forms of C in soil are often
referred to collectively as soil organic matter, humus, or soil C. In fact soil organic matter is about
60% C, and comprises the largest terrestrial store for organic C, more than the total amount in
living land plants and animals and the atmosphere.
Soil organic matter is a complex mixture of compounds and differs in composition from soil to soil.
There is no single ―description‖ for soil organic matter, and it is actually very difficult to
characterize except in a general way, using chemical and physical methods to separate out
various fractions. As well as C, soil organic matter also contains large amounts of oxygen (O),
hydrogen (H), nitrogen (N), smaller amounts of sulphur (S) and phosphorus (P) and a range of
trace elements. Derived initially from the decomposing remains of plants, animals and soil
microbes, the composition of soil organic matter is not static but is constantly undergoing
10
Soil Carbon Report prepared for AGMARDT
continuing decay and transformation. It is organic matter that gives topsoil and composts a dark
colour.
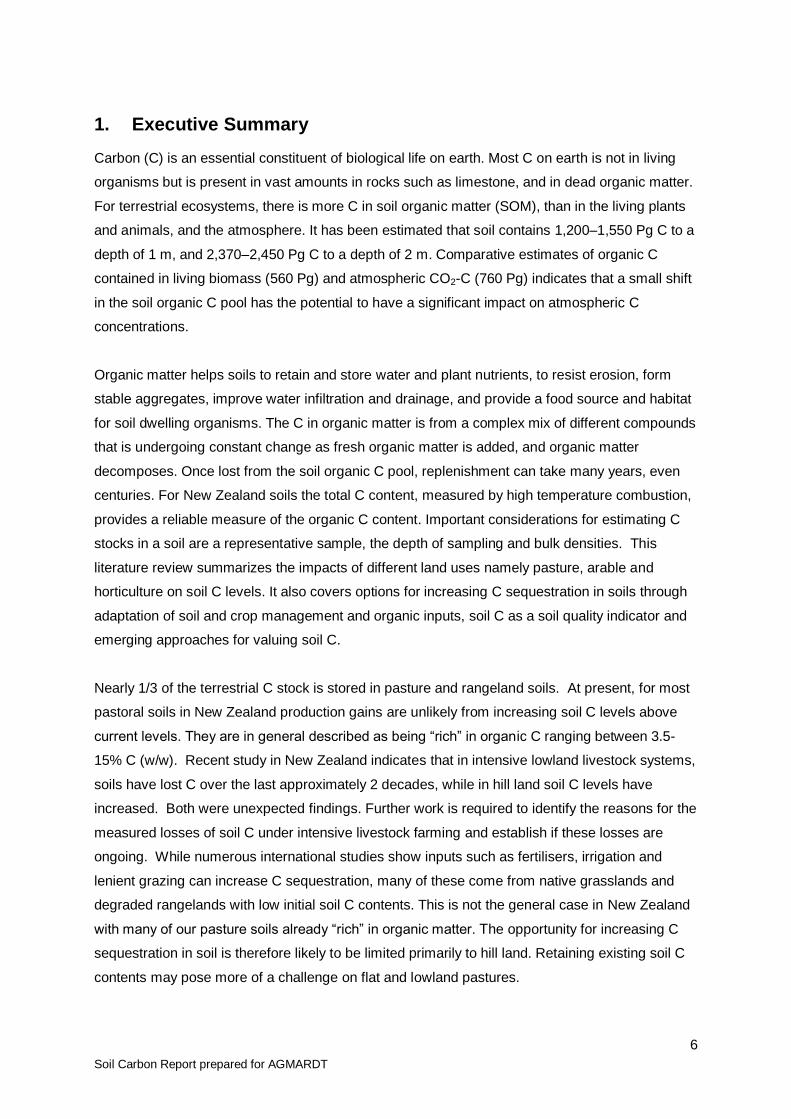
Table 1.1 Estimated major stores of C on the Earth
From ―The Encyclopedia of Earth. http://www.eoearth.org/article/Carbon_cycle
2.2 Carbon cycling in terrestrial environments
Virtually all the C in soil organic matter has originally been ―fixed‖ by green plants using energy
from the sun. In the leaves of green plants, the C gas in the atmosphere (carbon dioxide, CO2) is
converted into complex organic C molecules and becomes part of the plant structure. If the plant
is eaten by an animal then that C is respired for energy or becomes part of the animal‘s body.
When plants or animals die, or when animals excrete wastes, the C from their bodies and wastes
enters the soil and begins to decay, forming soil organic matter. The amount of ―dead‖ organic
matter in soil is substantial; 3-4 times more than the mass of the living terrestrial organisms. This
dead soil organic matter was initially all derived from the ―fixation‖ of atmospheric CO2 by living
photosynthetic organisms. The decay of dead organic matter by soil organisms completes the C
cycle converting the organic matter back to gaseous CO2 in the atmosphere (Fig. 1.1) that living
plants can use. Under some conditions during decomposition small amounts of methane may be
formed. This is a concern as methane is a potent greenhouse gas (Nayak et al. 2007). Much
methane is formed when grazing ruminant animals digest pasture.
Store Amount in Billions of Metric Tons
Marine Sediments and Sedimentary Rocks 66,000,000 to 100,000,000
Ocean 38,000 to 40,000
Fossil Fuel Deposits 4000
Soil Organic Matter 1500 to 1600
Atmosphere 578 (as of 1700) - 766 (as of 1999)
Terrestrial Plants 540 to 610

11
Soil Carbon Report prepared for AGMARDT
Figure 1.1 Average amounts of C in one hectare of terrestrial ecosystems and yearly inputs and losses of C. Adapted from Janzen (2004).
2.3 Carbon content of New Zealand Soils
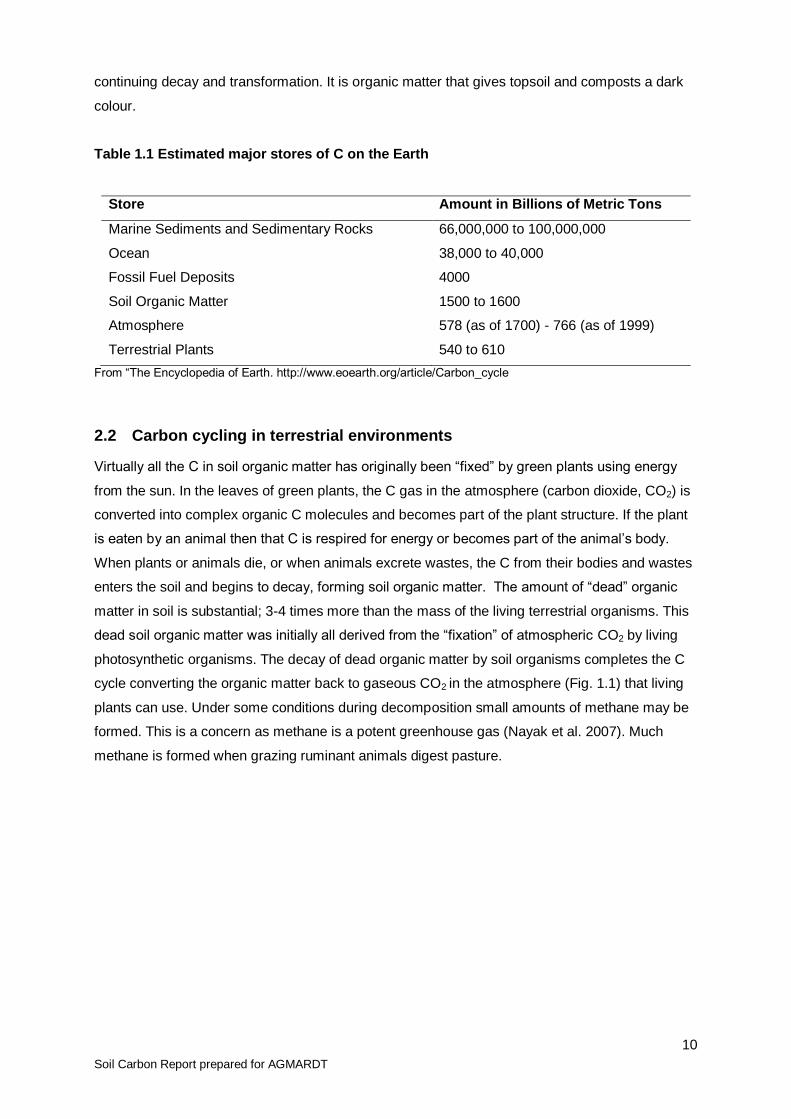
The large scale distribution of organic C in New Zealand is shown in Figure 1.2. The low C areas
are clearly shown in red and the very high C soils (peats) in dark green. In general, North Island
soils have a greater C content than those in South Island.
The C content of soils depends on the type of soil (its soil class or order) which itself depends on
the parent rock materials that made up the soil, climatic factors and the length of time for soil
formation. Note the high C content of Allophanic soils and the much lower amounts in raw and
Semi-arid soils (Fig. 1.3).
12
Soil Carbon Report prepared for AGMARDT
Figure 1.2 The pattern of total C in New Zealand soils taken from Landcare Research’s
Fundamental Soil Layers (NZFSL).

13
Soil Carbon Report prepared for AGMARDT
Figure 1.3 Organic C as percentage of soil mass in different New Zealand soil orders. Note
high C in Allophanic Soils (volcanic ash soils) and lower C in Pallic Raw (newly forming
soils) and Semi-arid Soils (typically from dry Central Otago). From New Zealand National Soils
Database
In New Zealand by far the largest amount of soil C is stored under pastures (grazing land) than
other land uses because this is the dominant land use, and also because the C content of soils
under pastures is greater than under most other land uses (Table 1.2)
In undisturbed soils most organic matter is in the surface layer (0–10 cm), and declines rapidly
with increasing depth. An example is shown in Fig. 1.4 for Horotiu soil from the Allophanic Soil
Order. An exception to this general rule is the Organic peat soils where the organic matter is
distributed evenly throughout the soil profile Most New Zealand soils contain around 50–150
tonnes C in 1 ha (to 10 cm depth).

14
Soil Carbon Report prepared for AGMARDT
Table 1.2 Estimates of the amounts of soil organic C under different land uses summed for the whole of New Zealand and average amounts per hectare (as in 2000, 0–30 cm depth).
Adapted from: Tate et al (2005)
Figure 1.4 Total soil C stored in a Horotiu soil at different depths (Schipper, unpublished).
Land use
Area
(Mha)
Soil C (Millions of
tonnes)
Mean and
standard error
Soil C content
( Tonnes ha-1
)
Grazing land 14.0 1480±58 105.7
Natural shrub vegetation 2.7 244±18 90.4
Cropland 0.3 26±3 86.7
Exotic forest 1.3 77±23 59.2
15
Soil Carbon Report prepared for AGMARDT
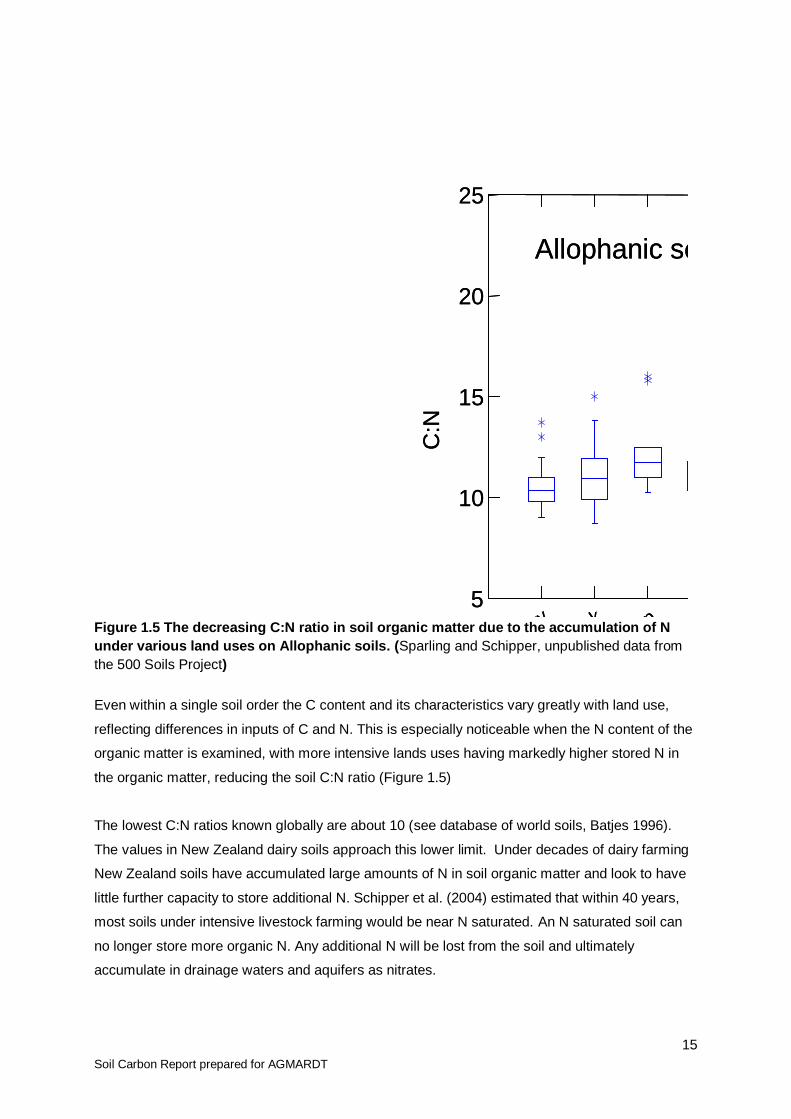
Figure 1.5 The decreasing C:N ratio in soil organic matter due to the accumulation of N
under various land uses on Allophanic soils. (Sparling and Schipper, unpublished data from
the 500 Soils Project)
Even within a single soil order the C content and its characteristics vary greatly with land use,
reflecting differences in inputs of C and N. This is especially noticeable when the N content of the
organic matter is examined, with more intensive lands uses having markedly higher stored N in
the organic matter, reducing the soil C:N ratio (Figure 1.5)
The lowest C:N ratios known globally are about 10 (see database of world soils, Batjes 1996).
The values in New Zealand dairy soils approach this lower limit. Under decades of dairy farming
New Zealand soils have accumulated large amounts of N in soil organic matter and look to have
little further capacity to store additional N. Schipper et al. (2004) estimated that within 40 years,
most soils under intensive livestock farming would be near N saturated. An N saturated soil can
no longer store more organic N. Any additional N will be lost from the soil and ultimately
accumulate in drainage waters and aquifers as nitrates.
Allophanic soils
Dairy
Drysto
ck
Arable cr
op
Horticu
lture
Forestr
y
Indigenous
Land use
5
10
15
20
25
C:N
Allophanic soils
Dairy
Drysto
ck
Arable cr
op
Horticu
lture
Forestr
y
Indigenous
Land use
5
10
15
20
25
C:N
Allophanic soils
Dairy
Drysto
ck
Arable cr
op
Horticu
lture
Forestr
y
Indigenous
Land use
5
10
15
20
25
C:N
16
Soil Carbon Report prepared for AGMARDT
2.4 Why is soil carbon important?
Organic matter helps to bind the primary mineral particles, forming crumbs and aggregates.
Aggregates help to reduce soil erosion and also give soil its crumbly texture, or ‗structure‘. A well
structured soil makes it easier for plant roots to penetrate, for air to enter the soil and for the soils
to drain freely and still retain water.
The presence of organic matter helps the soil to store plant nutrients. Among the most important
of these nutrients is nitrogen (N), an essential macronutrient for plants and animals. Mineral rocks
contain very little N. Most N in soils has been accumulated through biological processes such as
N-fixation by legumes and their symbiotic bacteria, and by chemical inputs from fertilisers and
from nitrogen oxides formed in the atmosphere by lightning. The ability of a soil to hold onto these
sparse N sources is highly dependent on the amount of soil organic C (see Fig 1.6b). When
micro-organisms decompose soil organic matter, this organic N becomes available to plants.
2.4.1 Physical characteristics
Organic matter helps bind soils together and assist with the formation of porous aggregates,
which reduces bulk density (Figure 1.6a). These soil aggregates increase the porosity of the soil,
and improve aeration (Soane 1990). Aeration and porosity are essential for good root growth.
Organic matter also makes the aggregates more resistant to being compacted either by animal
hooves or vehicles (Soane 1990, Shepherd et al. 2001). The larger soil aggregates are less
susceptible to movement by wind or water flows which makes the soil less erodible. Infiltration,
the rate at which water soaks into soil, is also improved by good aggregate structure, meaning
the soils are better draining, and less susceptible to water-logging and treading damage (Drewry
2006).
Organic matter helps soils to retain water once they have wetted. Soils with higher organic matter
release water gradually, providing a valuable ecological service. Without these characteristics,
during heavy rainfall, the water may run off the soil surface and cause surface flooding. Also the
ability to retain water within the soil structure means that rivers and streams are buffered from
rapid changes in flow rates and the soil water gets released gradually, helping to avoid ―flash
flood‖ events.
An unusual effect of soil organic matter is the potential to slightly increase soil temperature and
cause the soil to warm up more quickly. This can be useful if low soil temperatures are limiting
root growth and biological activity. The dark colour of soil organic matter means that the surface
of the soil is darker than it would be if no organic matter was present. This darker colour
decreases the albedo meaning that less radiant heat from the sun is reflected and the soil warms
more quickly. A bare topsoil with some organic matter has an albedo (reflectance) of about 0.17,

17
Soil Carbon Report prepared for AGMARDT
compared to about 0.40 for a desert sand with no organic matter (scale 0–1, low to high
reflectance) (http://en.wikipedia.org/wiki/Albedo).
2.4.2 Chemical characteristics
Organic matter in soils provides a store of nutrient for plants and soil fauna. Soil C is covalently
bonded to nitrogen (N) and through other bonds to phosphorus (P) and sulphur (S). Fig 1.6b
shows the close relationship between the amount of total C in soil and the amount of N stored in
soil.
Figure 1.6. Examples of the influence of soil organic C (measured as total C%), on (a) bulk
density, (b) N content and (c) cation exchange capacity (CEC) (Sparling, unpublished
data).
Soil C is not a direct food source to plants, but when organic matter mineralises the organic N is
released in plant available inorganic forms. A similar process releases P and S. Soil organic
matter has a high surface area and the charged surfaces give the organic matter the ability to
retain charged ions. Soils with high organic matter are much better buffered against pH change
than low organic matter soil, and the charged surfaces enable the soil to retain cations such as
Ca, Mg, and K (cation exchange capacity) (Fig 1.6c). Soil organic matter also has the capacity to
absorb trace elements such as Ni, Co, Cu, Pb, Mn, Zn, Ca, and Mg which lowers the effective
concentration in soil solution. However, the soluble fraction of organic matter can form complexes
with ions,keeping them in solution. The mechanisms of complexing, whether by chelation or other
mechanisms, are poorly understood, but the overall effect is to keep the trace elements in
solution where they are available for plant uptake and metabolism (Huang and Schnitzer 1986).
In some cases this may benefit the plant or soil organisms where the trace metal is essential for
growth (e.g., Mg, Fe) in other cases there may be a potentially toxic result if contaminant remains
in bio-available form.
Organic matter and nitrogen
0
0.5
1
1.5
2
2.5
3
0 10 20 30 40 50 60
Total C %
To
ta
l N
%
Organic matter and CEC
0
20
40
60
80
100
120
140
160
0 10 20 30 40 50 60
Total C %C
atio
n e
xch
an
ge
Organic matter and bulk density
0
0.5
1
1.5
2
0 10 20 30 40 50 60
Total C %
Bu
lk d
en
sit
y
a b c

18
Soil Carbon Report prepared for AGMARDT
2.4.3 Biological characteristics
Soil organic matter forms both a habitat and food source for soil organisms. Many soil fauna and
flora are detritus feeders ingesting organic matter particles which they digest as a source of
energy. Bacteria and fungi are often intimately embedded within an organic matter matrix. They
produce extracellular enzymes that are able to break down the organic matter to simpler
molecules which they are subsequently able to absorb into their bodies (Huang and Schnitzer
1986). Plant roots have been shown to be able to absorb even high weight organic molecules
and incorporate them into their chemical structure. Chemical fractions such as humic and fulvic
acids (See Table 3) have been claimed to stimulate plant growth, although the effects have not
always been consistent (Vaughan and Ord 1985; Huang and Schnitzer 1986).
An effect of SOM content on microbial diversity has been noted. In a survey of different soils and
land uses. Degens et al. (2000) noted that the biodiversity measured by the catabolic response
profile (CRP) test was reduced on matched pairs of soils where one of the pair had lost organic C
through land use change. Further work (Degens et al. 2001) showed that the microbial
communities of C depleted soils were less resistant to imposed stresses such as fluctuating
temperature, drying of the soil, salt stress, and metal toxicity.
2.5 How is soil organic carbon measured?
Once a soil sample has been obtained, there are well-established chemical methods to measure
the amount of C in the sample. For New Zealand a measure of total C gives a good estimate of
the soil organic C content (Blakemore et al. 1987; Metson et al.1979). This is because most New
Zealand soils contain very little carbonate (inorganic C) which would otherwise interfere with the
measurement of soil organic C (Miller 1968). In other countries it is often necessary to remove or
measure the inorganic C before measuring the soil organic C. The recommended method to
determine total C in New Zealand soils soil is high temperature combustion. High temperature
combustion of soils and measurement of CO2 evolved is a very reliable method and causes less
potential environmental pollution than chemical oxidation because no toxic chromium salts, or
boiling of highly concentrated acids are required. If high temperature combustion instruments
such as the Leco FP-2000 CNS Analyser are not available, then dichromate oxidation and
titration or spectrographic measurements are acceptable (Metson et al. 1979; Blakemore et al.
1987). These are specialist measures that need to be completed in a registered laboratory.
An approximate method to estimate soil organic matter is ―loss on ignition‖. In this method dried
soil is heated on a hot plate in the presence of air, and the organic matter in soil is gradually burnt
away. The loss in weight is taken as loss of soil organic matter from the sample and hence the
organic C content. However, this is a very approximate method and the temperature and time of
heating needs to be very carefully controlled to ensure only organic matter is oxidized. Thermal
19
Soil Carbon Report prepared for AGMARDT
decomposition of minerals in soil occurs on heating together with further loss of bound water from
the soil. If only the change in weight is recorded, this can result in large overestimates of soil
organic matter because water, as well as CO2 has been lost from the sample, and there will also
have been thermal decomposition of clays and minerals resulting in weight loss.
The high temperature combustion methods cited earlier also heat the soil, but under very
controlled conditions and the C content is measured directly as carbon dioxide (CO2) release,
rather than total loss in weight The current generation of high temperature combustion
instruments is sufficiently sensitive to be able to distinguish CO2 from the thermal decomposition
of minerals (such as carbonates) from CO2 derived from soil organic matter (see manufactures‘
specifications)
2.5.1 Soil sampling for carbon measurements
A more challenging task than analyzing the soil is to obtain a representative soil sample,
particularly if the total soil profile storage of C is required (Schipper et al., 2007; Parfitt et al.,
2007).
The main issues are:
Obtaining a representative soil sample
Depth of sampling
Measuring and adjusting for soil bulk density
Units used to show C content.
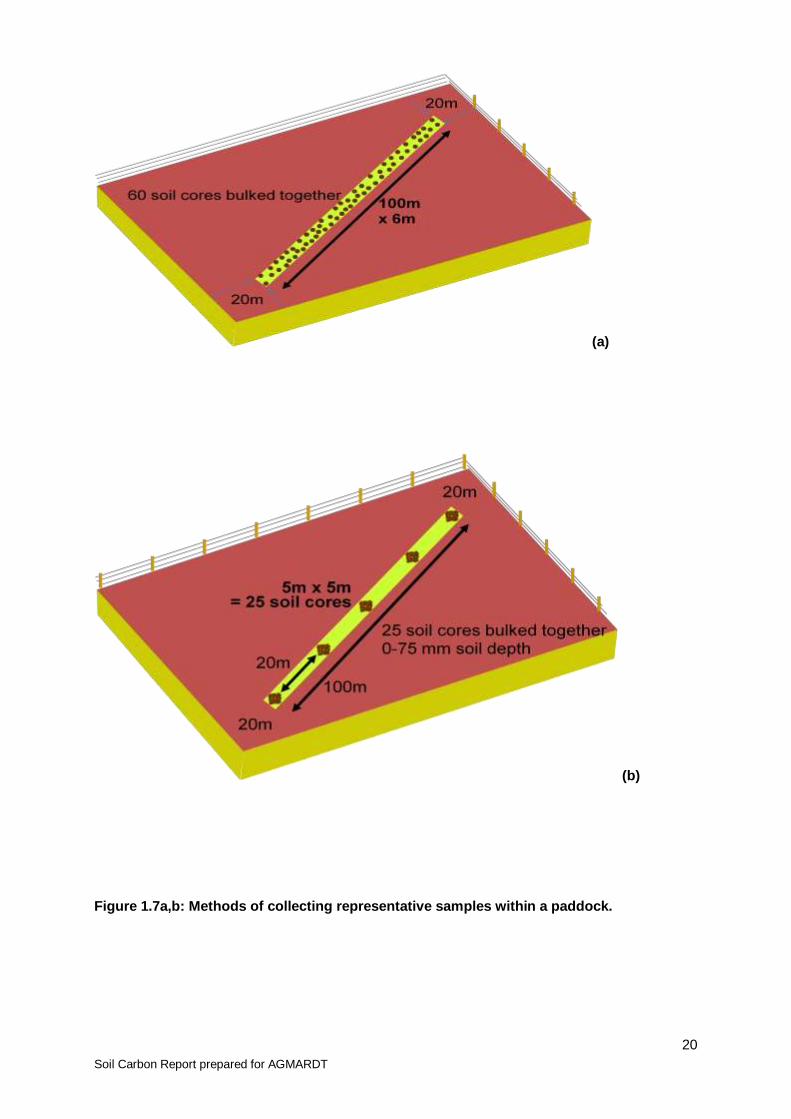
A representative sample of the area under considerations must attempt to capture all the variation
that is likely to influence soil C levels, by collecting and bulking sufficient numbers of soil cores to
obtain an estimate of the C level in soil. Single or only a few core bulked together will give greater
variability when assessing changes in soil C over time. Although soil C does not change a great
deal between different seasons within a land use and within a paddock, one must collect soil
samples approximately at the same season when comparing soil C on yearly intervals. Ghani et
al. (1996) found less than 10% variability in soil C contents in paddocks when they re-sampled
the same paddocks at 24 different farms within the Waikato area following the protocols shown in
Figure 1.7a,b. At the farm scale it might be necessary to break the farm into blocks based on soil
type and slope sampled separately and bulked (Figure 1.8). In grazed pastures, animal camping
areas where litter deposition is relatively high should be sampled separately.
20
Soil Carbon Report prepared for AGMARDT
(a)
(b)
Figure 1.7a,b: Methods of collecting representative samples within a paddock.
21
Soil Carbon Report prepared for AGMARDT
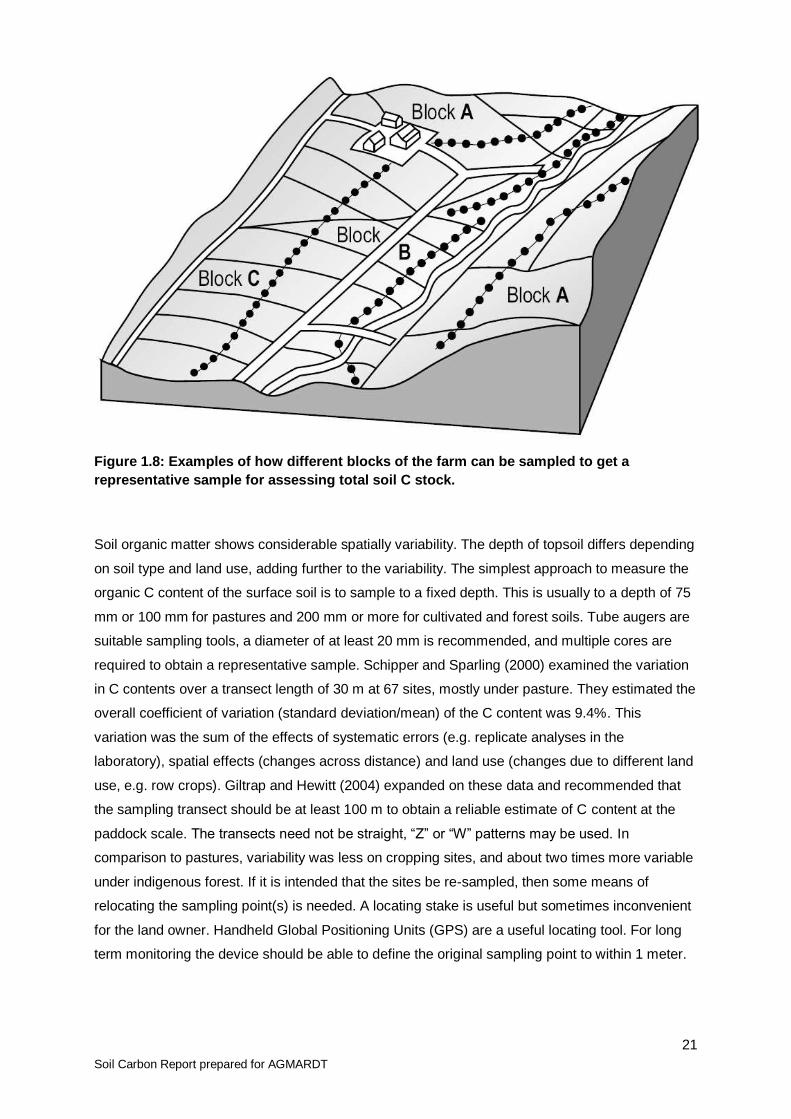
Figure 1.8: Examples of how different blocks of the farm can be sampled to get a
representative sample for assessing total soil C stock.
Soil organic matter shows considerable spatially variability. The depth of topsoil differs depending
on soil type and land use, adding further to the variability. The simplest approach to measure the
organic C content of the surface soil is to sample to a fixed depth. This is usually to a depth of 75
mm or 100 mm for pastures and 200 mm or more for cultivated and forest soils. Tube augers are
suitable sampling tools, a diameter of at least 20 mm is recommended, and multiple cores are
required to obtain a representative sample. Schipper and Sparling (2000) examined the variation
in C contents over a transect length of 30 m at 67 sites, mostly under pasture. They estimated the
overall coefficient of variation (standard deviation/mean) of the C content was 9.4%. This
variation was the sum of the effects of systematic errors (e.g. replicate analyses in the
laboratory), spatial effects (changes across distance) and land use (changes due to different land
use, e.g. row crops). Giltrap and Hewitt (2004) expanded on these data and recommended that
the sampling transect should be at least 100 m to obtain a reliable estimate of C content at the
paddock scale. The transects need not be straight, ―Z‖ or ―W‖ patterns may be used. In
comparison to pastures, variability was less on cropping sites, and about two times more variable
under indigenous forest. If it is intended that the sites be re-sampled, then some means of
relocating the sampling point(s) is needed. A locating stake is useful but sometimes inconvenient
for the land owner. Handheld Global Positioning Units (GPS) are a useful locating tool. For long
term monitoring the device should be able to define the original sampling point to within 1 meter.

22
Soil Carbon Report prepared for AGMARDT
To obtain an estimate of the mass of C in the soil profile or sample depth, the mass of soil in that
depth must be known. This requires a separate measure of the soil bulk density (g/cm3), which
allows a conversion from the weight of soil, to the volume of soil. Then the mass of C in that
volume of soil can be calculated. Such calculations are essential for C budgeting and estimates
of C stored in the soil profile.
Most laboratories report C contents as %C, or g/kg. Some laboratories use a standard scoop so
the %C is probably as percent weight per unit volume (%w/v), with a possible correction for the
weight of soil in the standard scoop. It is important to know the method and units used. The
necessities to sample to a fixed depth and to obtain soil bulk density values do not make this
measure easy or cheap. Consequently, much of the data in the literature tends to refer to %C
contents in surface soil (0-10 cm), and very little on total C storage in the soil profile (typically 0-
50 cm). For national C accounting in NZ, the IPCC internationally agreed depths of 0-10, 10-20
and 20-30 cm have been adopted (Tate et al. 2005), and data are reported as tonnes per ha to a
specified depth.
Measuring soil C in the surface horizons can give misleading indications of C changes deeper in
the profile. For NZ pasture soils, Schipper and Sparling (in press) re-examined data collected by
Jackman (1964 a,b) for C contents in soils after conversion from scrub to pasture. They found
that when the soil from 0-10 cm depth was examined, over some 50 years there appeared to be
significant increases in total C content after conversion (expressed on a tonnes per ha basis).
However, when the same soils to 0-30 cm depth were examined, there were fewer significant
increases in the total C contents during the period after conversion. Changes in C contents of the
deeper depth masked or negated the changes in the surface soil. In the USA, Blanco-Canqui and
Lal (2008) found that for corn-soybean rotations, zero tillage methods increased C contents in the
0-10 cm depth soil compared to ploughing, but when the soil profile 0–60 cm depth was
examined, there was no significant difference in soil profile C content between the two tillage
methods. In a wider review where other soils had been sampled to 50 cm depth or deeper,
Blanco-Canqui and Lal (2008) concluded that zero tillage increased C contents of the 0-10 cm
depth soil, compared to more intensive cultivation, but there was no firm evidence to show
increased C sequestration in the whole soil profile under zero till management. We are not aware
of any similar NZ studies to this depth of soil but the conclusion challenges whether or not we
have sufficient knowledge of soil and plant management to be able to increase C sequestration in
soil and maintain it in the longer term, and again emphasis that short term (1-5 years) changes in
C contents of the surface soil may not represent changes in the C stocks in the soil profile.
2.5.2 Preferred units
Reported %C figures must be checked for expression on a weight/volume bases (w/v) or a
weight/weight basis (w/w). Most soil laboratories report soil C content as %C (g C/100 g oven-dry
23
Soil Carbon Report prepared for AGMARDT
soil) or as g C/kg oven-dry soil. The g/kg units are preferred, because these units are specified by
scientific journals and if required, can be converted readily to % C on a weight/weight basis.
For comparisons within a single soil type, or monitoring trends on a single soil, and for land use
comparisons on the same soil, the % C is usually adequate. However, if we wish to know the
physical amount of C stored in the soil profile then those data need to be converted to a weight of
C per unit weight of soil in the profile. Determining soil bulk density to the depth of interest
enables the weight of soil in an area (usually 1 ha) to be calculated. This is combined with %C to
determine the amount of C stored in that volume of soil.
2.6 Characterising soil organic matter
Various methodologies to characterise soil organic matter have been used over the centuries
(Carter and Gregorich 1996). The complex and dynamic nature of organic matter composition
presents challenges for characterisation.
Most organic matter is in the form of complex aromatic (ring structured) and aliphatic (long chains
of condensed) polymers of high molecular weight that are not easily identified (Theng et al. 1989;
Baldock and Skjemstad, 1999). There is no single structure to soil organic matter because it is
derived from a wide range of complex biological compounds, and the organic matter has often
been reprocessed many times by soil organisms. Traditional organic matter classifications rely on
chemical or physical fractionation. For example, soil organic matter has often been separated
into fulvic acid, humic acid and humin fractions, depending on its solubility in water, alkali or acid
(Table 1.3). Carbon in the form of charcoal is found in many soils, it is not soluble, and is more
abundant where there has been regular burning of plant material.
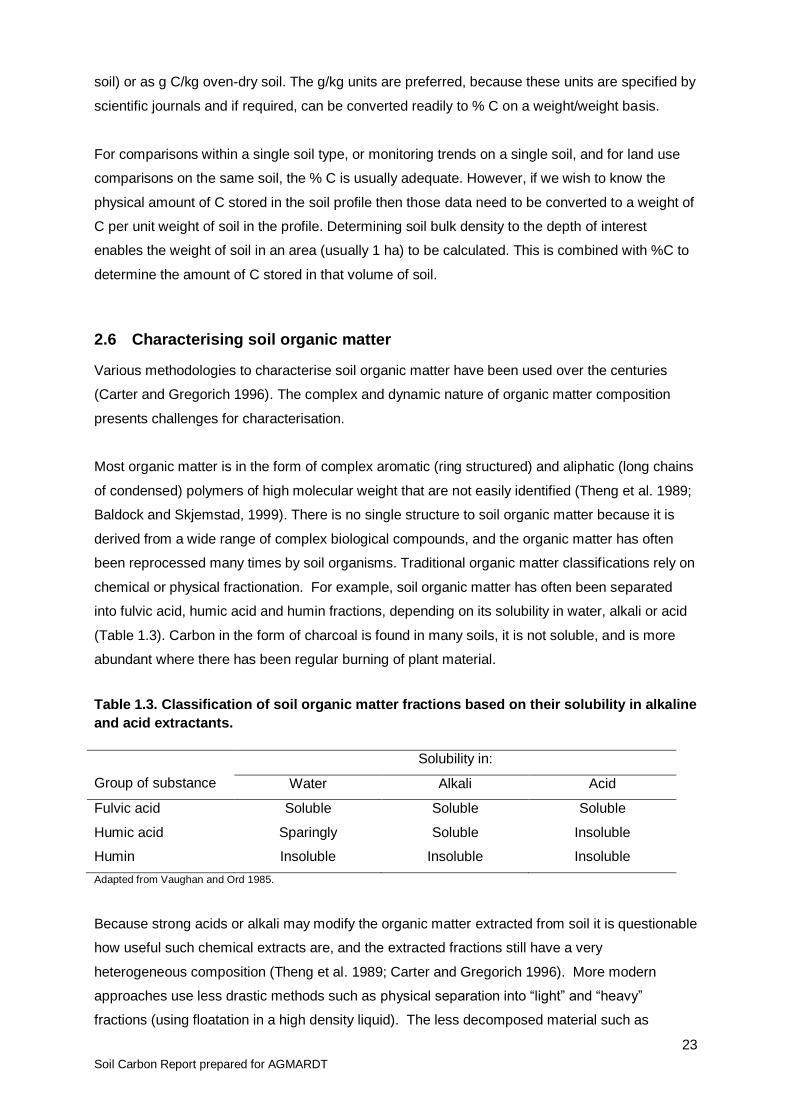
Table 1.3. Classification of soil organic matter fractions based on their solubility in alkaline
and acid extractants.
Group of substance
Solubility in:
Water Alkali Acid
Fulvic acid Soluble Soluble Soluble
Humic acid Sparingly Soluble Insoluble
Humin Insoluble Insoluble Insoluble
Adapted from Vaughan and Ord 1985.
Because strong acids or alkali may modify the organic matter extracted from soil it is questionable
how useful such chemical extracts are, and the extracted fractions still have a very
heterogeneous composition (Theng et al. 1989; Carter and Gregorich 1996). More modern
approaches use less drastic methods such as physical separation into ―light‖ and ―heavy‖
fractions (using floatation in a high density liquid). The less decomposed material such as
24
Soil Carbon Report prepared for AGMARDT
relatively fresh shoot and root material is generally ―light‖ and floats, whereas older, more highly
degraded material is comparatively ―heavy‖ often being bound to soil mineral particles (Carter and
Gregorich 1996). The ―light‖ material is generally more readily decomposed and contributes to
nutrient flows. Modern analytical methods using spectographs and techniques such as pyrolosis–
mass spectrography have revealed a huge range of compounds in addition to the long-chain
plant polymers of lignin and cellulose origin. Additional compounds include lipids (fats and
waxes), those containing nitrogen (amines and amides) and complexes of these constituents.
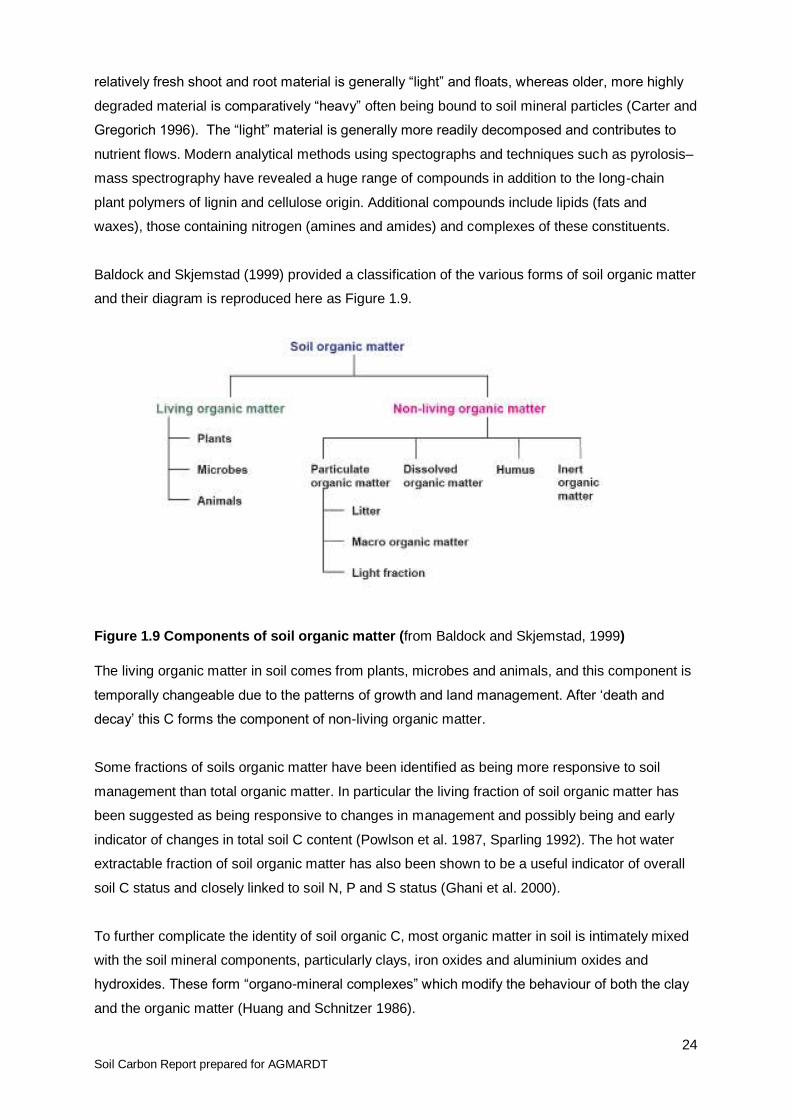
Baldock and Skjemstad (1999) provided a classification of the various forms of soil organic matter
and their diagram is reproduced here as Figure 1.9.
Figure 1.9 Components of soil organic matter (from Baldock and Skjemstad, 1999)
The living organic matter in soil comes from plants, microbes and animals, and this component is
temporally changeable due to the patterns of growth and land management. After ‗death and
decay‘ this C forms the component of non-living organic matter.
Some fractions of soils organic matter have been identified as being more responsive to soil
management than total organic matter. In particular the living fraction of soil organic matter has
been suggested as being responsive to changes in management and possibly being and early
indicator of changes in total soil C content (Powlson et al. 1987, Sparling 1992). The hot water
extractable fraction of soil organic matter has also been shown to be a useful indicator of overall
soil C status and closely linked to soil N, P and S status (Ghani et al. 2000).
To further complicate the identity of soil organic C, most organic matter in soil is intimately mixed
with the soil mineral components, particularly clays, iron oxides and aluminium oxides and
hydroxides. These form ―organo-mineral complexes‖ which modify the behaviour of both the clay
and the organic matter (Huang and Schnitzer 1986).
25
Soil Carbon Report prepared for AGMARDT
2.7 Climate change and soil carbon
At present, knowledge about the effect of climate change on soil organic matter is uncertain, and
may well vary in different parts of the world (Lal 2004). The key to understanding what the long-
term changes will occur as a consequence of climate change will be through knowledge of the
changes in the balances between the inputs and outputs from systems. Warmer temperatures
may increase plant growth, but they will also hasten decomposition. Higher atmospheric CO2 may
increase plant productivity. Drier conditions may inhibit both plant growth and decomposition. A
laboratory study by Conant et al. (2008) showed that changed soil temperature did not affect
organic matter uniformly. When soil was warmed, the more resistant and recalcitrant components
of soil organic matter showed a proportionally greater rate of decomposition. This may infer
proportionally greater losses from deeper parts of the soil profile if soil warming occurs.
2.8 Soil carbon and soil quality
Soil organic C is frequently advocated as a soil quality indicator (Doran et al. 1994; Gregorich and
Carter 1997). The justification is the beneficial effects soil organic matter has on modifying the
physical, chemical and biological characteristics and their potential benefits to production and to
the wider environment (see both earlier and later sections). In terms of C sequestration, if the
goal is to store greater amounts of C in soil then the quality target must be that ―more is better‖
and that the soil with greater organic C will be considered of greater quality.
However, the situation is not so clear when only production criteria are considered. While there
are many examples of greater productivity or improved crop quality on higher organic matter
soils, such benefits are by no means always obtained or even a desired target (see section on
horticultural soils). Sojka and Upchurch (1999) in reviewing the soil quality concept, point out that
on intensively managed soils the benefits of increased soil organic matter are not obvious. This is
because any benefits accruing from increased organic matter were masked by the interventions
from the land manager, in adding artificial fertilisers, irrigation, selecting tolerant plant varieties,
with timely cultivation, and use of pesticides to control weeds and pathogens. Sojka and
Upchurch (1999) point out that greater quantity of pesticide are used on higher organic matter
soils, due to the sorption of pesticide on to organic matter, reducing effectiveness.
The tenet ―More is better‖ is also not true for vineyard crops where better fruit quantity and quality
is frequently obtained by suitable management on very low organic matter soils (see discussion
later in this review). In those cases, it is generally the desire of the vineyard managers to keep the
soil organic C content lower rather than higher.

26
Soil Carbon Report prepared for AGMARDT
Even where soil organic C has been suggested as a quality indicator, it is rare that any specific
targets are specified. This is problematic because soils differ in their ability to store organic
matter, and achievable targets for each soil type need to be specified (Sparling et al. 2003a).
Further, it is not necessary for a soil to always maintain a minimum soil organic C content.
Sparling et al. (2003a) suggested that soil organic matter content could be considered
sustainable provided any period of depletion (say under cropping) was countered by a
compensating period of accumulation (say permanent pasture under a lenient grazing regime).
Sparling et al. (2003a) pointed out that the recovery period was invariably longer than the
depletion period, and suggested a 25 year cycle could be considered, the idea being that within
any 25 year period, the soil could be restored to 80% of its original content under long term
pasture. They selected 25 years because this would meet the criterion of ―intergenerational
equity‖ where one generation does not deplete a resource to the expense of the following
generation.
The target for soil organic C content for production criteria depends on the soil type and
land use, and needs to be specified for individual sites.
If it is accepted that a lower atmospheric CO2 content is a desired target for
environmental objectives, then the target for soils would be to increase C storage to the
maximum amount.
2.9 Sustaining the soils carbon
The battery analogy
When managing organic matter it may be useful to consider the organic matter in soil as a
battery. Different soils have different sized batteries. Typically volcanic ash (Allophanic) soils
have lots of organic matter and hence a large battery. Other soils have much less organic matter
(smaller batteries). However, if the low organic matter soils are managed well then the organic
matter content can be sustained. Think of the battery in a cell phone – it‘s only small compared to
that in a car. But so long as the cell phone battery is regularly recharged then it can continue to
be used and perform well. In contrast, a big battery will last a lot longer and hold heavier loads,
but once discharged it is a major exercise to get it recharged. It is the same with low organic C
soils, the organic C can generally be restored over 50-60 years (Table 1.4), but the Allophanic
soil will take 150 years (Sparling et al. 2003a).
Because C accumulation at the later stages of recovery becomes much slower (Parshotam and
Hewitt 1995; Sparling et al. 2003a), it is common to specify 80% or 90% of the maximum C
content as the target value. Even so, it will still take at least 20-30 years for soils depleted by
normal agricultural management to be restored to that lower target level (see Table 1.4).
Following topsoil loss through surface erosion, Sparling et al. (2003a) estimated that soil C
content of sites on Wairarapa mudstone where the topsoil had been lost through landslips, would
27
Soil Carbon Report prepared for AGMARDT
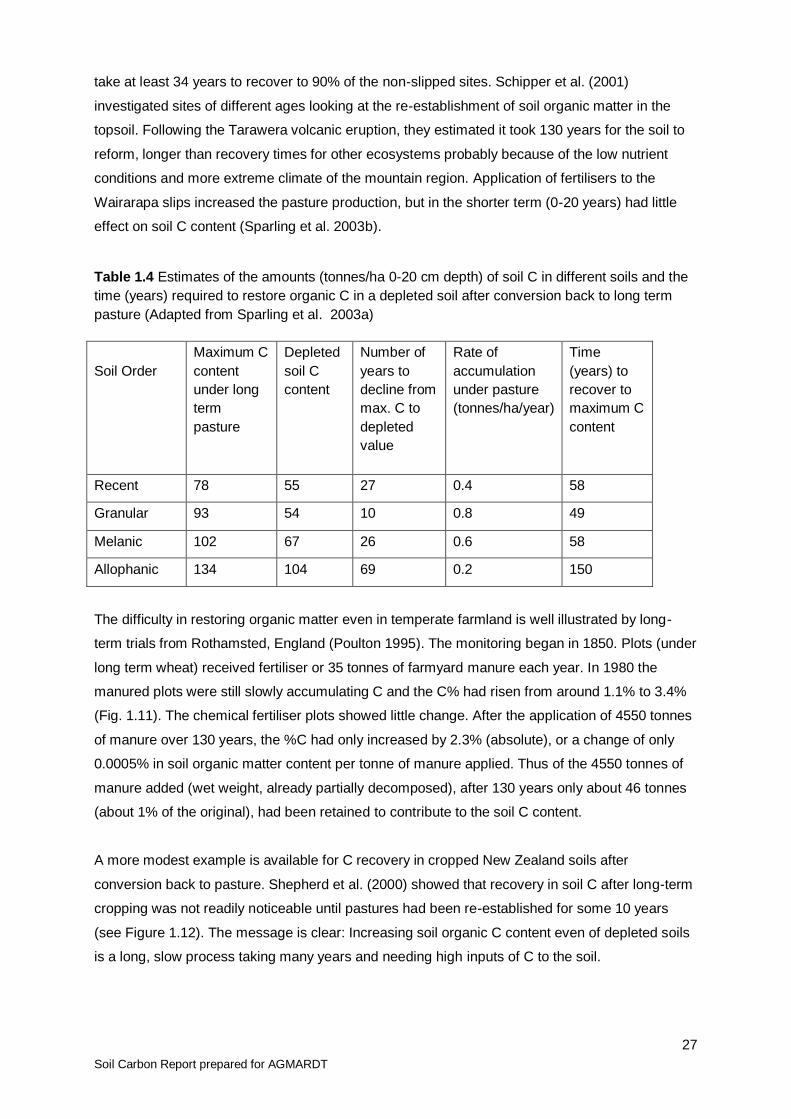
take at least 34 years to recover to 90% of the non-slipped sites. Schipper et al. (2001)
investigated sites of different ages looking at the re-establishment of soil organic matter in the
topsoil. Following the Tarawera volcanic eruption, they estimated it took 130 years for the soil to
reform, longer than recovery times for other ecosystems probably because of the low nutrient
conditions and more extreme climate of the mountain region. Application of fertilisers to the
Wairarapa slips increased the pasture production, but in the shorter term (0-20 years) had little
effect on soil C content (Sparling et al. 2003b).
Table 1.4 Estimates of the amounts (tonnes/ha 0-20 cm depth) of soil C in different soils and the
time (years) required to restore organic C in a depleted soil after conversion back to long term
pasture (Adapted from Sparling et al. 2003a)
Soil Order
Maximum C
content
under long
term
pasture
Depleted
soil C
content
Number of
years to
decline from
max. C to
depleted
value
Rate of
accumulation
under pasture
(tonnes/ha/year)
Time
(years) to
recover to
maximum C
content
Recent 78 55 27 0.4 58
Granular 93 54 10 0.8 49
Melanic 102 67 26 0.6 58
Allophanic 134 104 69 0.2 150
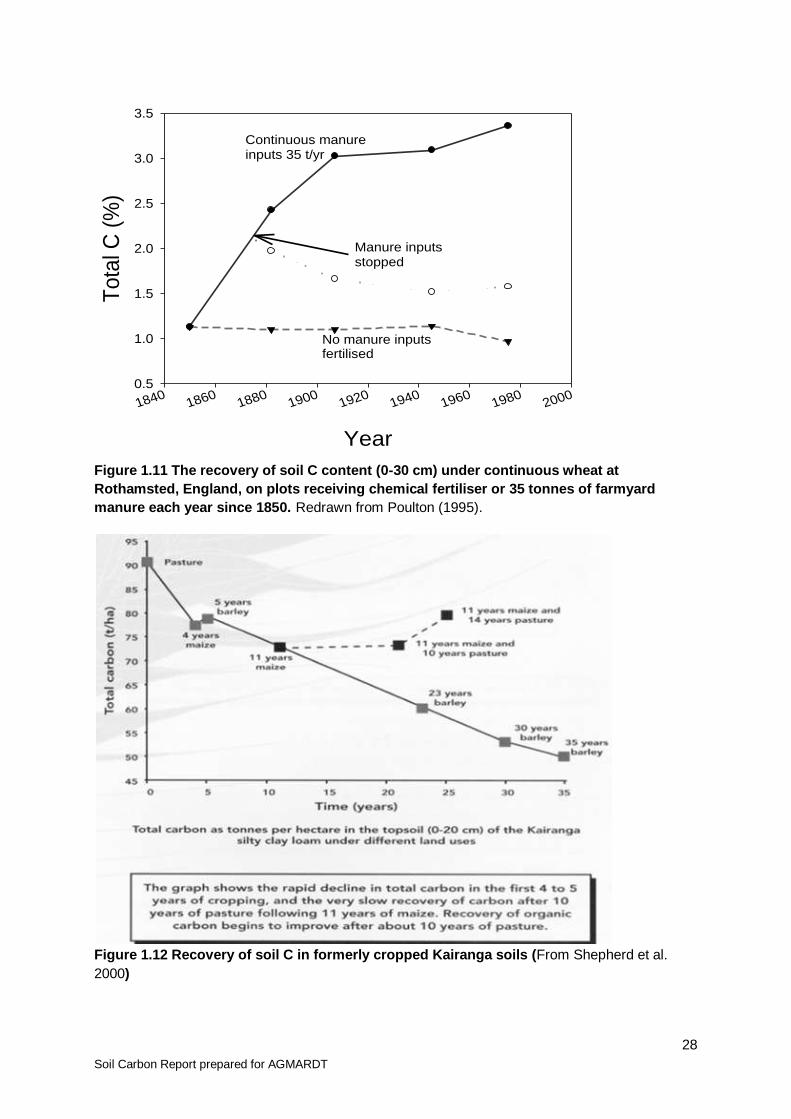
The difficulty in restoring organic matter even in temperate farmland is well illustrated by long-
term trials from Rothamsted, England (Poulton 1995). The monitoring began in 1850. Plots (under
long term wheat) received fertiliser or 35 tonnes of farmyard manure each year. In 1980 the
manured plots were still slowly accumulating C and the C% had risen from around 1.1% to 3.4%
(Fig. 1.11). The chemical fertiliser plots showed little change. After the application of 4550 tonnes
of manure over 130 years, the %C had only increased by 2.3% (absolute), or a change of only
0.0005% in soil organic matter content per tonne of manure applied. Thus of the 4550 tonnes of
manure added (wet weight, already partially decomposed), after 130 years only about 46 tonnes
(about 1% of the original), had been retained to contribute to the soil C content.
A more modest example is available for C recovery in cropped New Zealand soils after
conversion back to pasture. Shepherd et al. (2000) showed that recovery in soil C after long-term
cropping was not readily noticeable until pastures had been re-established for some 10 years
(see Figure 1.12). The message is clear: Increasing soil organic C content even of depleted soils
is a long, slow process taking many years and needing high inputs of C to the soil.
28
Soil Carbon Report prepared for AGMARDT
Figure 1.11 The recovery of soil C content (0-30 cm) under continuous wheat at
Rothamsted, England, on plots receiving chemical fertiliser or 35 tonnes of farmyard
manure each year since 1850. Redrawn from Poulton (1995).
Figure 1.12 Recovery of soil C in formerly cropped Kairanga soils (From Shepherd et al.
2000)
Year
18401860
18801900
19201940
19601980
2000
Tota
l C (
%)
0.5
1.0
1.5
2.0
2.5
3.0
3.5
Continuous manure inputs 35 t/yr
Manure inputs stopped
No manure inputsfertilised

29
Soil Carbon Report prepared for AGMARDT
2.10 Why is it so difficult to increase the soil carbon content over the long
term?
Most organic matter inputs decompose to gas as CO2 very quickly and do not become
incorporated into soil organic C (but see Sections on charcoal and biochar). Saggar et al. (1996)
and Parshotam et al. (2000) measured the decomposition and retention of ryegrass clippings in a
variety of NZ soils and found that in all cases, more than 50% of the added ryegrass C was
decomposed to CO2 within two months. This is consistent with overseas results. Very large
amounts of organic matter need to be added to soil to increase the remaining organic C content
in the longer term. These authors calculated the mean residence times of the added ryegrass to
be around 1-2 years, with the mean controlling variables being the amount and type of clay,
particularly the surface area of the clay and environmental factors particularly temperature and
moisture at the various sites around New Zealand. Soils with higher clay content with a high
surface area retained more of the added organic matter, as did those soils on the colder drier
sites as decomposition was slowed. However, considering the contrasting soils and climates
studied, there was remarkably little difference in the patterns of decomposition.
30
Soil Carbon Report prepared for AGMARDT
3. Carbon cycling in grassland/pasture systems
Summary
Pasture and grassland soils contain one of the highest quantities of C stock on the planet. Nearly
1/3 of the terrestrial C stock is stored in pasture and grassland soil therefore, internationally; it is
one of the preferred land use change options for improving sequestration of C in soils. Native
rangeland and grasslands generally contain only small amounts of soil C (1-5%) and so tend to
respond positively in terms of C sequestration to inputs such as fertilisers, irrigation and grazing
in the short to medium term. In comparison most land under pastoral agriculture in New Zealand
is relatively higher in organic matter (3-15% C) reflecting its initial soil development under a
forestry ecosystem and the maintenance of that organic matter content as part of pasture
management through inputs such as legumes, fertiliser, grazing, drainage and irrigation.
Therefore great care must be taken in extrapolating the C sequestration potential from native
grasslands and rangelands of other countries, to the potential C sequestration rates in New
Zealand pastures. Recent study in New Zealand indicates that in intensive lowland livestock
systems soils have lost C over the last approximately 2 decades, while in hill land soil C has
increased. Both of these current observations were unexpected, and further work is required to
identify the reasons for the measured losses of soil C under intensive livestock farming, to
establish if the losses are ongoing and explore options to arrest any more decline in soil C. The
challenge on many of our intensively farmed lowland soils might be to retain existing soil C levels,
while in hill land there may be still some opportunity to increase soil C levels. There are soils in
flat and rolling landscapes (i.e. recent soils, sands, gravels, pumice and semi-arid soils under
irrigation) which may still accumulate soil C under more intensive land uses.
Suggestions for increasing soil carbon under pastoral agriculture
The key to increasing the organic matter in soil is to ensure more carbon is being added than is lost. Practices that increase organic carbon additions, or reduce organic carbon losses, enhance soil organic carbon matter levels.
On most New Zealand soil types, the challenge in pasture systems is preventing the loss of
generally high soil carbon contents rather than increasing soil carbon levels.
To increase soil C inputs: Encourage organic matter recycling
Apply organic farm wastes, such as dairy-shed effluent, herd home and feed pad organic wastes
Add biochar, compost (humus), supplementary feeds and plant residues
Increase Biomass inputs
Maximise pasture growth (e.g. ensure adequate nutrients, grazing practice, etc) to help maximise carbon capture.
31
Soil Carbon Report prepared for AGMARDT
3.1 Soil carbon in grassland and pasture soil – A global view
Grasslands store approximately 34% of the global stock of C in terrestrial ecosystems while
forests store approximately 39% and agro-ecosystems approximately 17% (IPCC 2000). Unlike
forests, where vegetation is the primary source of C storage, most of the grassland C stocks are
in the soil. Areas converted from cultivation and maintained under grassland, rangeland or
managed as pastures have shown considerable potential to remain a long-term sink of C. Most of
the long-term increase in soil C measured under pasture land use is mainly in soils that initially
had low soil C contents (Conant et al. 2001). In these situations, better management including
fertilisation, irrigation, grazing management and sowing of better cultivars and introduction of
legumes, had positive effects on C sequestration into the soils organic matter fraction (e.g. Rixon
1966; Watson 1963; Metherell 2002; Conant et al. 2001).
There is considerable interest in the influence of land management practices on soil organic C in
New Zealand under pastoral land use. A key question is whether soil C is declining on pastoral
land. If it is, what are the implications for New Zealand under our climate change commitments
reporting soil C stock as per Intergovernmental Panel on Climate Change (IPCC) article 3.4 and
Remove management practices that restrict legume growth and nitrogen fixation to help maximise pasture growth.
Avoid water deficits by irrigation to increase pasture growth and carbon inputs. Irrigation may also increase the decomposition rate of organic matter
Reduce grazing pressure (at the extreme use pasture fallow) to increase carbon capture and potential carbon inputs into the soil.
Eliminate soil physical conditions that limit root and shoot growth (e.g., livestock treading and compaction) as these will reduce pasture growth and C inputs
Adopt practices that encourage deeper root growth. This creates a larger volume in which carbon is actively stored, with the potential to increase the amount of carbon stored.
Explore the influence of pasture type and the inclusion of tree pasture systems on C inputs
To reduce soil Carbon losses:
Minimise erosion
Reduce the risk of soil erosion and direct loss of soil and organic matter from the large tracts of hill land susceptible to soil erosion. Most of the organic matter is stored in the topsoil which is easily lost during high rainfall events.
Encourage growth of permanent species, especially trees with under-storey, on land with marginal capacity to sustain a pasture sward
Minimise soil degradation
Avoid soil damage and compaction and the loss of biological activity
Minimise leaching
Manage irrigation to minimise leaching of nutrients and dissolved organic carbon. Optimum irrigation also maximises root development and increases organic matter.
Manage decomposition rates
Encourage soil organisms (worms and insects etc) to enhance the burial and incorporation of plant litter into soil aggregates. Until buried and incorporated into soil aggregates the C in plant litter is susceptible to decomposition and loss in microbial respiration.

32
Soil Carbon Report prepared for AGMARDT
what are the long-term implications to the wide range of soil services linked very closely to soil C?
Are current farming practices sustainable in maintaining soil C stocks in New Zealand?
Pasture is the dominant land use in New Zealand with grasslands accounting for over 50% of the
soil organic C stocks (Table 1.2, Tate et al., 2005). Small changes in pasture land C density
could be significant in relation to our Kyoto Protocol commitments (Baisden et al., 2001) and a
range of ecosystem services.
3.2 Carbon cycle in grazed pastures
The pastoral C cycle includes a large number of fluxes, including photosynthesis and respiration
by pasture plants, pasture senescence and root death, animal consumption, pasture conservation
and animal supplementation, respiration and methanogenesis by ruminant animals, animal
excretion, organic matter decomposition, microbial and macro-faunal consumption and
respiration, mineralisation and immobilisation of soil organic matter, and leaching of dissolved
organic matter (Figure 2.1). The level of soil organic C is determined by the overall balance of
the C inputs and outputs. Under a stable environment and management regime, C inputs and
outputs will become similar and soil organic C levels will trend to quasi-steady state levels (Cole
et al. 1993, Saggar et al. 1997).
A large number of pasture and soil management and environmental factors including moisture,
temperature, fertiliser inputs, irrigation, and cultivation and grazing intensities affect C inputs and
the turnover rates of the C cycle and stabilisation of soil organic matter. The net effect of these
factors on soil C storage and the rate of storage depend on the baseline C contents in soils.
Pasture production is the primary source of C inputs. Net primary production (NPP), which is
defined as the net flux of C from the atmosphere into green plants per unit time or the balance of
photosynthesis minus respiration, in pastures will be affected by light interception, moisture,
nutrients, temperature and plant genetics (Metherell et al. 2008). Grazing management,
irrigation, fertiliser, pasture species and weed and pest control will all affect these factors which
drive net primary production.

33
Soil Carbon Report prepared for AGMARDT
Figure 2.1 Input and output fluxes of C in grazed pasture.
In addition, these same management factors will affect the allocation of C above and below
ground. These effects are very important as root C inputs are a major contributor to soil organic
C (Stewart and Metherell 1999). The effects of moisture, fertility and grazing management on C
allocation have been demonstrated in New Zealand pasture ecosystems (Saggar et al. 1997;
Stewart and Metherell 1999; Metherell 2002). Plants have a proportionately greater allocation of
C to roots in dry and low fertility environments and with high grazing intensity and continuous
grazing. Plant components other than roots also contribute to below-ground production. In a
grazed pasture, tillers and stolons are frequently buried by treading or earthworm activity
(Matthew et al. 1989). Hay et al. (1983) found 95% of white clover stolons were buried in early
spring.
In intensive pastoral systems a greater proportion of net primary production is consumed by
animals, with more of the organic matter returning as dung. Pasture utilisation also determines
how much above ground production senesces and contributes to the plant litter pools. It will also
have an impact on root turnover (Matthew et al, 1986) and subsequent pasture production.
Moisture, nutrients, grazing management and pasture species all affect litter quality (Metherell
2002) which impacts on decomposition processes. Only a small proportion of C consumed
contributes directly to animal production. Most of the C consumed by animals is respired as CO2
34
Soil Carbon Report prepared for AGMARDT
or lost as methane. The indigestible component, primarily dependent on pasture quality, is
excreted as dung, a significant contributor to the litter pools.
Soil organic matter is a heterogeneous mixture of organic pools with different physical and
chemical properties, and turnover rates. Within soil the decomposition of litter, roots and dung,
and the mineralisation of soil organic matter are all mediated by micro-organisms and macro-
fauna with losses of C as CO2 or sometimes methane. Irrigation, fertiliser, drainage, grazing
management and cultivation all impact on the soil conditions which affect the turnover rates, C
losses and stabilisation of C in the soil. The rate of microbial activity will be greatest when the soil
moisture is maintained near to field capacity, while a high fertility status will remove nutrient
limitations to microbial activity. Grazing may result in soil compaction or pugging which changes
soil aeration and moisture relationships, which in turn affect microbial activity. It also impacts
negatively on macro- and meso-fauna, important in the removal and incorporation of plant litter
from the soil surface into the soil and with the mixing of the litter with the mineral soil. Cultivation
will reduce the physical protection of soil organic matter in soil aggregates, thereby increasing the
rate of mineralisation.
Dissolved organic matter losses are greatest under dung and urine spots and are likely to
increase with stocking rate (Ghani et al. 2007). Poor draining soils tend to lose more dissolved C
through leaching because anaerobic conditions results in the production of more soluble C which
can be lost through leaching beyond the active root zone. In lysimeter studies, 400-1000 kg
C/ha/yr of leaching losses of DOC have measured by Ghani et al. (2008a).
3.3 What are the levels of soil carbon in temperate pastures?
In temperate regions, grasslands and well managed pastures have one of the highest stocks of
soil C in the top 100-200 mm soil (Conant et al. 2001). The level of C under pasture is generally
higher than under most other land uses (Table 2.1). This is because soil C levels are generally
greatest under long term pasture, the most productive pastures are generally on volcanic ash
(Allophanic) soils that are naturally high in organic C, and pastures are only cultivated
occasionally. Note from Table 1.2 that the amount of C in pasture soils is not far different from
indigenous forest soils. This suggests that many NZ pasture soils may be near their maximum
capacity to store C.
The net accumulation rate of C in pasture soils is dependent on the net inputs minus removal of C
in products and loss of C through decomposition processes. The net accumulation rate of C in
soil depends on the base values of C in soils when land use change occurs to pastoral
agriculture. Based on a number of published results from around the world, Lal (2004) suggested
conversion of marginal land and underdeveloped rangeland in both tropical and temperate
35
Soil Carbon Report prepared for AGMARDT
regions as a means of accumulating soil C. There is a limited opportunity in NZ on soils with low
initial soil C levels (Fig. 1.3) under the right management conditions
3.4 Soil carbon changes, turnover and half-life in NZ pastures
O‘Brien and Stout (1977) estimated the average age of soil organic C in the whole profile of the
Judgeford pasture soil to be around 1500 years with an average turnover time of around 70
years. They fractionated the organic matter into ―old‖ and ―modern‖ components. The old C had
been in the soil for thousands of years, whereas the modern C was less than 100 years old. The
old C (about 16% of the total) was distributed evenly through the soil profile (to 94 cm), whereas
the modern C was concentrated in the surface layers of soil and decreased exponentially with
depth. This is the expected pattern if the modern C was derived after conversion of the old growth
forest to pasture. The modern C moved down the soil profile at some 13 cm per year, a mixture of
diffusivity of soluble components and mixing of the soil by earthworms.
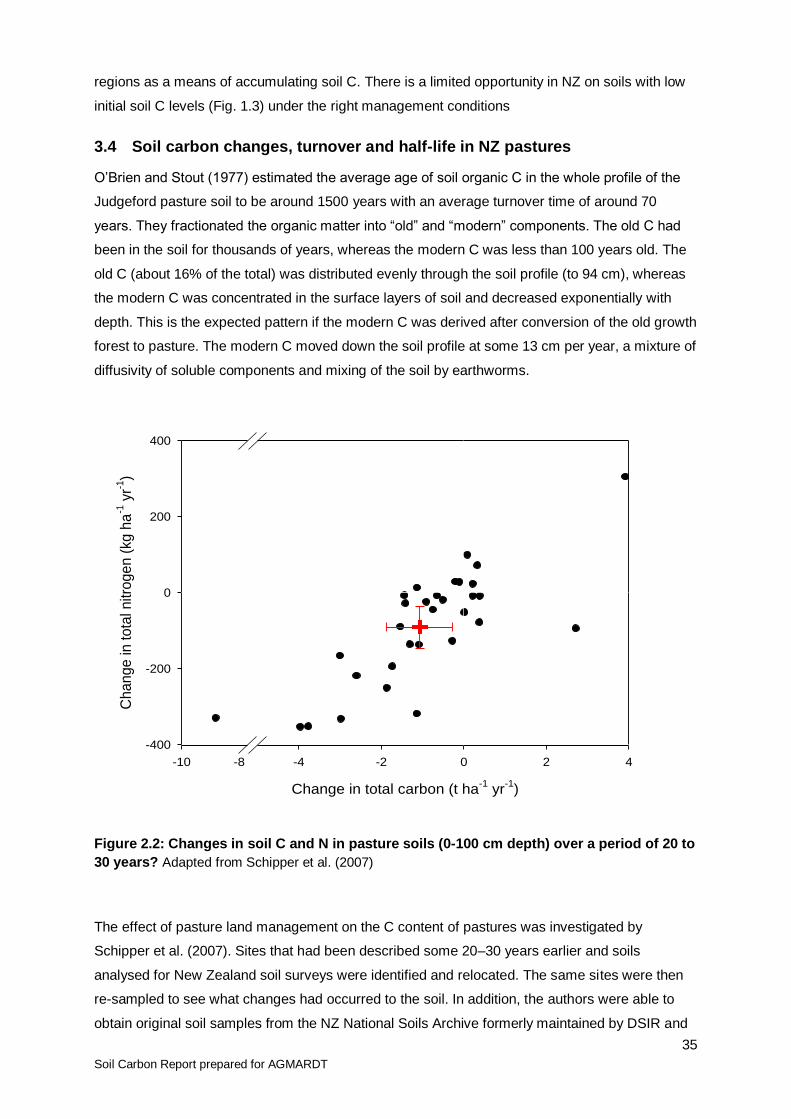
Figure 2.2: Changes in soil C and N in pasture soils (0-100 cm depth) over a period of 20 to
30 years? Adapted from Schipper et al. (2007)
The effect of pasture land management on the C content of pastures was investigated by
Schipper et al. (2007). Sites that had been described some 20–30 years earlier and soils
analysed for New Zealand soil surveys were identified and relocated. The same sites were then
re-sampled to see what changes had occurred to the soil. In addition, the authors were able to
obtain original soil samples from the NZ National Soils Archive formerly maintained by DSIR and
Change in total carbon (t ha-1
yr-1
)
-10 -8 -4 -2 0 2 4
Ch
an
ge
in
to
tal n
itro
ge
n (
kg
ha
-1 y
r-1)
-400
-200
0
200
400
36
Soil Carbon Report prepared for AGMARDT
currently by Landcare Research. By re-analyzing the archive soil samples the researchers were
able to avoid any systematic differences caused by changed laboratory methods in the
intervening years. On average the soils had lost 2.1 kg-C m-2
since the initial sampling. This
translates to a linearly interpolated loss rate of 106 g-C m-2
yr-1
, or about 1 t-C ha-1
yr-1
(Figure
2.2).
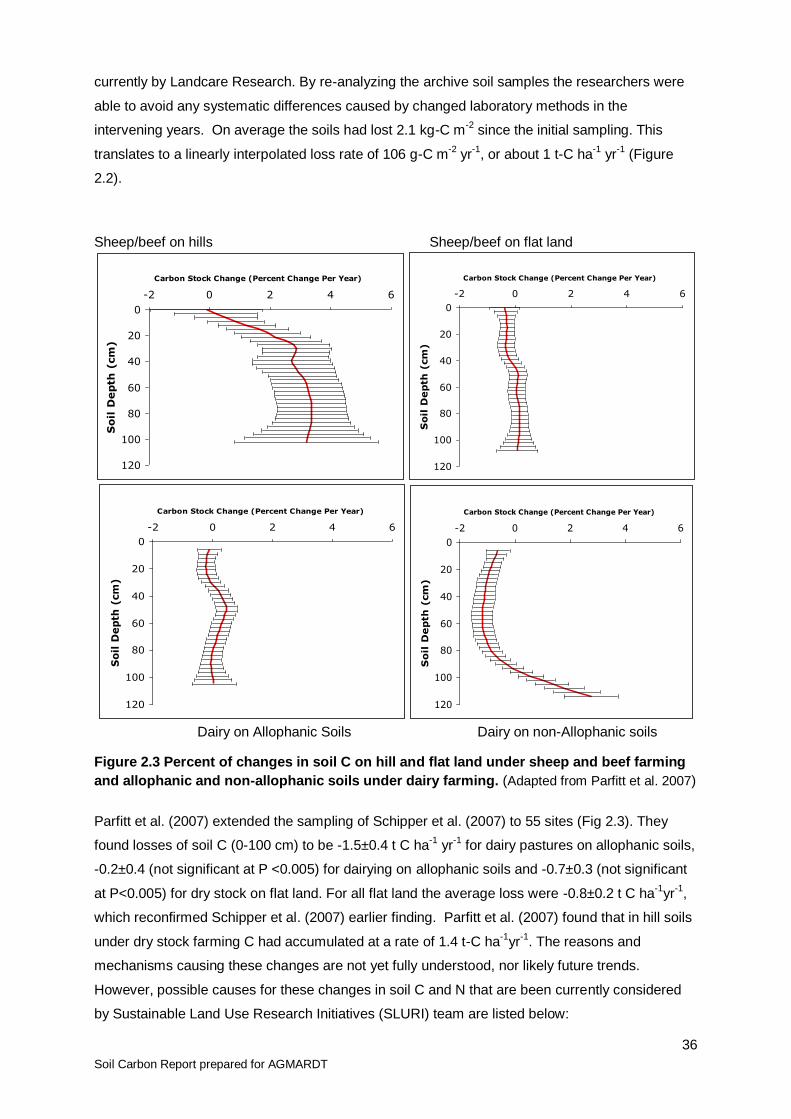
Sheep/beef on hills Sheep/beef on flat land
Dairy on Allophanic Soils Dairy on non-Allophanic soils
Figure 2.3 Percent of changes in soil C on hill and flat land under sheep and beef farming
and allophanic and non-allophanic soils under dairy farming. (Adapted from Parfitt et al. 2007)
Parfitt et al. (2007) extended the sampling of Schipper et al. (2007) to 55 sites (Fig 2.3). They
found losses of soil C (0-100 cm) to be -1.5±0.4 t C ha-1
yr-1
for dairy pastures on allophanic soils,
-0.2±0.4 (not significant at P <0.005) for dairying on allophanic soils and -0.7±0.3 (not significant
at P<0.005) for dry stock on flat land. For all flat land the average loss were -0.8±0.2 t C ha-1
yr-1
,
which reconfirmed Schipper et al. (2007) earlier finding. Parfitt et al. (2007) found that in hill soils
under dry stock farming C had accumulated at a rate of 1.4 t-C ha-1
yr-1
. The reasons and
mechanisms causing these changes are not yet fully understood, nor likely future trends.
However, possible causes for these changes in soil C and N that are been currently considered
by Sustainable Land Use Research Initiatives (SLURI) team are listed below:
0
20
40
60
80
100
120
-2 0 2 4 6
Carbon Stock Change (Percent Change Per Year)
So
il D
ep
th (
cm
)
0
20
40
60
80
100
120
-2 0 2 4 6
Carbon Stock Change (Percent Change Per Year)
So
il D
ep
th (
cm
)
0
20
40
60
80
100
120
-2 0 2 4 6
Carbon Stock Change (Percent Change Per Year)
So
il D
ep
th (
cm
)
0
20
40
60
80
100
120
-2 0 2 4 6
Carbon Stock Change (Percent Change Per Year)
So
il D
ep
th (
cm
)
37
Soil Carbon Report prepared for AGMARDT
1. Enhanced C leaching and degradation occur in concentrated zones of urine deposition.
2. Intensified N cycling increases N losses, and N is required to store C at fixed C:N ratios.
3. Below-ground allocation of C and N has decreased.
4. Leaching of dissolved organic matter is increasing.
5. Grazing harvest has increased, carrying C and/or N off site.
6. Change in plant, faunal and microbial numbers and species (diversity) and functional
groups responsible for litter removal and incorporation into the soils profile.
7. Macroporosity is being lost, affecting the C cycle.
8. Climate change has enhanced soil respiration more than C inputs.
9. Overland erosion.
10. Physical disturbance (cultivation, renovation or pugging) associated with maintaining and
increasing biomass production to support intensification of livestock systems
Four of the possible mechanisms (1, 3, 4, 6) could help explain some of the recent observed
changes in the C stock on pasture soils are being investigated by the SLURI research teams
within New Zealand.
3.5 Effects of livestock on soil carbon
There is very little published information on the impact of animal grazing on soil C stocks in
permanent pastures. In most situations, intensive grazing may lead to either a potential gain, no
change or net decline in the soil C stocks (Bruce et al. 1999).
Total C fixed through photosynthetic processes in pasture plants equates to approximately 40%
of total dry matter (DM). In a pasture with an annual yield of e.g. 10t DM ha-1
yr-1
(i.e. 10t DM
harvested as intake by animals), the amount of C harvested is therefore c. 4t C ha-1
yr-1
. The total
amount of C fixed from the atmosphere in photosynthesis is considerable, and has been
measured e.g. as c. 16t C ha-1
yr-1
, of which some 40-50% (6.4-8t C ha-1
yr-1
) is returned to the
atmosphere in plant respiration. This includes the respiration involved in the synthesis of shoot
and the maintenance of shoot tissues. This figure also includes respiration from the synthesis and
maintenance of roots (some of which is expended via the shoot). Of the remaining c.8t C ha-1
yr-1
(‗NPP‘ or ‗gross tissue production‘) in new shoot and root tissues, only about 50% is typically
harvested (hence the 4tC ha-1
yr-1
harvested), and the remainder of the plant tissues turnover and
senesce to form shoot and root litter. Shoot and root litter contribute C ultimately to either
respiration from the soil (and soil surface), from the microbes that consume the litter, or contribute
to a potential increase in C sequestered in the soil. Management (both fertiliser inputs and/or
changes in grazing intensity) alter all of these fluxes. In general, increasing the intensity of
utilisation (e.g. increasing stocking rate per se) will reduce all the fluxes, simply because it
reduces vegetation cover (leaf area and so photosynthesis) although there is an optimum grazing
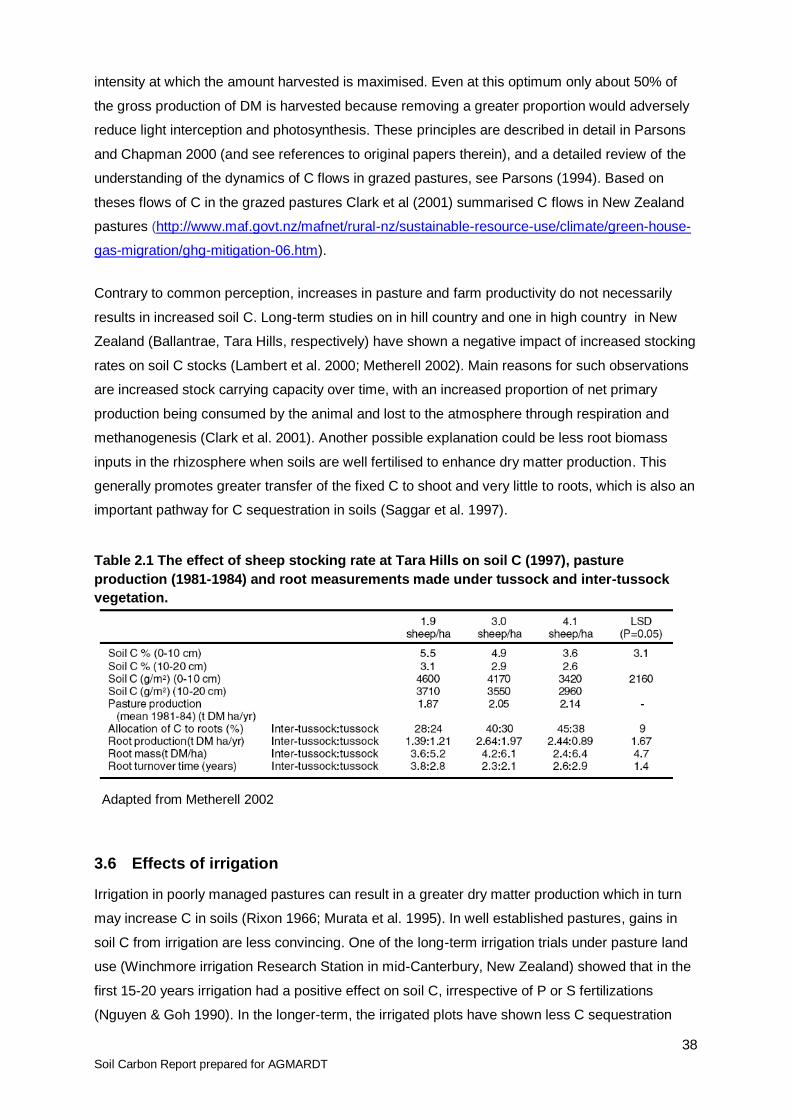
38
Soil Carbon Report prepared for AGMARDT
intensity at which the amount harvested is maximised. Even at this optimum only about 50% of
the gross production of DM is harvested because removing a greater proportion would adversely
reduce light interception and photosynthesis. These principles are described in detail in Parsons
and Chapman 2000 (and see references to original papers therein), and a detailed review of the
understanding of the dynamics of C flows in grazed pastures, see Parsons (1994). Based on
theses flows of C in the grazed pastures Clark et al (2001) summarised C flows in New Zealand
pastures (http://www.maf.govt.nz/mafnet/rural-nz/sustainable-resource-use/climate/green-house-
gas-migration/ghg-mitigation-06.htm).
Contrary to common perception, increases in pasture and farm productivity do not necessarily
results in increased soil C. Long-term studies on in hill country and one in high country in New
Zealand (Ballantrae, Tara Hills, respectively) have shown a negative impact of increased stocking
rates on soil C stocks (Lambert et al. 2000; Metherell 2002). Main reasons for such observations
are increased stock carrying capacity over time, with an increased proportion of net primary
production being consumed by the animal and lost to the atmosphere through respiration and
methanogenesis (Clark et al. 2001). Another possible explanation could be less root biomass
inputs in the rhizosphere when soils are well fertilised to enhance dry matter production. This
generally promotes greater transfer of the fixed C to shoot and very little to roots, which is also an
important pathway for C sequestration in soils (Saggar et al. 1997).
Table 2.1 The effect of sheep stocking rate at Tara Hills on soil C (1997), pasture
production (1981-1984) and root measurements made under tussock and inter-tussock
vegetation.
Adapted from Metherell 2002
3.6 Effects of irrigation
Irrigation in poorly managed pastures can result in a greater dry matter production which in turn
may increase C in soils (Rixon 1966; Murata et al. 1995). In well established pastures, gains in
soil C from irrigation are less convincing. One of the long-term irrigation trials under pasture land
use (Winchmore irrigation Research Station in mid-Canterbury, New Zealand) showed that in the
first 15-20 years irrigation had a positive effect on soil C, irrespective of P or S fertilizations
(Nguyen & Goh 1990). In the longer-term, the irrigated plots have shown less C sequestration
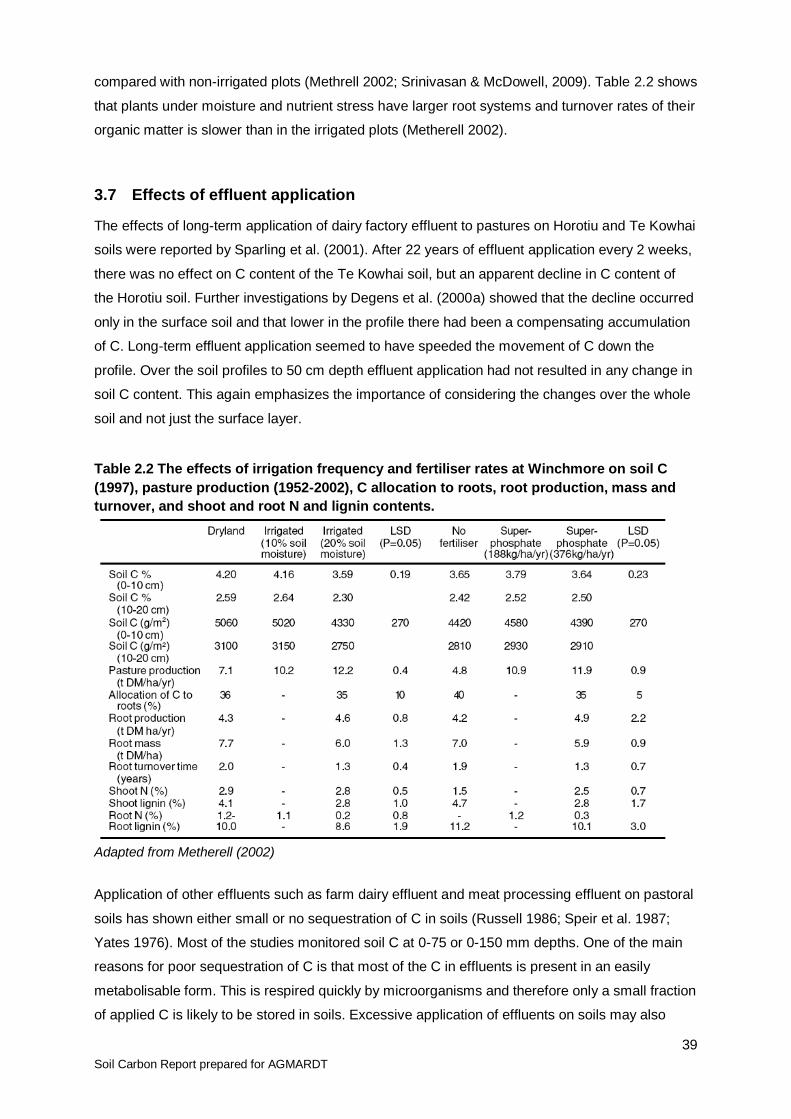
39
Soil Carbon Report prepared for AGMARDT
compared with non-irrigated plots (Methrell 2002; Srinivasan & McDowell, 2009). Table 2.2 shows
that plants under moisture and nutrient stress have larger root systems and turnover rates of their
organic matter is slower than in the irrigated plots (Metherell 2002).
3.7 Effects of effluent application
The effects of long-term application of dairy factory effluent to pastures on Horotiu and Te Kowhai
soils were reported by Sparling et al. (2001). After 22 years of effluent application every 2 weeks,
there was no effect on C content of the Te Kowhai soil, but an apparent decline in C content of
the Horotiu soil. Further investigations by Degens et al. (2000a) showed that the decline occurred
only in the surface soil and that lower in the profile there had been a compensating accumulation
of C. Long-term effluent application seemed to have speeded the movement of C down the
profile. Over the soil profiles to 50 cm depth effluent application had not resulted in any change in
soil C content. This again emphasizes the importance of considering the changes over the whole
soil and not just the surface layer.
Table 2.2 The effects of irrigation frequency and fertiliser rates at Winchmore on soil C
(1997), pasture production (1952-2002), C allocation to roots, root production, mass and
turnover, and shoot and root N and lignin contents.
Adapted from Metherell (2002)
Application of other effluents such as farm dairy effluent and meat processing effluent on pastoral
soils has shown either small or no sequestration of C in soils (Russell 1986; Speir et al. 1987;
Yates 1976). Most of the studies monitored soil C at 0-75 or 0-150 mm depths. One of the main
reasons for poor sequestration of C is that most of the C in effluents is present in an easily
metabolisable form. This is respired quickly by microorganisms and therefore only a small fraction
of applied C is likely to be stored in soils. Excessive application of effluents on soils may also
40
Soil Carbon Report prepared for AGMARDT
result in leaching losses of dissolved nutrients and dissolved organic C. Most of the effluent
studies were relatively short-term and were designed to capture water and nutrients from
effluents and not specifically designed to monitor C sequestration in soils. In most cases
observations were made over 2-5 years which is a relatively short-term observation period in the
context of observing significant differences in C levels in soils that have large background levels
of native C.
3.8 Effects of fertilisers
There are a number of studies predominantly under rangeland and poorly managed grassland
land use that have shown increases in soil C in the early stages of development with increased
fertiliser inputs, resulting from increased productivity (Conant et al. 2001). However, in well
managed long-term temperate New Zealand pastures, opportunities for increasing C
sequestrations through fertiliser inputs and increased productivity are limited.
Supplementary data on fertiliser input history from 14 of the lowland dairy pastures in the
Schipper et al. (2007) study (Fig 2.4) showed no significant relationship between the amount of N
or P input and the observed changes in soil C and N, suggesting that fertiliser input was not a
factor driving the observed decadal changes. Greater fertiliser inputs result in less translocation of
photosynthetic C to roots (Stewart and Metherell, 1999; Saggar et al. 1997) which is important
given that root biomass and root exudates are important inputs of C to soils that result in
sequestration of C. Greater fertiliser inputs are generally also associated with increased stocking
rates, having the effect of mitigating greater net primary production as shown in the previous
section.

41
Soil Carbon Report prepared for AGMARDT
Fig. 2.4 Relationship between N and P fertiliser inputs and decadal soil C and N changes in
dairy pastures (provided by M. Dodd 2009 – personal communication)
3.9 Effects of drainage of wetlands
Of the 5 million ha with slopes <12° in New Zealand, 2 million ha are poorly (water at or near the
surface for extended periods) or imperfectly (soils remain wet for extended periods) drained. The
purpose of drainage is to assist the soil remove water found in large pores (>30 µm) quickly after
rainfall. There are remarkably few data on the long-term effects of drainage on soil C levels.
There is evidence from overseas to show that drainage of wetlands results in a decline in soil C
levels (Sigua et al. 2004). Draining wetlands could lead to significant losses of C (400-1800 kg
C/ha) in dissolved organic form in the drained water (Ghani et al. 2008a).
42
Soil Carbon Report prepared for AGMARDT
Some of the early experiences in this country with the drainage of peats and before the
introduction of water table control found that the loss of large amounts of organic matter following
the drainage of peat soils was not uncommon. The impact of drainage on soil C depends on the
initial soil C content. In some soils drainage, by improving aeration and biological activity could
cause a decline in soil C, while in others soils drainage, by improving plant production and rooting
depth may result in greater C sequestration.
3.10 Effects of farm systems (organic, biodynamic, conventional)
Organic agriculture is advanced as a viable and sustainable option that reduces the
environmental impacts of agricultural practices, and provides ―clean, green‖ produce to the
population. Despite the continued interest in the potential opportunities from increased certified
organic production from all primary sectors, with the current demand for organic milk and lamb
beyond the current organic supply base, only a very small percentage (<1%) of New Zealand‘s
pastoral agricultural land is under organic management.
The majority of published literature on the performance of organic livestock systems is drawn
from comparisons of commercial farming operations (e.g. Kristensen and Kristensen, 1998; Ogini
et al. 1999, Richardson and Richardson 2006, ARGOS), or from units established on research
facilities that are compared with the industry standard (MacNaeidhe and Fingleton, 1997). Few
robust livestock-systems studies, comparing organic systems under controlled experimental
conditions, have been undertaken (Kristensen and Kristensen, 1998, Mackay et al. 2006, Kelly et
al. 2008).
Characteristics of an organic pastoral system include an emphasis on a legume-based pasture
forage supply base, enhanced soil biological activity, crop rotations, mixed livestock, nutrient
inputs limited to the use of natural unprocessed products (i.e. reactive phosphate rocks), strict
limits on imported feeds from beyond the farm gate, and a probation on the routine use of
drenches, vaccines, antibiotics, dips and other chemical remedies unless an individual animal
suffers or shows signs of ill thrift. Under organic production specifications soil health is predicted
to be improved, reflected in greater amounts of SOM, biological activity, and greater resilience to
pests and extremes of climate. Increases in SOM and enhanced activity of soil invertebrates
including earthworms, mesofauna and nematodes, result in benefits to soil services such as
nutrient cycling (Cole et al. 2004; Fonte et al. 2007). A number of studies have found SOM
contents and soil fauna positively influenced by organic management in permanent pasture
(Reganold et al. 1993; Yeates et al. 1997; Mulder et al. 2003). Reganold et al. (1993) comparing
a range of biodynamic and conventional farm systems, including livestock, found more SOM,
thicker top soils and more biological activity under biodynamic management. Yeates et al. (1997)
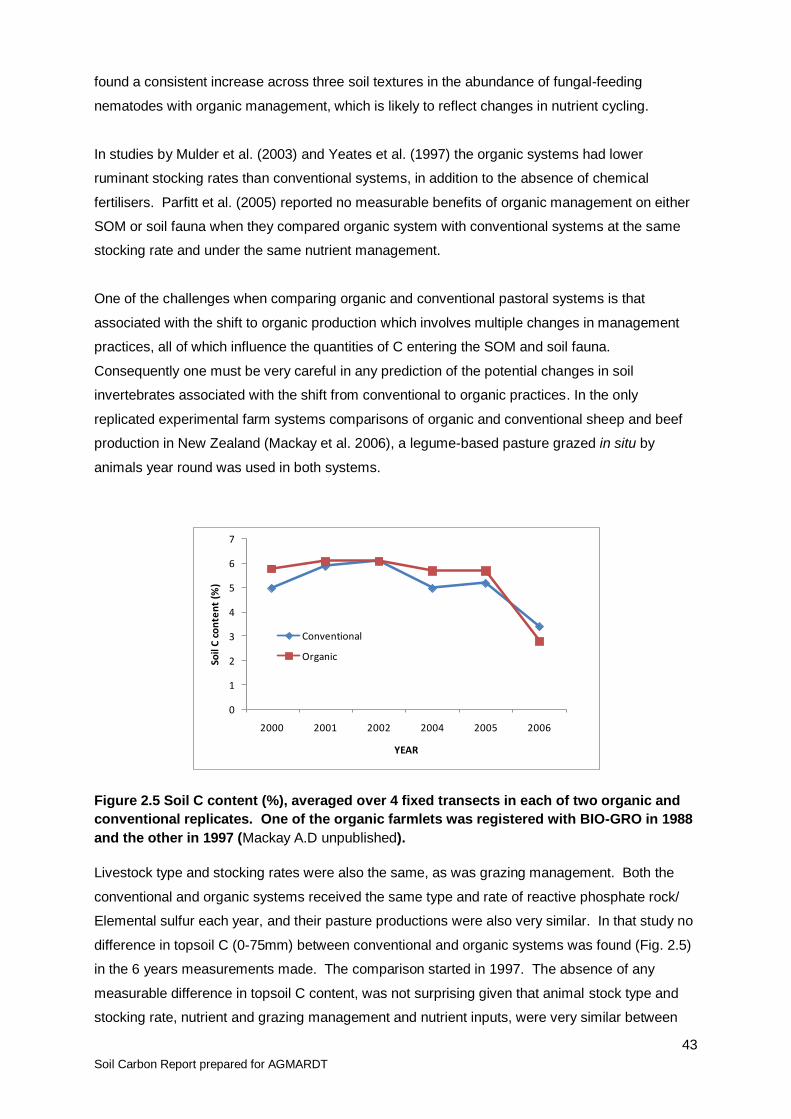
43
Soil Carbon Report prepared for AGMARDT
found a consistent increase across three soil textures in the abundance of fungal-feeding
nematodes with organic management, which is likely to reflect changes in nutrient cycling.
In studies by Mulder et al. (2003) and Yeates et al. (1997) the organic systems had lower
ruminant stocking rates than conventional systems, in addition to the absence of chemical
fertilisers. Parfitt et al. (2005) reported no measurable benefits of organic management on either
SOM or soil fauna when they compared organic system with conventional systems at the same
stocking rate and under the same nutrient management.
One of the challenges when comparing organic and conventional pastoral systems is that
associated with the shift to organic production which involves multiple changes in management
practices, all of which influence the quantities of C entering the SOM and soil fauna.
Consequently one must be very careful in any prediction of the potential changes in soil
invertebrates associated with the shift from conventional to organic practices. In the only
replicated experimental farm systems comparisons of organic and conventional sheep and beef
production in New Zealand (Mackay et al. 2006), a legume-based pasture grazed in situ by
animals year round was used in both systems.
Figure 2.5 Soil C content (%), averaged over 4 fixed transects in each of two organic and
conventional replicates. One of the organic farmlets was registered with BIO-GRO in 1988
and the other in 1997 (Mackay A.D unpublished).
Livestock type and stocking rates were also the same, as was grazing management. Both the
conventional and organic systems received the same type and rate of reactive phosphate rock/
Elemental sulfur each year, and their pasture productions were also very similar. In that study no
difference in topsoil C (0-75mm) between conventional and organic systems was found (Fig. 2.5)
in the 6 years measurements made. The comparison started in 1997. The absence of any
measurable difference in topsoil C content, was not surprising given that animal stock type and
stocking rate, nutrient and grazing management and nutrient inputs, were very similar between
0
1
2
3
4
5
6
7
2000 2001 2002 2004 2005 2006
Soil
C c
on
ten
t (%
)
YEAR
Conventional
Organic
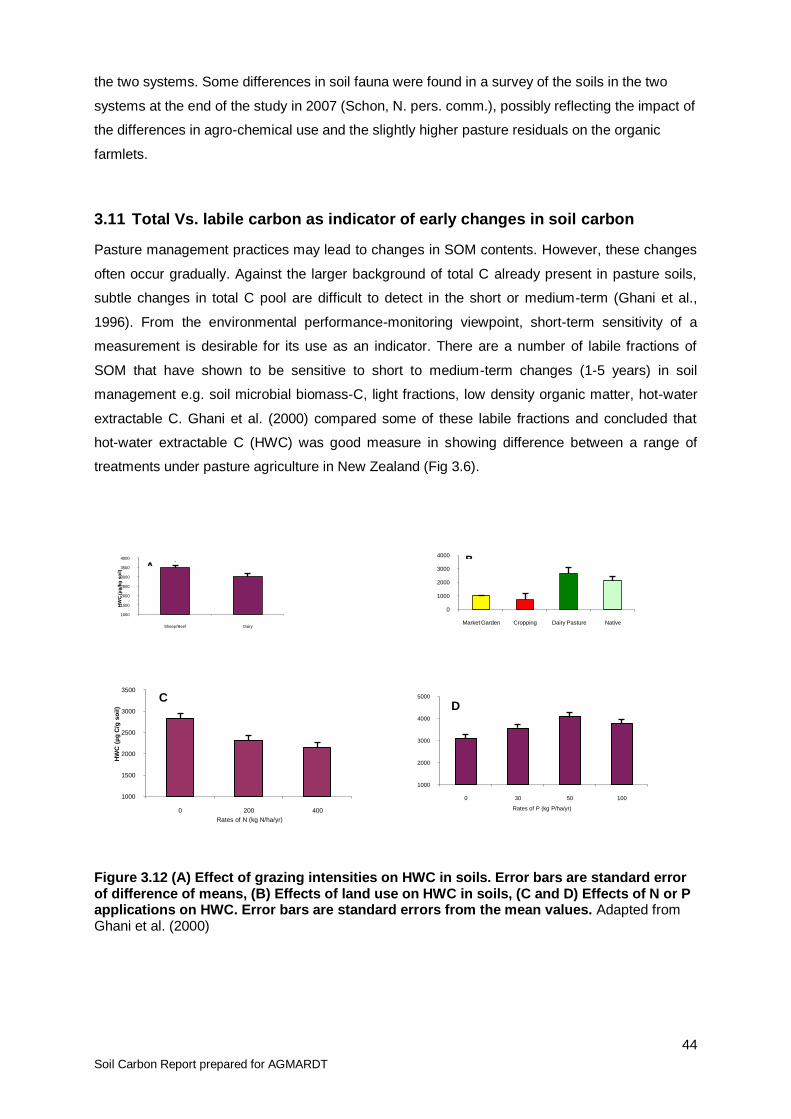
44
Soil Carbon Report prepared for AGMARDT
the two systems. Some differences in soil fauna were found in a survey of the soils in the two
systems at the end of the study in 2007 (Schon, N. pers. comm.), possibly reflecting the impact of
the differences in agro-chemical use and the slightly higher pasture residuals on the organic
farmlets.
3.11 Total Vs. labile carbon as indicator of early changes in soil carbon
Pasture management practices may lead to changes in SOM contents. However, these changes
often occur gradually. Against the larger background of total C already present in pasture soils,
subtle changes in total C pool are difficult to detect in the short or medium-term (Ghani et al.,
1996). From the environmental performance-monitoring viewpoint, short-term sensitivity of a
measurement is desirable for its use as an indicator. There are a number of labile fractions of
SOM that have shown to be sensitive to short to medium-term changes (1-5 years) in soil
management e.g. soil microbial biomass-C, light fractions, low density organic matter, hot-water
extractable C. Ghani et al. (2000) compared some of these labile fractions and concluded that
hot-water extractable C (HWC) was good measure in showing difference between a range of
treatments under pasture agriculture in New Zealand (Fig 3.6).
Figure 3.12 (A) Effect of grazing intensities on HWC in soils. Error bars are standard error of difference of means, (B) Effects of land use on HWC in soils, (C and D) Effects of N or P applications on HWC. Error bars are standard errors from the mean values. Adapted from Ghani et al. (2000)
1000
1500
2000
2500
3000
3500
0 200 400
HW
C (
µg
C/g
so
il)
Rates of N (kg N/ha/yr)
C
1000
2000
3000
4000
5000
0 30 50 100
Rates of P (kg P/ha/yr)
D
0
1000
2000
3000
4000
Market Garden Cropping Dairy Pasture Native
B
1000
1500
2000
2500
3000
3500
4000
Sheep/Beef Dairy
HW
C (µ
g/k
g s
oil)
*A
45
Soil Carbon Report prepared for AGMARDT
4. Carbon cycling in horticultural systems
Summary
Horticultural production systems are managed to enhance the production of the fruiting part of the
plant, rather than the vegetative component. Thus free-draining soils that typically have limited
fertility, therefore those that are low in soil C generally are often used for horticulture, especially
viticulture, where management practices can then be used to ensure quality production of fruit.
Horticulture is typically concentrated on recent coarse-textured alluvial soils such as in Hawke‘s
Bay, central Hawke‘s Bay, Nelson, and Canterbury, as well as the arid soils of central Otago.
Because of naturally low vegetative vigour, pruning practices, and high harvest index,
horticultural systems return low amounts of C to the soil. As a result, horticultural soils have been
observed to be losing soil C. Because soil C is critical for soil functioning and health, especially
water-holding capacity, aeration and nitrogen mineralization, it is imperative that C levels be
maintained, even if it is at levels lower than pastoral soils. In orchards and vineyards this can be
achieved through mulches and composts, and in the future there is the possibility that biochar
could be used.
Suggestion for improving C in soils under horticulture land use
Horticultural systems generally have a high harvest index, meaning much of the captured carbon (up to 70-80%) is exported in the product. In fruit systems
To increase soil carbon:
Encourage organic matter recycling:
Maximise the incorporation of the prunings, residues and re-importation of processing wastes such as pomace and marc each year.
Compost prunings and wastes, and use as surface mulches to build soil carbon, without increasing vegetative vigour excessively. Composting of residues and mulching is more effective at raising soil carbon, than litter decomposition in situ. Because of the high harvest index, there is insufficient material to cover the entire orchard in mulch, thus outsourced clean composts can be used to achieve coverage. Organic systems already use this approach.
Soil carbon is buffered, and changes can take a long time (> 10 years), but mulching can return soil health benefits much quicker.
Orchard redevelopment for planting of new cultivars means the standing biomass C in the existing tree is removed, this carbon can be used as a feedstock for composting or biochar to be incorporated into the soil during redevelopment. This might even help, we speculate, to reduce specific apple replant disorder (SARD). This dual value from biochar would be worth exploring.
Grafting onto the existing rootstock, if possible, would keep the sub-soil root carbon store by and large intact. Likewise, the prunings from living shelter can be recycled as mulch, or compost.
To increase biomass inputs:
Capture more carbon by increasing biomass production in components of the orchard system other than the tree canopy. Excessive vegetative vigour is generally avoided in fruit production.
Use irrigation to encourage more root growth, especially by using regulated deficit techniques, and in particular partial rootzone drying which seeks to cycle root growth between alternately wetted and dry-down zones.
46
Soil Carbon Report prepared for AGMARDT
4.1 Soil carbon in horticultural soils – A world view
The literature on the levels and function of C in horticultural soils is small in contrast with that on
soil C in agricultural soils. Using Elsevier‘s literature search engine SCOPUS
(http://www.scopus.com/home.url ) with the search criteria of ‗carbon‘ and ‗agriculture‘ returns
4,437 hits to scientific papers. Replacing the ‗agriculture‘ with ‗horticulture‘ yields only 111
articles in scientific journals. Soil C in horticultural systems has received less attention probably
because of the ‗inverse‘ relationship between soil fertility and horticultural production. Whereas
for agriculture ‗more is better‘, horticulturalists often to grow their crops on free-draining soils
which typically have lower levels of C.
Because the product exported from the orchard is the floral part of the plant, horticultural
enterprises tend not to select soils with high levels of fertility as this would only favour the growth
of the vegetative parts of the plant. The origins of many of our horticultural crops are in the
Middle East, the Mediterranean, Asia, or Central America. Apples have their origin in the
Caucasus, avocadoes in the Mexican highlands, olives in the Mediterranean, and kiwifruit and
citrus in China. These areas typically have soils that are generally lower in soil C (Jones et al.
2005).
4.2 Soil carbon in horticultural soils – A New Zealand view
In 2008, horticultural exports were $2.95 b, being 7% of New Zealand‘s export revenues. Kiwifruit
($870 m), wine ($794 m) and apples ($345 m) are the big three, making up nearly 70% of our
Minimise the size of the bare-soil strip to maximise biomass as far as is practical. Minimise use of herbicides and encourage incorporation into the soil of carbon from residues and mulches.
Use deep-rooted multi-species vegetation as the understorey to encourage deeper storage of carbon in the soil of the inter-row.
Utilise living shelter to encourage net biomass growth in the orchard. This can also provide the opportunity for additional prunings and mulching materials.
Increase soil microbiological health in general by avoiding soil compaction from excess traffic and to enhance incorporation of biomass carbon into the more resistant carbon pools.
To decrease Carbon Losses (In vegetable production):
Manage erosion & tillage
Adopt multiple-crop bed techniques which reduce tillage frequency. In vegetable growing, tillage is frequent, encouraging both erosion and respiration of soil carbon.
Include frequent periods of pastures growing, if possible, to help to restore soil carbon levels, and improve soil structure and health.
Minimise leaching
Manage irrigation to apply only the minimum amount of water required. This will limit leaching and loss of dissolved organic C from the root-zone.
Managing decomposition rates
Encouraging soil health and microbial activity will enhance the incorporation of litter residues into soil C pools. This can be achieved through good irrigation management, maximising the area in understorey cover crops, maintaining soil structure, limiting compaction, and using the minimum number of sprays.
Living shelter with deep roots will capture and sequester carbon at depth.
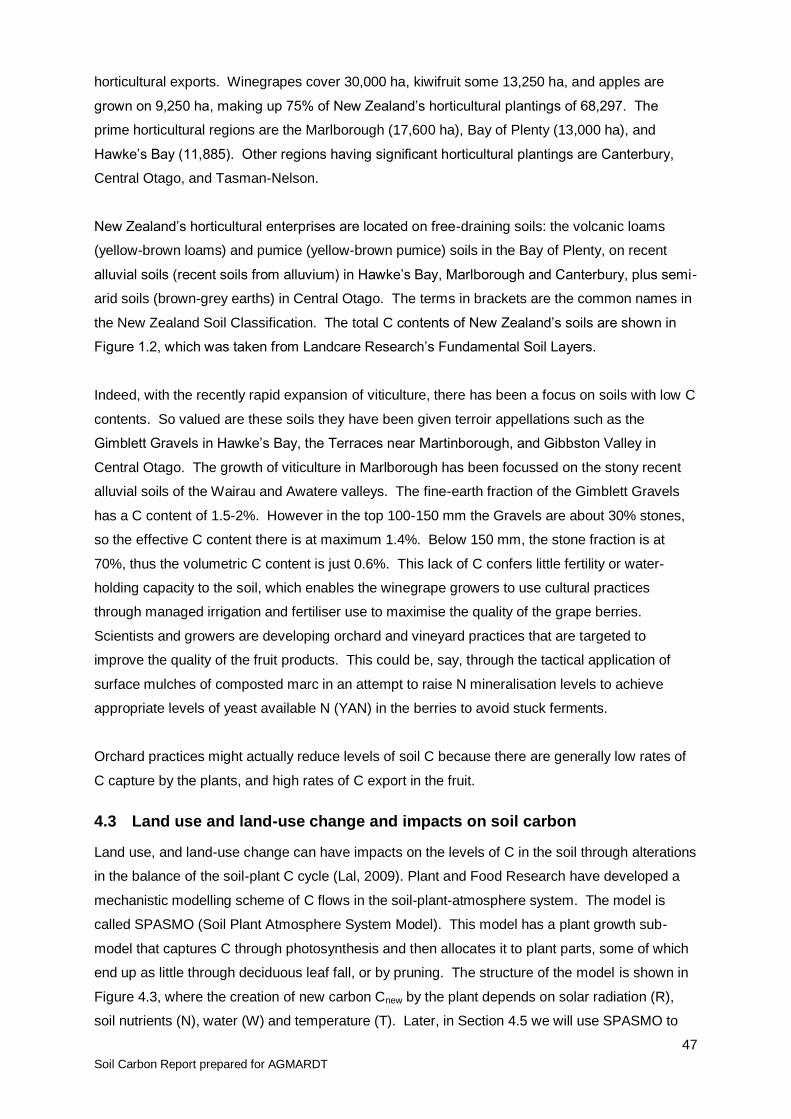
47
Soil Carbon Report prepared for AGMARDT
horticultural exports. Winegrapes cover 30,000 ha, kiwifruit some 13,250 ha, and apples are
grown on 9,250 ha, making up 75% of New Zealand‘s horticultural plantings of 68,297. The
prime horticultural regions are the Marlborough (17,600 ha), Bay of Plenty (13,000 ha), and
Hawke‘s Bay (11,885). Other regions having significant horticultural plantings are Canterbury,
Central Otago, and Tasman-Nelson.
New Zealand‘s horticultural enterprises are located on free-draining soils: the volcanic loams
(yellow-brown loams) and pumice (yellow-brown pumice) soils in the Bay of Plenty, on recent
alluvial soils (recent soils from alluvium) in Hawke‘s Bay, Marlborough and Canterbury, plus semi-
arid soils (brown-grey earths) in Central Otago. The terms in brackets are the common names in
the New Zealand Soil Classification. The total C contents of New Zealand‘s soils are shown in
Figure 1.2, which was taken from Landcare Research‘s Fundamental Soil Layers.
Indeed, with the recently rapid expansion of viticulture, there has been a focus on soils with low C
contents. So valued are these soils they have been given terroir appellations such as the
Gimblett Gravels in Hawke‘s Bay, the Terraces near Martinborough, and Gibbston Valley in
Central Otago. The growth of viticulture in Marlborough has been focussed on the stony recent
alluvial soils of the Wairau and Awatere valleys. The fine-earth fraction of the Gimblett Gravels
has a C content of 1.5-2%. However in the top 100-150 mm the Gravels are about 30% stones,
so the effective C content there is at maximum 1.4%. Below 150 mm, the stone fraction is at
70%, thus the volumetric C content is just 0.6%. This lack of C confers little fertility or water-
holding capacity to the soil, which enables the winegrape growers to use cultural practices
through managed irrigation and fertiliser use to maximise the quality of the grape berries.
Scientists and growers are developing orchard and vineyard practices that are targeted to
improve the quality of the fruit products. This could be, say, through the tactical application of
surface mulches of composted marc in an attempt to raise N mineralisation levels to achieve
appropriate levels of yeast available N (YAN) in the berries to avoid stuck ferments.
Orchard practices might actually reduce levels of soil C because there are generally low rates of
C capture by the plants, and high rates of C export in the fruit.
4.3 Land use and land-use change and impacts on soil carbon
Land use, and land-use change can have impacts on the levels of C in the soil through alterations
in the balance of the soil-plant C cycle (Lal, 2009). Plant and Food Research have developed a
mechanistic modelling scheme of C flows in the soil-plant-atmosphere system. The model is
called SPASMO (Soil Plant Atmosphere System Model). This model has a plant growth sub-
model that captures C through photosynthesis and then allocates it to plant parts, some of which
end up as little through deciduous leaf fall, or by pruning. The structure of the model is shown in
Figure 4.3, where the creation of new carbon Cnew by the plant depends on solar radiation (R),
soil nutrients (N), water (W) and temperature (T). Later, in Section 4.5 we will use SPASMO to
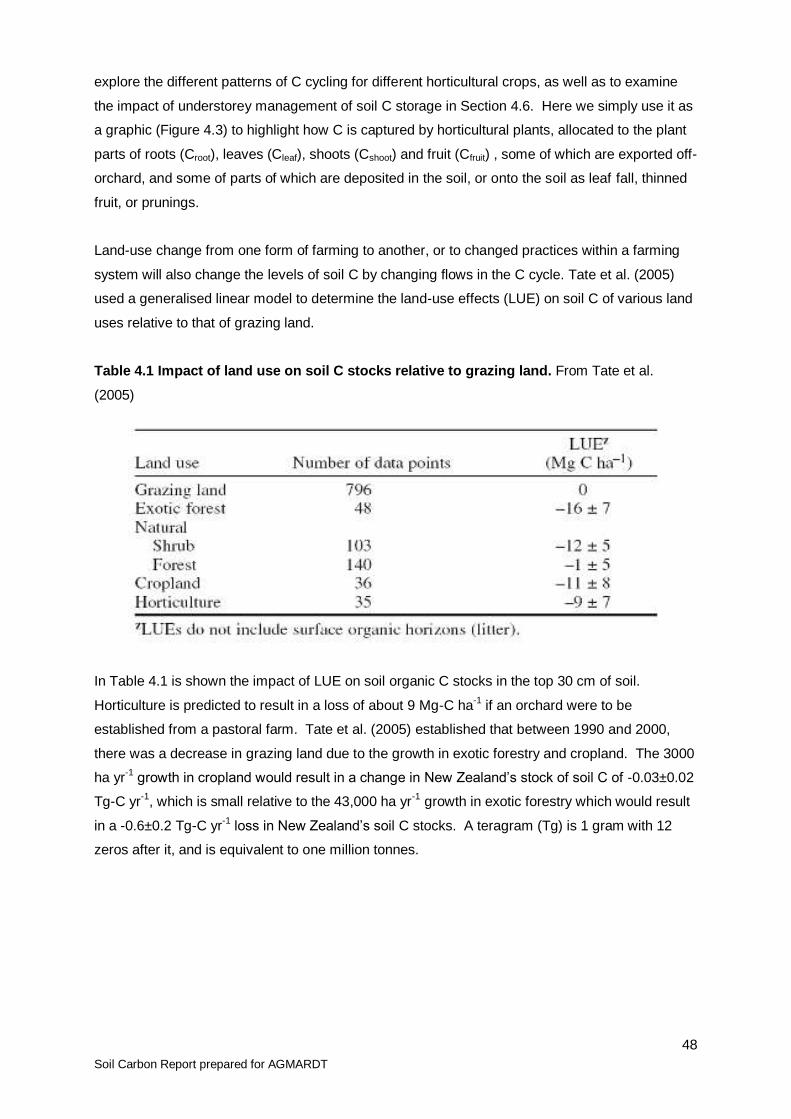
48
Soil Carbon Report prepared for AGMARDT
explore the different patterns of C cycling for different horticultural crops, as well as to examine
the impact of understorey management of soil C storage in Section 4.6. Here we simply use it as
a graphic (Figure 4.3) to highlight how C is captured by horticultural plants, allocated to the plant
parts of roots (Croot), leaves (Cleaf), shoots (Cshoot) and fruit (Cfruit) , some of which are exported off-
orchard, and some of parts of which are deposited in the soil, or onto the soil as leaf fall, thinned
fruit, or prunings.
Land-use change from one form of farming to another, or to changed practices within a farming
system will also change the levels of soil C by changing flows in the C cycle. Tate et al. (2005)
used a generalised linear model to determine the land-use effects (LUE) on soil C of various land
uses relative to that of grazing land.
Table 4.1 Impact of land use on soil C stocks relative to grazing land. From Tate et al.
(2005)
In Table 4.1 is shown the impact of LUE on soil organic C stocks in the top 30 cm of soil.
Horticulture is predicted to result in a loss of about 9 Mg-C ha-1
if an orchard were to be
established from a pastoral farm. Tate et al. (2005) established that between 1990 and 2000,
there was a decrease in grazing land due to the growth in exotic forestry and cropland. The 3000
ha yr-1
growth in cropland would result in a change in New Zealand‘s stock of soil C of -0.03±0.02
Tg-C yr-1
, which is small relative to the 43,000 ha yr-1
growth in exotic forestry which would result
in a -0.6±0.2 Tg-C yr-1
loss in New Zealand‘s soil C stocks. A teragram (Tg) is 1 gram with 12
zeros after it, and is equivalent to one million tonnes.
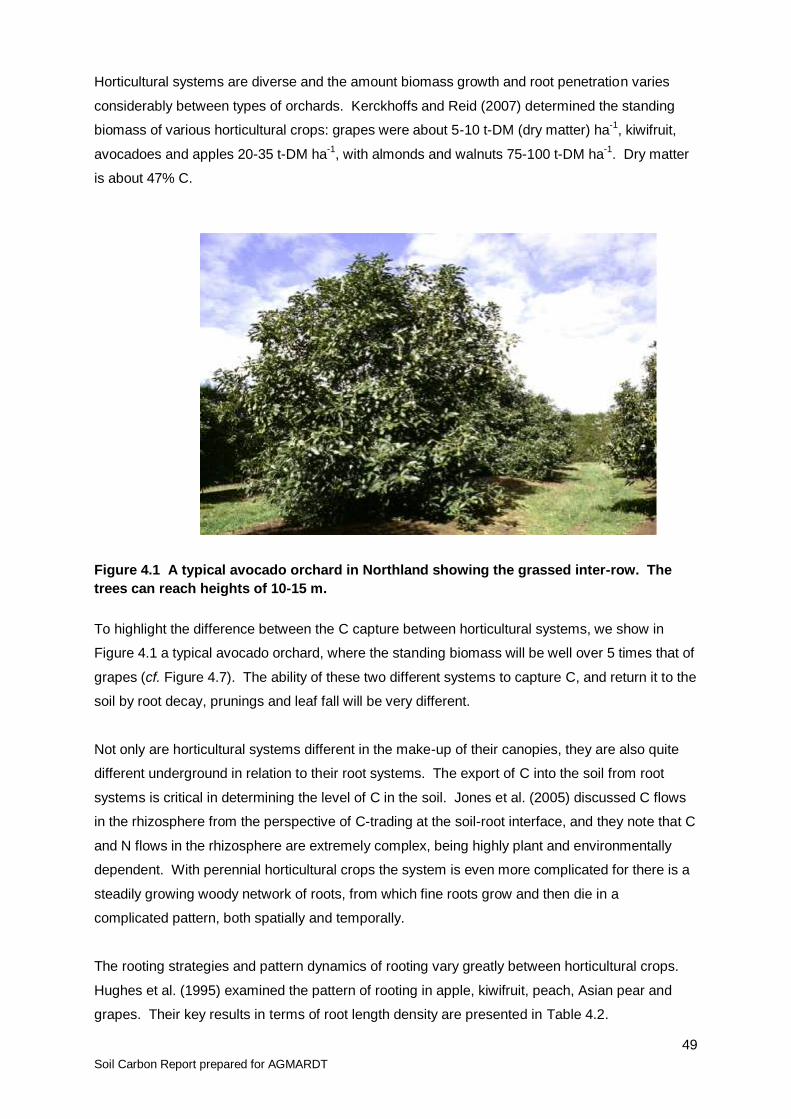
49
Soil Carbon Report prepared for AGMARDT
Horticultural systems are diverse and the amount biomass growth and root penetration varies
considerably between types of orchards. Kerckhoffs and Reid (2007) determined the standing
biomass of various horticultural crops: grapes were about 5-10 t-DM (dry matter) ha-1
, kiwifruit,
avocadoes and apples 20-35 t-DM ha-1
, with almonds and walnuts 75-100 t-DM ha-1
. Dry matter
is about 47% C.
Figure 4.1 A typical avocado orchard in Northland showing the grassed inter-row. The
trees can reach heights of 10-15 m.
To highlight the difference between the C capture between horticultural systems, we show in
Figure 4.1 a typical avocado orchard, where the standing biomass will be well over 5 times that of
grapes (cf. Figure 4.7). The ability of these two different systems to capture C, and return it to the
soil by root decay, prunings and leaf fall will be very different.
Not only are horticultural systems different in the make-up of their canopies, they are also quite
different underground in relation to their root systems. The export of C into the soil from root
systems is critical in determining the level of C in the soil. Jones et al. (2005) discussed C flows
in the rhizosphere from the perspective of C-trading at the soil-root interface, and they note that C
and N flows in the rhizosphere are extremely complex, being highly plant and environmentally
dependent. With perennial horticultural crops the system is even more complicated for there is a
steadily growing woody network of roots, from which fine roots grow and then die in a
complicated pattern, both spatially and temporally.
The rooting strategies and pattern dynamics of rooting vary greatly between horticultural crops.
Hughes et al. (1995) examined the pattern of rooting in apple, kiwifruit, peach, Asian pear and
grapes. Their key results in terms of root length density are presented in Table 4.2.

50
Soil Carbon Report prepared for AGMARDT
Table 4.2 The characteristic patterns of root length density between five horticultural
crops (from Hughes et al. 1995).
Species Number of sites Mean root length density
(104 m m
-3) and SE
Kiwifruit 18 0.93 ± 0.04
Peach 3 0.93 ± 0.15
Apple 5 0.15 ± 0.04
Grape 2 0.09 ± 0.02
Asian pear 2 0.09 ± 0.01
Thus the spatial density of plant-based C in the soil is highest in kiwifruit and peaches, and lowest
in grapes and Asian pear (Table 4.2 and Fig. 4.2). What will matter for C flows in the root zone,
will be the different exploration and exploitation strategies used by the rooting systems of these
crops. Hughes et al. (1995) developed indices of exploitation and exploration.
Figure 4.2 The pattern of root exploration and exploitation by a young kiwifruit vine. The
vine is on the left, and the exploration front of white roots can be seen in the middle of the
photo, behind which is the zone which is exploited.
The exploration-exploitation rooting strategy of plants will control C flows from the plant to the
soil. For peaches they found an exploration index of almost 1. So that means that 100% of the
volume of soil that was explored by roots, contains some roots. Other species had an exploration
index of about 0.8. Thus within the extent of explored rooted volume, there was about 20% of the
space that contained no roots. So, one would imagine that C flows into the rooted volume of
peaches would be at a higher spatial intensity than the other species. The exploitation indices for
peaches and kiwifruit were 0.45. In other words, nearly half of the explored volume had rooting
densities that were quite high. For apples, pears and grapes, these were only about 0.05. So
51
Soil Carbon Report prepared for AGMARDT
their rooting pattern only had pockets, about 5% of the explored volume, where roots were at a
high density. Thus different rooting strategies result in different exploration and exploitation
patterns, and so the delivery of C to the soil roots will be quite different between species. Little
however is known about how these strategies relate to the flows and stocks of C in the root zone
of horticultural crops.
There is a general lack of data on the C stocks and flows in diverse horticultural systems, and
here we report on results which have been obtained in the three major horticultural crops:
kiwifruit, wine grapes and apples.
4.4 Carbon stocks and flows: The Big Three - Kiwifruit, Grapes, and Apples
The soil‘s C content reflects the balance between C inputs and C losses (Figure 4.3). Therefore
a loss of soil C can be counteracted by continuous C inputs from the addition of organic matter
residues such as prunings, leaf-fall, compost or decaying root biomass. The addition of organic
matter residues via prunings, leaf-fall, compost in organic systems, or decaying root biomass will
vary greatly between different horticultural systems, driven in large part by primary C capture by
the tree.
4.4.1 Kiwifruit
The annual net primary production of leaf, shoot and fruit totalled about 15 t ha-1
. The fraction of
C in woody tissue is approximately 47%, so the vine‘s canopy has captured about 7 t-C ha-1
yr-1
.
We have not considered annual growth in the root system rather we have assumed it to be in
equilibrium, with root growth balancing root death. Linda Boyd (pers. comm.) has carried out vine
excavations and for ZESPRI GREEN kiwifruit; she found that of the 29.5 kg-DM per vine, some
14.6 kg-DM was in the structural and fibrous roots. This fraction of about a half was similar for
the more vigorous ZESPRI GOLD, namely 21.4 kg-DM of roots relative to the 48.2 kg-DM for the
total vine. The roots of kiwifruit can penetrate to great depths, especially in the deep volcanic
soils of the Bay of Plenty, although the root length density is greatest near the surface. The
pattern of C in the soil reflects this, as Dr Sivakumaran (pers. comm.) has found under kiwifruit
near Te Puke. Elevated levels of C can be found down to nearly a metre (Figure 4.4). To
understand changes of soil C is such deep-rooted plant systems will require some considerable
sampling effort in the field.
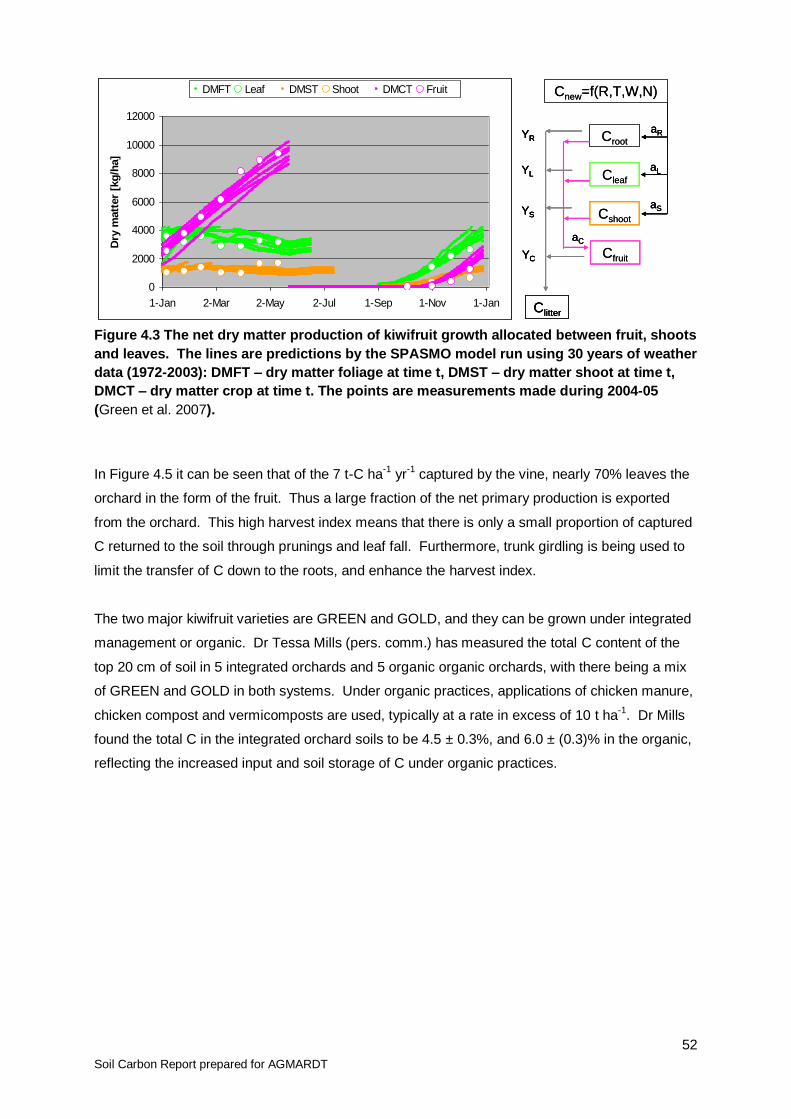
52
Soil Carbon Report prepared for AGMARDT
Figure 4.3 The net dry matter production of kiwifruit growth allocated between fruit, shoots
and leaves. The lines are predictions by the SPASMO model run using 30 years of weather
data (1972-2003): DMFT – dry matter foliage at time t, DMST – dry matter shoot at time t,
DMCT – dry matter crop at time t. The points are measurements made during 2004-05
(Green et al. 2007).
In Figure 4.5 it can be seen that of the 7 t-C ha-1
yr-1
captured by the vine, nearly 70% leaves the
orchard in the form of the fruit. Thus a large fraction of the net primary production is exported
from the orchard. This high harvest index means that there is only a small proportion of captured
C returned to the soil through prunings and leaf fall. Furthermore, trunk girdling is being used to
limit the transfer of C down to the roots, and enhance the harvest index.
The two major kiwifruit varieties are GREEN and GOLD, and they can be grown under integrated
management or organic. Dr Tessa Mills (pers. comm.) has measured the total C content of the
top 20 cm of soil in 5 integrated orchards and 5 organic organic orchards, with there being a mix
of GREEN and GOLD in both systems. Under organic practices, applications of chicken manure,
chicken compost and vermicomposts are used, typically at a rate in excess of 10 t ha-1
. Dr Mills
found the total C in the integrated orchard soils to be 4.5 ± 0.3%, and 6.0 ± (0.3)% in the organic,
reflecting the increased input and soil storage of C under organic practices.
Cnew=f(R,T,W,N)
Croot
Cleaf
Cshoot
aR
aL
aS
Cfruit
aC
YR
YS
YL
YC
Clitter
Cnew=f(R,T,W,N)
Croot
Cleaf
Cshoot
aR
aL
aS
aR
aL
aS
Cfruit
aCaC
YR
YS
YL
YC
Clitter
YR
YS
YL
YC
YR
YS
YL
YC
Clitter
0
2000
4000
6000
8000
10000
12000
1-Jan 2-Mar 2-May 2-Jul 1-Sep 1-Nov 1-Jan
Dry
matt
er
[kg
/ha]
DMFT Leaf DMST Shoot DMCT Fruit
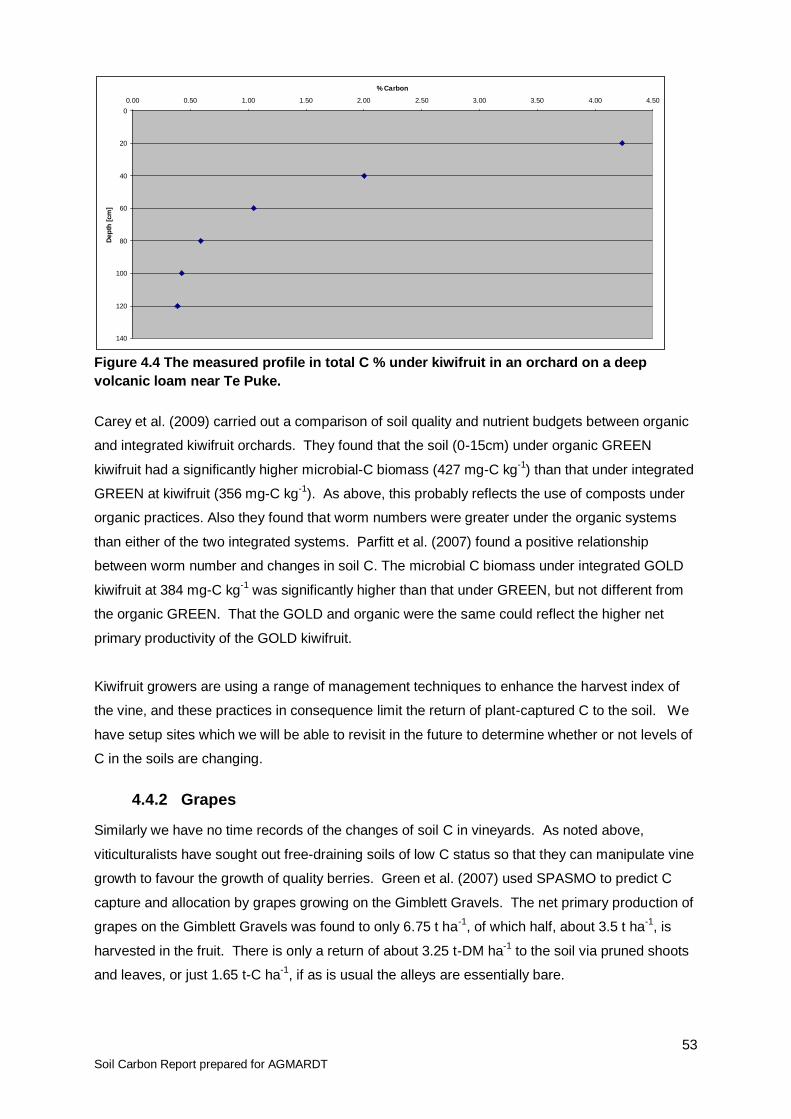
53
Soil Carbon Report prepared for AGMARDT
Figure 4.4 The measured profile in total C % under kiwifruit in an orchard on a deep
volcanic loam near Te Puke.
Carey et al. (2009) carried out a comparison of soil quality and nutrient budgets between organic
and integrated kiwifruit orchards. They found that the soil (0-15cm) under organic GREEN
kiwifruit had a significantly higher microbial-C biomass (427 mg-C kg-1
) than that under integrated
GREEN at kiwifruit (356 mg-C kg-1
). As above, this probably reflects the use of composts under
organic practices. Also they found that worm numbers were greater under the organic systems
than either of the two integrated systems. Parfitt et al. (2007) found a positive relationship
between worm number and changes in soil C. The microbial C biomass under integrated GOLD
kiwifruit at 384 mg-C kg-1
was significantly higher than that under GREEN, but not different from
the organic GREEN. That the GOLD and organic were the same could reflect the higher net
primary productivity of the GOLD kiwifruit.
Kiwifruit growers are using a range of management techniques to enhance the harvest index of
the vine, and these practices in consequence limit the return of plant-captured C to the soil. We
have setup sites which we will be able to revisit in the future to determine whether or not levels of
C in the soils are changing.
4.4.2 Grapes
Similarly we have no time records of the changes of soil C in vineyards. As noted above,
viticulturalists have sought out free-draining soils of low C status so that they can manipulate vine
growth to favour the growth of quality berries. Green et al. (2007) used SPASMO to predict C
capture and allocation by grapes growing on the Gimblett Gravels. The net primary production of
grapes on the Gimblett Gravels was found to only 6.75 t ha-1
, of which half, about 3.5 t ha-1
, is
harvested in the fruit. There is only a return of about 3.25 t-DM ha-1
to the soil via pruned shoots
and leaves, or just 1.65 t-C ha-1
, if as is usual the alleys are essentially bare.
0
20
40
60
80
100
120
140
0.00 0.50 1.00 1.50 2.00 2.50 3.00 3.50 4.00 4.50
% Carbon
Dep
th [
cm
]
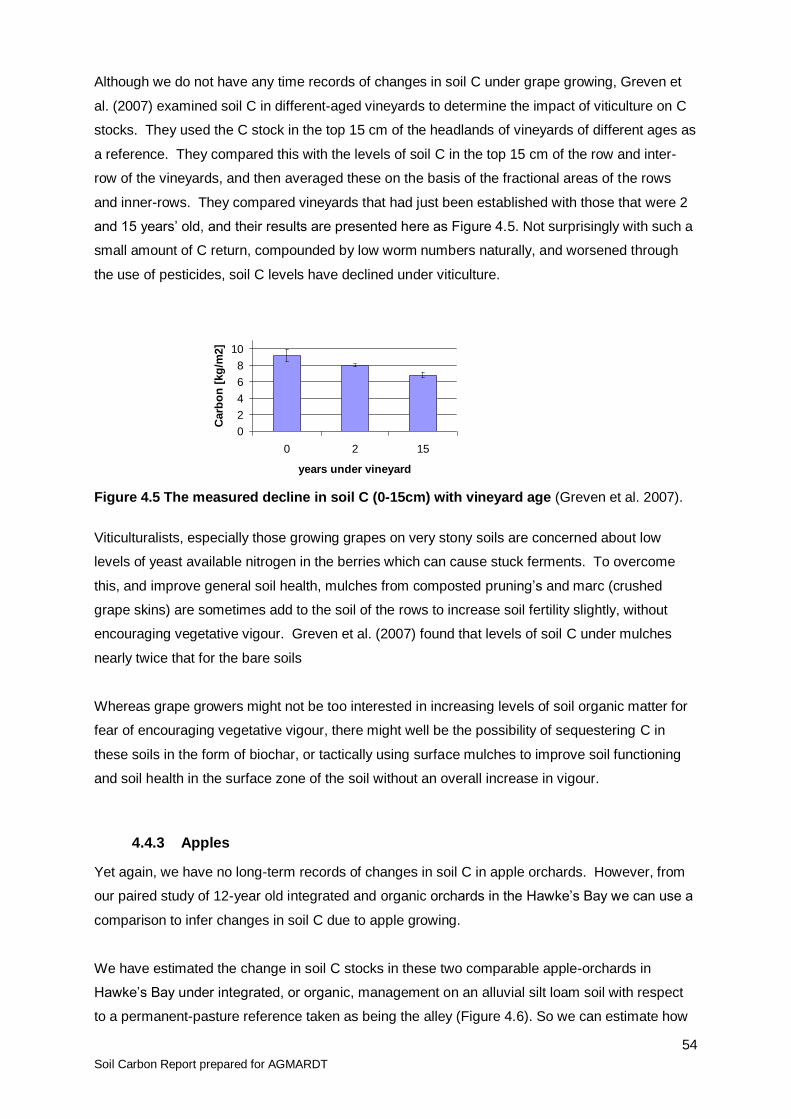
54
Soil Carbon Report prepared for AGMARDT
Although we do not have any time records of changes in soil C under grape growing, Greven et
al. (2007) examined soil C in different-aged vineyards to determine the impact of viticulture on C
stocks. They used the C stock in the top 15 cm of the headlands of vineyards of different ages as
a reference. They compared this with the levels of soil C in the top 15 cm of the row and inter-
row of the vineyards, and then averaged these on the basis of the fractional areas of the rows
and inner-rows. They compared vineyards that had just been established with those that were 2
and 15 years‘ old, and their results are presented here as Figure 4.5. Not surprisingly with such a
small amount of C return, compounded by low worm numbers naturally, and worsened through
the use of pesticides, soil C levels have declined under viticulture.
Figure 4.5 The measured decline in soil C (0-15cm) with vineyard age (Greven et al. 2007).
Viticulturalists, especially those growing grapes on very stony soils are concerned about low
levels of yeast available nitrogen in the berries which can cause stuck ferments. To overcome
this, and improve general soil health, mulches from composted pruning‘s and marc (crushed
grape skins) are sometimes add to the soil of the rows to increase soil fertility slightly, without
encouraging vegetative vigour. Greven et al. (2007) found that levels of soil C under mulches
nearly twice that for the bare soils
Whereas grape growers might not be too interested in increasing levels of soil organic matter for
fear of encouraging vegetative vigour, there might well be the possibility of sequestering C in
these soils in the form of biochar, or tactically using surface mulches to improve soil functioning
and soil health in the surface zone of the soil without an overall increase in vigour.
4.4.3 Apples
Yet again, we have no long-term records of changes in soil C in apple orchards. However, from
our paired study of 12-year old integrated and organic orchards in the Hawke‘s Bay we can use a
comparison to infer changes in soil C due to apple growing.
We have estimated the change in soil C stocks in these two comparable apple-orchards in
Hawke‘s Bay under integrated, or organic, management on an alluvial silt loam soil with respect
to a permanent-pasture reference taken as being the alley (Figure 4.6). So we can estimate how
0
2
4
6
8
10
0 2 15
years under vineyard
Carb
on
[kg
/m2]
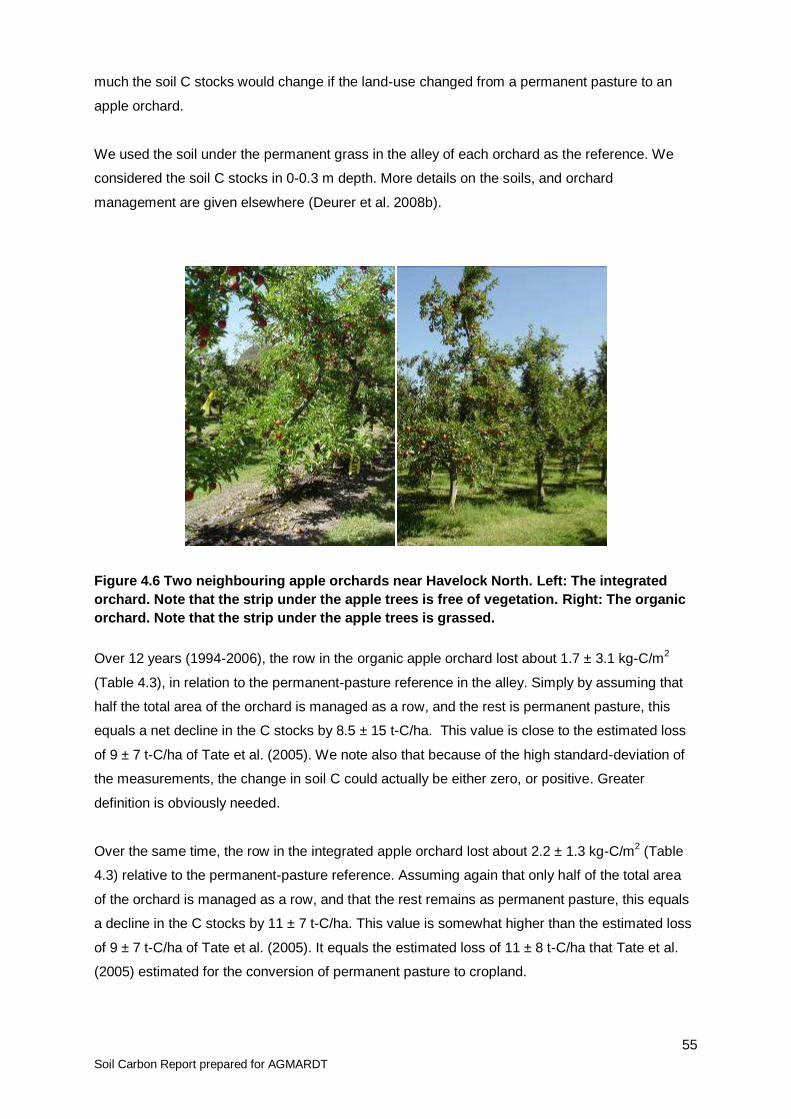
55
Soil Carbon Report prepared for AGMARDT
much the soil C stocks would change if the land-use changed from a permanent pasture to an
apple orchard.
We used the soil under the permanent grass in the alley of each orchard as the reference. We
considered the soil C stocks in 0-0.3 m depth. More details on the soils, and orchard
management are given elsewhere (Deurer et al. 2008b).
Figure 4.6 Two neighbouring apple orchards near Havelock North. Left: The integrated
orchard. Note that the strip under the apple trees is free of vegetation. Right: The organic
orchard. Note that the strip under the apple trees is grassed.
Over 12 years (1994-2006), the row in the organic apple orchard lost about 1.7 ± 3.1 kg-C/m2
(Table 4.3), in relation to the permanent-pasture reference in the alley. Simply by assuming that
half the total area of the orchard is managed as a row, and the rest is permanent pasture, this
equals a net decline in the C stocks by 8.5 ± 15 t-C/ha. This value is close to the estimated loss
of 9 ± 7 t-C/ha of Tate et al. (2005). We note also that because of the high standard-deviation of
the measurements, the change in soil C could actually be either zero, or positive. Greater
definition is obviously needed.
Over the same time, the row in the integrated apple orchard lost about 2.2 ± 1.3 kg-C/m2 (Table
4.3) relative to the permanent-pasture reference. Assuming again that only half of the total area
of the orchard is managed as a row, and that the rest remains as permanent pasture, this equals
a decline in the C stocks by 11 ± 7 t-C/ha. This value is somewhat higher than the estimated loss
of 9 ± 7 t-C/ha of Tate et al. (2005). It equals the estimated loss of 11 ± 8 t-C/ha that Tate et al.
(2005) estimated for the conversion of permanent pasture to cropland.

56
Soil Carbon Report prepared for AGMARDT
Table 4.3 Average C stocks to 0.3 m depth and the calculated change in two apple-orchard soils (organic, integrated) in Hawke’s Bay. The alley in both systems is permanently covered with grass, and served as the reference.
Depth
[m]
Organic – row
[kg-C/m2]
Organic – alley
[kg-C/m2]
Integrated – row
[kg-C/m2]
Integrated – alley
[kg-C/m2]
0-0.3 7.8±1.9 9.5±1.2 5.9±0.6 8.1±0.7
Estimated change in soil organic stocks over 12 years [kg-C/m2 year]
-0.14±0.3 0 -0.18±0.1 0
Where did the (net) loss of C go? John Palmer of Plant & Food Research has recently published
a paper in Acta Horticulturae on ―Changing concepts of efficiency in orchard systems‖, and he
noted that the need for traditional ―… whole plant physiology has never been more important than
today as we seek to understand C flows within the orchard.‖ Palmer (2009) commented that the
fruit tree grower has the advantages of a perennial tree in undisturbed soil.
Trees capture C from the atmosphere, and some of this ends up as C in the tree‘s standing
structure, leaves and apples. The standing woody tissue represents a considerable quantity of
stored C. At the end of eight years, the mean standing dry weight of ‗Braeburn‘, ‗Royal Gala‘ and
‗Fuji‘ apple trees on M.9 rootstock at 3.5 x 1.3m, grown as slender spindles, was about 17 t (dry
matter DM) ha-1
, with an annual increment of 2.2 t-DM ha-1
(Palmer et al. 2002). The size of the
annual increment comes from net diameter growth in roots, trunk and permanent branches. This
growth is not immediately obvious for the mass of a trunk grows at the square of the radius, and
so a small diametric growth comprises a significant increment in biomass
Taking the data from the trees on M.9 and extrapolating out to 12 years would give a standing dry
weight of 26 t-DM ha-1
. Walton et al. (1999) determined the fraction of C in the woody tissue of
an apple tree as 47%, which would make the standing tree material be 12 t C ha-1
, which is not
too dissimilar from the 12-year loss of soil C in the herbicide strips of 11 t C ha-1
we found above.
Further, circumstantial evidence hinting at this counter-balancing C accumulation in the standing
biomass would be that organic trees tend to be less vigorous and have less standing biomass.
So the lower standing biomass in the organic orchard is coincident with the lower decline of soil C
(8.5 t-C ha-1
) there, whereas for the more vigorous integrated orchard, with presumably its higher
standing biomass we estimate the soil losses to be 11 t-C ha-1
.
Thus it could be that the C decline we have observed in the soil has as the net result of a
complex of dynamic and interacting processes been counterbalanced by growth in the standing
biomass of the tree (Palmer, 1988). If this were so, then in a net sense, the changes in soil
emissions and gain in biomass would cancel each other out at an orchard level, as long as the C
stored in the tree remained captured.
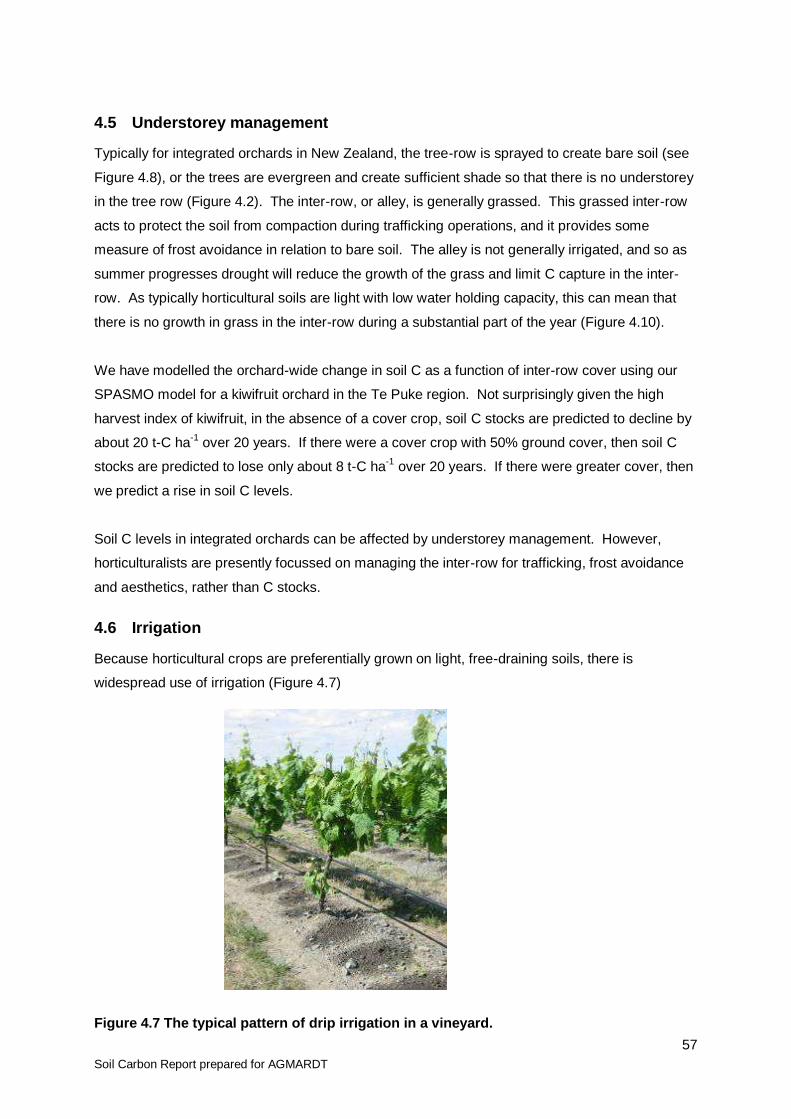
57
Soil Carbon Report prepared for AGMARDT
4.5 Understorey management
Typically for integrated orchards in New Zealand, the tree-row is sprayed to create bare soil (see
Figure 4.8), or the trees are evergreen and create sufficient shade so that there is no understorey
in the tree row (Figure 4.2). The inter-row, or alley, is generally grassed. This grassed inter-row
acts to protect the soil from compaction during trafficking operations, and it provides some
measure of frost avoidance in relation to bare soil. The alley is not generally irrigated, and so as
summer progresses drought will reduce the growth of the grass and limit C capture in the inter-
row. As typically horticultural soils are light with low water holding capacity, this can mean that
there is no growth in grass in the inter-row during a substantial part of the year (Figure 4.10).
We have modelled the orchard-wide change in soil C as a function of inter-row cover using our
SPASMO model for a kiwifruit orchard in the Te Puke region. Not surprisingly given the high
harvest index of kiwifruit, in the absence of a cover crop, soil C stocks are predicted to decline by
about 20 t-C ha-1
over 20 years. If there were a cover crop with 50% ground cover, then soil C
stocks are predicted to lose only about 8 t-C ha-1
over 20 years. If there were greater cover, then
we predict a rise in soil C levels.
Soil C levels in integrated orchards can be affected by understorey management. However,
horticulturalists are presently focussed on managing the inter-row for trafficking, frost avoidance
and aesthetics, rather than C stocks.
4.6 Irrigation
Because horticultural crops are preferentially grown on light, free-draining soils, there is
widespread use of irrigation (Figure 4.7)
Figure 4.7 The typical pattern of drip irrigation in a vineyard.
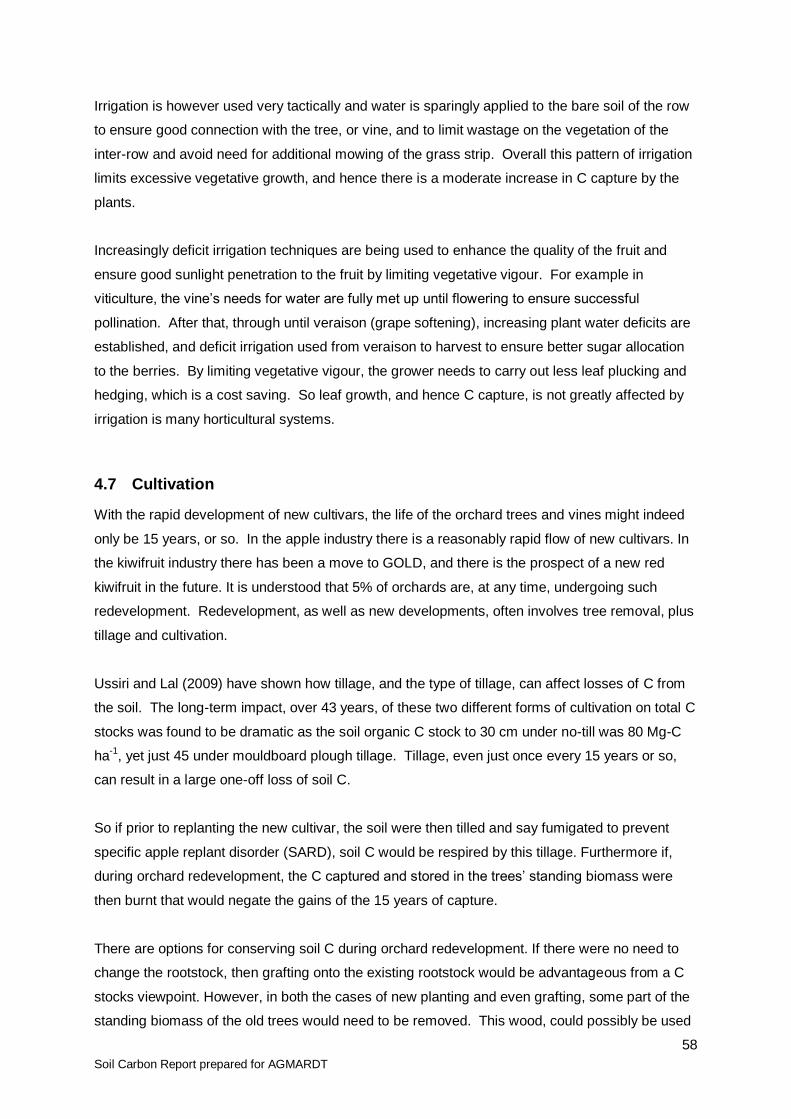
58
Soil Carbon Report prepared for AGMARDT
Irrigation is however used very tactically and water is sparingly applied to the bare soil of the row
to ensure good connection with the tree, or vine, and to limit wastage on the vegetation of the
inter-row and avoid need for additional mowing of the grass strip. Overall this pattern of irrigation
limits excessive vegetative growth, and hence there is a moderate increase in C capture by the
plants.
Increasingly deficit irrigation techniques are being used to enhance the quality of the fruit and
ensure good sunlight penetration to the fruit by limiting vegetative vigour. For example in
viticulture, the vine‘s needs for water are fully met up until flowering to ensure successful
pollination. After that, through until veraison (grape softening), increasing plant water deficits are
established, and deficit irrigation used from veraison to harvest to ensure better sugar allocation
to the berries. By limiting vegetative vigour, the grower needs to carry out less leaf plucking and
hedging, which is a cost saving. So leaf growth, and hence C capture, is not greatly affected by
irrigation is many horticultural systems.
4.7 Cultivation
With the rapid development of new cultivars, the life of the orchard trees and vines might indeed
only be 15 years, or so. In the apple industry there is a reasonably rapid flow of new cultivars. In
the kiwifruit industry there has been a move to GOLD, and there is the prospect of a new red
kiwifruit in the future. It is understood that 5% of orchards are, at any time, undergoing such
redevelopment. Redevelopment, as well as new developments, often involves tree removal, plus
tillage and cultivation.
Ussiri and Lal (2009) have shown how tillage, and the type of tillage, can affect losses of C from
the soil. The long-term impact, over 43 years, of these two different forms of cultivation on total C
stocks was found to be dramatic as the soil organic C stock to 30 cm under no-till was 80 Mg-C
ha-1
, yet just 45 under mouldboard plough tillage. Tillage, even just once every 15 years or so,
can result in a large one-off loss of soil C.
So if prior to replanting the new cultivar, the soil were then tilled and say fumigated to prevent
specific apple replant disorder (SARD), soil C would be respired by this tillage. Furthermore if,
during orchard redevelopment, the C captured and stored in the trees‘ standing biomass were
then burnt that would negate the gains of the 15 years of capture.
There are options for conserving soil C during orchard redevelopment. If there were no need to
change the rootstock, then grafting onto the existing rootstock would be advantageous from a C
stocks viewpoint. However, in both the cases of new planting and even grafting, some part of the
standing biomass of the old trees would need to be removed. This wood, could possibly be used

59
Soil Carbon Report prepared for AGMARDT
to substitute for primary material in another process, or the wood could be biocharred. The
biochar could then be incorporated back into the soil during redevelopment. It would even be
worthwhile assessing whether biochar has any value in preventing SARD.
4.8 Production systems: Integrated and Organic
The only completed inter-comparisons of an integrated orchard with an organic one are those
published by Cary et al. (2009) for kiwifruit, and Deurer et al. (2008b) for apples. We have
discussed the key results from Carey et al. (2009) above, and here we provide more detail about
the results from Deurer et al. (2008b).
Figure 4.6 show photographs of the integrated and organic apples orchards studied by Deurer et
al. (2008b). This case study involved an organic and a neighbouring integrated apple production
system in the Hawke‘s Bay. The neighbouring orchards have the same general soil
characteristics. The soils are Fluvisols and have a silt-loam texture. The organic orchard system
had been under organic management (BioGro) since 1997. The apple trees in the orchard were
13 years old. The apple variety was ‗Braeburn‘, and the rootstock variety was ‗MM.106‘. Green-
waste compost was applied to the topsoil of the tree rows in the organic orchard once a year at a
rate of 5 to 10 t/ha, and lime was added at a rate of 300 kg/ha every 4 years. Lime-sulfur and
copper were used as fungicides if needed.
The apple trees in the adjacent integrated orchard system were 12 years old. The apple variety
was Pacific Rose™, and the rootstock variety was MM.106. A 0.5-m wide strip under the trees
was kept bare by regular herbicide applications. The apple trees were drip-irrigated during the
vegetative period. The irrigation, nutrient, and pest management followed the guidelines of
integrated fruit production.
Organic Integrated
Figure 4.8 The total soil C depth wise in the tree-row and alley of an organic apple orchard
(left) and an integrated orchard (right). From Deurer et al. (2008b).
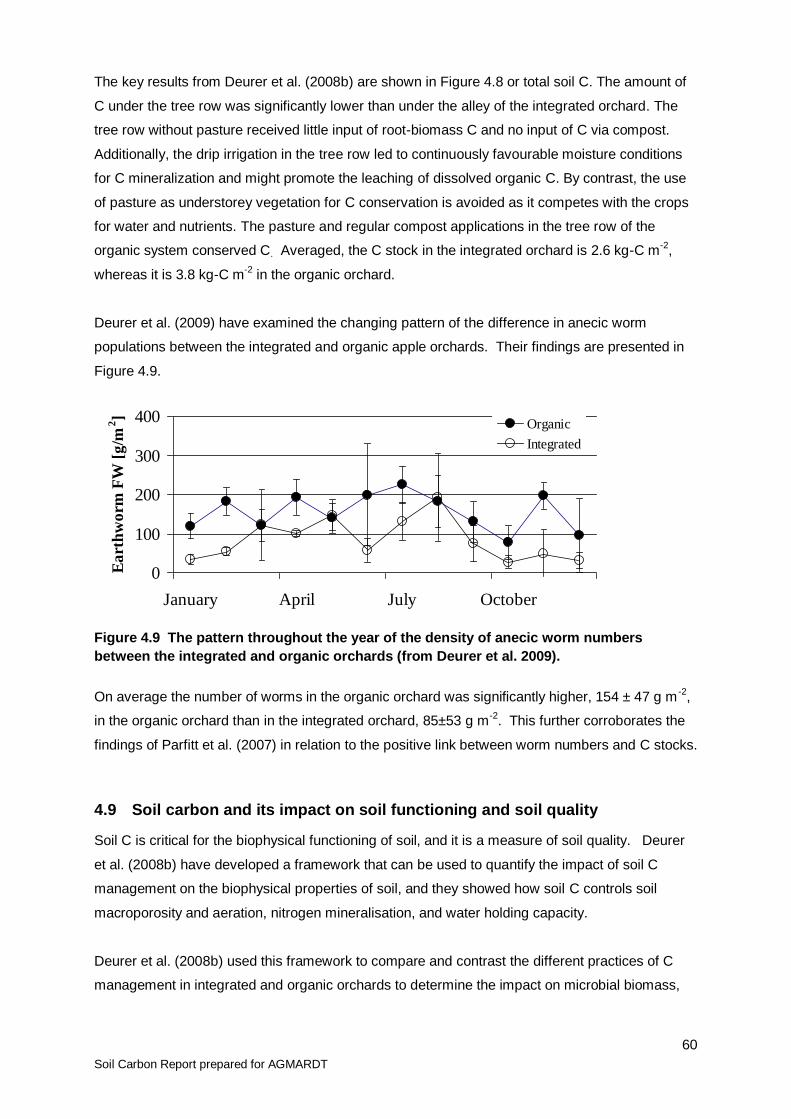
60
Soil Carbon Report prepared for AGMARDT
The key results from Deurer et al. (2008b) are shown in Figure 4.8 or total soil C. The amount of
C under the tree row was significantly lower than under the alley of the integrated orchard. The
tree row without pasture received little input of root-biomass C and no input of C via compost.
Additionally, the drip irrigation in the tree row led to continuously favourable moisture conditions
for C mineralization and might promote the leaching of dissolved organic C. By contrast, the use
of pasture as understorey vegetation for C conservation is avoided as it competes with the crops
for water and nutrients. The pasture and regular compost applications in the tree row of the
organic system conserved C. Averaged, the C stock in the integrated orchard is 2.6 kg-C m-2
,
whereas it is 3.8 kg-C m-2
in the organic orchard.
Deurer et al. (2009) have examined the changing pattern of the difference in anecic worm
populations between the integrated and organic apple orchards. Their findings are presented in
Figure 4.9.
Figure 4.9 The pattern throughout the year of the density of anecic worm numbers
between the integrated and organic orchards (from Deurer et al. 2009).
On average the number of worms in the organic orchard was significantly higher, 154 ± 47 g m-2
,
in the organic orchard than in the integrated orchard, 85±53 g m-2
. This further corroborates the
findings of Parfitt et al. (2007) in relation to the positive link between worm numbers and C stocks.
4.9 Soil carbon and its impact on soil functioning and soil quality
Soil C is critical for the biophysical functioning of soil, and it is a measure of soil quality. Deurer
et al. (2008b) have developed a framework that can be used to quantify the impact of soil C
management on the biophysical properties of soil, and they showed how soil C controls soil
macroporosity and aeration, nitrogen mineralisation, and water holding capacity.
Deurer et al. (2008b) used this framework to compare and contrast the different practices of C
management in integrated and organic orchards to determine the impact on microbial biomass,
0
100
200
300
400
January April July October
Ea
rth
wo
rm F
W [
g/m
2]
Organic
Integrated

61
Soil Carbon Report prepared for AGMARDT
basal respiration, dehydrogenase activity, the respiratory quotient, aggregate stability and the
pore diameter near saturation. They concluded that:
the impact of C management extended further down the soil profile in the integrated, than
in the organic orchard.
the lower soil C status in the tree row of the integrated orchard resulted in a decrease in
microbial activities.
the lower soil C status in the tree row of the integrated orchard led to a decrease in
aggregate stability. The soil C conservation in the organic orchard improved the
aggregate stability.
for soil functions that are sensitive either to a decrease in microbial activity or aggregate
stability the soil management was sustainable in the organic system but not in the
integrated system.
Deurer et al. (2009) used 3-D X-ray computed tomography to examine the impact of soil C
management on the porous structure of the soil from the integrated and organic orchards.
Images of the two soils are presented here in Figure 4.10 and there it is possible to see the
differences in the sizes and connectedness of the pores in the two different orchard systems.
From these images it is possible to extract pore-size characteristics, and the spatial distribution in
these characteristics. Macropores are defined here as being pores with a radius greater than 0.3
mm. For the integrated system the macropores occupied 2.9% of the soil‘s volume, and had a
mean radius of 0.38 mm. The soil of the organic orchard had 32% more soil C, and here the
macropores occupied 8.3% of the soil‘s volume, and the mean macropore diameter was 0.41
mm.
Figure 4.10 The macropore networks as ‘seen’ by 3-D x-ray tomography for the integrated
apple orchard (left) and the organic orchard (right). The soil on the left has a microbial C
biomass of 73 g-C m-2
and that on the right has 143 g-C m-2
.
62
Soil Carbon Report prepared for AGMARDT
The impact of this enhanced macroporosity on soil aeration can be determined by using these
pore size characteristics in a physical model of diffusion in porous media. Deurer et al. (2009)
found that the relative diffusion coefficient of air in the soil (relative to free-air) was over fourfold
higher in the organic soil than in the integrated orchard. This macroporosity is sustained in part by
the higher numbers of worms (Figure 4.9), and also through the higher microbial biomass-C
(Figure 4.11).
Figure 4.11 The seasonal pattern in a microbial biomass-C in the organic orchard and the
integrated orchard.
The biophysical attributes of the soil are enhanced in the soil with a higher level of soil C. Kim et
al. (2009) examined these two soils to determine their biochemical functioning, in particular in
relation to nutrient provision through nitrogen mineralisation. Their data are presented in Figure
4.12 and show the clear relationship in these orchard soils between the labile C fraction of the
hot-water extractable C (HWC).
0
50
100
150
200
250
January April July October
Mic
rob
ial
bio
ma
ss C
[g
/m2]
Organic
Integrated
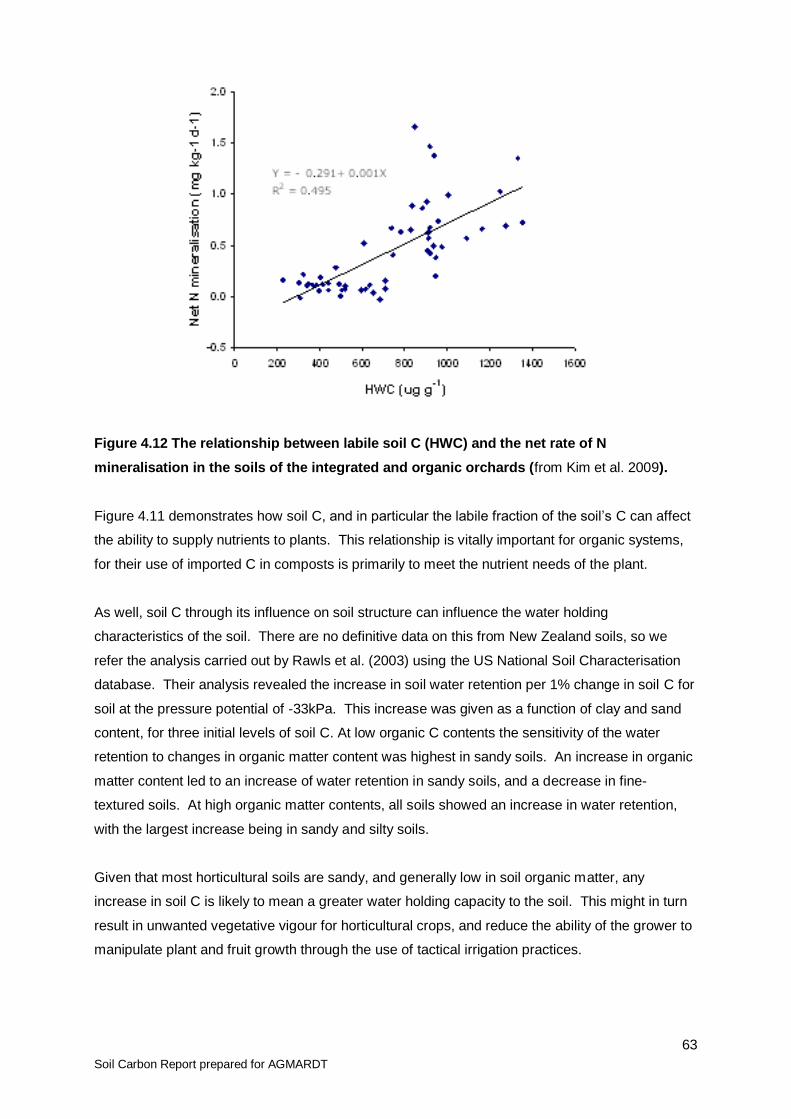
63
Soil Carbon Report prepared for AGMARDT
Figure 4.12 The relationship between labile soil C (HWC) and the net rate of N
mineralisation in the soils of the integrated and organic orchards (from Kim et al. 2009).
Figure 4.11 demonstrates how soil C, and in particular the labile fraction of the soil‘s C can affect
the ability to supply nutrients to plants. This relationship is vitally important for organic systems,
for their use of imported C in composts is primarily to meet the nutrient needs of the plant.
As well, soil C through its influence on soil structure can influence the water holding
characteristics of the soil. There are no definitive data on this from New Zealand soils, so we
refer the analysis carried out by Rawls et al. (2003) using the US National Soil Characterisation
database. Their analysis revealed the increase in soil water retention per 1% change in soil C for
soil at the pressure potential of -33kPa. This increase was given as a function of clay and sand
content, for three initial levels of soil C. At low organic C contents the sensitivity of the water
retention to changes in organic matter content was highest in sandy soils. An increase in organic
matter content led to an increase of water retention in sandy soils, and a decrease in fine-
textured soils. At high organic matter contents, all soils showed an increase in water retention,
with the largest increase being in sandy and silty soils.
Given that most horticultural soils are sandy, and generally low in soil organic matter, any
increase in soil C is likely to mean a greater water holding capacity to the soil. This might in turn
result in unwanted vegetative vigour for horticultural crops, and reduce the ability of the grower to
manipulate plant and fruit growth through the use of tactical irrigation practices.
64
Soil Carbon Report prepared for AGMARDT
5. Arable Soils
Summary
Levels of C in arable and, especially, vegetable-producing soils can be much lower than in
pastoral soils. To raise soil C levels, it is necessary to either increase C inputs from crop residues
or decrease the rate of decomposition. Managing crops to maximize yields (e.g., by providing
adequate nutrition for the crop) should also maximize C returns in post-harvest residues. Crop
type has a strong influence on C returns in plant residues, with perennial grasses (pasture)
returning largest amounts, vegetable crops the least, and small-grain cereals being intermediate.
In the long-term, burning of crop residues can cause depletion of soil C. Switching from intensive
cultivation to low-disturbance tillage may be beneficial in increasing C, though further work is
needed to quantify the C sequestration potential of no tillage under New Zealand conditions.
Although a reduction in tillage intensity can sometimes increase C inputs (by improving yield), the
effect of tillage on C soil is mainly related to its influence on the rate of decomposition.
Suggestions for increasing soil Carbon under cropping
Cropping systems have a high harvest index, meaning much of the captured carbon (up to 50%) is exported in the grain. Tillage practices expose and promote mineralisation of soil organic matter. In combination, these are constant drains on soil carbon stocks.
To increase soil carbon:
Encourage organic matter recycling:
Adopt residue management practices that maximise carbon returns to the soil. About half of the above-ground crop C (~ 2-5 t C/ha, depending on crop type and yield) will usually be present in post-harvest residues.
Avoid burning straw where possible (an important residue management practice for cereals, especially in Canterbury) but note that field experiments have been inconsistent regarding the benefits of straw retention for soil carbon.
To be detectable against background variability, increases in soil C may need to be greater than 4 or 5 t/ha. As the annual gain in C due to residue retention may only be a few hundred kilograms her hectare, it may be 10 or more years before an increase in soil can be measured.
To increase biomass inputs:
Eliminate factors that restrict crop growth (e.g., inadequate fertilisation) to help maximize carbon inputs in crop residues. Although avoiding water deficits by irrigation may increase carbon inputs, irrigation may also increase the decomposition rate of organic matter and the net effect on soil carbon is difficult to predict
Remedy soil physical conditions that limit root growth (e.g., soil compaction) as they reduce crop carbon inputs.
In many annual crops, roots make up a small fraction (~10%) of total plant biomass. Selective breeding for cereal crops with larger root biomass may in the long term provide arable farmers with soil carbon enhancing cultivars.
Grow cover crops rather than leave land fallow over winter to add carbon to the soil. If grazed in situ, a significant proportion of crop carbon will be returned to the soil in dung.
65
Soil Carbon Report prepared for AGMARDT
5.1 Carbon cycling in arable soils
Carbon levels in soils are a function of inputs from plant residues (above-ground residues, roots,
and root exudates) and outputs of CO2-C derived from the microbial decomposition of organic
matter (including plant residues). The C content of the soil will change if the balance between C
inputs and C outputs is altered.
Inputs of C depend on crop yield, the harvest index (the proportion of above-ground biomass that
is harvested and removed), and the mass of roots that the crop produces. Yield is, of course,
strongly influenced by water and nutrient availability and good management of both water and
fertiliser is essential to maximize C inputs to the soil.
The harvest index of small grain cereals is generally about 0.5 (Table 5.1), so that a crop yielding
10 t/ha of grain would produce a similar amount of above-ground residues (straw). C usually
makes up 40-45% of residue dry matter. Therefore, a 10 t/ha cereal grain crop would return 4 to
4.5 t/ha of C to the soil in straw. If the entire crop is harvested (e.g, for silage) essentially all of the
above-ground biomass is removed and the C input will be small. Similarly, above-ground C inputs
may be small when straw is burned to facilitate the establishment of the next crop. There is good
evidence that the harvest index of some arable crops has increased during the past century as a
result of plant selection and breeding (Evans, 1998). Although the proportion of
photosynthetically-fixed C that is returned to the soil may have diminished over time, the actual
Including a pasture phase in arable rotations can increase soil carbon. Perennial grasses return large quantities of carbon to the soil because (1) they have a large root mass and (2) most of the above-ground dry matter consumed by grazing animals is returned to the soil in dung.
To decrease carbon losses
Manage tillage practices
Adoption of no-tillage is often advocated as a way of increasing soil C. While no-till
soils often have higher C levels near the soil surface (top 7.5 or 10 cm) than
ploughed soils, the reverse may be the case deeper in the profile. Lal (2009)
recently suggested that the seemingly higher C concentrations under no-till could
be due to shallow depth of sampling.
Avoid soil erosion:
Implement appropriate soil conservation practices to avoid erosion of carbon-rich surface soil where there is a risk of water or wind erosion.
Minimise leaching
Avoid excessive irrigation to limit leaching of dissolved organic carbon. But note, leaching of dissolved organic carbon is likely to be relatively small in arable cropping systems, particularly in drier areas such as Canterbury.
Manage decomposition rate
The decomposition rate of organic matter depends to a large extent on temperature and soil moisture, but it can also be affected by the type of cultivation.

66
Soil Carbon Report prepared for AGMARDT
quantity of C added to the soil on above-ground residues is likely to have increased because of
the major yield improvements that have been achieved.
Whereas we have good data for above-ground C returns, information on root-C inputs is sparse
because of the difficulty of quantitatively extracting roots from soil. Information on the root to
shoot ratios is lacking for most arable crops grown in New Zealand (note: shoot = above-ground
biomass). It is well recognized that the proportion of plant C allocated to roots can vary
depending on the conditions in which the crop is grown, with crops in water-limited environments
having a relatively large root mass (Campbell and de Jong, 2001). Calculations using
unpublished data (G.S. Francis, personal communication) for barley and wheat grown in
Canterbury (Lincoln) suggest that the average root-to-shoot ratio is ~0.08 for barley and ~0.12 for
wheat. From a compilation of studies in Europe and North America, Williams (2006) showed that
the root:shoot ratio in small grains tends to decline as shoot biomass increases. Root mass (y)
was linearly related to shoot dry matter (x) by the equation:
y = 0.064 x + 0.34 (R2 = 0.84)
where root and shoot mass are in t/ha of dry matter. For crops producing 10 and 20 t/ha of
above-ground biomass, the root mass is estimated from this equation to be 1.0 and 1.6 t/ha,
respectively (i.e., C inputs of ~0.4 and 0.6 t/ha). Root mass in cereals often peaks at about
anthesis and then decreases as roots die off and decompose; root:shoot ratios reported above
are based on root mass measurements at anthesis and shoot measurements at, or near,
maturity. As they grow, plants release a variety of exudates into the soil. The quantity of C added
to the soil in root exudates is not known with any degree of certainty. It is thought that exudates
are decomposed very rapidly and contribute little to long-term soil C storage
C is released from the soil (as CO2) by the action of the microbial biomass in decomposing
indigenous soil organic matter and freshly added crop residues. The decomposition process is
strongly influenced by environmental conditions that affect microbial activity (temperature,
moisture, aeration), i.e., decomposition is most rapid under warm, moist conditions. Post-harvest
management can also have a strong influence on the rate of straw decomposition. Straw
remaining on the soil surface (no-till situation) will decompose at a much slower rate than straw
that is incorporated into the soil.
5.2 Soil carbon in arable soils – world view
Under arable cropping in NZ, C commonly makes up 2-3% of topsoil (0-15 cm) mass. The total
amount of C in the top 30 cm of arable land has been estimated for several regions in New
Zealand (Fig. 4.1). Regional median values range from about 80 to 100 t/ha, with considerable

67
Soil Carbon Report prepared for AGMARDT
variability within each region due to factors such as management history, soil type (clay soils tend
to be higher in C than sandy soil), and climatic differences.
C levels in NZ arable soils appear generally similar to those found in temperate regions
elsewhere. The average C content of arable soils in England (5.2 million ha) is about 2.5% in the
top 15 cm (King et al., 2005). Much of Canada‘s wheat is produced on land that has about 2-3%
C in the topsoil.
5.3 Soil carbon in NZ arable soils
Soil C levels change when the input of C into the soil differs from the amount of CO2-C released
when organic matter (including fresh plant residues) decomposes. On an annual basis, changes
in soil C are usually small (often much less than 1 t/ha under arable cropping) because inputs
and outputs approximately match. Although high-yielding crops may return over 5 t/ha of C to the
soil, most of this C is in compounds (cellulose, hemicelluse) that are easily decomposed. It is
often observed that about three-quarters of cereal straw decomposes in the year following
incorporation. The decomposition process is strongly temperature dependent (Douglas and
Rickman, 1992) and, under NZ‘s generally warm conditions (soil temperature usually > 5oC),
decomposition can usually proceed throughout the entire year. Studies in Canterbury (Lincoln)
have shown that only 21-39% of wheat straw remained in the soil 10 months after incorporation
(Curtin and Fraser, 2003). Assuming that 70-80% of straw decomposes within a year, less than 1
t/ha of residue-C would remain in the soil one year after incorporation of straw from a high-
yielding crop (4-5 t/ha of C added in straw). Decomposition of indigenous soil organic matter will
also release C, though its rate of decomposition is much lower than that of fresh plant residues.
As annual changes in soil C are small compared to the total quantity of C in arable soils (often 80-
100 t/ha to 30 cm), several years are usually needed to identify a trend in total soil C. Even within
a uniformly managed paddock there can be substantial spatial variability in soil C and changes
may need to exceed 3-4 t/ha to be detectable against background variability.
Straw management (removal vs. retention) is potentially an important factor affecting C levels in
arable soil. Burning continues to be a predominant residue management practice, particularly in
Canterbury. Currently, about 60,000 ha of crop residues are burned annually (53,000 ha in
Canterbury). The effect of straw management on C content of NZ arable soils is not known with
certainty. In a six-year trial in Canterbury, there was no significant difference in C between plots
where all of the straw was returned and plots where it was burned or removed (Curtin and Fraser,
2003). Under cooler conditions of northern Europe, increases in soil C due to straw retention
have been observed in long-term trials (Smith et al., 1997). The annual gain in soil C due to straw
retention has been estimated at 0.7 t/ha in Europe (Smith et al., 2005).
68
Soil Carbon Report prepared for AGMARDT
5.4 Effect of cultivation practices
Cultivation mixes plant litter into the soil and improves the contact between residues and soil,
which facilitates microbial colonization. Due partly to more favourable moisture conditions for
microbial activity, soil-incorporated residues decompose at a faster rate than residues on the soil
surface. Cultivation can also disrupt soil aggregates, exposing organic matter that was previously
protected in the interior of aggregates to microbial decomposition. Elimination of tillage (adoption
of no-till) can alter the distribution of C in the soil profile. Under no-till, C tends to accumulate
close to the soil surface and is moved downwards only slowly by processes such as earthworm
activity. In intensively cultivated soil, C is uniformly distributed through the plough layer (top 20
cm). Because decomposition may occur more slowly under no tillage, there can be an increase in
soil C; however, the amount and rate of change following adoption of no-tillage can vary
depending on climatic conditions, soil type and the starting soil C level.
The effect of no-tillage on soil C has been studied extensively overseas. From a global database
of 67 long-term experiments, West and Post (2002) estimated that a change from conventional to
no-tillage may increase soil C by an average of 570 kg/ha per year. Increases in soil C following
conversion to no-tillage was estimated to peak in 5-10 years, with soil C reaching a new
equilibrium in 15-20 years. There is evidence that the soil C gain under no-tillage can differ
regionally, depending on climate, crops grown, residue quality, and possibly other factors
including earthworm activity (Gregorich et al., 2005). For example, cropping soils in semiarid
western Canada often show increases in C after switching to no-tillage (Campbell et al., 1996)
whereas in humid eastern Canada no-tillage does not appear to have a beneficial effect on soil C
(Gregorich et al., 2005). Recently, Blanco-Canqui and Lal (2008) have questioned the view that
no-tillage can increase soil C. They suggested that many studies reporting differences between
conventional and no-tillage based on shallow sampling need to be re-evaluated. In studies in
Ohio, Kentucky and Pennsylvania, soil C (0-10 cm depth) was higher under no-tillage than under
conventional tillage in five of eleven comparisons, but total C to 60 cm was not significantly
affected by tillage intensity (Blanco-Canqui and Lal, 2008).
It is estimated that about 20% of all seeding in New Zealand is currently done by no-tillage
compared with <4% in 1990 (C. Ross, Landcare Research, pers. comm.). The impact of the
expansion of no-tillage on soil C is still open to debate. Several studies have confirmed that no-till
soils can have higher concentrations of C near the soil surface (0-10 cm; Aslam et al., 1999,
2000) but published assessments that included the full depth of cultivation (preferably
measurements to 30 cm) are not available.
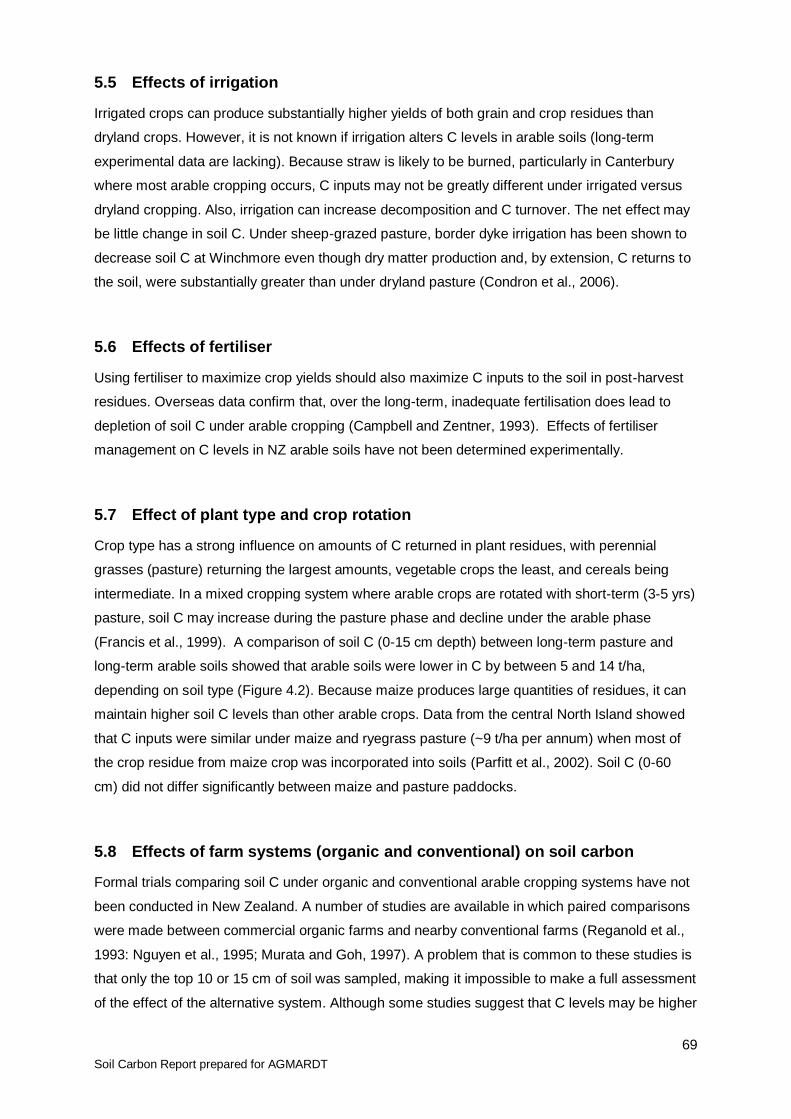
69
Soil Carbon Report prepared for AGMARDT
5.5 Effects of irrigation
Irrigated crops can produce substantially higher yields of both grain and crop residues than
dryland crops. However, it is not known if irrigation alters C levels in arable soils (long-term
experimental data are lacking). Because straw is likely to be burned, particularly in Canterbury
where most arable cropping occurs, C inputs may not be greatly different under irrigated versus
dryland cropping. Also, irrigation can increase decomposition and C turnover. The net effect may
be little change in soil C. Under sheep-grazed pasture, border dyke irrigation has been shown to
decrease soil C at Winchmore even though dry matter production and, by extension, C returns to
the soil, were substantially greater than under dryland pasture (Condron et al., 2006).
5.6 Effects of fertiliser
Using fertiliser to maximize crop yields should also maximize C inputs to the soil in post-harvest
residues. Overseas data confirm that, over the long-term, inadequate fertilisation does lead to
depletion of soil C under arable cropping (Campbell and Zentner, 1993). Effects of fertiliser
management on C levels in NZ arable soils have not been determined experimentally.
5.7 Effect of plant type and crop rotation
Crop type has a strong influence on amounts of C returned in plant residues, with perennial
grasses (pasture) returning the largest amounts, vegetable crops the least, and cereals being
intermediate. In a mixed cropping system where arable crops are rotated with short-term (3-5 yrs)
pasture, soil C may increase during the pasture phase and decline under the arable phase
(Francis et al., 1999). A comparison of soil C (0-15 cm depth) between long-term pasture and
long-term arable soils showed that arable soils were lower in C by between 5 and 14 t/ha,
depending on soil type (Figure 4.2). Because maize produces large quantities of residues, it can
maintain higher soil C levels than other arable crops. Data from the central North Island showed
that C inputs were similar under maize and ryegrass pasture (~9 t/ha per annum) when most of
the crop residue from maize crop was incorporated into soils (Parfitt et al., 2002). Soil C (0-60
cm) did not differ significantly between maize and pasture paddocks.
5.8 Effects of farm systems (organic and conventional) on soil carbon
Formal trials comparing soil C under organic and conventional arable cropping systems have not
been conducted in New Zealand. A number of studies are available in which paired comparisons
were made between commercial organic farms and nearby conventional farms (Reganold et al.,
1993: Nguyen et al., 1995; Murata and Goh, 1997). A problem that is common to these studies is
that only the top 10 or 15 cm of soil was sampled, making it impossible to make a full assessment
of the effect of the alternative system. Although some studies suggest that C levels may be higher
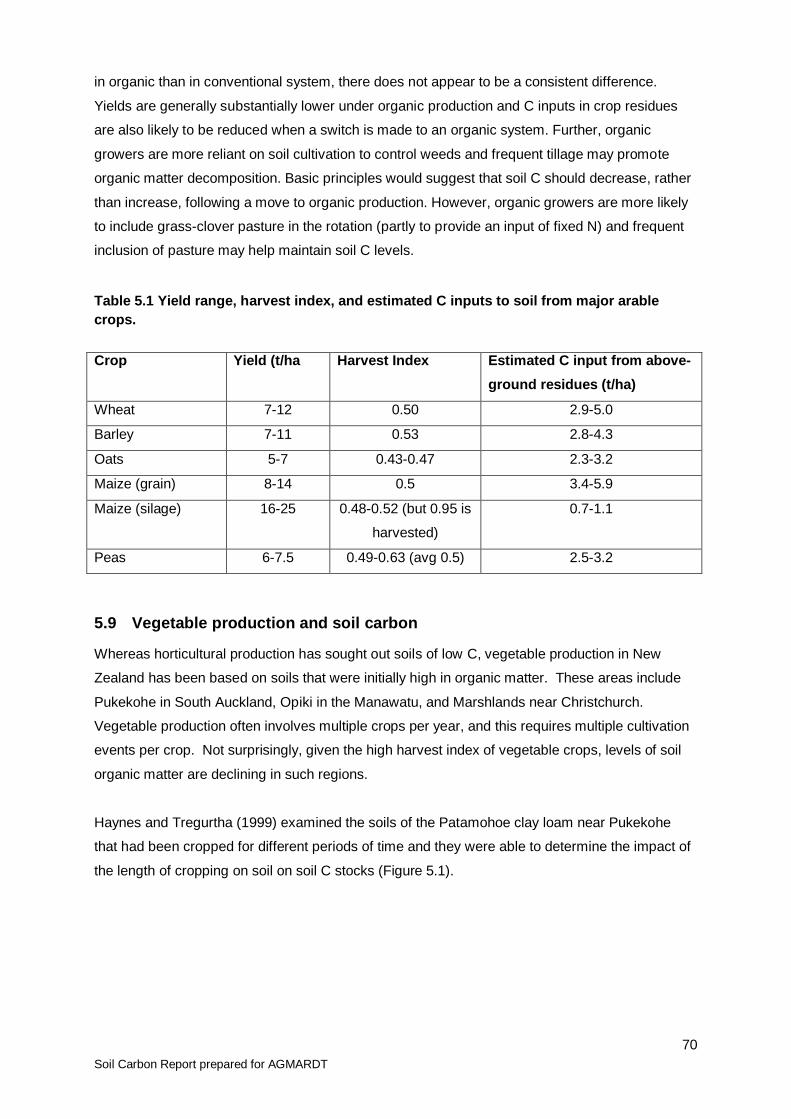
70
Soil Carbon Report prepared for AGMARDT
in organic than in conventional system, there does not appear to be a consistent difference.
Yields are generally substantially lower under organic production and C inputs in crop residues
are also likely to be reduced when a switch is made to an organic system. Further, organic
growers are more reliant on soil cultivation to control weeds and frequent tillage may promote
organic matter decomposition. Basic principles would suggest that soil C should decrease, rather
than increase, following a move to organic production. However, organic growers are more likely
to include grass-clover pasture in the rotation (partly to provide an input of fixed N) and frequent
inclusion of pasture may help maintain soil C levels.
Table 5.1 Yield range, harvest index, and estimated C inputs to soil from major arable
crops.
Crop Yield (t/ha Harvest Index Estimated C input from above-
ground residues (t/ha)
Wheat 7-12 0.50 2.9-5.0
Barley 7-11 0.53 2.8-4.3
Oats 5-7 0.43-0.47 2.3-3.2
Maize (grain) 8-14 0.5 3.4-5.9
Maize (silage) 16-25 0.48-0.52 (but 0.95 is
harvested)
0.7-1.1
Peas 6-7.5 0.49-0.63 (avg 0.5) 2.5-3.2
5.9 Vegetable production and soil carbon
Whereas horticultural production has sought out soils of low C, vegetable production in New
Zealand has been based on soils that were initially high in organic matter. These areas include
Pukekohe in South Auckland, Opiki in the Manawatu, and Marshlands near Christchurch.
Vegetable production often involves multiple crops per year, and this requires multiple cultivation
events per crop. Not surprisingly, given the high harvest index of vegetable crops, levels of soil
organic matter are declining in such regions.
Haynes and Tregurtha (1999) examined the soils of the Patamohoe clay loam near Pukekohe
that had been cropped for different periods of time and they were able to determine the impact of
the length of cropping on soil on soil C stocks (Figure 5.1).

71
Soil Carbon Report prepared for AGMARDT
Figure 5.1 The impact of the length of intensive vegetable production on soil C stocks 0-
15 cm in a Patamohoe clay loam near Pukekohe (Haynes and Tregurtha, 1999).
The drop off in soil C soon after the commencement of intensive vegetable production is
dramatic, and then it appears to slow down and stabilise at low values after 40 or so years.
Because of the loss of soil function at low values of soil C, vegetable growers are adopting less
intensive cultivation practices and building multiple-use beds. Also, they are importing composts
to raise levels of soil C.
Koerber et al. (2009) have determined geographical variation in the C balance of soils growing
vegetables. For a range of vegetable crops across a range of European and African regions they
calculated the net ecosystem production (NEP) and net biome production (NBP). NEP is net
primary production, namely aboveground C allocation plus belowground C allocation, less C
emitted by decomposition in the soil. NBP is NEP less the C removed at harvest. The NEP and
NBP were mainly negative (Figure 5.2 ), hence results like Figure 5.2 are to be expected. The
study stressed the importance of soil losses of C in the life cycle of vegetables.
To minimise the soil C loss from crop production, and also in the long term to improve soil
functioning, Koerber et al. (2009) recommended that there be greater returns of organic matter to
the soil.

72
Soil Carbon Report prepared for AGMARDT
Figure 5.2 The net ecosystem production (NEP) of C (t-C ha-1
yr-1
) during vegetable
production for various crops in various regions (top), and the net biome production
(NBP=NEP less C removed at harvest) (bottom) (Koerber et al. 2009).
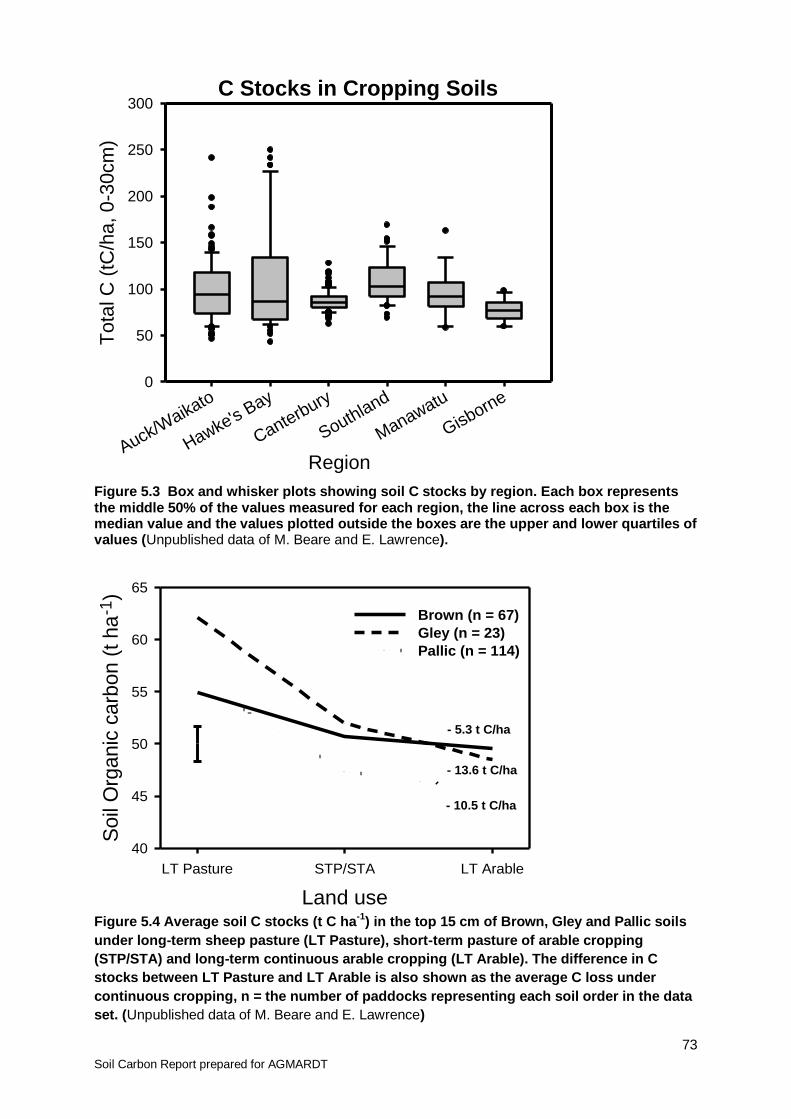
73
Soil Carbon Report prepared for AGMARDT
C Stocks in Cropping Soils
RegionAuck/W
aikato
Hawke's Bay
Canterbury
Southland
Manawatu
Gisborne
To
tal C
(tC
/ha
, 0
-30cm
)
0
50
100
150
200
250
300
Figure 5.3 Box and whisker plots showing soil C stocks by region. Each box represents the middle 50% of the values measured for each region, the line across each box is the median value and the values plotted outside the boxes are the upper and lower quartiles of values (Unpublished data of M. Beare and E. Lawrence).
Land use
LT Pasture STP/STA LT Arable
Soil
Org
anic
carb
on (
t ha
-1)
40
45
50
55
60
65
Brown (n = 67)
Gley (n = 23)
Pallic (n = 114)
- 5.3 t C/ha
- 13.6 t C/ha
- 10.5 t C/ha
Figure 5.4 Average soil C stocks (t C ha
-1) in the top 15 cm of Brown, Gley and Pallic soils
under long-term sheep pasture (LT Pasture), short-term pasture of arable cropping
(STP/STA) and long-term continuous arable cropping (LT Arable). The difference in C
stocks between LT Pasture and LT Arable is also shown as the average C loss under
continuous cropping, n = the number of paddocks representing each soil order in the data
set. (Unpublished data of M. Beare and E. Lawrence)
74
Soil Carbon Report prepared for AGMARDT
5.10 Predicting effects of management practices on soil carbon
A computer-based tool called the Land Management Index (LMI) has been developed by
Plant and Food Research that can be used by farmers to predict how specific
management practices will affect soil C levels (Figure 4.5). The LMI is based on scientific
measurement of crop and tillage factors and soil quality indicators on 750 paddocks, covering a
wide range of soil types, land uses and management practices across New Zealand. The LMI
decision support tool is designed for use on arable, vegetable (process and fresh sectors) and
extensive sheep/beef pastoral farms on flat and rolling lands of New Zealand.
The four LMI Soil Quality Indicators are: - Soil structural stability - Soil structural condition - Soil organic matter (total C) - Biologically active C.
The LMI allows farmers to: 1. predict changes in soil quality (including C) and the likely effects of this on crop
performance (losses or gains) based on soil and crop management information,
2. explore the effects of applying different management practices (e.g. tillage type, crop
rotation) on soil quality.
3. identify best management practices and options to mitigate any adverse effects of land
use change and intensification on soil quality.
The LMI decision support tool is available on CD (free-of charge) through Plant and Food
Research, contact Erin Lawrence ([email protected]). It can also be obtained through
Regional Councils and the Foundation for Arable Research. The system is easy to run, and has a
help guide and e-mail support.

75
Soil Carbon Report prepared for AGMARDT
Figure 4.5 Land Management Index (LMI) decision support system (opening screen)

76
Soil Carbon Report prepared for AGMARDT
6. Opportunities for increasing carbon sequestration
Summary For most pastoral soils there are few production gains from lifting soil C levels beyond the target
range (see Section 6), which for most soils covers a wide range of C contents (3.5-9.0%). There
would be an interest in arresting any long-term decline, if the soil C content was below 3-4%.
Similarly, as mentioned frequently above, there is little interest, over and above maintaining
essential soil health, in increasing the fertility of horticultural soils. However, arable soils would
benefit considerably by enhancing soil C stocks in the plough zones both from production and
environmental viewpoints. Realising this, arable land that is rested under pasture rotation is
sought after by vegetable growers who are prepared to pay higher premium for leasing such land
from owners. Conservation of soil C is already covered in the arable section of this review. This
section will deal with other options that can aid in building soil C stocks such as the addition of
organic wastes (e.g. bio-solids, pulp and paper waste, green waste and manures inclusion of tree
options in pasture systems as well as agrichar and biochar in agricultural soils.
6.1 Bio-solids, green wastes, manures
Organic waste materials are good source of C. Application of these materials on agricultural soils,
particularly to soils under arable agriculture will benefit not only to improve soil C but will also help
in improving porosity, water retention supplementing nutrients for plant growth etc. Given the
wide C:N ratios in these waste materials which ranges from 10:1 to 250:1, large amounts of
waste-derived C (typically between 4 to 12 tonnes) are applied to soils each year. A large
proportion of this C particularly from solid waste may become a part of the soil organic matter and
remain in soils for a longer periods of time. There are a number of sources of C rich waste
materials available in New Zealand that can be applied on land such as municipal biosolids, herd
home manure, pulp and paper biosolids, poultry and piggery waste. There are also a number of
farm and industrial effluents that are commonly applied onto land in New Zealand that contain
significant amounts of C including; farm dairy, dairy factory, meat processing, poultry and piggery
effluents etc (see section 2.7). Green waste, which is generally blended with other waste
materials to produced green manure or dumped into landfills, can be composted or converted into
more stable forms of C in biochar. Application of these wastes on land would have a positive
effect on soil C sequestration. Given that intensification of land use is negatively impacting on the
soil C levels in New Zealand (Ghani et al., 1996; Lambert et al., 2000; Schipper et al., 2007), it is
good stewardship to protect soil C levels by multiple management options for example, minimum
tillage, incorporation of manures into soils, and restricting intensification etc.

77
Soil Carbon Report prepared for AGMARDT
6.1.1 Availability of organic solid and semi-solid waste materials in NZ
Potentially available C from some of the solid or semi-solid organic wastes that can be applied on
land to accumulate C is listed in Table 7.1. It is estimated that more than 234,000 dry tonnes of
biosolids are produced in New Zealand (MfE database, 2006). Based on the average C content in
biosolids being 30% (Ghani et al. 2003b), this would equate to nearly 89,000 tonnes of C in
biosolids that can be potentially applied on land to increase C in soils. A substantial amount of C
from green waste can be converted into biochar which is thought to be a reasonable stable form
of C (Lehmann, 2007). Collectively, approximately 2.4 million tonnes of woody and green waste
biomass is available for biochar conversion in New Zealand from municipal amenities,
households, horticulture and arable cropping. Manures from herd-homes and wintering-off pads
contain significant amounts of C and are generally applied on the soils for which no C adjustment
is currently made. At present only 20% of the farms use wintering pads. Therefore, the quantity of
manure produced is relatively small at the moment but it is expected to increase as more and
more environmental compliance is enforced on farmers encouraging them to house animals or
keep animals on pads during the winter period.
Table 7.1 Some of the organic waste available annually in New Zealand that can be
applied on land to enhance C sequestration in soils. Carbon contents in various
wastes have been calculated based on the average concentration measured in
various wastes. (from Ghani et al. 2008b)
Waste Dry weight
(tonnes)
% C
(w/w)
% N
(w/w)
C:N C content
(tonnes)
Biosolids1 234,000 30 1.0 30:1 70,250
Pulp and Paper
Waste
150,000 40 0.5 80:1 60,000
Dairy manure2 30,000 38 2.0 19:1 11,400
Green waste3 182,5000 40 1.8 22:1 730,000
Horticulture woody
residues4
46,500 40 ND ND 18560
Agricultural crop
residues4
508,000 35 ND ND 177800
1 MfE Database 2003-2006
2 20% of national herd using herd-homes, wintering barns or stand-off pads for 60 days during winter.
Calculation of net wt of manure have been based on the information provided Gonzales-Avalos and
Ruiz-Suarez, (2001). 3
Green Party NZ data on estimation of green waste going to landfills 4
Hall P and Gifford J (2008) Bioenergy Options for New Zealand, Scion 2008
ND means no data was available
There are a number of co-benefits to increasing C content in soils through application of organic
waste materials such as less reliance on imported nutrients, and improved biodiversity of micro-
and meso-fauna and also increased water holding capacity. To ensure land remains productive
78
Soil Carbon Report prepared for AGMARDT
and fit for growing plants that can be consumed by humans, organic waste materials that may
pollute soil with heavy metals, endocrine disruptors and harmful microorganisms should be
treated with care. However, some of the land mining areas that are already polluted with heavy
metals and not suitable for agricultural production, less desirable organic wastes can be used to
produce biomass that can be used for biofuel i.e. not entering food chain (Ghani et al. 2008b).
6.1.2 Carbon accumulation in soils through application of waste
There is very little New Zealand data showing impacts of application of solid or semi-solid waste
materials on soil C. There are a number of studies published from overseas showing increases in
soil C levels due to application of biosolids (see Fig. 1.11 Rothamstead Cropping trial, UK).
Biosolids contain a high proportion of their total C in lignin and cellulose, forms which decompose
very slowly, hence with annual or biannual application of biosolids even at 200 kg N/ha equivalent
application rate, levels of soil C increase over time. A relatively medium-term study (4 years)
being conducted at Lincoln university shows build up of C in the top 10 cm of the soil profile (Ron
McLaren, personal communication, 2008). He noted higher build-up of C when biosolids were
applied at higher rates of N (Table 4). A short-term (6 months) study conducted by Ghani et al.
(2003b) observed over 50% of the non-decomposed biosolids remained within the soils, a
qualitative evidence of increased C in soils. Su et al. (2007) reported a significant increase in soil
C in the top 100 mm soil when biosolids were repeatedly applied at 600 kg N/ha every three
years since 1997 (Table 6.2). Evidence from these studies further reinforces the point that C
sequestration in soils can be achieved through application of organic waste materials.
6.1.3 Co-benefits of carbon sequestration in soils
Besides offsetting the emissions from other production systems, there are a number of co-
benefits of increasing C in soils particularly in C deficient and lighter soils. These benefits include:
More nutrients, less reliance on imported nutrients
Enhanced biodiversity in soil ecosystems
Reducing nitrate leaching through increased immobilisation of N by C rich wastes
Better moisture retention due to increased organic matter
Better structural stability particularly in lighter soils
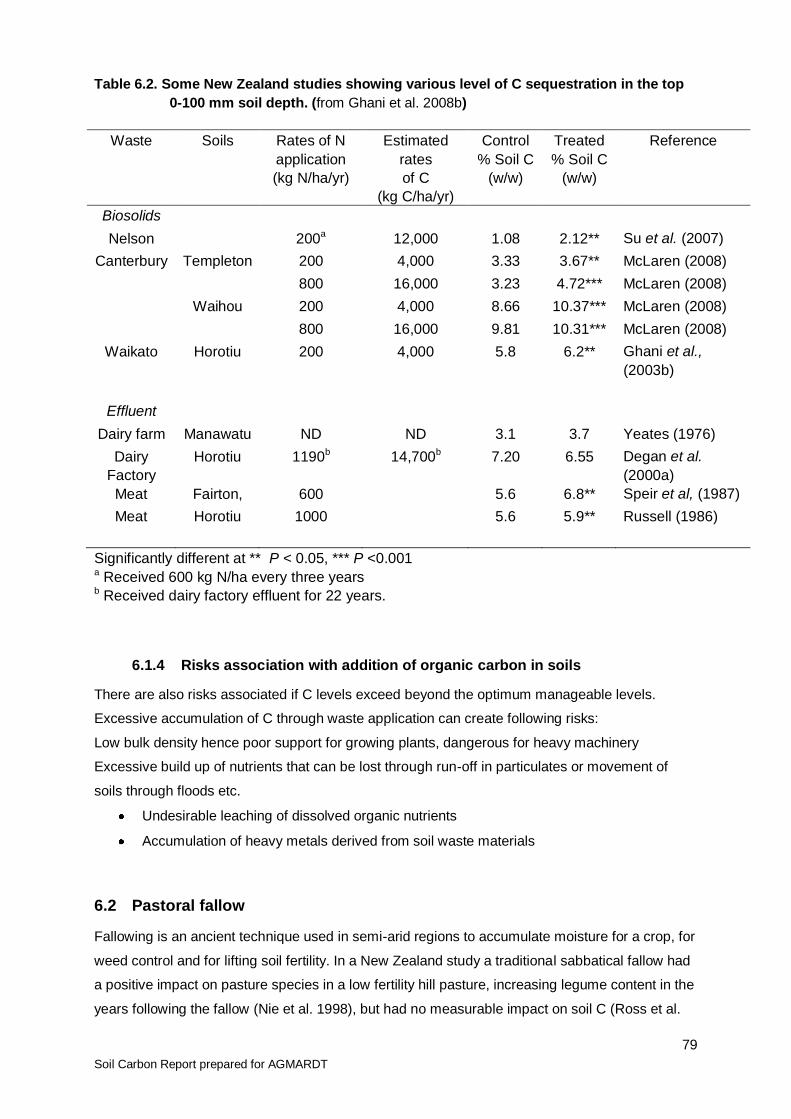
79
Soil Carbon Report prepared for AGMARDT
Table 6.2. Some New Zealand studies showing various level of C sequestration in the top
0-100 mm soil depth. (from Ghani et al. 2008b)
Waste Soils Rates of N
application
(kg N/ha/yr)
Estimated
rates
of C
(kg C/ha/yr)
Control
% Soil C
(w/w)
Treated
% Soil C
(w/w)
Reference
Biosolids
Nelson 200a 12,000 1.08 2.12** Su et al. (2007)
Canterbury Templeton 200 4,000 3.33 3.67** McLaren (2008)
800 16,000 3.23 4.72*** McLaren (2008)
Waihou 200 4,000 8.66 10.37*** McLaren (2008)
800 16,000 9.81 10.31*** McLaren (2008)
Waikato Horotiu 200 4,000 5.8 6.2** Ghani et al.,
(2003b)
Effluent
Dairy farm Manawatu ND ND 3.1 3.7 Yeates (1976)
Dairy
Factory
Horotiu 1190b 14,700b 7.20 6.55 Degan et al.
(2000a)
Meat Fairton, 600 5.6 6.8** Speir et al, (1987)
Meat Horotiu 1000 5.6 5.9** Russell (1986)
Significantly different at ** P < 0.05, *** P <0.001 a Received 600 kg N/ha every three years b Received dairy factory effluent for 22 years.
6.1.4 Risks association with addition of organic carbon in soils
There are also risks associated if C levels exceed beyond the optimum manageable levels.
Excessive accumulation of C through waste application can create following risks:
Low bulk density hence poor support for growing plants, dangerous for heavy machinery
Excessive build up of nutrients that can be lost through run-off in particulates or movement of
soils through floods etc.
Undesirable leaching of dissolved organic nutrients
Accumulation of heavy metals derived from soil waste materials
6.2 Pastoral fallow
Fallowing is an ancient technique used in semi-arid regions to accumulate moisture for a crop, for
weed control and for lifting soil fertility. In a New Zealand study a traditional sabbatical fallow had
a positive impact on pasture species in a low fertility hill pasture, increasing legume content in the
years following the fallow (Nie et al. 1998), but had no measurable impact on soil C (Ross et al.

80
Soil Carbon Report prepared for AGMARDT
1995). The high soil organic C contents of the soil might been one reason for finding no change
in soil C content, despite the input of a large amount of C over the duration of the fallow, which
included the spring, summer autumn months. In a soil with little soil C a fallow might offer an
approach for adding large amounts of C in situ.
6.3 Tree pasture systems
There is some evidence to show that under mature agroforestry systems the organic C content of
the soil is higher than that of a pasture or cropped soil (Young 1997). Data in NZ on the effect of
poplar and willow, planted for increasing the stability and hence sustainability of hill soils, on soil
C stock is scarce. In one of the very few studies Guevara et al. (2002) found no difference in the
soil C stocks in the topsoil of a pasture-poplar system in 3 of the 4 sites he examined. While the
type and nature of the litter from the trees within a pasture-poplar system would tend to have a
long-half life than the litter from pasture plants, the soils under poplar have a higher pH than open
pasture, encouraging greater microbial activity and litter turnover.
Figure 6.1. Poplar pasture system in the Hawkes Bay of NZ.
Figure 6.2. Estimates of the static C pools in the poplar-pasture (PP) and open pasture (OP)
systems at the Pohangina 1 site. Numbers indicate C (t/ha) for the topsoil (0-75 mm) and
vegetative components of two systems. When Guevara et al., (2002) added the C stocks in the
standing poplar trees to the C stock in the topsoil of the pasture-poplar systems, there was 30%
more C than in the open alongside. This was for a system with 37-40 mature poplar stems/ha.

81
Soil Carbon Report prepared for AGMARDT
Figure 6.2 Estimation of C pool in poplar-pasture system.
A more detailed examination of the effect of conservation plant on soil C levels is warranted, as is
a fresh analysis of the scope that poplar-pasture and willow-pasture systems might have as a
systems option for increasing C stocks above 1990 baseline values. With heavier and/or more
frequent extreme rainfalls expected, especially where mean rainfall increases are predicted under
New Zealand climate projections for the 2030‘s and 2080‘s (MfE 2004, updated in NIWA 2007)
there may be up to a four-fold reduction in storm return period by 2080‘s, although there is little
quantitative information available. The frequency of extra tropical cyclones (which bring large
storm events to the north and east of New Zealand) is predicted to decrease but their intensity is
expected to increase. If rainfall increases as predicted for many parts of the country, then
erosion rates can be expected to increase substantially. Soil C losses via erosion processes
already represent a significant part of the national C budget. Those losses are being used at
present to explain why soil C levels in hill soils are still increasing. Increasing the stability of
landscapes has the potential to increase current accumulation rates.
Exploring how the tree pasture systems might best be assembled to capture a future C market
warrants future study, as it has the potential to offer multiple benefits to both the land owner and
wider community.
6.4 Managing soil carbon sequestering through biochar
there is little interest, over and above maintaining essential soil health, in increasing the fertility of
horticultural soils, for this would only result in negative consequences through creating excessive
vegetative vigour. So increasing the ‗active‘ stocks of soil C is not a favoured option for
integrated orchard systems. Nonetheless, there could be value and benefit in using horticultural
soils for storage of ‗inactive‘ forms of C, such as biochar.
82
Soil Carbon Report prepared for AGMARDT
Biochar is a charcoal produced from biomass. The context of biochar as a soil C sequestration
strategy relies on biomass of charcoal produced by pyrolysis. Biochar is the residue of pyrolysis.
Under complete or partial exclusion of oxygen, ‗waste‘ biomass is heated to moderate
temperatures, usually between 400 and 500°C (namely low temperature pyrolysis), yielding fuel
energy, and biochar as a C-rich and more stable by-product.
Biochar seems especially well suited for a use in orchard/vineyard systems. For example, it
should not increase vegetative vigour. As opposed to other biomass-derived C materials (e.g.,
compost), biochar is not easily decomposed. As a consequence, the application of biochar does
not lead to large amounts of plant-available nutrients such as nitrogen in soil. Also biochar could
improve the efficiency of fertilizers, and possibly reduce the leaching of nitrogen and phosphorus,
thus improving the overall eco-efficiency of nutrient management in orchards/vineyards (see
below).
Recently biochar has been discussed nationally, and internationally, as a potential strategy for
soil-C sequestration. Biochar needs to fulfil at least four criteria to be a successful strategy for soil
C sequestration in orchards/vineyard systems: The half-life of biochar that is incorporated into soil
needs to be at least 100 years. This is the criterion for any strategy to be considered as a soil C
sequestration under the IPCC and other regulatory frameworks, such as the proposed PAS 2050
(British Standards Institute, 2008)
The use of biochar results in a net reduction of equivalent CO2 emissions for a horticultural
enterprise. A full life cycle analysis, including the energy needed for its production, transport and
incorporation into the soil thus needs to be considered
Biochar could become locally available at a cost-effective price, and large amounts of biochar
could be incorporated into soils without compromising the product yield and quality in
orchards/vineyards
There would, at present, seem to be no short or long-term negative consequences of biochar
applications for product yield and quality or for the environment.
6.4.1 Stability of biochar in soils
Large accumulations of charred material with residence times in excess of 1000 years have been
found in soil profiles (Saldarriaga & West 1986; Glaser et al. 2001; Forbes et al. 2006). Most
authors (Glaser et al. 2003) attribute the presence of large stocks of pyrogenic black C, as can be
found in Amazonian dark earths or terra preta several hundred years after the cessation of
activities that added it to the soil, to its chemical recalcitrance.
83
Soil Carbon Report prepared for AGMARDT
However, very little is known about the half-life of specific types of ‗industrial‘ biochar. The
recalcitrance of biochar in soils depends on a multitude of factors, including the type of biomass
used for pyrolysis, the pyrolysis conditions, soil properties, and local climate. Typically, the half-
life of biochar from low-temperature pyrolysis is longer than 100 years (Lehmann et al. 2006;
Singh & Cowie 2008).
The adaptation of microorganisms in the soil to biochar, as a C source, might lead to a shorter
half-life of biochar, given that certain microorganisms exist that are able to live with biochar as the
sole C source (Hamer et al. 2004).
6.4.2 Net reduction of equivalent CO2 emissions due to the use of biochar
Biochar leads to a reduction of equivalent CO2 emissions from soils because of its long half-life
compared with other biomass-derived C (e.g., compost). However, the slow pyrolysis-based
bioenergy systems produce not only biochar for soil C sequestration, but also energy. The
combined use of energy production and soil C sequestration avoids about 2–19 t CO2e ha-1
year-
1. Some 41–64% of these avoided emissions are related to the retention of C in biochar; the rest
to the offsetting fossil fuel use for energy, fertilizer savings, and avoidance of soil emissions other
than CO2, such as nitrous oxide (Gaunt & Lehmann 2008).
The proportion of C retained in biochar during pyrolysis varies with pyrolysis temperature and the
type of biomass (Lehmann et al. 2006). A typical level of C recovery is 50% of the initial C
content. This C has a typical half-life of more than 100 years (Lehmann et al. 2003, 2006).
6.4.3 Practicality and cost-effectiveness of biochar use
While no large-scale facility for low-temperature pyrolysis is currently available in New Zealand,
this might change. Another question relates to how much biochar can be effectively and
practically applied to soils.
From the data available for highly weathered tropical soils, it appears that crops respond
positively to biochar additions up to 50 t C/ha, and may only show growth reductions at very high
application rates (Lehmann et al. 2006). For most plant species and soil conditions, this maximum
was not reached even with applications/additions of 140 t C/ha (Lehmann et al. 2006). We note
that most knowledge is derived from experiments with highly weathered tropical soils and very
low natural soil organic C contents. Little is known about the effect of biochar additions to
relatively fertile soils in a temperate climate.
The cost of incorporating biochar in soil, instead of using biomass solely for electricity generation,
was estimated as US $47/t of CO2 contained in biochar (Gaunt & Lehmann 2008). This does not

84
Soil Carbon Report prepared for AGMARDT
incorporate the additional costs associated with the transport of biochar from the pyrolysis plant to
the site of application, and the ‗costs‘ of incorporation of biochar into soil in existing enterprises.
Currently, the market price for one tonne of CO2 is US $9–16/t, and, therefore, the incorporation
of biochar in soil is not yet a cost-effective option (Gaunt & Lehmann 2008). However, future C
prices and emissions-trading costs could be much higher, for example, in the European Union
Emission Trading Scheme the price is US $20, and would lie around US $25–85 if the social
costs of climate change were used as the basis for the calculation (Stern 2007).
6.4.4 Possible short- or long-term consequences of biochar applications
No published data are available on the possible negative consequences of biochar applications in
soil, at least those that are based on field-scale studies. Field-scale studies of biochar
incorporated into soils have only recently started. Below we give an assessment of the potential
risks that have not yet been evaluated thoroughly, especially under the horticultural conditions of
New Zealand‘s soils and climate.
The type of biomass and pyrolysis conditions can modify the amount and composition of
phytotoxic and potentially carcinogenic organic materials that are byproducts of pyrolysis (Lima et
al. 2005).
Biochar contains aromatic and aliphatic organic compounds that may cause or enhance the
occurrence of soil water repellency. Many New Zealand soils have been found to be water
repellent after dry summers, which causes a decrease in pasture growth (Deurer et al. 2008a).
The run-off of water and nutrients into surface waters is also another deleterious consequence of
repellency (Doerr et al. 2000). Many topsoils in New Zealand already have very high C contents,
and the C content is generally positively correlated with the occurrence of water repellency (Doerr
et al. 2000). Although no studies have yet been undertaken to investigate if biochar could cause
or enhance soil water repellency, water repellency was reported to occur in reclaimed mine soils
that contained sandy sediment mixtures with significant proportions of lignite (brown coal) (Gerke
et al. 2001). Another indication of the potential risk of using biochar and causing soil water
repellency is that hydrophobicity often occurs in topsoils after forest fires, which in a way ‗mimics‘
pyrolysis (Doerr et al. 2000).
A study in boreal forests conclude that the potential of biochar for soil-C sequestration might be
overstated (Wardle et al. 2008). In this study, charcoal was prepared and mixed with the forest
soils, then left in the soils of different contrasting forest stands in northern Sweden for 10 years.
Because of the incorporation of biochar microorganisms significantly increased. As a
consequence, the loss of ‗native‘ soil organic matter increased, and the net soil C sequestration
was small. How this might relate to productive enterprises, such as orchards/vineyards, is
unknown.
85
Soil Carbon Report prepared for AGMARDT
6.4.5 Impact of biochar on physical and chemical soil properties
It has been found that in highly weathered, coarse-textured soils, biochar improves the soil‘s
filtering and buffering capacity for nutrients.
Biochar adsorbs more cations per unit C than most other soil organic matter, because of its
greater surface area, greater negative surface charge, and greater charge density (Liang et al.
2006). However, the magnitude of the cation-exchange capacity depends on the type of biomass,
and pyrolysis conditions. Also, the biochar‘s properties can change considerably with time during
the exposure to the soil environment (Lehmann 2007).
Biochar retains nutrients, especially nitrogen and phosphorus (Glaser et al. 2002; Lehmann et al.
2003), and also increases the nitrogen fertilizer-use efficiency for plants (Chan et al. 2007).
Biochar was found to have reduced the leaching of nitrate, ammonium, phosphorus and other
ionic compounds (Beaton et al. 1960; Radovic et al. 2001; Lehmann et al. 2003; Mizuata et al.
2004), and has also been observed to absorb hydrophobic organic contaminants (Gustaffson et
al. 1997; Accardi-Dey & Gschwend 2002).
In highly weathered, coarse-textured soils, biochar improves the soil‘s water retention properties.
In Amazonian charcoal-rich anthrosols, the field water-retention capacity was 18% higher than for
surrounding soil without charcoal (Glaser et al. 2002). However, in another study (Tryon 1948)
with three different textures (sandy, clayey and loamy), charcoal increased the plant-available
water contents in the sandy soil, but had no effect in the loamy soil, and decreased it in the
clayey soil.
86
Soil Carbon Report prepared for AGMARDT
7. Soil carbon as a soil quality indicator and soil natural capital
and ecosystems services
The C in SOM represents a significant reservoir of C within the global C cycle. Sequestrating C in
soils has the potential to be a GHG mitigation option for some soils in New Zealand, and would
increase their versatility by adding to their natural capital (e.g. hill soils). On other soils, sustaining
current levels might be a challenge, as is the current situation under pasture agriculture on
lowland soils and under a number of horticultural and arable practices.
At present, the amount of organic C stored in soil is not part of the C budget considered under the
Kyoto protocol. This seems almost unbelievable as it is known that soil is a huge store of C and to
be influenced by land management practices and natural events (e.g., erosion). The omission of
soil C from the C budget and from trading seems surprising (ignoring the elephant in the room?),
given the potential magnitude that changes in soil C could have on national and global C
balances There have been suggestions that C depleted soils could be used to sequester (store)
extra C by appropriate management (Lal 2001; Paustian et al.1997), and that farmers could earn
credits simply by increasing the C content of their soils. However, to date no such trading in soil
organic C has been established.
Sparling et al. (2006) modelled the benefits of restoring organic matter on C depleted soils (after
prolonged cropping) for both increased production and for the hypothetical value if NZ
landowners were recompensed by trading on international markets for the increased C storage in
soil. They estimated that over the recovery period (which took from 36-125 years) the benefit of
increasing soil C content to pasture production was NZ$546–1237 (per ha basis). This amount
was small compared to the NZ$1619–NZ$16 001 if the stored C had been able to be traded for C
credits (typically NZ$6–17 per tonne of C). The environmental ―value‖ in conserving and
increasing soil C is much greater than the benefits to production under typical pasture
management in New Zealand. That environmental value was only estimated for C storage and
does not include additional benefits such as nitrogen storage, soil stability, resistance to erosion,
regulation of water flows and chemical buffering. Inclusion of those environmental services would
increase further the value of soil organic C.
In this section current knowledge on soil C as a soil quality indicator is reviewed. The
implications of using sequestered C in soils as a potential C-offset for GHG emissions, on the
interpretation and setting of the optimum C content and target range for this soil quality indicator
are also discussed. The concept of natural capital stocks of our soils is introduced in this section,
as is the use of this approach in measuring and valuing the soils ecosystems services.

87
Soil Carbon Report prepared for AGMARDT
7.1 Soil carbon and soil quality indicators
Organic C/ organic matter (SOM) is at the living heart of soil. SOM affects a range of soil
attributes and processes. For example soil C influences soil microbial diversity and health,
nutrient and water cycling, soil aggregate building and stability, filtering and buffering of the soil‘s
water through to colour. These attributes and processes underpin the soils natural capital and
ecosystem services which includes, supporting, provisioning, regulating and socio-cultural
services (See section 8.2). Because of the pivotal role soil C plays in soil function, it is a very
useful soil quality indicator for a wider range of soil services. With soil C sequestration emerging
as a potential C-off-set for GHG emissions, measuring soil C for quantifying C stocks in soil, has
added another use for this soil quality indicator. In this section of the report current knowledge on
soil C as a soil quality indicator (―fitness for purpose‖) is reviewed and summarised. The
implications of using C sequestered in soils as a potential C-offset for GHG emissions, on the
setting and interpretation of the optimum and target range for this soil quality indicator is also
discussed
7.1.1 Soil quality indicators
Soil quality indicators inform use about the characteristics or condition of the soil. A large number
of soil properties have been proposed as indicators of soil quality, but to be an effective and
quantitative indicator, the property needs to have an interpretive framework. Ideally, a response
curve is available to show the relationship between a quantitative soil characteristic and the
production, environmental or social goal of interest and how that is influenced by land use or land
management practices. We need to know whether a particular value is desirable, and what to do
about it if it is not. The interpretation of indicators is usually based on one of the following
descriptions: `More is better‘, `Less is better‘ or an `Optimum Range‘. The setting of targets for
soil quality characteristics has proved contentious, with a divergence of opinion about what
constitutes good soil quality. Much of the contention arises because of the question ―Soil quality
for what purpose?‖ Fitness for purpose is also raised as part of that debate. A very good
example is the optimum soil C content for pasture or crop management, versus the optimum soil
C content for viticulture. For pasture and cropping more is better and for viticulture production
less is better. This example also raises the potential conflict between production and
environmental goals within a land use. Under a pastoral use increasing soil C aligns with both
improved production and environmental outcomes. Under viticulture this is not the case with
declining soil C an undesirable environmental goal. Due to differing pedogenesis, soils have
different characteristics, and hence the target and optimum range a target that is attainable and
suitable for one soil may not be appropriate for another (Fig. 1.2).
88
Soil Carbon Report prepared for AGMARDT
7.1.2 Soil quality indicators for NZ soils
Provisional targets for state-of-the-environment indicators have been published in Provisional
targets for soil quality indicators in New Zealand (Sparling et al. 2003). The indicators include a
measure of soil acidity (soil pH); two measures of compaction (bulk density and macroporosity); a
measure of soil P fertility (Olsen P); and three measures of soil organic matter (total C, total N
and mineralisable N). Response curves have also been derived for some additional soil quality
measures, including earthworm numbers, aggregate stability, depth of topsoil, potential rooting
depth, and the C and N balance. The soil quality response curves for each of the above
indicators, along with the optimum and target range were derived by averaging the views of a
wide range of experts. This is a useful approach where knowledge is incomplete, because it
allows experimental data, statistical metrics, and simulation modelling where available to be
synthesized with personal experience, anecdotal evidence, and best guesses based on an
understanding of soil processes and relationships (Sparling et al. 2003a). Three of the soil quality
indicators, including soil C were re-examined with some revision made in 2007 (Beare et al.
2007).
7.1.3 Soil carbon as a soil quality indicator
Total C (TC) measures the amount of C (C) in soil. In New Zealand soils, TC is largely organic C
in soil organic matter (a complex mixture of organic compounds originating from living and
partially decomposed plant, microbial and animal remains), but can also include inert forms such
as charcoal and inorganic forms such as carbonates. Total C is generally measured in the
surface soil horizon where C content is greatest, often from 0−7.5 or 0−10 cm depth. With soil C
becoming a commodity the depth of sampling has been extended to 30 cm in line with
international standards. Total C contents are normally reported as percentage C (%C = weight of
C/weight of dry soil x 100), but can also be expressed as weight per volume (preferred for valid
comparison between different soils where bulk density may differ). Soils differ in the amounts of
organic matter they contain depending on their mineralogy, climate and land use.

89
Soil Carbon Report prepared for AGMARDT
Figure 7.1 Expert soil quality response curves for total C.
The Semi-Arid Soils, Pumice and Recent formed one distinct group, and Allophanic soils another
distinct group, sufficiently different to warrant their own specific response curves. As the organic
soil order, by definition, contains more than 16% C, C content is not a useful measure of soil
quality for that order. The response curves fitted the ―more is better‖ model. Total C targets for
soil quality for environmental protection were higher than those for production (Fig. 7.1)
The target for the Semi-Arid soil order was lower than other orders (Table 5.1) recognising that
organic matter content in that soil type and environment rarely attain the levels of other soil
orders. Conversely, total C contents for the Allophanic soils are higher than the others because
the high contents of allophanic clays and hydroxy-aluminium compounds tend to stabilise larger
amounts of organic C in those soils. Relatively little information is available on the relationship
between total soil C and pasture productivity across a range of different soil orders. The
consensus at the present time is that pasture production is insensitive to a change in soil C
across the target range. A similar conclusion is reached for forest productivity. Our
understanding of the relationship between total soil C and productivity is probably most advanced
for cropping soils (Section 4). There appears to be no information showing the direct linkage, if
any, between soil organic C and performance of horticultural crops.

90
Soil Carbon Report prepared for AGMARDT
Table 7.1. Provisional quality classes and target ranges for total C.
There were no upper limits defined (more is better), but there will be a point where the organic
matter content reduces bulk density. The desirable lowest level for Allophanic Soils was 3%, for
Semi-Arid, Pumice and Recent Soils the lower limit was 2%, and 2.5% for all other orders except
the Organic Soils (Table 7.1).
The setting of a lower limit is contentious. Sparling et al. (2003a) suggested a justifiable lower
limit could be based on the concept of intergenerational equity (e.g. current generations do not
have the right to deplete non-renewable resources to the disadvantage of the next generation). In
terms of soil organic C, this suggests that total C should not be depleted to a point where it
cannot be restored within a 25-year timeframe (Table 1.4).
For each land use there will be an optimum amount of soil organic matter for achieving production
and environmental goals. There will also be a range around that optimum value for which there
appears to be little measurable change in production or environmental outcomes, but will have a
significant impact on the C budget. Inclusion of soil C as a potential C-offset for GHG emissions,
will require a rethink of the current target range or fit for purpose definition for this soil quality
indicator and a revision of the provisional targets for state-of-the-environment indicators published
in Provisional targets for soil quality indicators in New Zealand (Sparling et al. 2003a) and
undated by (Beare et al. 2007).
7.2 Natural capital and ecosystems services
7.2.1 Soil Natural Capital
Natural capital is the extension of the economic idea of capital (manufactured means of
production: buildings) to environmental goods and services. Natural capital is thus the stock of
natural ecosystems that yields a flow of valuable ecosystem goods or services into the future
(Costanza & Daly 1992). Soils across the globe are significant and perhaps an unheralded
91
Soil Carbon Report prepared for AGMARDT
category of natural capital, even in industrial and post-industrial economies less dependent on
agriculture. Soils are considered to be ―critical‖ natural capital (Ekins et al. 2003), as food
production and other ecosystem services would not be available without soils and human survival
would not be possible. Soils cannot be replaced or simply substituted by any manufactured
capital, in any absolute sense, although at the margins some substitutions are possible through
for example the use of hydroponics.
Only a fraction of the goods and services the soil-plant-atmosphere systems which cloak our
earth provide are valued within the world‘s economy. In a landmark paper in Nature, Costanza et
al. (1997) estimated the annual value of 17 terrestrial ecosystem services, all involving the soil-
plant-atmosphere system, to be US$5.74 trillion. In ―Growing for Good‖, Morgan Williams (PCE,
2004) noted that New Zealanders are highly dependent on our natural capital stocks of our
waters, soils and biodiversity to sustain our wealth-generating capacities.
It is often thought that New Zealand is blessed with large areas of versatile and elite soils rich in
organic matter (i.e. high in natural capital) that supply beneficent productive and ecosystem
services. However, the reality is that over 65% of New Zealand soils have a physical limitation to
use for pastoral agriculture (i.e. limited natural capital) and the hectares suitable for sustained
horticultural and arable use are even smaller (Mackay 2008). This lack of natural capital in some
soils can be linked directly to their low SOM contents. Practices that actively built SOM would
add natural capital value to these soils. Addressing the physical limitations in others, e.g. poor
drainage, has the potential to reduce SOM levels. Given that much of the present agricultural
expansion is on to our marginal and fragile landscapes, developing practices to lift SOM would be
an attractive proposition to land owners, offering not only potentially production gains, but also
increasing the efficiency of current resource use through better services of nutrient and water
regulation and by reducing nutrient leakage. In this section the concept of natural capital stocks of
our soils is introduced, as is the use of this approach in measuring and valuing the soils
ecosystems services.
Soils with high natural capital value for pastoral agriculture include those with deep silt loam-
texture and free-draining top soils (e.g. Allophanic and Brown soils). Soils with less natural capital
for pastoral agriculture include those with poorly developed structures (e.g. podzols), shallow soil
horizons and plant-rooting depth (e.g. stony soils), weak cation and anion storage and supply
capacities (e.g. coastal sands), and low water-holding capacity (e.g. gravels and pumice). For
New Zealand, natural capital of soil has been defined as the capacity of the soil to sustain a
legume-based pasture sown with improved germplasm, supplied with essential plant nutrients
other than N, kept at an optimum pH and under optimum grazing practice (Clothier et al. 2008). A
legume-based pasture is a self-regulating biological system with an upper limit on the amount of
N that can be fixed and made available for plant growth. This definition of the natural capital

92
Soil Carbon Report prepared for AGMARDT
reflects the underlying capacity of soil to retain and supply nutrients and water and sustain plant
growth under the pressure of grazing animals.
The introduction of a range of technologies, including irrigation, drainage, N fertiliser, wintering
pads, off-farm grazing and imported feeds, have lifted potential livestock production levels
significantly beyond the inherent productive capacity of the original legume-based pasture system
(Fig. 7.2). These production technologies have most benefitted those soils with the least natural
capital, but often at the expense of a greater impact on the environment. For example, drainage
is a production technology that can lift pasture growth rates, pasture utilisation and stocking rates
significantly, by removing excess water from poorly structured soils. However, drainage also
increases leaching volumes and nutrient losses to the wider environment, since many of our
poorly drained soils have low nutrient-retention capacities. To gain sustained benefits from
investment in drainage, and given the increasing threat to groundwater and surface water quality
from pastoral agriculture (Clothier 1997), an investment to compensate for the lack of soil
properties and processes that regulate nutrient emissions needs to be added.
Figure 7.2 Contribution of the natural capital of a soil and production technologies (Tech1
and 2) to production and emissions from a soil with either a low or high natural capital
(Mackay 2009).
Soil quality indicators have been used to assess the suitability a soil for a particular use, mainly in
regard to productive capacity but they haven‘t been linked to the notion of Natural Capital and
ecosystem services (Mackay 2008). Soil quality indicators inform us about the characteristics or
condition of the soil. There are two broad categories of indicators, those that describe properties
of soils (e.g. texture, mineralogy) that, along with extrinsic factors (e.g. climate), define their
suitability for particular land uses (e.g. arable, pastoral) and those indicators that change in
response to human use and management (e.g. soil organic matter, bulk density, biodiversity)
normally over relatively short time frames. Linked to soil processes they can inform the provision
Low High Low High
Pro
du
ctio
n/E
mis
sio
ns
Natural capital of soil
Tech2
Tech1
Production
Emissions
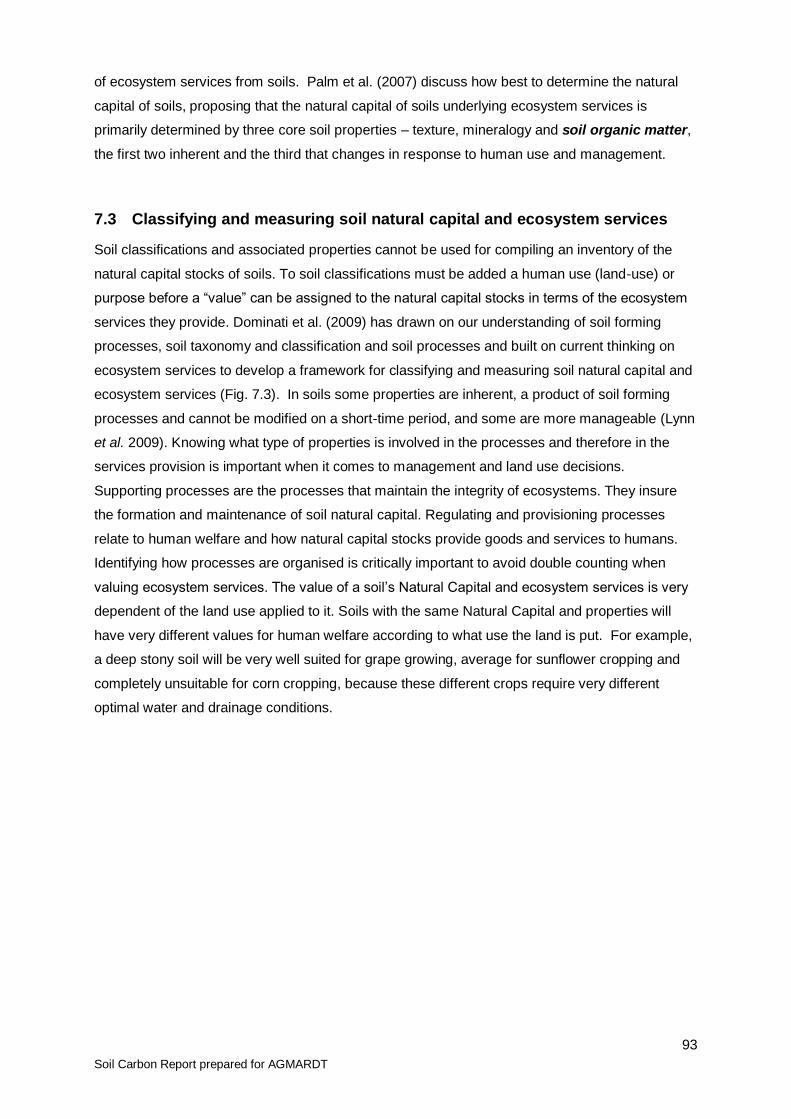
93
Soil Carbon Report prepared for AGMARDT
of ecosystem services from soils. Palm et al. (2007) discuss how best to determine the natural
capital of soils, proposing that the natural capital of soils underlying ecosystem services is
primarily determined by three core soil properties – texture, mineralogy and soil organic matter,
the first two inherent and the third that changes in response to human use and management.
7.3 Classifying and measuring soil natural capital and ecosystem services
Soil classifications and associated properties cannot be used for compiling an inventory of the
natural capital stocks of soils. To soil classifications must be added a human use (land-use) or
purpose before a ―value‖ can be assigned to the natural capital stocks in terms of the ecosystem
services they provide. Dominati et al. (2009) has drawn on our understanding of soil forming
processes, soil taxonomy and classification and soil processes and built on current thinking on
ecosystem services to develop a framework for classifying and measuring soil natural capital and
ecosystem services (Fig. 7.3). In soils some properties are inherent, a product of soil forming
processes and cannot be modified on a short-time period, and some are more manageable (Lynn
et al. 2009). Knowing what type of properties is involved in the processes and therefore in the
services provision is important when it comes to management and land use decisions.
Supporting processes are the processes that maintain the integrity of ecosystems. They insure
the formation and maintenance of soil natural capital. Regulating and provisioning processes
relate to human welfare and how natural capital stocks provide goods and services to humans.
Identifying how processes are organised is critically important to avoid double counting when
valuing ecosystem services. The value of a soil‘s Natural Capital and ecosystem services is very
dependent of the land use applied to it. Soils with the same Natural Capital and properties will
have very different values for human welfare according to what use the land is put. For example,
a deep stony soil will be very well suited for grape growing, average for sunflower cropping and
completely unsuitable for corn cropping, because these different crops require very different
optimal water and drainage conditions.
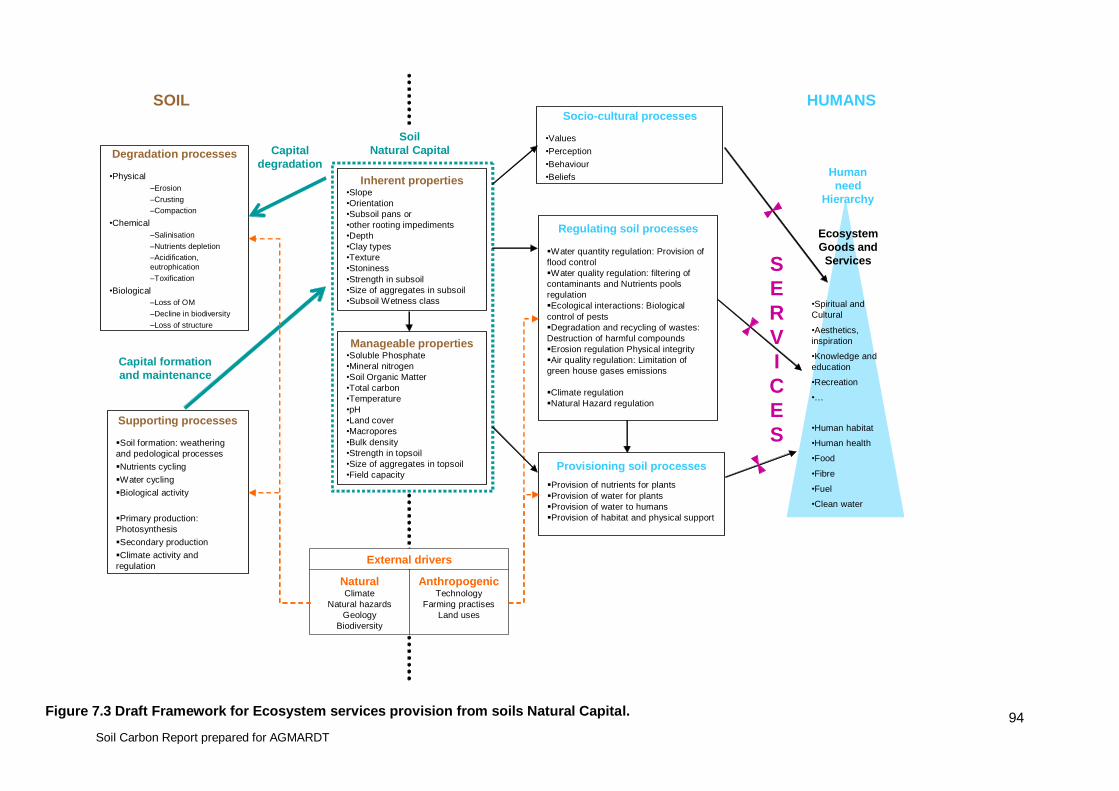
94
Soil Carbon Report prepared for AGMARDT
Regulating soil processes
Water quantity regulation: Provision of
flood control
Water quality regulation: filtering of
contaminants and Nutrients pools
regulation
Ecological interactions: Biological
control of pests
Degradation and recycling of wastes:
Destruction of harmful compounds
Erosion regulation Physical integrity
Air quality regulation: Limitation of
green house gases emissions
Climate regulation
Natural Hazard regulation
Supporting processes
Soil formation: weathering
and pedological processes
Nutrients cycling
Water cycling
Biological activity
Primary production:
Photosynthesis
Secondary production
Climate activity and
regulation
Provisioning soil processes
Provision of nutrients for plants
Provision of water for plants
Provision of water to humans
Provision of habitat and physical support
Capital
degradationDegradation processes
•Physical
–Erosion
–Crusting
–Compaction
•Chemical
–Salinisation
–Nutrients depletion
–Acidification,
eutrophication
–Toxification
•Biological
–Loss of OM
–Decline in biodiversity
–Loss of structure
Socio-cultural processes
•Values
•Perception
•Behaviour
•Beliefs
Capital formation
and maintenance
AnthropogenicTechnology
Farming practises
Land uses
NaturalClimate
Natural hazards
Geology
Biodiversity
External drivers
Inherent properties•Slope
•Orientation
•Subsoil pans or
•other rooting impediments
•Depth
•Clay types
•Texture
•Stoniness
•Strength in subsoil
•Size of aggregates in subsoil
•Subsoil Wetness class
Manageable properties•Soluble Phosphate
•Mineral nitrogen
•Soil Organic Matter
•Total carbon
•Temperature
•pH
•Land cover
•Macropores
•Bulk density
•Strength in topsoil
•Size of aggregates in topsoil
•Field capacity
Soil
Natural Capital
SOIL HUMANS
Ecosystem
Goods and
Services
•Spiritual and
Cultural
•Aesthetics,
inspiration
•Knowledge and
education
•Recreation
•…
•Human habitat
•Human health
•Food
•Fibre
•Fuel
•Clean water
Human
need
Hierarchy
S
E
R
V
I
C
E
S
Figure 7.3 Draft Framework for Ecosystem services provision from soils Natural Capital.
Prepared for May 2009 Title 92
7.4 Application of soil Natural capital in land management
A natural capital based approaches to land-use planning and managing nutrient and
land valuation is an emerging methodology that will in future be at the forefront of
sustainable developments, as the efficiency of agricultural production systems will be
measured increasingly on the basis of their sustainable exploitation of natural capital,
whilst minimising external costs to the environment. In this section of the report four
examples of the use of a natural capital approach to resource manage are briefly
described. The first and last example looks at how a change in soil C influences the
soils natural capital and how that affects the cost of production.
Valuing the carbon in a pastoral soil - Sparling et al. (2006) assessed the relative
value of organic matter for pasture production and for C and N sequestration, by
calculating the value in restoring organic matter in a depleted pastoral soil following
cropping. The value of soil organic matter to production was estimated from the value
of dairy milk solids based on a computer simulation of pasture dry matter yield and
organic matter accumulation. The hypothetical financial gain associated with organic
matter recovery if C credits were issued for organic C sequestration, and N credits for
N sequestration were also estimated. The simulations and estimates were completed
for three real-life contrasting soils and climate regimes in New Zealand. The analysis
provided only a partial estimate of the economic value of soil organic matter. It did not
include the contribution soil organic matter made to the other soil provisioning and
regulating services.
Natural Capital and Land-Use Planning - Productive-sector environments are
undergoing rapid land-use change in many regions of New Zealand, including the
northern region of the Kapiti Coast District. The northern region is currently
characterised by dairying, other pastoral and horticultural activities. But competition
from urban sub-division, and an increase in lifestyle properties are rapidly encroaching
on the viability of the land-based primary production sector. Consideration of the
natural capital value of a district‘s biophysical resources, along with consideration of its
ecosystem services, provided a means for policy analysts and the community to
assess and appraise future land-use options, their potential value and the
environmental impacts to assist the local community in long-term planning for the
District Council, through their Long Term Council Community Plan (Clothier et al.,
2008). Taking into account the value of a region‘s natural capital stocks and
ecosystem goods and services provided a more complete picture of the future options
for land-use and trade-offs.
93
Soil Carbon Report prepared for AGMARDT
Natural Capital and Nutrient Policy - It is imperative for our productive and
ecological futures that we sustainably manage our lands to protect the natural capital
of our ground and surface waters. We need to understand better how land-
management practices control groundwater quantity and quality (Clothier, 1997). How
could environmental policy for nutrient management in relation to nitrogen, across a
diverse landscape, be developed to protect the quality of our receiving waters better
through limiting leaching losses, without the need to be prescriptive about current or
future land uses, by linking directly to the soils natural capital. Horizons Regional
Council One Plan, which has been notified and is currently in front of Commissioner,
has adopted an approach that is independent of current land use and links a N loss
limit directly to the underlying natural biophysical resources (Clothier et al. 2008).
Allocating a N loss limit based on the natural capital of the soil in the catchment offers
an approach for developing policy that is linked directly to the underlying resources in
the catchment. This is not too dissimilar to the concept of a water-use take limit. It is
independent of current land use. The approach also provides a direct link between
soil properties (soil organic matter) and land practices and nutrient loss.
Change in natural capital through a change in soil carbon - The soil and climate
(―terroir‖) of viticultural land provides a ―natural capital‖ which growers exploit by
appropriate management to obtain desirable economic and environmental outcomes.
Using wine grapes as an example, we discuss here an approach to valuing this natural
capital, as a function of soil C, by using simple models to predict outcomes and
incorporating economic and environmental values of inputs and outputs.
Given a vine growth model, a soil, seasonal weather, and a management system, it is
possible with the aid of simple models to estimate both the economic return and the
environmental impact of operating a vineyard for one season. If environmental and
economic impacts are quantified in the same units, namely dollars, then these
seasonal outcomes can be summarised into a single monetary value. A comparative
value for the natural capital of the terroir is then defined as the expected value of this
total, which can be obtained by running the model (Hall et al. 2009) for a large number
of simulated, or historical, seasonal weather series, and averaging the results. We will
first run the model for a soil with a total C content of 1% v/v, and then re-run for the
same conditions except with nearly double the amount of C.
For this economic evaluation of the impact of C on natural capital value of viticultural
soil we use the terroir calculator of Hall et al. (2009) whose model includes the
following:

94
Soil Carbon Report prepared for AGMARDT
(a) Economic Model: Hall et al. (2009) place a value on the net income per hectare
which could be obtained from a vineyard under conditions where water is ―naturally‖
available in exactly the right quantity throughout the season, then deduct from this
costs associated with water management (―irrigation cost‖) and any loss of crop value
due to inability to control the water perfectly (―loss of quality cost‖). The same applies
to fertiliser management, with their being costs of purchase and applications, and as
well we have now included environmental costs as they relate to nitrous oxide in IPCC
calculations for C dioxide equivalents,, which enable us to assign a cost through the
price of C.
(b) Plant model: Three time series define the plant response to water and nitrogen.
The first details the time course of canopy cover during the growing season, used as a
crop factor in calculating evapotranspiration. The second describes the ―ideal‖ soil
water curve which would lead to optimum crop value. The soil should be near field
capacity early in the season but lower following veraison (berry softening). Deviations
from this ideal curve (either above or below) reduce the net value of the crop (see
Figure 6.4). Next there is the supply of N, and the ideal curve for this is shown in
Figure 6.5. Nitrogen needs to be available through canopy development up to
flowering, and then it should decline to limit vegetative vigour through veraison to
harvest.
(c) Environmental impacts: Here we have chosen to include the cost of irrigation
water as an economic cost, assuming that if it is a scarce resource it will need to be
paid for. Water which drains through the soil is assumed to have a negative
environmental impact due to leachates being transported into the groundwater. We
also include IPCC impacts for leached nitrogen and nitrous oxide emissions.
(d) Soil water model: A simple water balance is applied to a single layer of soil. At the
end of each time step, after taking into account evapotranspiration, rainfall, and
irrigation, any water in excess of field capacity is assumed to drain to groundwater.
(e) Water and fertiliser management: Irrigation is applied whenever soil water drops
more than some threshold amount below the ―ideal‖ for the plant at that time. For
such a simple system, it is possible to ―optimise‖ management by taking into account
the cost of irrigation relative to the costs of deviations from the ideal soil water content
at that time in the season (c). A dressing of 20 kg-N is applied in spring, and then the
only N available to the plant comes from that mineralised in the soil.
(f) Weather: Only rainfall and reference evapotranspiration in each time period are
used, but of course to estimate the natural capital value as defined above many years
of actual or simulated weather data are necessary, in order to obtain a good estimate
of the expected response.

95
Soil Carbon Report prepared for AGMARDT
Figures 7.4 and 7.5 The ideal seasonal pattern of soil-water and nitrogen that
we consider maximises terroir value.
Beyond veraison (berry softening) it is advantageous to have low levels of water and N
to limit leaf growth, and thereby encourage higher Brix in the berries. However it is
necessary to have a sufficient level of N to avoid low levels of yeast available N (YAN)
in the berries which can cause stuck ferments during wine making.
The terroir model was run over 30 years using weather data for Marlborough.
Penalties on terroir are assigned for any deviation from the ideal patterns of soil water
and nitrogen shown in Figures 7.4 and 7.5. The penalty for deviation is not taken to
be linear, but is set at the square of the deviation from the ideal line. The penalty cost
for water above is taken to be $2 (%v/v day-1
)2 and for nitrogen it is $0.40 (kg-N ha
-1)2.
Because of the relative detriment from vegetative vigour, relative to low YAN, the
penalty for being above the nitrogen line is weighted two-fold greater than that for
being below the line.
Figures 7.6 and 7.7. The value of terroir ($/ha) in a low C (1%) soil as a function
of depth. On the right is the same result but for soil with a C content of 1.75%.
0.0
0.1
0.2
0.3
0.4
0 4 8 12 16 20 24
Week
Op
tim
al
so
il w
ate
r fr
acti
on
(L/L
)
FloweringO
ptim
um s
oil w
ater
con
tent
(m3
m-3
)
Veraison
Weeks after bud-burst
Soil Water Store
Weeks after bud-burst
0
5
10
15
20
25
9-Sep 29-Oct 18-Dec 6-Feb 28-Mar
Date
Targ
et
Nit
rog
en
co
nte
nt
(kg
/Ha)
0.0
0.1
0.2
0.3
0.4
0 4 8 12 16 20 24
Week
Op
tim
al
so
il w
ate
r fr
acti
on
(L/L
)
Flowering
Veraison
Tar
get
nitr
ogen
stor
age
(kg-
N h
a-1 )
Nitrogen
0.0
0.1
0.2
0.3
0.4
0 4 8 12 16 20 24
Week
Op
tim
al
so
il w
ate
r fr
acti
on
(L/L
)
FloweringO
ptim
um s
oil w
ater
con
tent
(m3
m-3
)
Veraison
Weeks after bud-burst
0.0
0.1
0.2
0.3
0.4
0 4 8 12 16 20 24
Week
Op
tim
al
so
il w
ate
r fr
acti
on
(L/L
)
FloweringO
ptim
um s
oil w
ater
con
tent
(m3
m-3
)
Veraison
Weeks after bud-burst
Soil Water Store
Weeks after bud-burst
0
5
10
15
20
25
9-Sep 29-Oct 18-Dec 6-Feb 28-Mar
Date
Targ
et
Nit
rog
en
co
nte
nt
(kg
/Ha)
0.0
0.1
0.2
0.3
0.4
0 4 8 12 16 20 24
Week
Op
tim
al
so
il w
ate
r fr
acti
on
(L/L
)
Flowering
Veraison
Tar
get
nitr
ogen
stor
age
(kg-
N h
a-1 )
Nitrogen
Weeks after bud-burst
0
5
10
15
20
25
9-Sep 29-Oct 18-Dec 6-Feb 28-Mar
Date
Targ
et
Nit
rog
en
co
nte
nt
(kg
/Ha)
0.0
0.1
0.2
0.3
0.4
0 4 8 12 16 20 24
Week
Op
tim
al
so
il w
ate
r fr
acti
on
(L/L
)
Flowering
Veraison
Tar
get
nitr
ogen
stor
age
(kg-
N h
a-1 )
Weeks after bud-burst
0
5
10
15
20
25
9-Sep 29-Oct 18-Dec 6-Feb 28-Mar
Date
Targ
et
Nit
rog
en
co
nte
nt
(kg
/Ha)
0.0
0.1
0.2
0.3
0.4
0 4 8 12 16 20 24
Week
Op
tim
al
so
il w
ate
r fr
acti
on
(L/L
)
0
5
10
15
20
25
9-Sep 29-Oct 18-Dec 6-Feb 28-Mar
Date
Targ
et
Nit
rog
en
co
nte
nt
(kg
/Ha)
0.0
0.1
0.2
0.3
0.4
0 4 8 12 16 20 24
Week
Op
tim
al
so
il w
ate
r fr
acti
on
(L/L
)
Flowering
Veraison
Tar
get
nitr
ogen
stor
age
(kg-
N h
a-1 )
Nitrogen
Using 30 years' historical Blenheim
data
-$5,000
$0
$5,000
$10,000
$15,000
$20,000
0 500 1000 1500 2000
Soil depth
Terro
ir v
alu
e
Comm value
Env value
Net Value
Using 30 years' historical Blenheim
data
-$5,000
$0
$5,000
$10,000
$15,000
$20,000
0 500 1000 1500 2000
Soil depth
Terro
ir v
alu
e
Comm value
Env value
Net Value

96
Soil Carbon Report prepared for AGMARDT
The environmental costs are subtracted from the commercial value to provide a net
value. On the right is the same, but for a soil higher in C (1.75%). In Figure 6.6 is
shown the value ($ ha-1
) of terroir for a soil in Blenheim, as a function of depth. If the
soil is too shallow there is neither enough water nor nitrogen, so the natural capital
value is lower. Conversely, if it is too deep, there too much water and nitrogen for
good berry development, and so again the terroir value declines. The optimum depth
to maximise terroir value is around 1 m (Fig. 7.7)
Now, if we consider the same soil but with an increase in C of 0.75% v/v, up from a
total C content of 1% v/v then there would be more water storage and more N
mineralisation,. Now the optimum depth to maximise terroir value would be very
shallow and closer to 0.5 m (Fig. 7.6). The soil here is considered to be 80% sand,
and 5% clay. So now only shallow ‗fertile, water holding‘ soils would be valuable, for
as depth increase, as does water supply and provision of N. As a result, the pruning
‗penalty costs‘ go up from $1400 ha-1
for a 400 mm deep soil, through to $13,000 ha-1
that is needed to control the vigour on a 2m deep soil that can supply more water and
nitrogen. C here has negative values here for viticulture. If there is a worry about soil
quality and functioning as a result of low C, maybe the application of just a surface
mulch of composted prunings and marc (crushed grape skins) is an option so as to
avoid vegetative vigour, yet retain soil structure and soil functioning. This mulching
value can be seen in Figs 7.6 and 7.7 for it is akin to just raising the C content of a
shallow soil. Indeed, there is not much difference in the terroir value as a function of
soil C between soil having a depth of 400mm. An alternative could be to sustain soil
functioning and C sequestration in viticulture soils through the use of biochar.
97
Soil Carbon Report prepared for AGMARDT
8. References
Accardi-Dey A, Gschwend PM, 2002. Assessing the combined roles of natural organic
matter and black C as sorbents in sediments. Environmental Science and
Technology 36: 21–29.
Albedo http://en.wikipedia.org/wiki/Albedo
Aslam, T, Choudhary, MA, and Saggar, S. 1999. Influence of land-use management
on CO2 emissions from a silt loam soil in New Zealand. Agriculture, Ecosystems
and Environment 77: 257-262.
Aslam, T, Choudhary, MA, and Saggar, S, 2000. Tillage impacts on soil microbial
biomass C, N, and P, earthworms and agronomy after two years of cropping
following permanent pasture in New Zealand. Soil & Tillage Research 51: 103-
111.
Baisden, WT, Beets, P, Carran, RA, Clark, H, Ford-Robertson, JB, Francis, GS,
Maclaren, P, Marshall, H, Manning, MR, Newton, PCD, Saggar, S, Tate, KR,
2001. An Assessment of The Significance To New Zealand Of Article 3.4
Activities Under The Kyoto Protocol. A Report Prepared for Ministry for
Agriculture and Forestry. 8 June 2001 http://www.maf.govt.nz/mafnet/rural-
nz/sustainable-resource-use/climate/sinks-activities/httoc.htm.
Baldock, J.A & Skjemstad, J.O 1999, ‗Organic soil carbon/soil organic matter‘, In
Peverill, K.I. Sparrow, L.A and Reuter, D.J (eds.) Soil analysis: an interpretation
manual. CSIRO
Batjes NH 1996. Total carbon and nitrogen in soils of the world. European Journal of
Soil Science 47: 150–163.
Beare M, Curtin D, Ghani A, Mackay A, Parfitt R, Stevenson B. 2007. Current
Knowledge on Soil Quality Indicators for Sustainable Production and
Environmental Protection in New Zealand: A Discussion Document. Sustainable
Landuse Research Initiative, NZ, 2007
Beaton JD, Peterson HB, Bauer N 1960. Some aspects of phosphate adsorption by
charcoal. Soil Science Society of America Proceedings 24: 340–346.
Bellamy, PH, Loveland, PJ, Bradley, RI, Lark RM and Kirk GJD, 2005 Carbon losses
from all soils across England and Wales 1978-2003. Nature 437:245-248.
Blakemore LC, Searle PL, Daly BK 1987. Methods for chemical analysis of soils. NZ
Soil Bureau Scientific Report 80
Blanco-Canqui, H. and Lal, R. 2008. No-tillage and soil profile carbon sequestration:
an on-farm assessment. Soil Science Society of America Journal 72: 693-701.
British Standards Institute 2008. PAS 2050 Specification of the assessment of life
cycle greenhouse gas emissions of goods and services.

98
Soil Carbon Report prepared for AGMARDT
Bruce JP, Frome M, Haites E, Janzen H, Lal R 1999. Carbon sequestration in soils.
Journal of Soil and Water Conservation 54: 382-388.
Campbell, CA, and Zentner, RP, 1993. Soil organic matter as influenced by crop
rotations and fertilization. Soil Science Society of America Journal 57: 1034-
1040.
Campbell, CA, McConkey, BG, Zentner, RP, Selles, F and Curtin. D, 1996. Long-term
effects of tillage and crop rotations on soil organic matter in a clay soil in
southwestern Saskatchewan. Canadian Journal of Soil Science 76: 395-401.
Campbell, CA, de Jong, R, 2001. Root-to-straw ratios - influence of moisture and rate
of N fertilizer. Canadian Journal of Soil Science 81: 39-43.
Carey, PL, Benge JR and. Haynes RJ, 2009. Comparison of soil quality and nutrient
budgets between organic and conventional kiwifruit orchards. Agriculture,
Ecosystems and Environment 132:7-15.
Carter MR, Gregorich EG, 1996. Methods to characterise and quantify organic matter
storage in soil fractions and aggregates. In: Structure and Organic Matter
Storage in Agricultural Soils, edited by M. R. Carter and B. A. Stewart, Boca
Raton, CRC Lewis Publishers. p. 449–466.
Chan KY, van Zwieten L, Meszaros I, Downie A, Joseph S 2007. Agronomic values of
greenwaste biochar as a soil amendment. Australian Journal of Soil Research
45: 629–634.
Clark, H, de Klein, C, Newton, P, 2001. Potential management practices and
technologies to reduce nitrous oxide, methane and carbon dioxide emissions
from New Zealand agriculture. Prepared for Ministry of Agriculture & Forestry.
September 2001, http://www.maf.govt.nz/mafnet/publications/climate/green-
house-gas-migration/ghg-mitigation.pdf
Clothier B, Mackay AD, Mills T, Parfitt R, 2008. Natural capital, land-use planning and
nutrient issues. New Zealand Journal of Forestry 53, 8–10
Clothier BE 1997. Can soil management be regulated to protect water quality? Land
Contaminants Reclamation. 5, 337–42
Cole, CV, Paustian, K. Elliott, ET. Metherell, AK. Ojima, DS, Parton, WJ, 1993.
Analysis of agroecosystem carbon pools. Water, Air, and Soil Pollution 70: 357-
371.
Cole, L, Staddon, PL, Sleep D, Bardgett, RD, 2004. Soil animals influence microbial
abundance, but not plant-microbial competition for soil organic nitrogen. Funct.
Ecol. 18, 631–640.
Conant RT, Easter M, Paustian K, Swan A, Williams S, 2007. Impacts of periodic
tillage on soil C stocks: A synthesis. Soil and Tillage Research 95: 1–10.
99
Soil Carbon Report prepared for AGMARDT
Conant RT, Paustian K, Elliott ET 2001. Grassland management and Conversion into
grassland: Effects on soil carbon. Ecological Applications, 11:343-355.
Conant RT, Steinweg JM, Haddox ML, Paul EA, Plante AF, Six J. 2008. Experimental
warming shows that decomposition temperature sensitivity increases with soil
organic matter recalcitrance. Ecology: 89:2384–2391.
Condron LM, Sinaj, S, McDowell, RW, Dudler-Guela, J, Scott, JT, and Metherell, AK,
2006. Influence of long-term irrigation on the distribution and availability of soil
phosphorus under permanent pasture. Australian Journal of Soil Research 44:
127-133.
Costanza R. & Daly HE. 1992. Natural Capital and Sustainable Development.
Conservation Biology 6: 37-46.
Costanza R, dArge R, deGroot R, Farber S, Grasso M, Hannon B, Limburg K, Naeem
S, Oneill RV, Paruelo J, Raskin RG, Sutton P & vandenBelt M. 1997. The value
of the world's ecosystem services and natural capital. Nature 387: 253-260.
Cox, PM, Betts, RA, Jones, CD, Spall SA, and Totterdell, IJ, 2000. Acceleration of
global warming due to carbon-cycle feedback in a coupled climate model.
Nature 408:184.
Curtin, D, and Fraser, PM, 2003. Soil organic matter as influenced by straw
management practices and inclusion of grass and clover seed crops in cereal
rotations. Australian Journal of Soil Research 41: 95-106.
Degens BP, Schipper LA, Claydon JJ, Russell JM, Yeates GW, 2000. Irrigation of an
allophanic soil with dairy factory effluent for 22 years: responses of nutrient
storage and soil biota. Australian Journal of Soil Research 38:25–35.
Degens BP, Schipper LA, Sparling GP, Duncan LC. 2001. Is the microbial community
in a soil with reduced catabolic diversity less resistant to stress or disturbance?
Soil Biology & Biochemistry 33:1143-1153.
Degens BP. Schipper LA, Sparling GP, Vojvodic-Vukovic M. 2000. Decreases in
organic C reserves in soils can reduce the catabolic diversity of soil microbial
communities. Soil Biology & Biochemistry 32:189-196.
Deurer M, Slay M, Mueller K, Sivakumaran S, Clothier BE 2008b. Can hydrophobicity
explain the dry patch syndrome of Hawke's Bay hill country pastures? In: Currie
JA, Yates LJ eds. Carbon and nutrient management in agriculture. Palmerston
North, New Zealand.
Deurer, M, Grinev, D, Young, I, Clothier BE and Müller K. 2009. The impact of soil
carbon management on soil macro-pore structure: A comparison of two apple
orchards systems in New Zealand. European Journal of Soil Science [in press]
Deurer, M, Sivakumaran, S, Ralle, S, Vogeler I, McIvor, I, Clothier B and Green. S.
2008a. A new method to quantify the impact of soil carbon management on
100
Soil Carbon Report prepared for AGMARDT
biophysical soil properties: The example of two apple orchards systems in New
Zealand. Journal of Environmental Quality 37:915-924.
Doerr SH, Shakesby RA, Walsh RPD 2000. Soil water repellency: its causes,
characteristics and hydro-geomorphological significance. Earth Science
Reviews 51: 33–65.
Dominati, E, Patterson, M, Mackay A. 2009. A framework for classifying and
measuring soil natural capital and ecosystem services. 8th International
Conference of the European Society for Ecological Economics in the University
of Ljubljana, Slovenia, July 2009.
Doran JW, Coleman DC, Bezdikec DF, Stewart BA. 1994. Defining Soil Quality for a
Sustainable Environment. SSSA Special Publication Number 35, SSSA Inc.,
Madison WI, USA 244p.
Douglas, CL, and Rickman, RW, 1992. Estimating crop residue decomposition from air
temperature, initial N content, and residue placement. Soil Science Society of
America Journal 56: 272-278.
Drewry JJ. 2006. Natural recovery of soil physical properties from treading damage of
pastoral soils in New Zealand and Australia: A review. Agriculture Ecosystems
and Environment 114:159–169
Ekins P, Folke C, & De Groot R, 2003. Identifying critical natural capital. Ecological
Economics 44:159-163.
Evans, LT, 1998. Feeding the ten billion: plants and population growth. Cambridge
University Press, Cambridge, UK.
Forbes MS, Raison RJ, Skjemstad JO, 2006. Formation, transformation and transport
of black carbon (charcoal) in terrestrial and aquatic ecosystems. Science of The
Total Environment 370:190–206.
Fonte, SJ, Kong, AYY, van Kessel, C, Hendrix, PF, Six, J, 2007. Influence of
earthworm activity on aggregate-associated carbon and nitrogen dynamics
differs with agroecosystem management. Soil Bio. Biochem. 39, 1014-1022.
Francis GS, Tabley FJ, White KM, 2001. Soil degradation under cropping and its
influence on wheat yield on a weakly structured New Zealand silt loam.
Australian Journal of Soil Research 39:291–305
Francis, GS, Tabley, FJ, and White, KM, 1999. Restorative crops for the amelioration
of degraded soil conditions in New Zealand. Australian Journal of Soil Research
37:1017-1034.
Gaunt JL and Lehmann J, 2008. Energy balance and emissions associated with
biochar sequestration and pyrolysis bio-energy production. Environmental
Science and Technology. in press.
101
Soil Carbon Report prepared for AGMARDT
Gerke HH, Hangen E, Schaaf W, Huettl RF, 2001. Spatial variability of potential water
repellency in a lignitic mine soil afforested with Pinus nigra. Geoderma 102:
255–274.
Ghani A, Dexter M, Perrott KW, 2003a. Hot-water extractable carbon in soils: a
sensitive measurement for determining impacts of fertilisation, grazing and
cultivation. Soil Biology & Biochemistry, 35: 231-1243.
Ghani A, Dexter M, Sarathchandra U, and Waller J 2005. Effects of dairy factory
effluent application on nutrient transformation in soil. New Zealand Journal of
Agricultural Research, 48:241-253.
Ghani A, Dexter M, Sarathchandra U, Perrott KW and Singleton P 2000. Assessment
of extractable hot-water carbon as an indicator of soil quality on soils under long-
term pastoral, cropping, market gardening and native vegetation. In the
Proceeding of Australian and New Zealand Second Joint Soils Conference,
Lincoln, New Zealand, pp 119-120.
Ghani A, Longhurst B, and Dexter M, 2003b. Effects of chemical nature and vermi-
composting of biosolids and sewage sludge on plant growth. Pp 212-219. In the
Proceeding of the New Zealand Wastewater Association Annual Conference,
Auckland, September, 2003.
Ghani A, Sarathchandra SU, Perrott KW, Wardle DA, Singleton P, and Dexter M,
1996. Spatial and temporal variability in some key biological and biochemical
soil properties. Proceeding of the New Zealand Grassland Association, 58, 211-
218.
Ghani A, Dexter M, Carran AR and Theobald PW 2007. Dissolved organic nitrogen
and carbon in pastoral soil: the New Zealand experience. European Journal of
Soil Science, 58:832-843.
Ghani A, Sarathchandra SU, Perrott KW, Wardle DA, Singleton P, Dexter M and
Ledgard SF., 1999. Are soil microbial and biochemical indicators sensitive to
pastoral soil management? In: Best Soil Management Practices for Production
(Eds. LD Currie, MJ Hedley, DJ Horne and P Loganathan). Occasional Report
No 12. FLRC, Massey University, Palmerston North, New Zealand, pp 105-115.
Ghani, A. Müller, K., Dodd, M.; Mackay, A.; Dexter, M. 2008a. Soil carbon and
nitrogen: Why are we losing carbon and nitrogen from NZ pasture soils? In.
Carbon and nutrient management in agriculture. Fertilizer and Lime Research
Centre, Massey University, Occasional Report No. 21. Pp 309-321.
Ghani A., Luo J., Wang, H., Longhurst B., 2008b. Opportunities for sequestering
carbon through application of organic waste to soils. In the proceeding
―Decentralised waste management‘ land Treatment Collective Annual
Conference, Queenstown, New Zealand, pp 177-183.

102
Soil Carbon Report prepared for AGMARDT
Giltrap DJ, Hewitt EA. 2004. Spatial variability of soil quality indicators in New Zealand
soils and land uses. New Zealand Journal of Agricultural Research 47:167-177.
Glaser B, Guggenberger G, Zech W, De Lourdes Ruivo M 2003. Soil organic matter
stability in Amazonian Dark Earths. In: Lehmann J ed. Amazonian dark earths:
origin, properties, management. Amsterdam, Kluwer Academic Publishers. Pp.
141–158.
Glaser B, Haumaier L, Guggenberger G, Zech W 2001. The 'Terra Preta'
phenomenon: a model for sustainable agriculture in the humid tropics.
Naturwissenschaften 88: 1.
Glaser B, Lehmann J, Zech W 2002. Ameliorating physical and chemical properties of
highly weathered soils in the tropics with charcoal: a review. Biology and.
Fertility of Soils 35: 219–230.
Green, S.R., S. Sivakumaran, C. van den Dijssel, T.M. Mills, P. Blattman, W.P.
Snelgar, M.J. Clearwater and M. Judd. 2007. A water and nutrient budget for
‗Hort16a‘ kiwifruit vines. Acta Horticulturae 753:527-534.
Gregorich EG, Carter MR. (Eds) 1997. Soil quality for crop production and ecosystem
health. Elsevier Science Publications, Amsterdam, The Netherlands.
Gregorich, E.G., Rochette, P., VanDenBygaart, A.J., and Angers, D.A. 2005.
Greenhouse gas contributions of agriculatural soils and potential mitigation
practices in eastern Canada. Soil & Tillage Research 83: 53-72.
Greven, M., V. Raw, C. Gray, M. Deurer and B. West 2007 Long term vineyard
sustainability. Report to the Marlborough Research Centre Trust, HortResearch
Contract 22726.
Gustaffson Ö, Hagsheta F, Chan C, Macfarlane J, Gschwend PM 1997. Quantification
of the dilute sedimentary soot phase: implications for PAH speciation and
bioavailability. Environmental Science and Technology. 31: 203–209.
Guevara-Escobar, A., Kemp, P.D, Mackay, A.D. and Hodgson, J. 2002. Soil
properties of a space planted (Populus deltoides) pasture system in a hill
environment. Aust. J. Soil Res. 40 873-886
Hall, A., M. Deurer, I. Vogeler, and B. Clothier 2009. The natural capital value of our
vineyard soils Part II: A model for valuation of terroir. Proceedings of the
Fertiliser and Lime Research Centre 2009 Workshop, FLRC Occassional
Publication 22. [in press].
Hamer U, Marschner B, Brodowski S, Amelung W 2004. Interactive priming of black
carbon and glucose mineralisation. Organic Geochemistry 35: 823–830.
Hay, M.J.M.; Brock, J.L.; Fletcher, R.H. 1983. Effect of sheep grazing management on
distribution of white clover stolons among 3 horizontal strata in ryegrass/white
clover swards. New Zealand Journal of Experimental Agriculture 11: 215-218.
103
Soil Carbon Report prepared for AGMARDT
Haynes RJ, Tregurtha R, 1999. Effects of increasing periods under intensive arable
vegetable production on biological, chemical and physical indices of soil quality.
Biology and Fertility of Soils 28: 259-266.
Hewitt, A.E.; Sparling, G.P. 1999. Setting soil quality standards for organic contents of
New Zealand soils. In: Currie, L.D.; Hedley, M.J.; Horne, D.J.; Loganathan, P.
eds Best soil management practices for production. Occasional Report No 12.
Palmerston North: Fertiliser and Lime Research Centre, Massey University. Pp.
95–97.
http://www.bsigroup.com/en/Standards-and-Publications/How-we-can-help-
you/Professional-Standards-Service/PAS-2050/
Huang PM, Schnitzer M. 1986. Interactions of soil minerals with natural organics and
microbes. SSSA Special Publication Number 17. Soil Science Society of
America, Inc. Madison, Wisconsin, USA
Hughes, K.A., P.W. Gandar and H.N. de Silva, 1995. Exploration and exploitation of
soil by apple, kiwifruit, peach, Asian pear and grape roots. Plant and Soil
175:301-309.
Jackman RH, 1964a. Accumulation of organic matter in some New Zealand soils
under permanent pasture. I. Patterns of change of organic carbon, nitrogen,
sulphur and phosphorus. New Zealand Journal of Agricultural Research 7, 445–
471.
Jackman RH, 1964 b. Accumulation of organic matter in some New Zealand soils
under permanent pasture. II. Rates of mineralization of organic matter and the
supply of available nutrients. New Zealand Journal of Agricultural Research 7:
472–479.
Janzen HH, 2004. Carbon cycling in earth systems—a soil science perspective.
Agriculture, ecosytems and environment 104: 399-417
Jones, R.J.A., R. Heiderer, E. Rusco and L. Montanarelli. 2005. Estimating organic
carbon in soils for policy support. European Journal of Soil Science 56:655-671.
Kelly, T., N. Shadbolt, et al. 2008. "Organic-conventional dairy systems trial at
Massey." Primary Industry Management 12(4): 30-33.
Kerckhoffs, L.H.J. and J.B. Reid, 2007. Carbon sequestration in the standing biomass
of orchard crops in New Zealand. A report by Crop & Food research for
Horticulture NZ, pp 4.
Kim, I, Deurer M, Sivakumaran S, Huh K-Y, Green SR and Clothier BE. 2009. The
impact of soil carbon management and environmental conditions on N-
mineralisation. Australian Journal of Soil Research [in press].
King, FH 1911. Farmers of Forty Centuries: Organic Farming in China, Korea and
Japan. Dover Publications Inc, Mineola, New York. 397 pp.
104
Soil Carbon Report prepared for AGMARDT
King, JA, Bradley, RI, and Harrison, R. 2005. Current trends of soil organic carbon in
English arable soils. Soil Use and Management 21: 189-195.
Koerber, GR, G. Edwards-Jones, PW Hill, L Mila I. Canals, P. Nyeko, E.H. York and
DL Jones 2009. Geographical variation in carbon dioxide fluxes from soils in
agrosystems and its implications for life cycle assessment. Journal of Applied
Ecology 46:306-314.
Kristensen, T, Kristensen, ES, 1998. Analysis and simulation modelling of the
production in Danish organic and conventional dairy herds. Livest. Prod. Sci. 54,
55-65.
Lal R, 2001. World cropland soils as a source or sink for atmospheric carbon.
Advances in Agronomy 71:146–191.
Lal, R, 2004. Soil carbon sequestration impacts on global climate change.
Environment International 29: 437-450
Lal, R. 2009. Challenges and opportunities in soil organic matter research. European
Journal of Soil Science 60:158-169
Lambert MG, Clark DA, Mackay AD, Costall DA, 2000. Effects of fertiliser application
on nutrient status and organic matter content of hill soils. NZ Journal of
Agricultural Research, 43:127-138.
Lambert MG, Mackay AD, Costall DA, 1998. Long-term fertilizer application and
fertility of hill soils. Proceedings of the New Zealand Grassland Association,
60:63-67.
Lehmann J, 2007. Bio-energy in the black. Frontiers in Ecology and the Environment
5: 381–387.
Lehmann J, da Silva Jr. JP, Steiner C, Nehls W, Zech W, Glaser B, 2003. Nutrient
availability and leaching in an archaeological Anthrosol and a Ferralsol in the
Central Amazon basin: fertilizer, manure and charcoal amendments. Plant and
Soil 249: 343–357.
Lehmann J, Gaunt J, Rondon M, 2006. Biochar sequestration in terrestrial
ecosystems: a review. Mitigation and Adaption Strategies for Global Change 11:
403–407.
Liang B, Lehmann J, Solomon D, Kinyangi J, Grossman J, O'Neill B, Skjemstad JO,
Thies J, Luizao FJ, Petersen J. 2006. Black carbon increases cation exchange
capacity in soils. Soil Science Society of America Journal 70: 1719–1730.
Lima A, Farrington J, Reddy C, 2005. Combustion-derived polycyclic aromatic
hydrocarbons in the environment: a review. Environmental Forensics 6: 109–
131.
Lynn I, Manderson A, Page M., Harmsworth G, Eyles G, Douglas G, Mackay A. &
Newsome P, 2009. Land Use Capability Survey Hand-book - a New Zealand
105
Soil Carbon Report prepared for AGMARDT
handbook for the classification of land - 3rd ed., Hamilton, Agresearch, Lincoln,
Landcare Research, Lower Hutt, GNS Science.
MA 2005. Board of the Millennium Assessment project report ―Living Beyond our
Means: Natural Assets and Human Well Being
(www.milleniumassessment.org/en/BoardStatement.aspx)
Mackay AD 2008. Impacts of intensification of pastoral agriculture on soils: Current
and emerging challenges and implications for future land uses. New Zealand
Veterinary Journal 56 281-288
Mackay AD, 2009. Water quality and land use. New Zealand Veterinarian Association,
Society of Sheep and Beef Cattle Veterinarians 39th Annual Conference
Rotorua 20-22 May pp. 147-154
Mackay AD, Clothier B, Parfitt, RL, 2008. Defining Nitrogen-loss limits within a water
management zone using the natural. In: Carbon and Nutrient management in
Agriculture (eds. L.D. Currie and Hanly JA). Occasional Report No. 19, Fertiliser
and Lime Research Centre, Massey University, Palmerston North, pp. 525-530.
Mackay AD, Devantier BP, Pomroy, WE 2006. Long-term changes in the biology of a
livestock farm system associated with the shift to organic supply. N Z Grsslds.
Assoc. 68. (133-137)
MacNaeidhe, FS, Fingleton, W, 1997. Economic investigations of organic calf to beef
and sheep production. Eur. Newsl. Org. Farm. 6, 20-22.
Mathieu O, Lévêque J, Hénault C, Milloux M-J, Bizouard F, Andreux F 2006.
Emissions and spatial variability of N2O, N2 and nitrous oxide mole fraction at
the field scale, revealed with 15N isotopic techniques. Soil Biology and
Biochemistry 38: 941–951.
Matthew, C, Mackay, AD, Chu, ACP, 1986. Techniques for measuring the root growth
of a perennial ryegrass (Lolium perenne. L.) dominant pasture under contrasting
spring managements. Proceedings Agronomy Society of New Zealand 16: 59-
64.
Matthew, C, Quilter, SJ, Korte, CJ, Chu, ACP, McKay, AD 1989. Stolon formation and
significance for sward tiller dynamics in perennial ryegrass. Proceedings of the
New Zealand Grassland Association 50: 255-259.
Metherell AK 2002. Management effects on soil carbon storage in New Zealand
pastures. Proceedings of New Zealand Grassland Association, 64:259-264.
Metherell AK, Edmeades DC and Ghani A, 2008. Management factors affecting soil
organic carbon in NZ pastures: A review. In. Carbon and nutrient management
in agriculture. Fertilizer and Lime Research Centre, Massey University,
Occasional Report No. 21. Pp 301-308.

106
Soil Carbon Report prepared for AGMARDT
Metson AJ, Blakemore LC, Rhodes DA. 1979. Methods for the determination of soil
organic carbon: a review, and applications to New Zealand soils New Zealand
Journal of Science21: 205–228.
Miller RB, 1968. Soil pH, calcium carbonate and soluble salts. Soils of New Zealand
Part 2. pp 50–54. New Zealand Soil Bureau Bulletin 26: No 2. HMSO.
Ministry for the Environement 2007. www.mfe.govt.nz
Mizuata K, Matsumoto T, Hatate Y, Nishihara K, Nakanishi T 2004. Removal of
nitrate-nitrogen from drinking water using bamboo powder charcoal. Bioresource
Technology 95: 255–257.
Mulder, C, De Zwart, D, Van Wijnen, HJ, Schouten, AJ, Breure, AM, 2003.
Observational and simulated evidence of ecological shifts within the soil
nematode community of agroecosystems under conventional and organic
farming. Funct. Ecol. 17, 516-525.
Murata T, Nguyen KL, Goh KM, 1995. The effects of long-term superphosphate
application on soil organic matter content and composition from an intensively
managed New Zealand pasture. European Journal of Soil Science 46:257-264.
Murata, T, and Goh, KM, 1997. Effects of cropping systems on soil organic matter in a
pair of conventional and biodynamic mixed cropping farms in Canterbury New
Zealand. Biology and Fertility of Soils 25: 372-381.
Nayak, D.R., Jagadeesh BY, Datta, A, Adhya TK, 2007. Methan oxidation in an
intensively cropped tropical rice filed soil under long-term application of organic
and mineral fertilisers. J. Environmental Quality 36:1577-1584.
Nie, ZN, Barker, DJ, Mackay, AD, Valentine, I, Hodgson, J, 1998. Influence of the
timing and duration of pastoral fallowing and nitrogen fertiliser addition on plant
population density, natural reseeding and white clover (Trifolium repens L)
ecology in a hill pasture. N.Z. J. Agric. Res. 41:19-29.
Nguyen ML and Goh KM, 1990. Accumulation of sulphur fractions in grazed pastures
receiving long-term superphosphate applications. New Zealand Journal of
Agricultural research 33:111-128.
Nguyen, ML, Haynes, RJ, and Koh, KM, 1995. Nutrient budgets and status in three
pairs of conventional and alternative cropping farms in Canterbury, New
Zealand. Agriculture, Ecosystems and Environment 52: 149-162.
O‘Brien BJ, Stout JD 1877. Movement and turnover of soil organic matter as indicated
by carbon isotope measurements Soil Biology and Biochemistry 10: 309–317.
Ogini, YO, Stonehouse, DP, Clark, EA, 1999. Comparison of organic and conventional
dairy farms in Ontario. Amer. J. Altern. Agric. 14, 122-128.
Palm C, Sanchez P, Ahamed S. & Awiti A. 2007. Soils: A contemporary perspective.
Annual Review of Environment and Resources 32: 99-129.
107
Soil Carbon Report prepared for AGMARDT
Palmer, JW 1998 Annual dry matter production and partitioning over the first five years
of a bed system of Crispin/M.27 apple trees at four spacings. Journal of Applied
ecology 25:569-578.
Palmer, JW, Wünsche, JN, Meland M and Hann, A, 2002. Annual dry matter
production by three apple cultivars at four within-row spacings. Journal Hort. Sci.
Biotech 77:712-717.
Parfitt, RL, Arnold, GC, Baisden WT, Claydon, J, Dodd, M, Ross C, and Schipper. L,
2007. Changes in C and N from New Zealand soil profiles under pasture over
20 years. 3rd International Conference on Mechanisms and of Organic Matter
Stabilisation and Destabilisation in Soils and Sediments, Adelaide, 23-26
September. 2007.
Parfitt, RL, Parshotam, A., and Salt, GJ, 2002. Carbon turnover in two soils with
contrasting mineralogy under long-term maize and pasture. Australian Journal of
Soil Science 40: 127-136.
Parfitt, RL, Yeates, GW, Ross, DJ, Mackay, AD, Budding, PJ, 2004. Relationships
between soil biota, nitrogen and phosphorus availability and pasture growth
under Organic and Conventional management. Applied Soil Ecology 28: 1-13.
Parliamentary Commissioner for the Environment, 2004. Growing for good: intensive
farming, sustainability and New Zealand‘s environment, Wellington,
Parliamentary Commissioner for the Environment.
Parshotam A, Hewitt AE 1995. Application of the Rothamsted carbon turnover model
to soils in degraded semi-arid land in New Zealand. Environ Intern 21:693–697
Parshotam A, Saggar S, Searle PL, Daly BK, Sparling GP, Parfitt RL. 2000. Carbon
residence times obtained from labelled ryegrass decomposition in soils under
contrasting environmental conditions. Soil Biology and Biochemistry 32: 75–83.
Parsons AJ, 1994. Exploiting Resource Capture - Grassland. In: Resource Capture by
Crops. (eds. J.L. Monteith, R.K. Scott and M.H. Unsworth). Nottingham
University Press. pp. 315-349.
Parsons AJ, Chapman DF, 2000. The principles of pasture growth and utilisation. In:
Hopkins A. (ed.) Grass. Third Edition. British Grassland Society. Blackwells
Scientific Publications, pp. 31-89
Paustian KO, Audren HH, Lal R, Smith P, Tan G, Tiessen H, Vanmooorrdwijk M,
Woomer PL, 1997. Agricultural soils as a sink to mitigate CO2 emissions. Soil
Use and Management 13:230–244.
Poulton, PR 1995. The importance of long-term trials in understanding sustainable
farming systems: The Rothamsted experience. Australian Journal of
Experimental Agriculture 35:825-834.

108
Soil Carbon Report prepared for AGMARDT
Powlson DS, Brookes PC, Christensen BT 1987. Measurement of soil microbial
biomass provides an early indication of changes in total soil organic matter due
to straw incorporation. Soil Biology and Biochemistry 10: 159–164.
Radovic LR, Moreno-Castilla C, Rivera-Utrilla J 2001. Carbon materials as adsorbents
in aqueous solutions. In: Radovic LR ed. Chemistry and physics of carbon. New
York, Marcel Dekker. Pp. 227–405.
Rawls, WJ, Pachepsky, YA, Ritchie, JC, Sobecki TM, and Bloodworth, H, 2003. Effect
of soil organic matter on soil water retention. Geoderma 116:61-76.
Reeves DW.1997. The role of soil organic matter in maintaining soil quality in
continuous cropping systems. Soil & Tillage Research 43:131–167.
Reganold, J.P., Palmer, A.S., Lockhart, J.C., and McGregor, A.N. 1993. Soil quality
and financial performance of biodynamic and conventional farms in New
Zealand. Science 260: 344-349.
Richardson, A. and S. Richardson 2006. "A comparison of the organic and
conventional livestock farming systems of Avalon farming in West Otago."
Proceedings of the New Zealand Grassland Association 68: 127-132.
Rixon AJ 1966. Soil fertility changes in a red-brown earth under irrigated pastures.
Australian Journal of Agricultural research 17:303-316.
Rondon M, Ramirez JA, Lehmann J 2005. Charcoal additions reduce net emissions of
greenhouse gases to the atmosphere. 3rd USDA Symposium on Greenhouse
Gases and Carbon Sequestration in Agriculture and Forestry, 21–24 March
2005, University of Delaware, Baltimore, MD. Ross, D.J., Speir, T.W., Kettles,
H.A., Tate K.R. and Mackay A.D., 1995. Soil microbial biomass, C and N
mineralization, and enzyme activities in a hill country pasture: Influence of
grazing management. Aust. J. Soil Res: 33 943-959
Ross, D.J., Speir, T.W., Kettles, H.A., Tate K.R. and Mackay A.D., 1995. Soil
microbial biomass, C and N mineralization, and enzyme activities in a hill
country pasture: Influence of grazing management. Aust. J. Soil Res: 33 943-
959
Russell JM (1986) Interaction of slaughterhouse effluent protein with three New
Zealand soils. New Zealand Journal of Agricultural Research, 25:21-26.
Saggar S. Hedley C, Mackay AD 1997. Partitioning and relocation of photosynthetic
fixed C in grazed hill pastures. Biology and fertility of Soil, 25:152-158.
Saggar S, Parshotam A, Sparling GP, Feltham CW, Hart PBS. 1996. 14C labelled
ryegrass turnover and residence times in soils varying in clay content and
mineralogy. Soil Biology and Biochemistry 28: 1677–1686.
Saldarriaga JG, West DC 1986. Holocene fires in the Amazon basin. Quaternary
Research 26: 358–366.
109
Soil Carbon Report prepared for AGMARDT
Sarmiento, J.L. and N. Gruber 2002. Sinks for anthropogenic carbon. Physics Today,
55: 30-36.
Schipper LA Sparling GP In Press. Rates of change in total C and N in New Zealand
soils after disturbance for pasture establishment: reworking of Jackman‘s data.
Biogeochemistry
Schipper LA, Degens BP, Sparling GP, Duncan LC. 2001. Changes in microbial
heterotrophic diversity along five plant successional sequences. Soil Biology &
Biochemistry 33: 2093-2103.
Schipper LA, Percival HJ, Sparling GP. 2004 An approach for estimating when soils
will reach maximum nitrogen storage. Soil Use and Management 20:281–286.
Schipper LA, Sparling GP. 2000. Performance of soil condition indicators across
taxonomic groups and land uses. Soil Science Society of America Journal 64:
300–311.
Schipper, L.A.; Baisden, W.T.; Parfitt, R.L.; Ross, C.; Claydon J.J. Arnold, G, 2007.
Large losses of soil C and N from soil profiles under pasture in New Zealand
during the past 20 years. Global Change Biology 13:1138-1144
Shepherd TG, Ross CW, Basher LR, Saggar S. 2000. Visual Soil Assessment Volume
2. Soil Management Guidelines for cropping and pastoral grazing on flat to
rolling country. Horizons.mw & Landcare Research, Palmerston North. 44p.
Shepherd TG, Saggar S, Newman RH, Ross CW, Dando JL 2001. Tillage-induced
changes to soil structure and organic carbon fractions in New Zealand soils.
Aust J Soil Res 39:465–489
Sigua G.C., Griffin, J., Kang,W.J., Coleman, S.W 2004. Wetland conversion to beef
cattle pasture: changes in soil properties. J. Soils Sediments. 4. 4-10.
Singh B, Cowie AL 2008. A novel approach, using 13C natural abundance, for
measuring decomposition of biochars in soil. In: Currie LD, Yates LJ eds Carbon
and nutrient management in agriculture. Palmerston North, New Zealand
Smith, P., Andren, O., Karlsson, T., Perala, P., Regina, K., Roundsevell, M., Van
Wesemael, B. 2005. Carbon sequestration potential in European croplands has
been overestimated. Global Change Biology 11: 2153-2163.
Smith, P., Powlson, D.S., Glendinning, M.J., and Smith, J.U. 1997. Potential for
carbon sequestration in European soils: preliminary estimates for five scenarios
using results from long-term experiments. Global Change Biology 3: 67-79.
Soane BD.1990. The role of organic matter in soil compatibility: a review of some
practical aspects. Soil and Tillage Research 16:179–201
Sojka RE, Upchurch DR. 1999. Reservations regarding the soil quality concept. Soil
Science Society of America Journal 63:1039-1054.

110
Soil Carbon Report prepared for AGMARDT
Sparling GP 1992. Ratio of microbial biomass carbon to soil organic carbon as a
sensitive indicator of changes in soil organic matter. Australian Journal of Soil
Research 30:195–207.
Sparling GP, Parfitt RL, Hewitt AE, Schipper LA 2003a. Three possible approaches to
define desirable soil organic matter contents. Journal of Environmental Quality
32: 760–766.
Sparling GP, Ross DJ, Trustrum NA, Arnold G, West AW, Spier TW, Schipper LA.
2003b. Recovery of topsoil characteristics after landslip erosion on dry hill
country of New Zealand and a test of the space-for-time hypothesis. Soil Biology
and Biochemistry 35:1575–1586.
Sparling GP, Schipper LA, 2004. Soil quality monitoring in New Zealand: Trends and
issues arising from a broad scale survey. Agriculture, Ecosystems and
Environment 104: 545–552.
Sparling GP, Schipper LA, Russell JM, 2001. Changes in soil properties after long-
term irrigation of dairy factory effluent to New Zealand volcanic ash and pumice
soils. Australian Journal of Soil research, 39:505-518.
Sparling GP, Wheeler D, Vesely ET, Schipper LA, 2006. What is soil organic matter
worth? Journal of Environmental Quality 35:546–557.
Sparling, GP, Lilburne, L, Vojvodić-Vuković, M, 2003b. Provisional Targets for Soil
Quality Indicators in New Zealand. Palmerston North, N.Z. Landcare Research
New Zealand, ISBN 0-478-09352-7
Sparrow LA, Reuter DJ. 1999. Soil analysis: an interpretation manual. CSIRO
Publishing, Collingwood, Vic: pp 159–170.
Speir TW, Ross DJ, and Tate KR 1987. The effects of nutrient-rich agricultural
effluents on two New Zealand soils. Pp 141-149 in ―4th International CIEC
Symposium, Agricultural Waste Management and Environmental Protection, 11-
14 May 1987, Brunschweig, Fed. Rep. of Germany, Proceedings‖ (Eds. E Welte,
I Szaboics), International Science Centre of Fertilizers, Belgrade.
Srinivasan MS, McDowell RW, 2009. Irrigation and soil physical quality: an
investigation at a long-term irrigation site. New Zealand Journal of Agricultural
Research, 52:113-121.
Stern N, 2007. The economics of climate change: the Stern review. Cambridge,
Cambridge University Press.
Stewart DPC, Metherell AK 1999. Carbon (13
C) uptake and allocation in pasture plants
following field pulse labelling. Plant and Soil 210:61-73.
Sue J, Wang H, Kimberly MO, Beecroft K, Magesan GN, Hu C. 2007. Fractionation
and mobility of phosphorus in a sandy forest soil amended with biosolids.
Environmental Science and Pollution research, 14:529-535.

111
Soil Carbon Report prepared for AGMARDT
Tate, KR, Wilde, RH, Giltrap, DJ, Baisden, WT, Saggar, S, Trustrum, NA, Scott NA,
and Barton JP, 2005. Soil organic carbon stocks and flows in New Zealand:
System development, measurement and modelling. Canadian Journal of Soil
Science 85:481-489.
―The Encyclopedia of Earth‖. http://www.eoearth.org/article/Carbon_cycle
Theng BKG, Tate KR, Sollins P. 1989. Constituents of organic matter in temperate
and tropical soils. In: Tropical Soil Organic Matter, edited by D. G. Coleman, J.
M. Oades, and B. Bohlool, Elsevier, p. 1–4.
Tryon EH 1948. Effect of charcoal on certain physical, chemical, and biological
properties of forest soils. Ecological Monographs 18: 81–115.
Ussiri, DAN and Lal, R, 2009 Long-term tillage effects on soil carbon storage and
carbon dioxide emissions in continuous corn cropping system from an alfisol in
Ohio. Soil and Tillage Research [in press].
Vaughan D, Ord B. 1985. Soil organic matter – A perspective on its nature, extraction,
turnover and role in soil fertility. In Soil Organic Matter and Biological Activity (D.
Vaughan and R.E. Malcolm Editors) Developments in Plant and Soil Sciences
Volume 16, pp. 1–35. Martinus Nijhoff/Dr W Junk Publishers, Dordrecht.
Walton, E, Wünsche, JN, and Palmer, JW, 1999. Estimation of the bioenergetic costs
of fruit and other organ synthesis in apple. Physiologia Plantarum, 106, 129-34.
Wardle DA, Nilsson M, Zackrisson O, 2008. Limitations of charcoal as an effective
carbon sink. Science (in press).
Watson ER 1963. The influence of subterranean clover pastures on soil fertility. 1.
Short-term effects. Australian Journal of Agricultural Research 14: 796-807.
West, TO, and Post, WM, 2002. Soil organic carbon sequestration rates by tillage and
crop rotation; a global data analysis. Soil Science Society of America Journal 66:
1930-1946.
Williams, SA, 2006. A method of estimating the differing crop residue to yield
relationships for small grains across a wide range of yield values. Unpublished
manuscript and data compiled for the Consortium for Agricultural Soils Mitigation
of Greenhouse Gases (CASMGS). Natural Resource Ecology Laboratory, Colorado
State University.
Yanai Y, Toyota K, Okazaki M 2007. Effects of charcoal addition on N2O emissions
from soil resulting from rewetting air-dried soil in short-term incubation
experiments. Soil Science and Plant Nutrition 53: 181–188.
Yates GW 1976. Earthworm population of a pasture spray-irrigated with dairy shed
effluent. New Zealand Journal of Agricultural Research, 19:387-91.
112
Soil Carbon Report prepared for AGMARDT
Yeates, G.W., Bardgett, R.D., Cook, R., Hobbs, P.J., Bowling, P.J., Potter, J.F., 1997.
Faunal and microbial diversity in three Welsh grassland soils under conventional
and organic management regimes. J. Appl. Ecol. 34, 453 470
Young A 1997 Agroforestry for soil conservation 2nd
edn. (CAB International-ICRAF:
Wallingford, UK).
113
Soil Carbon Report prepared for AGMARDT
9. Glossary
acid soil–Soil with a pH value <7.0.
adsorption–The process by which atoms, molecules, or ions are taken up from the soil solution
or soil atmosphere and retained on the surfaces of solids by chemical or physical binding.
aeration, soil–The process by which air in the soil is replaced by air from the atmosphere. In a
well-aerated soil, the soil air is very similar in composition to the atmosphere above the
soil. Poorly aerated soils usually contain a much higher content of CO2 and a lower content
of O2 than the atmosphere above the soil. The rate of aeration depends largely on the
volume and continuity of air-filled pores within the soil.
aerobic–(i) Having molecular oxygen as a part of the environment. (ii) Growing only in the
presence of molecular oxygen, such as aerobic organisms. (iii) Occurring only in the
presence of molecular oxygen (said of chemical or biochemical processes such as aerobic
decomposition).
aggregate–A group of primary soil particles that cohere to each other more strongly than to
other surrounding particles.
aggregation–The process whereby primary soil particles (sand, silt, clay) are bound together,
usually by natural forces and substances derived from root exudates and microbial activity.
air dry–(i) The state of dryness at equilibrium with the water content in the surrounding
atmosphere. The actual water content will depend upon the relative humidity and
temperature of the surrounding atmosphere. (ii) To allow to reach equilibrium in water
content with the surrounding atmosphere.
allophane–An aluminosilicate with primarily short-range structural order. Occurs as
exceedingly small spherical particles especially in soils formed from volcanic ash.
Alluvial soil–(i) A soil developing from recently deposited alluvium and exhibiting essentially
no horizon development or modification of the recently deposited materials. (ii) When
capitalized the term refers to a great soil group of the azonal order consisting of soils with
little or no modification of the recent sediment in which they are forming. (Not used in
current U.S. system of soil taxonomy.)
anaerobic–(i) The absence of molecular oxygen. (ii) Growing in the absence of molecular
oxygen (such as anaerobic bacteria). (iii) Occurring in the absence of molecular oxygen (as
a biochemical process).
anaerobic respiration–The metabolic process whereby electrons are transferred from a
reduced compound (usually organic) to an inorganic acceptor molecule other than oxygen.
The most common acceptors are carbonate, sulfate, and nitrate. See also denitrification.
anion exchange capacity–The sum of exchangeable anions that a soil can adsorb. Usually
expressed as centimoles, or millimoles, of charge per kilogram of soil (or of other
adsorbing material such as clay).
arable land–Land so located that production of cultivated crops is economical and practical.
ash (volcanic)–Unconsolidated, pyroclastic material less than 2 mm in all dimensions.
Commonly called "volcanic ash". Compare cinders, lapilli, tephra.
aspect–The direction toward which a slope faces with respect to the compass or to the rays of
the sun.
available nutrients–(i) The amount of soil nutrient in chemical forms accessible to plant roots
or compounds likely to be convertible to such forms during the growing season. and (ii)
The contents of legally designated “available” nutrients in fertilizers determined by
specified laboratory procedures which in most states constitute the legal basis for
guarantees.
available water (capacity)–The amount of water released between in situ field capacity and
the permanent wilting point (usually estimated by water content at soil matric potential of -
114
Soil Carbon Report prepared for AGMARDT
1.5 MPa). It is not the portion of water that can be absorbed by plant roots, which is plant
specific. See also nonlimiting water range.
biodegradable– A substance able to be decomposed by biological processes.
biological availability–That portion of a chemical compound or element that can be taken up
readily by living organisms.
bulk density, soil ( b)–The mass of dry soil per unit bulk volume. The value is expressed as
Mg per cubic meter, Mg m-3
.
carbon cycle–The sequence of transformations whereby carbon dioxide is converted to organic
forms by photosynthesis or chemosynthesis, recycled through the biosphere (with partial
incorporation into sediments), and ultimately returned to its original state through
respiration or combustion.
carbon-organic nitrogen ratio–The ratio of the mass of organic carbon to the mass of organic
nitrogen in soil, organic material, plants, or microbial cells.
cation exchange capacity (CEC)– The sum of exchangeable bases plus total soil acidity at a
specific pH, values, usually 7.0 or 8.0. When acidity is expressed as salt extractable
acidity, the cation exchange capacity is called the effective cation exchange capacity
(ECEC) because this is considered to be the CEC of the exchanger at the native pH value.
It is usually expressed in centimoles of charge per kilogram of exchanger (cmolc kg-1
) or
millimoles of charge per kilogram of exchanger. See also acidity, total.
carbon sequestration – Storage of CO2 through biological or physical process.
chronosequence–A group of related soils that differ, one from the other, primarily as a result
of differences in time as a soil-forming factor.
clay–(i) A soil separate consisting of particles <0.002 mm in equivalent diameter. See also soil
separates. (ii) A textural class. See also soil texture. (iii) (In reference to clay mineralogy)
A naturally occurring material composed primarily of fine-grained minerals, which is
generally plastic at appropriate water contents and will harden when dried or fired.
Although clay usually contains phyllosilicates, it may contain other materials that impart
plasticity and harden when dried or fired. Associated phases in clay may include materials
that do not impart plasticity and organic matter.
compost–Organic residues, or a mixture of organic residues and soil, that have been mixed,
piled, and moistened, with or without addition of fertilizer and lime, and generally allowed
to undergo thermophilic decomposition until the original organic materials have been
substantially altered or decomposed. Sometimes called “artificial manure” or “synthetic
manure.” In Europe, the term may refer to a potting mix for container-grown plants.
composting–A controlled biological process which converts organic constituents, usually
wastes, into humus-like material suitable for use as a soil amendment or organic fertilizer.
cover crop–Close-growing crop, that provides soil protection, seeding protection, and soil
improvement between periods of normal crop production, or between trees in orchards and
vines in vineyards. When ploughed under and incorporated into the soil, cover crops may
be referred to as green manure crops.
crop rotation–A planned sequence of crops growing in a regularly recurring succession on the
same area of land, as contrasted to continuous culture of one crop or growing a variable
sequence of crops.
degradation–(i) The process whereby a compound is transformed into simpler compounds. (ii)
(no longer used in SSSA publications) The changing of a soil to a more highly leached and
a more highly weathered condition; usually accompanied by morphological changes such
as development of an A2 horizon.
evapotranspiration–The combined loss of water from a given area, and during a specified period of time, by evaporation from the soil surface and by transpiration from plants.

115
Soil Carbon Report prepared for AGMARDT
field capacity, in situ (field water capacity)–The content of water, on a mass or volume basis,
remaining in a soil 2 or 3 days after having been wetted with water and after free drainage
is negligible. See also available water.
fulvic acid–The pigmented organic material that remains in solution after removal of humic
acid by acidification. It is separated from the fulvic acid fraction by adsorption on a
hydrophobic resin at low pH values. See also soil organic
GHG- Green house gases e.g. N2O, CH4, CO2, vapour etc.
gravitational water–Water which moves into, through, or out of the soil under the influence of
gravity. See also soil water, soil water potential.
green manure–Plant material incorporated into soil while green or at maturity, for soil
improvement.
green manure crop–Any crop grown for the purpose of being turned under while green or
soon after maturity for soil improvement.
greenhouse effect–The absorption of solar radiant energy by the earth's surface and its release
as heat into the atmosphere; longer infrared heat waves are absorbed by the air, principally
by carbon dioxide and water vapor, thus, the atmosphere traps heat much as does the glass
in a greenhouse.
heavy metals–Those metals which have densities >5.0 Mg m-3
. In soils these include the
elements Cd, Co, Cr, Cu, Fe, Hg, Mn, Mo, Ni, Pb, and Zn.
humus–Total of the organic compounds in soil exclusive of undecayed plant and animal
tissues, their “partial decomposition” products, and the soil biomass. The term is often used
synonymously with soil organic matter.
immobilization–The conversion of an element from the inorganic to the organic
IPCC- Intergovernmental panel on climate change
labile–Readily transformed by microorganisms or readily available to plants.
labile pool–The sum of an element in the soil solution and the amount of that element readily
solubilized or exchanged when the soil is equilibrated with a salt solution.
landscape–A collection of related landforms; usually the land surface which the eye can
comprehend in a single view.
leachate–Liquids that have percolated through a soil and that contain substances in solution or
suspension.
leaching–The removal of soluble materials from one zone in soil to another via water
movement in the profile. See also eluviation.
litter–The surface layer of the forest floor which is not in an advanced stage of decomposition,
usually consisting of freshly fallen leaves, needles, twigs, stems, bark, and fruits.
mesofauna–Nematodes, oligochaete worms, smaller insect larvae, and microarthropods.
microbial biomass–(i) The total mass of living microorganisms in a given volume or mass of
soil. (ii) The total weight of all microorganisms in a particular environment.
microfauna–Protozoa, nematodes, and arthropods of microscopic size.
microflora–Bacteria (including actinomycetes), fungi, algae, and viruses.
mineralization–The conversion of an element from an organic form to an inorganic state as a
result of microbial activity.
net primary productivity (NPP)–Net carbon assimilation by plants. NPP = GPP - respiration
losses. NPP can be estimated for a given time period as B + L + H, where B = biomass
accumulation for the period, L = biomass of material produced in the period and shed (i.e. foliage, flowers, branches), and H = biomass produced in the period and consumed by
animals and insects.
116
Soil Carbon Report prepared for AGMARDT
nutrient–Elements or compounds essential as raw materials for organism growth and
development.
organic farming–Crop production system that reduces, avoids or largely excludes the use of
synthetically compound fertilizers, pesticides, growth regulators, and livestock feed
additives.
organic fertilizer–By product from the processing of animals or vegetable substances that
contain sufficient plant nutrients to be of value as fertilizers.
Pg- Petagram (1015 quadrillion metric tons)
physical properties (of soils)–Those characteristics, processes, or reactions of a soil which are
caused by physical forces and which can be described by, or expressed in, physical terms
or equations. Examples of physical properties are bulk density, hydraulic conductivity,
porosity, pore-size distribution, etc.
plant nutrient–An element which is absorbed by plants and is necessary for completion of the
normal life cycle. These include C, H, O, N, P, K, Ca, Mg, S, Cu, Fe, Zn, Mn, B, Cl, Ni,
and Mo.
porosity–The volume of pores in a soil sample (nonsolid volume) divided by the bulk volume
of the sample.
rhizosphere–The zone of soil immediately adjacent to plant roots in which the kinds, numbers,
or activities of microorganisms differ from that of the bulk soil.
runoff–That portion of precipitation or irrigation on an area which does not infiltrate, but
instead is discharged from the area. That which is lost without entering the soil is called
surface runoff. That which enters the soil before reaching a stream channel is called
ground water runoff or seepage flow from ground water. (In soil science runoff usually
refers to the water lost by surface flow; in geology and hydraulics runoff usually includes
both surface and subsurface flow.)
sedimentary rock–A rock formed from materials deposited from suspension or precipitated
from solution and usually being more or less consolidated. The principal sedimentary rocks
are sandstones, shales, limestones, and conglomerates.
soil biochemistry–The branch of soil science concerned with enzymes and the reactions,
activities, and products of soil microorganisms.
soil compaction–Increasing the soil bulk density, and concomitantly decreasing the soil
porosity, by the application of mechanical forces to the soil.
soil conservation–(i) Protection of the soil against physical loss by erosion or against chemical
deterioration; that is, excessive loss of fertility by either natural or artificial means. (ii) A
combination of all management and land use methods that safeguard the soil against
depletion or deterioration by natural or by human-induced factors. (iii) The branch of soil
science that deals with soil conservation (i) and (ii).
soil consociation–A kind of map unit comprised of delineations, each of which shows the size,
shape, and location of a landscape unit composed of one kind of component soil, or one
kind of miscellaneous area, plus allowable inclusions in either case. See also component
soil, soil complex, soil association, undifferentiated group, miscellaneous areas.
soil microbiology–The branch of soil science concerned with soil-inhabiting microorganisms,
their functions, and activities.
soil organic matter–The organic fraction of the soil exclusive of undecayed plant and animal
residues. See also humus.
soil organic residue–Animal and vegetative materials added to the soil of recognizable origin.
soil qualities–Inherent attributes of soils which are inferred from soil characteristics or indirect observations (e.g., compactibility, erodibility, and fertility).

117
Soil Carbon Report prepared for AGMARDT
soil quality–The capacity of a soil to function within ecosystem boundaries to sustain
biological productivity, maintain environmental quality, and promote plant and animal
health.
soil structure–The combination or arrangement of primary soil particles into secondary units
or peds. The secondary units are characterized on the basis of size, shape, and grade
(degree of distinctness).
surface soil–The uppermost part of the soil, ordinarily moved in tillage, or its equivalent in
uncultivated soils and ranging in depth from 7 to 25 cm. Frequently designated as the
plough layer, the surface layer, the Ap layer, or the Ap horizon. See also topsoil.
sustainability–Managing soil and crop cultural practices so as not to degrade or impair
environmental quality on or off site, and without eventually reducing yield potential as a
result of the chosen practice through exhaustion of either on-site resources or non-
renewable inputs.
Tg – I million metric tons
tillage–The mechanical manipulation of the soil profile for any purpose; but in agriculture it is
usually restricted to modifying soil conditions and/or managing crop residues and/or weeds
and/or incorporating chemicals for crop production.
soil management–The combination of all tillage operations, cropping practices, fertilizer,
lime, and other treatments conducted on or applied to the soil for the production of
plants.
strip cropping (field strip cropping, contour strip cropping)–The practice of growing two
or more crops in alternating strips along contours, often perpendicular to the prevailing
direction of wind or surface water flow.
strip planting (strip till planting)–A method of simultaneous tillage and planting in isolated
bands of varying width, separated by bands of erect residues essentially undisturbed by
tillage.
topsoil–(i) The layer of soil moved in cultivation. Frequently designated as the Ap layer or Ap horizon. See also surface soil. (ii) Presumably fertile soil material
water drop penetration time (WDPT)–A measure of soil water repellency which uses the
imbibition time of drops of prescribed aqueous solutions as a discriminator.
water-stable aggregate–A soil aggregate which is stable to the action of water such as falling
drops, or agitation as in wet-sieving analysis.
weathering–The breakdown and changes in rocks and sediments at or near the
xenobiotic–A compound foreign to biological systems. Often refers to human-made
compounds that are resistant or recalcitrant to biodegradation and/or decomposition.

118
Soil Carbon Report prepared for AGMARDT
10. Appendix 1 PAS 2050 protocol
10.1 The PAS 2050 protocol and the Pesticide Paradox
From a climate-change point of view, a constant, or even increasing, level of soil C
content in apple orchards is desirable, indicating that no net greenhouse gas
emissions from the soils are associated with the orchard operations. The greenhouse
gases resulting from soil-C losses caused by apple orchard management that fails to
balance the continuous loss of soil C by an equivalent input of organic matter might, in
the future, be added to the life cycle greenhouse gas emissions of apples in the PAS
2050 (BSI 2008). External inputs of long-lived C, such as biochar, or even some parts
of compost, or manure may lead to a long-term increase of the soil organic-C
contents.
The current version of the PAS 2050 does not consider any greenhouse-gas
emissions, or reductions, that arise from a change of the soil-C contents. The following
paragraph in the PAS2050 refers to the issue of the change of soil C contents:
PAS2050:2008, 5.6 Treatment of soil C change in existing agricultural
systems: Changes in the C content of the soils, either emissions or
sequestration, other than those arising from direct land use change shall be
excluded from the assessment of GHG emissions under this PAS.
…Note 2: While it is recognized that soils play an important part in the C cycle
both as a source and sink for C, there is considerable uncertainty regarding
the impacts of different techniques in agricultural systems. For this reason,
emissions and sequestration arising from changes in soil C are outside the
scope of this PAS. Inclusion of C storage in soils will be considered further in
future revisions of this PAS.
We highlight the anomaly that this ignorance of soil C creates by considering whether
a grassed tree-row would have a C footprint smaller than a herbicided tree rows. The
functional unit for an apple orchard would be a kg of apples, and the C footprint, or
component of the footprint, is then expressed as being kg-CO2 equivalent, CO2-e, as it
needs to take into account all greenhouse gases with their differing global warming
potentials (GWP). For example, the GWP of nitrous oxide gas, N2O, is 298 because
of its persistence in the atmosphere.
119
Soil Carbon Report prepared for AGMARDT
A life cycle assessment (LCA) using the PAS 2050 of the use of herbicides to create a
bare strip along the tree results in a contribution of 1.3 g-CO2-e kg-1
of apples
produced. This includes the fuel use and embodied C in the herbicide. If the tree-row
were grassed, and then mowed and the clippings returned to the soil, the IPCC rules
require the 1% of the applied N in the clippings must be accounted for as emitted N2O.
This means that the footprint resulting from having a grass strip and mowing it is 4.2 g-
CO2-e kg-1
of apples produced. So to obtain a reduction in the C footprint, it would
seem sensible to adopt the use of a herbicided tree-row.
Changes in soil C are ignored in the PAS 2050. Yet if they were, then the changes in
soil C listed in Figure 3.22 for an integrated orchard would result in a C footprint
calculated at 730 g-CO2-e ha-1
yr-1
. This footprint size is nearly three times greater
than the footprint that results for all in-orchard operations and emissions!
So although there may be difficulties and uncertainties in bringing in soil C to
footprinting protocols, it is assuredly a large part of the overall orchard footprint.
Ignoring it could send the wrong signals. For the use of a herbicide strip, whatever its
other benefits might be, is definitely not a good option for reducing the C footprint of
production from the atmosphere‘s perspective. We can only hope that soil C will soon
be taken into account in footprinting protocols, for then their use to find reduction
options will benefit efforts for climate change mitigation.