optimizing irrigated pasture productivity using soil
TRANSCRIPT

Optimizing irrigated pasture productivity
using soil moisture monitoring systems
and decision support tools
Developing collaborative Natural Resource Management with
irrigators and farming systems groups
Presented by Natural Resources SAMDB with the support of the
SAMDBNRM Board and the National Landcare Program
Jeremy Nelson
Natural Resources SA Murray-Darling Basin
5/12/2017

Presentation overview
1. Project & Trial Site objectives
2. Groundwork and components of a monitoring system
3. Trialling a systems approach, season 2016/17
4. Monitoring, adapting & troubleshooting
5. Productivity outcomes – 2016/17
6. Findings and recommendations
7. Questions
Project and trial site objectives
• Demonstrate through the integration of the use of advanced monitoring
systems, decision support tools and system and site benchmarking the benefits
to annual irrigated pasture productivity
• Identify the strengths and weaknesses of using decision support tools in
everyday real life production settings and identify economic benchmarks of
pasture production
• Use the combined information resources from the trial site to establish a longer
term irrigation scheduling approach that will optimise water resource usage
and productivity
• Provide trial site reference data to the broader community
Project and trial site objectives
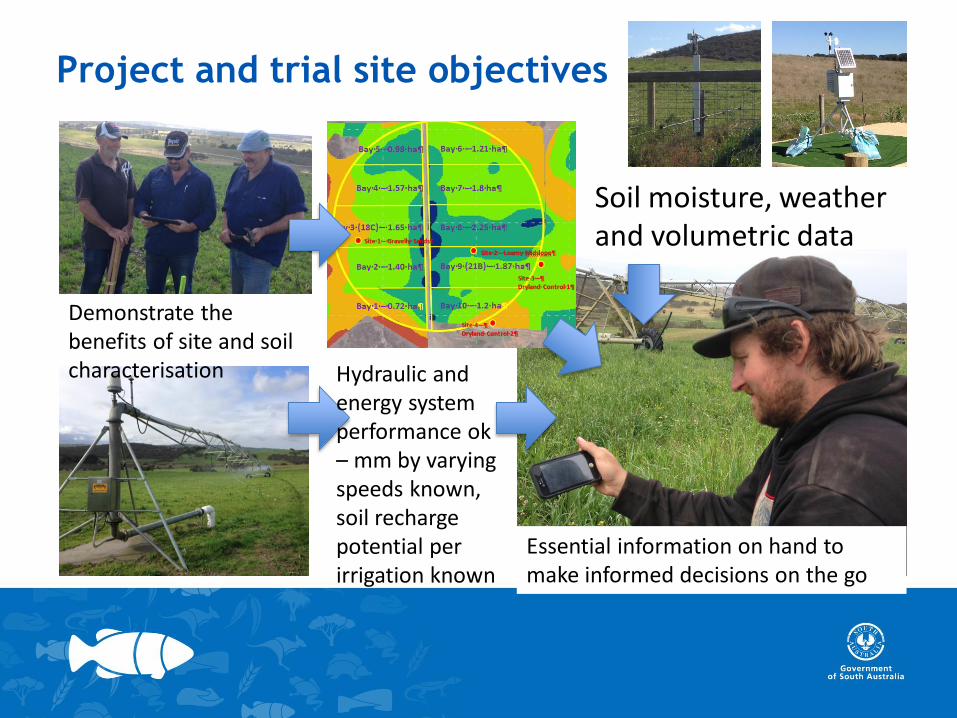
Soil moisture, weather and volumetric data
Hydraulic and energy system performance ok – mm by varying speeds known, soil recharge potential per irrigation known
Demonstrate the benefits of site and soil characterisation
Essential information on hand to make informed decisions on the go
The trial site – Cleland’s Mt. Compass, South Australia
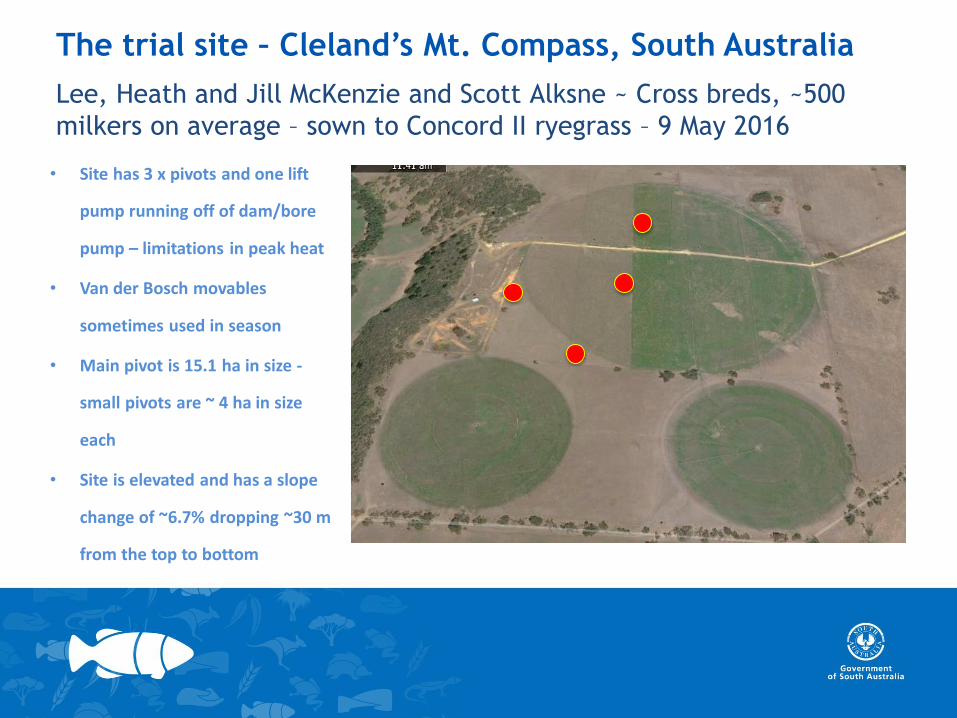
Lee, Heath and Jill McKenzie and Scott Alksne ~ Cross breds, ~500
milkers on average – sown to Concord II ryegrass – 9 May 2016
• Site has 3 x pivots and one lift
pump running off of dam/bore
pump – limitations in peak heat
• Van der Bosch movables
sometimes used in season
• Main pivot is 15.1 ha in size -
small pivots are ~ 4 ha in size
each
• Site is elevated and has a slope
change of ~6.7% dropping ~30 m
from the top to bottom

Groundwork, tools and establishing monitoring systems
• Site selection and soil mapping via EM mapping (50cm), soil coring and soil
characterisation, appraisal of soil physical characteristics, RAW value
determination by key zones
• Irrigation system benchmarking, energy usage, hydraulic assessment and overall
irrigation and pumping system performance
• Installation of capacitance probe monitoring system x 4 sites to 60 cm depth,
installation of comparable gypsum block systems at 30, 60 and 90 cm soil depth
• Companion installation of automatic weather station at nearby location
• Web availability of data streams by login or direct access
• Basic paddock history monitoring through 15/16 and 16/17
Groundwork, tools and establishing monitoring systems
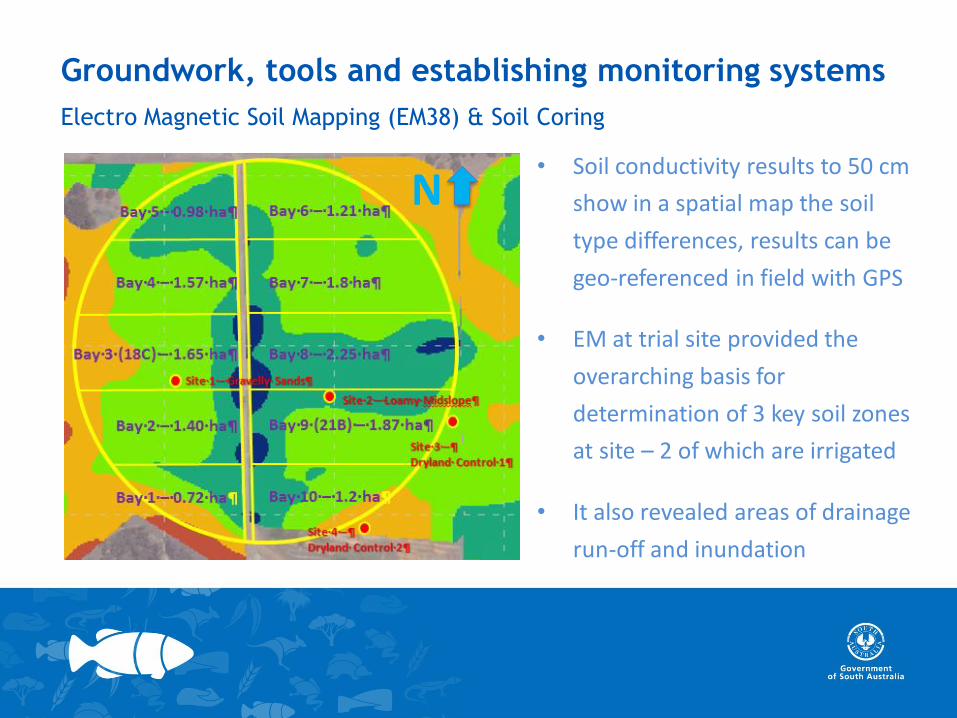
Electro Magnetic Soil Mapping (EM38) & Soil Coring
• Soil conductivity results to 50 cm
show in a spatial map the soil
type differences, results can be
geo-referenced in field with GPS
• EM at trial site provided the
overarching basis for
determination of 3 key soil zones
at site – 2 of which are irrigated
• It also revealed areas of drainage
run-off and inundation
N
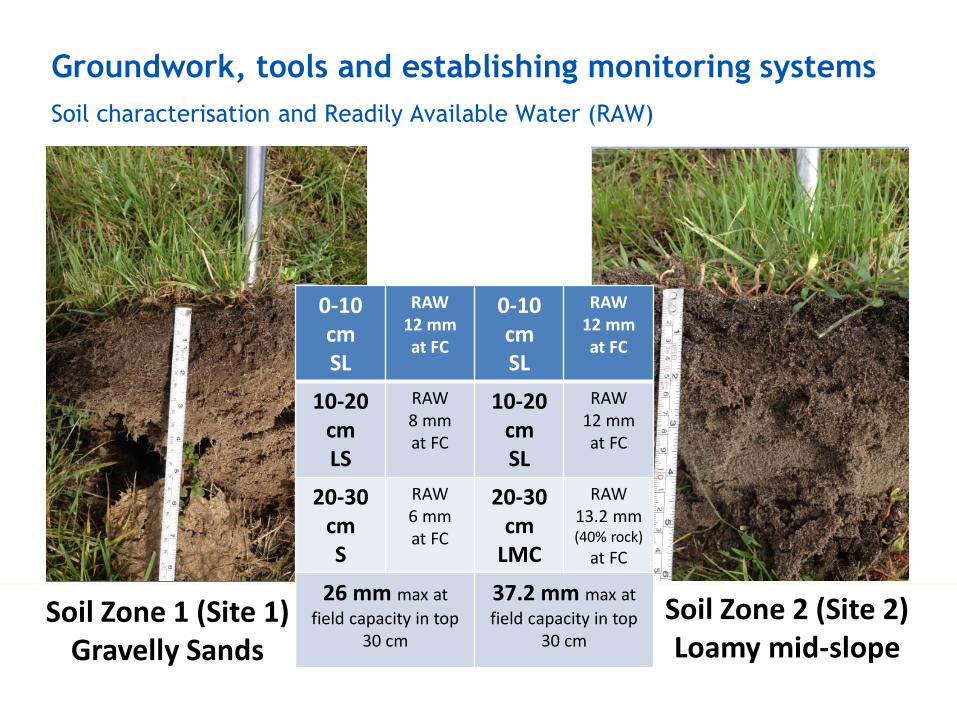
Groundwork, tools and establishing monitoring systems
Soil characterisation and Readily Available Water (RAW)
Soil Zone 1 (Site 1)Gravelly Sands
Soil Zone 2 (Site 2)Loamy mid-slope
0-10 cmSL
RAW12 mmat FC
0-10cmSL
RAW12 mmat FC
10-20 cmLS
RAW8 mmat FC
10-20 cmSL
RAW12 mmat FC
20-30 cmS
RAW6 mmat FC
20-30 cm
LMC
RAW 13.2 mm(40% rock)
at FC
26 mm max at
field capacity in top 30 cm
37.2 mm max at
field capacity in top 30 cm
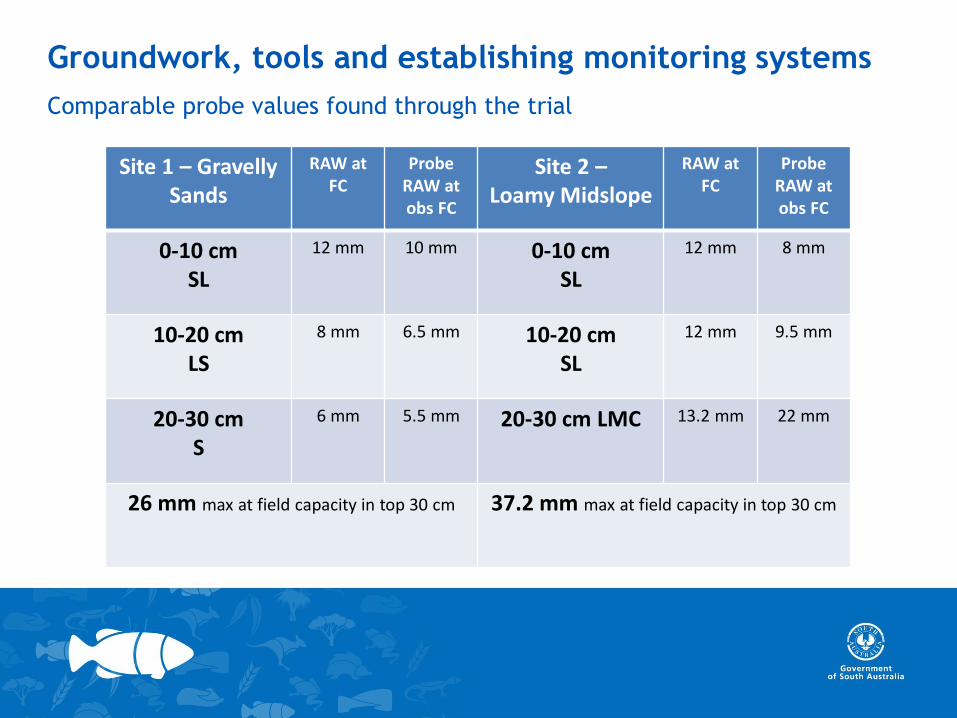
Groundwork, tools and establishing monitoring systems
Comparable probe values found through the trial
Site 1 – Gravelly Sands
RAW at FC
Probe RAW at obs FC
Site 2 –Loamy Midslope
RAW at FC
Probe RAW at obs FC
0-10 cmSL
12 mm 10 mm 0-10 cmSL
12 mm 8 mm
10-20 cmLS
8 mm 6.5 mm 10-20 cmSL
12 mm 9.5 mm
20-30 cmS
6 mm 5.5 mm 20-30 cm LMC 13.2 mm 22 mm
26 mm max at field capacity in top 30 cm 37.2 mm max at field capacity in top 30 cm
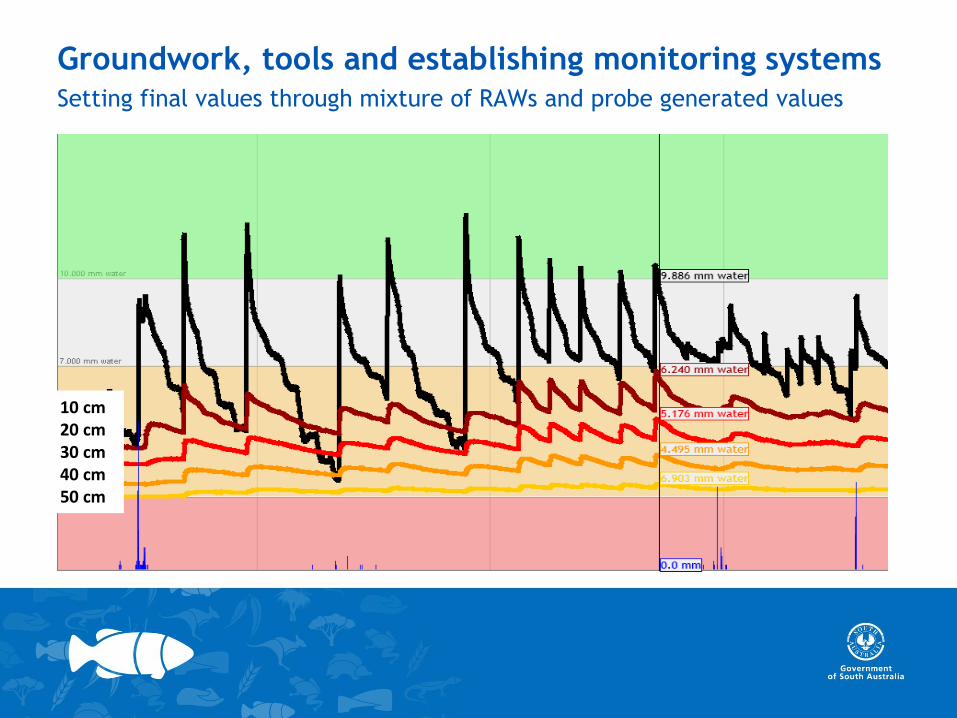
Groundwork, tools and establishing monitoring systemsSetting final values through mixture of RAWs and probe generated values
10 cm20 cm30 cm40 cm50 cm
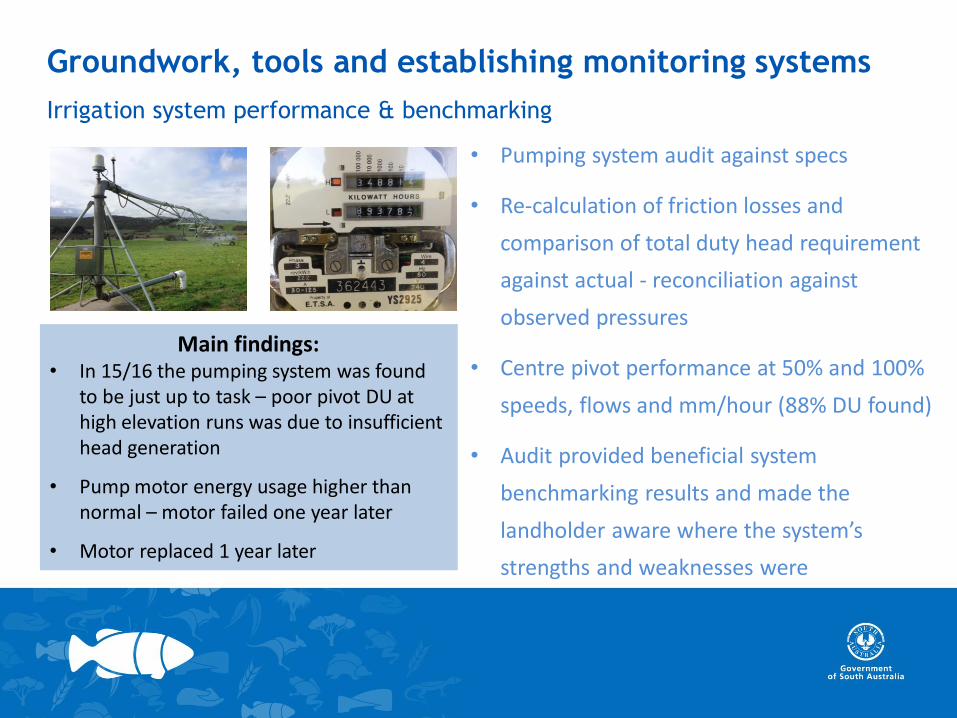
Groundwork, tools and establishing monitoring systems
Irrigation system performance & benchmarking
• Pumping system audit against specs
• Re-calculation of friction losses and
comparison of total duty head requirement
against actual - reconciliation against
observed pressures
• Centre pivot performance at 50% and 100%
speeds, flows and mm/hour (88% DU found)
• Audit provided beneficial system
benchmarking results and made the
landholder aware where the system’s
strengths and weaknesses were
Main findings:• In 15/16 the pumping system was found
to be just up to task – poor pivot DU at high elevation runs was due to insufficient head generation
• Pump motor energy usage higher than normal – motor failed one year later
• Motor replaced 1 year later
Groundwork, tools and establishing monitoring systems
Irrigation system performance & benchmarking
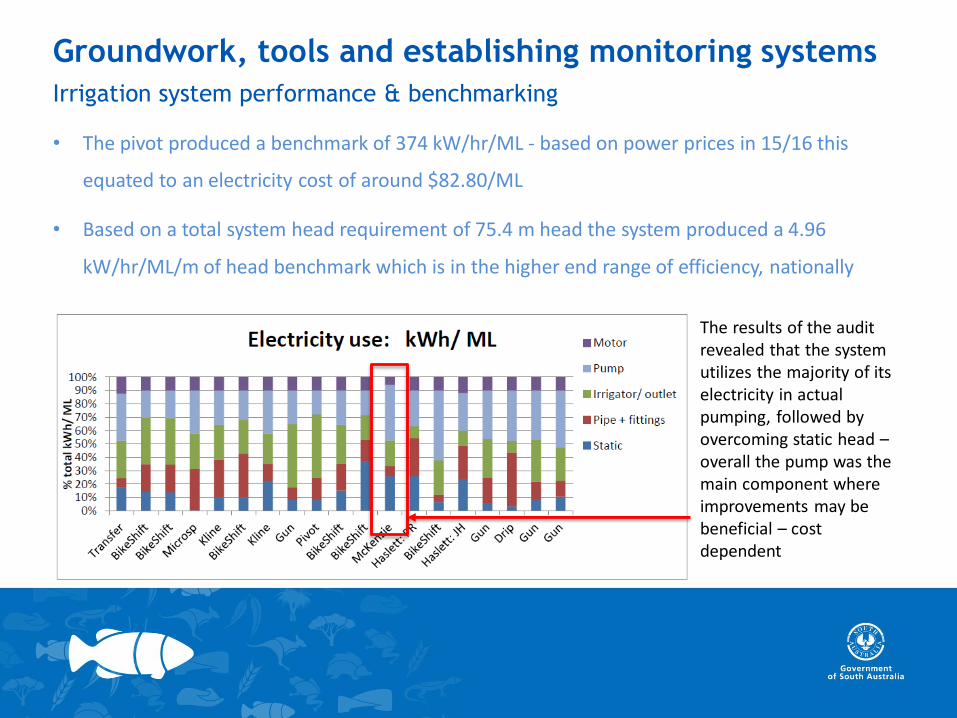
• The pivot produced a benchmark of 374 kW/hr/ML - based on power prices in 15/16 this
equated to an electricity cost of around $82.80/ML
• Based on a total system head requirement of 75.4 m head the system produced a 4.96
kW/hr/ML/m of head benchmark which is in the higher end range of efficiency, nationally
The results of the audit revealed that the system utilizes the majority of its electricity in actual pumping, followed by overcoming static head –overall the pump was the main component where improvements may be beneficial – cost dependent
Groundwork, tools and establishing monitoring systems
Installation of soil moisture monitoring systems
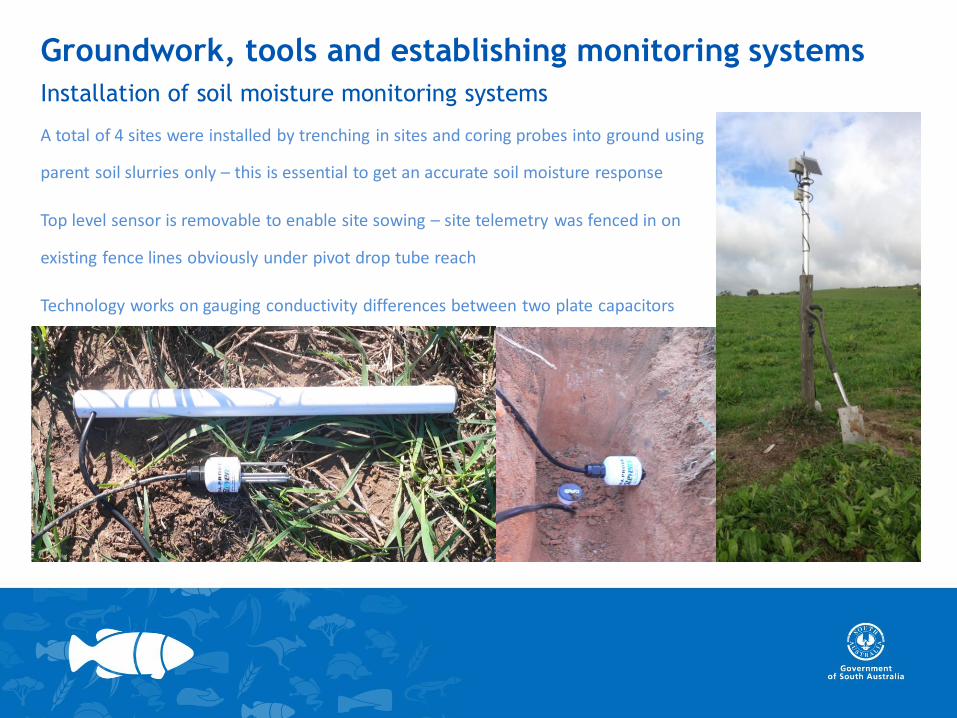
A total of 4 sites were installed by trenching in sites and coring probes into ground using
parent soil slurries only – this is essential to get an accurate soil moisture response
Top level sensor is removable to enable site sowing – site telemetry was fenced in on
existing fence lines obviously under pivot drop tube reach
Technology works on gauging conductivity differences between two plate capacitors
Groundwork, tools and establishing monitoring systems
Installation of soil moisture monitoring systems
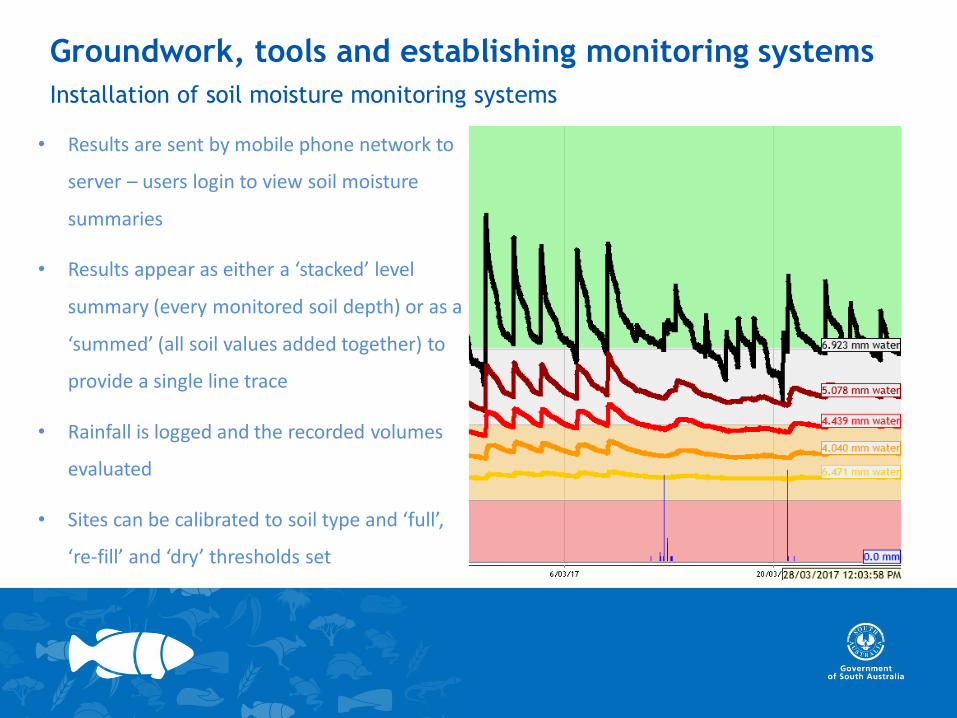
• Results are sent by mobile phone network to
server – users login to view soil moisture
summaries
• Results appear as either a ‘stacked’ level
summary (every monitored soil depth) or as a
‘summed’ (all soil values added together) to
provide a single line trace
• Rainfall is logged and the recorded volumes
evaluated
• Sites can be calibrated to soil type and ‘full’,
‘re-fill’ and ‘dry’ thresholds set
Groundwork, tools and establishing monitoring systems
Installation of soil moisture monitoring systems
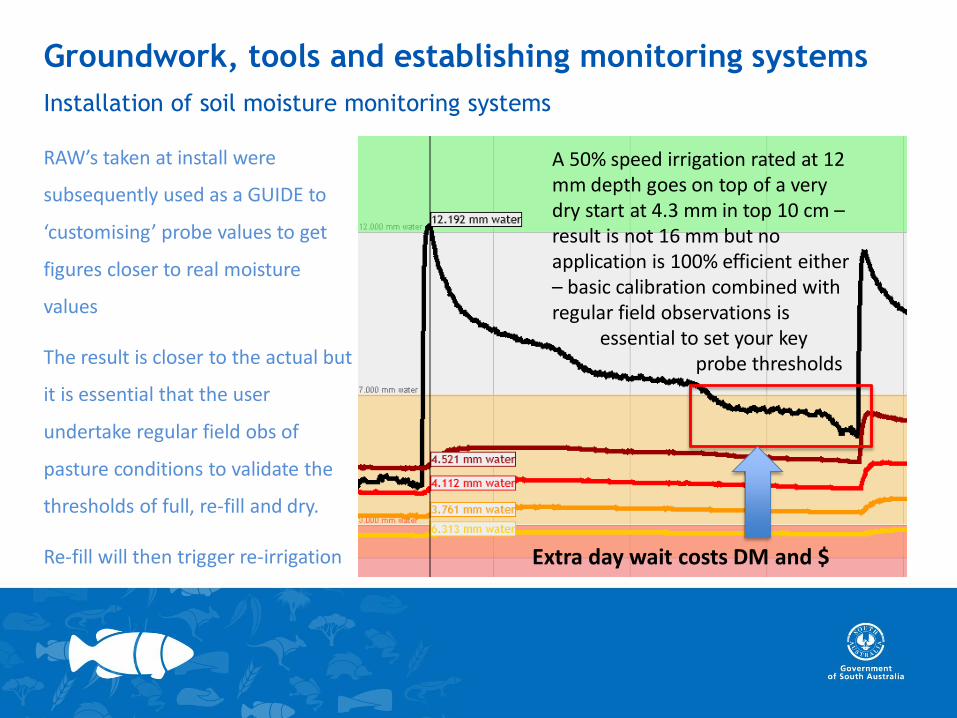
RAW’s taken at install were
subsequently used as a GUIDE to
‘customising’ probe values to get
figures closer to real moisture
values
The result is closer to the actual but
it is essential that the user
undertake regular field obs of
pasture conditions to validate the
thresholds of full, re-fill and dry.
Re-fill will then trigger re-irrigation
A 50% speed irrigation rated at 12 mm depth goes on top of a very dry start at 4.3 mm in top 10 cm –result is not 16 mm but no application is 100% efficient either – basic calibration combined with regular field observations is
essential to set your key probe thresholds
Extra day wait costs DM and $
Groundwork, tools and establishing monitoring systems
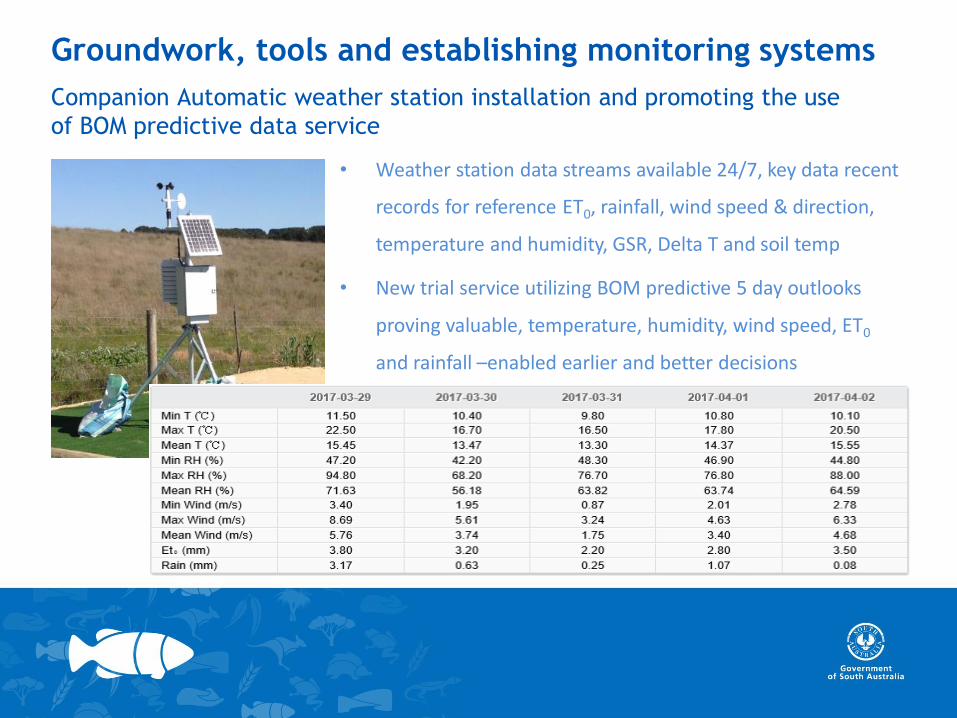
Companion Automatic weather station installation and promoting the use
of BOM predictive data service
• Weather station data streams available 24/7, key data recent
records for reference ET0, rainfall, wind speed & direction,
temperature and humidity, GSR, Delta T and soil temp
• New trial service utilizing BOM predictive 5 day outlooks
proving valuable, temperature, humidity, wind speed, ET0
and rainfall –enabled earlier and better decisions
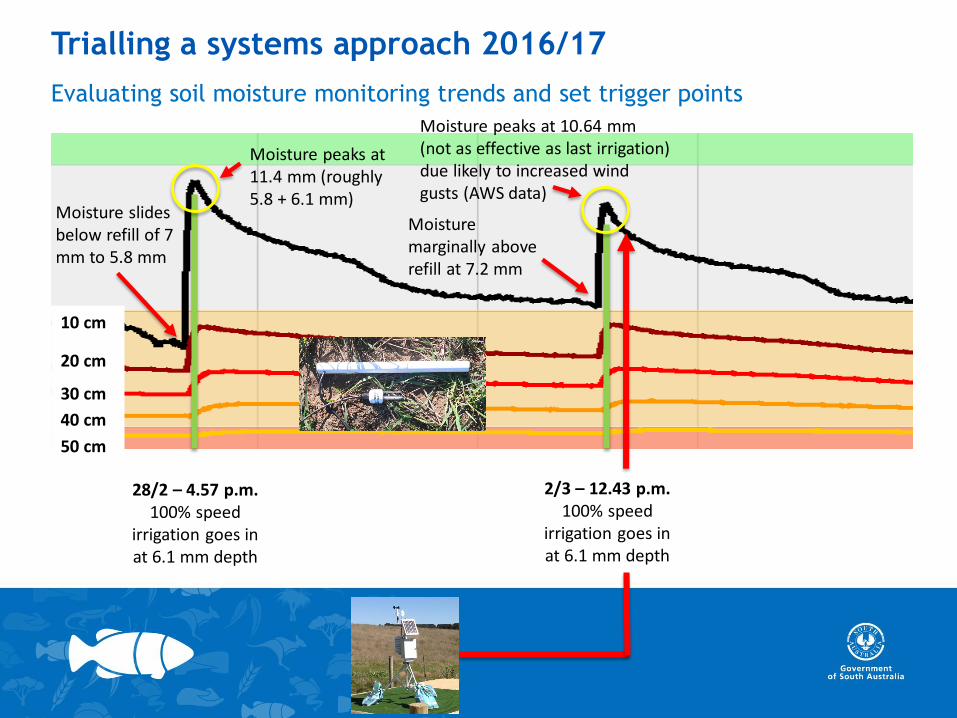
Trialling a systems approach 2016/17
Evaluating soil moisture monitoring trends and set trigger points
10 cm
20 cm
30 cm
40 cm
50 cm
Moisture slides below refill of 7 mm to 5.8 mm
28/2 – 4.57 p.m.100% speed
irrigation goes in at 6.1 mm depth
Moisture peaks at 11.4 mm (roughly 5.8 + 6.1 mm)
2/3 – 12.43 p.m.100% speed
irrigation goes in at 6.1 mm depth
Moisture marginally above refill at 7.2 mm
Moisture peaks at 10.64 mm (not as effective as last irrigation) due likely to increased wind gusts (AWS data)

Trialling a systems approach 2016/17
Practically using climate data in the trial – evaluating effective rainfall
Evaluating effective rainfall was a key point this
season – graph traces revealed that regardless of
the event size that the scenario is generally the
same, that is that in sandy soils with shallow
rooted pastures that moisture doesn’t hang
around
In this example it can be seen that despite what
we might think about the effectiveness of rainfall
in this particular case (given particularly that soils
were dry at the outset) rainfall’s effectiveness can
be well evaluated by graph behaviour
Starting moisture at 10 cm 3.5 mm, after 33.7 mm of rainfall in December moisture peaks at 12.23 mm on 8/12/16 at 1 a.m.
By midnight on 8/12/16 moisture in the top 10 cm is crossing the recharge point and shortly thereafter 20 cm soil trace depreciates further
10 cm
20 cm
30 cm
40 cm
50 cm8/12/16 9/12
Monitoring, adapting & troubleshooting
• The biggest challenge this season was having defined interval – enacting and repeating at
a set interval repeat irrigations
• There was room for error early in the season and some good rains that tended to send the
message that ‘all was well’ – however into January and February where there was no
mercy one or two days extra beyond the set interval on a recurrent basis really knocked
back DM production – this is probably the biggest learning for the irrigator this season
• There was also the issue of compaction and rooting depth which became apparent
through field monitoring during the season – roots at either of the monitoring sites do not
go below 20 cm
• Due to this the pastures live out of the top 20 cm meaning that their RAW’s are much
more limited – this reduced the interval and with other irrigation commitments made
meeting the max of a 48 hour interval difficult
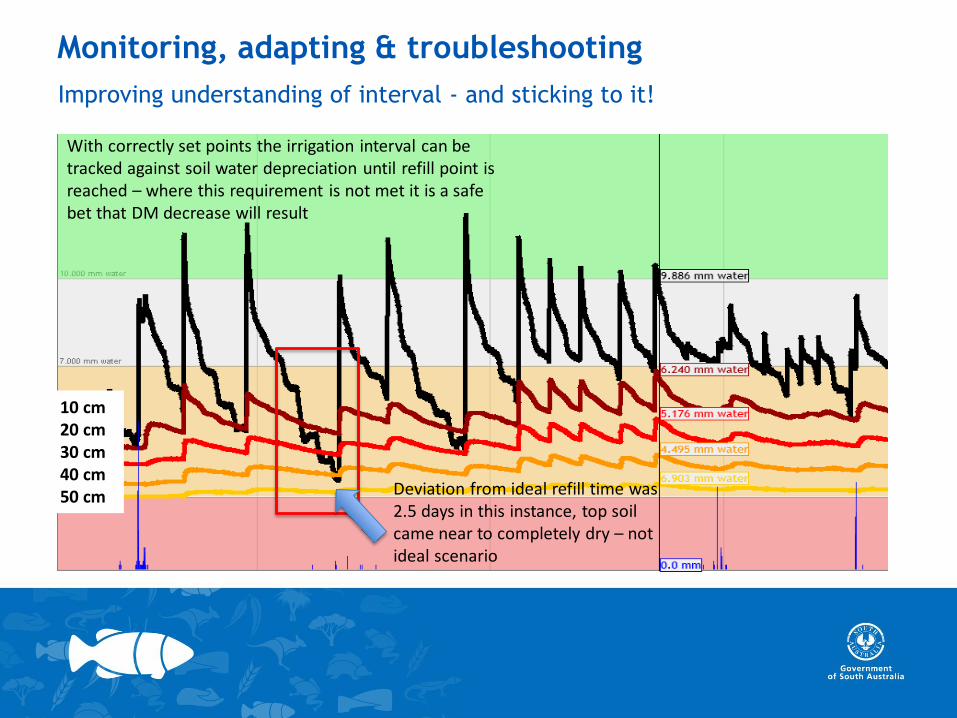
Monitoring, adapting & troubleshooting
Improving understanding of interval - and sticking to it!
10 cm20 cm30 cm40 cm50 cm
With correctly set points the irrigation interval can be tracked against soil water depreciation until refill point is reached – where this requirement is not met it is a safe bet that DM decrease will result
Deviation from ideal refill time was 2.5 days in this instance, top soil came near to completely dry – not ideal scenario

Monitoring, adapting & troubleshooting
It’s not a question of more water, but a question of the right depth of
irrigation at the right time
• At the trial site having established the correct full and re-
fill points (through the trial) it was subsequently possible
to review issues with DM production clearly
• It was suggested that ‘more’ deeper irrigations were
required – however it has been possible to demonstrate
and apply a reduced interval (which works in with other
irrigation commitments) and improve DM outcomes
without recurrent deep drainage
• This first season scenario can be greatly improved through
both pivot speed settings and sticking to the interval and
trigger points

Monitoring, adapting & troubleshooting
Alternate and cost effective monitoring - Wildeye
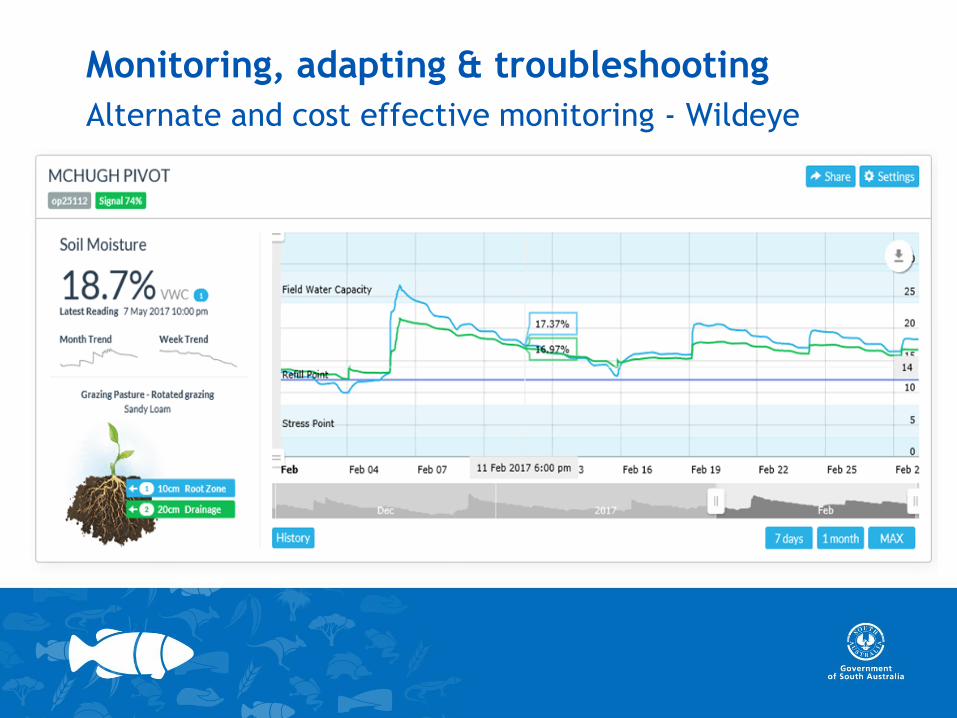
Monitoring, adapting & troubleshooting
Alternate and cost effective monitoring - Wildeye
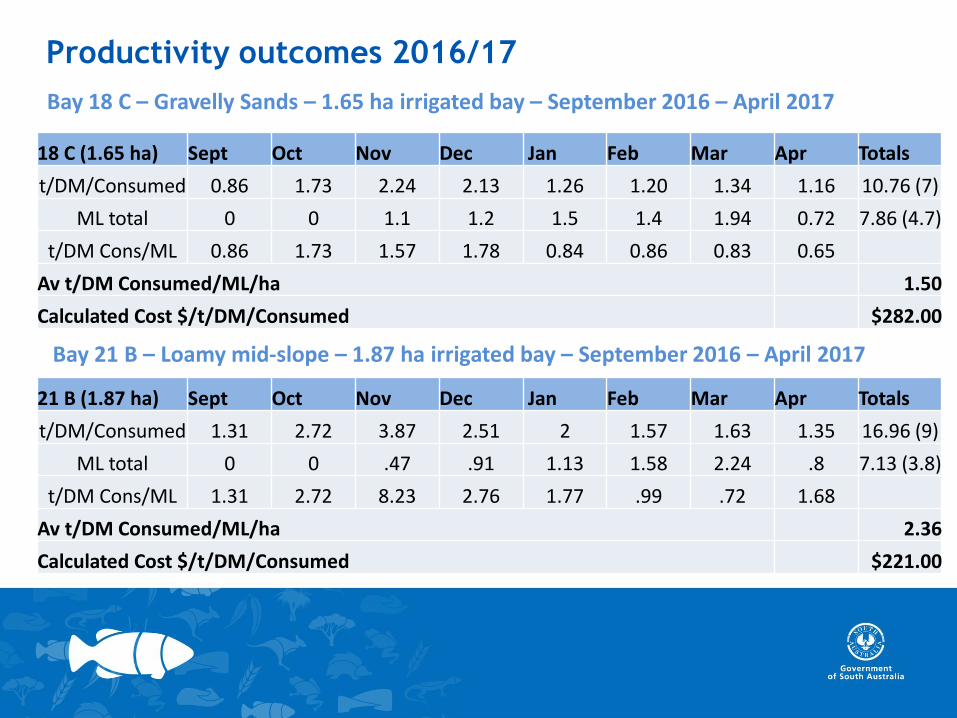
Productivity outcomes 2016/17
18 C (1.65 ha) Sept Oct Nov Dec Jan Feb Mar Apr Totals
t/DM/Consumed 0.86 1.73 2.24 2.13 1.26 1.20 1.34 1.16 10.76 (7)
ML total 0 0 1.1 1.2 1.5 1.4 1.94 0.72 7.86 (4.7)
t/DM Cons/ML 0.86 1.73 1.57 1.78 0.84 0.86 0.83 0.65
Av t/DM Consumed/ML/ha 1.50
Calculated Cost $/t/DM/Consumed $282.00
Bay 18 C – Gravelly Sands – 1.65 ha irrigated bay – September 2016 – April 2017
Bay 21 B – Loamy mid-slope – 1.87 ha irrigated bay – September 2016 – April 2017
21 B (1.87 ha) Sept Oct Nov Dec Jan Feb Mar Apr Totals
t/DM/Consumed 1.31 2.72 3.87 2.51 2 1.57 1.63 1.35 16.96 (9)
ML total 0 0 .47 .91 1.13 1.58 2.24 .8 7.13 (3.8)
t/DM Cons/ML 1.31 2.72 8.23 2.76 1.77 .99 .72 1.68
Av t/DM Consumed/ML/ha 2.36
Calculated Cost $/t/DM/Consumed $221.00
Findings & Recommendations
• Technology such as soil moisture monitoring equipment pays will pay dividends to
farm managers (if they use it consistently) as it provides key indications of the
effectiveness of irrigation and rainfall and the time to start up irrigation
• The big enemy of DM yield at the site is definitely consistent irrigation and
observation of irrigation intervals and re-fill trigger points – this is essential to
ensuring DM outcomes for the whole season
• Irrigation system benchmarking used with soil moisture monitoring technologies and
related climate data provides a solid basis for not only irrigating effectively but also
for truly gauging productivity

Questions………
Links to capacitance probe network:http://aqualab-data.dyndns.info/secure/common/main.vm username: samdb password: demo
Link to NRM Weather station network:http://aws.naturalresources.sa.gov.au/southeast/
Contact: Jeremy Nelson – 0429 845 216
[email protected]/12/2017