a hadoop-based platform for patient classification and
TRANSCRIPT

HAL Id: hal-02552069https://hal.archives-ouvertes.fr/hal-02552069
Submitted on 28 Sep 2020
HAL is a multi-disciplinary open accessarchive for the deposit and dissemination of sci-entific research documents, whether they are pub-lished or not. The documents may come fromteaching and research institutions in France orabroad, or from public or private research centers.
L’archive ouverte pluridisciplinaire HAL, estdestinée au dépôt et à la diffusion de documentsscientifiques de niveau recherche, publiés ou non,émanant des établissements d’enseignement et derecherche français ou étrangers, des laboratoirespublics ou privés.
A Hadoop-Based Platform for Patient Classification andDisease Diagnosis in Healthcare Applications
Hassan Harb, Hussein Mroue, Ali Mansour, Abbass Nasser, Eduardo MottaCruz
To cite this version:Hassan Harb, Hussein Mroue, Ali Mansour, Abbass Nasser, Eduardo Motta Cruz. A Hadoop-BasedPlatform for Patient Classification and Disease Diagnosis in Healthcare Applications. Sensors, MDPI,2020, Special Issue Sensor and Systems Evaluation for Telemedicine and eHealth, 20 (7), pp.1931-1 -1931-20. �10.3390/s20071931�. �hal-02552069�

sensors
Article
A Hadoop-Based Platform for Patient Classificationand Disease Diagnosis in Healthcare Applications
Hassan Harb 1,2,* , Hussein Mroue 3, Ali Mansour 2, Abbass Nasser 1,2 and Eduardo Motta Cruz 3
1 ICCS-Lab, American University of Culture and Education (AUCE), Beirut 1105, Lebanon;[email protected]
2 Lab-STICC, CNRS UMR 6285, Ensta-Bretagne, 29200 Brest, France; [email protected] Institute of Electronics and Telecommunications of Rennes, University of Nantes, CNRS, IETR UMRS 6164,
85000 La Roche-sur-Yon, France; [email protected] (H.M.);[email protected] (E.M.C.)
* Correspondence: [email protected]
Received: 18 February 2020; Accepted: 25 March 2020; Published: 30 March 2020
Abstract: Nowadays, the increasing number of patients accompanied with the emergence of newsymptoms and diseases makes heath monitoring and assessment a complicated task for medical staffand hospitals. Indeed, the processing of big and heterogeneous data collected by biomedical sensorsalong with the need of patients’ classification and disease diagnosis become major challenges forseveral health-based sensing applications. Thus, the combination between remote sensing devicesand the big data technologies have been proven as an efficient and low cost solution for healthcareapplications. In this paper, we propose a robust big data analytics platform for real time patientmonitoring and decision making to help both hospital and medical staff. The proposed platform relieson big data technologies and data analysis techniques and consists of four layers: real time patientmonitoring, real time decision and data storage, patient classification and disease diagnosis, anddata retrieval and visualization. To evaluate the performance of our platform, we implemented ourplatform based on the Hadoop ecosystem and we applied the proposed algorithms over real healthdata. The obtained results show the effectiveness of our platform in terms of efficiently performingpatient classification and disease diagnosis in healthcare applications.
Keywords: healthcare applications; hadoop platform; patient classification; disease diagnosis;SK-means; association mining rules
1. Introduction
Today, the world faces an increasing number of diseases and patients. In addition, wars,pollution, food-related illness, and human–animal relationships cause the emergence and propagationof new types of diseases and viruses. Subsequently, with the emergence of an unknown disease, thegovernments face two major challenges: first, medical centers require more and more qualified staffin order to periodically monitor each patient and quickly act when an emergency state is detected.Second, the correct diagnosis of the patient’s state and the progress of his situation are critical formedical staff. Recently, the “Coronavirus” propagated in China has threatened millions of people andthe government was obliged to quickly build hospitals and increase the number of medical workers.Furthermore, integrating new technologies in healthcare has became an essential task in order tomake hospitals more efficient in terms of monitoring and analyzing patient data, thus enhancingmedical processes.
Recently, the emergence of sensing-based devices, especially wireless sensor network (WSN) andInternet of Things (IoT), and big data technologies, such as Hadoop ecosystem, lead to a new revolutionin healthcare. Basically, the sensing-based healthcare consists of a set of biomedical sensors that allows
Sensors 2020, 20, 1931; doi:10.3390/s20071931 www.mdpi.com/journal/sensors

Sensors 2020, 20, 1931 2 of 20
continuously monitoring the vital signs (e.g., heart rate, respiration rate, oxygen rate, temperature,blood pressure, etc.) of a patient and periodically transmit the collected data to a coordinator forfurther inspection. Smart technologies have opened up a world of applications in disease diagnosticand treatment such as for cancer, glucose monitoring, depression, Parkinson’s disease, connectedcontact lenses, etc. Furthermore, this has been a big motivation for healthcare organizations to heavilyinvest in big data analytics.
However, sensing-based healthcare applications are still challenging the scientific communitydue to:
• Big data collection and storage: Biosensors continuously record vital signs of patients, usuallyper second, and then they send their records toward data storage center. This type of data hasthree characteristics: (1) massive data collection; (2) high speed generation; and (3) heterogeneousnature. Unfortunately, the relational database management systems and the traditional datastorage technologies cannot handle such type and amount of data.
• Rapid emergency detection: Usually, a normal health range is defined for each vital sign. Recordsoutside this range lead to an abnormal situation which should be quickly detected and reportedto the medical staff in order to take suitable actions. Hence, rapid emergency detection is a crucialevent that can be a threat to patient safety or even life.
• Disease diagnosis and patients’ classification: In health applications, several diseases may generatesimilar symptoms. Hence, disease diagnosis is susceptible to human error which may provokedisabilities or death. Therefore, developing new techniques and algorithms in order to study,on the one hand, the correlation between symptoms and, on the other hand, classify patientsaccording to their situations can help in making the right decision.
To overcome the above challenges, we propose an efficient and robust big data analyticalplatform for real-time sensing-based healthcare applications. The proposed platform relies on big datatechnologies, specifically Hadoop ecosystems, and it uses data analytical techniques for data analysisand classification. In addition, our platform consists of four layers: real time patient monitoring, realtime decision and data storage, patient classification and disease diagnosis, and data retrieval andvisualization. We conducted a set of scenarios and simulations on real health data in order to show therelevance of our platform.
The remainder of this paper is organized as follows. Section 2 presents an overview on variousexisting systems in the literature. In Section 3, we introduce the architecture of our proposed platform.Sections 4–7 detail tools and proposed algorithms in each layer, respectively. Section 8 describes theimplementation of our platform and explains the obtained results. Finally, Section 9 concludes thepaper and gives our directions for future work.
2. Related Work
Recently, remote sensing and Hadoop ecosystem have produced efficient and low cost solutions invarious domains, especially in healthcare applications. On the one hand, sensing devices help doctorsand nurses to remotely, in-hospital or in-home, monitor patients and allow a real-time detection ofurgent situations. On the other hand, Hadoop-based tools offer an efficient and rapid data storageand processing platforms for hospitals, especially in specific scenarios such as war or global viruscontamination. Therefore, researchers have proposed various healthcare systems based on remotesensing and Hadoop dedicated to disease diagnosis, emergency detection, patient classification,etc. [1–3]. In [4,5], the authors gave an overview on different data analytical algorithms and big dataplatforms proposed in the literature for healthcare applications.
Some works in sensing-based healthcare are focused on reducing big data collection usingaggregation, compression, and prediction methods [6–12]. The authors of [6] proposed thePriority-based Compressed Data Aggregation (PCDA) technique to reduce the amount of heath datatransmitted. PCDA uses a compressed sensing approach followed by a cryptographic hash algorithm

Sensors 2020, 20, 1931 3 of 20
to save information accuracy before sending data for any diagnosis. The authors of [7] proposed a datareduction technique dedicated to wireless seizure systems. In addition to local compressive sensing,the proposed technique selects a set of features, specifically those with nonlinear autocorrelation, toreduce the seizure signals sent to the data server. In [8], a cloud-based connected healthcare system,called BigReduce, is proposed. The objective of BigReduce is to minimize the data processing cost atthe base station according to two schemes applied locally at the IoT sensors: reduction and decisionschemes. Finally, the authors of [9] proposed a fault tolerance and data recovery algorithm in orderto ensure the integrity of heath information and save the network energy. The proposed algorithmworks in a distributed manner and it maintains a set of active nodes where each one copies its data toits neighbors according to several assumptions.
Other works in sensing-based healthcare are based on Hadoop ecosystems in order to efficiencymanaging data collected in such network [13–18]. The authors of [13] proposed a storage andprocessing architecture based on MapReduce and HBase, respectively. First, data generated byhealth sensors are inserted into HBase using a mass insertion script, and then a data analysis algorithmis proposed in order to retrieve valuable data and help in predicting disease. In [14], the authorsproposed a Hadoop-based framework in order to secure the transmitted data from biosensors to theserver. The proposed framework relies on three main pillars: The Hadoop clusters for storing, backingup, and recovering data; a digital signature method, called ECC (Elliptic Curve Cryptography), whichis implemented in Sunspot nodes in order to secure communication; and the Sqoop tool, which isused to import and export data between Mysql and Hadoop HDFS. In [15], a modern platform forhealthcare information systems consisting of three layers is proposed. The first layer is composedof various data health sources such as sensors, clinical report, medication, etc. The second layeraims to process and store data and it uses various Hadoop tools including Sqoop, HDFS, HBase,MapReduce. and Hive. The last layer is responsible for applying business intelligence (BI) solutionsover the stored data and it uses SpagoBI tools as an open source BI suite. Lastly, the authors of [16]proposed a correlation-based outlier detection platform, relying on Hadoop, to handle streaming ofdata generated in health applications. The objective of the platform is to search statistical relationshipsamong biosensors, and then, in a later step, to predict contextual anomalies using an aggregatedoutlier checker.
Recently, the authors of [19–22] opened a new trend in sensing-based healthcare by proposingseveral frameworks for real-time patient monitoring and assessment. In [19], a framework for stressdetection and evaluation is proposed. The framework works by detecting first stress signals accordingto skin conductance parameter, and then the stress level is evaluated through fuzzy inference systembased on patient vital signs, particularly heart rate, respiration rate, and average blood pressure. In alater work [20], the authors proposed a data management framework for data collection and decisionmaking in sensing-based healthcare. The framework relies on three algorithms: first, an emergencydetection algorithm aims to send critical records directly to the coordinator; second, an adaptivesampling rate algorithm based on ANOVA (ANalysis of Variance) and Fisher test allows each sensorto adapt its sampling to the variation of patient situation; and third, a data fusion and decision makingmodel is proposed to the coordinator based on decision matrix and fuzzy set theory. Despite its greatadvantages for patient monitoring and assessment, the proposed framework suffers from severaldisadvantages: (1) sensors only send critical records to the coordinator, thus medical staff cannot avoidpatients entering dangerous situations before this happens; (2) in case of low critical patients, none ofthe data would be archived in the hospital, thus revising patient archives to check patient progressfrom doctors is not possible; and (3) integrating new data technologies, such as Hadoop, in order tohandle big data collected by biosensors is not considered in the proposed framework. To the bestof our knowledge, our proposed platform is still the only complete system that integrates both dataanalytics and Hadoop ecosystems. In addition, it consists of a sequence of layers aiming to tackle otherproblems related to patient classification and disease diagnosis. Finally, it combines several approachessuch as machine learning, data mining, clustering, classification, etc.

Sensors 2020, 20, 1931 4 of 20
3. Overview about the Architecture of Our Platform
In this section, we present an overview of the different tools and techniques forming thearchitecture of our platform. Mainly, our system relies on Hadoop ecosystems, which are built onclusters using parallel computing. On the one hand, the cluster architecture ensures a high scalabilityand reliability of the collected data as well as a fast and huge data storage. On the other hand, theparallel computing ensures a rapid data processing and analysis, especially when the volume of databecomes huge. Furthermore, the architecture of our platform consists of four layers, which allow anentire data analysis process for patients in hospitals, starting from patient data collection and endingwith patients’ classification and decision making. Subsequently, each layer performs batch and/orreal-time processing. In batch mode, data are first stored in cluster nodes and then processed, while, inreal-time mode, data are processed upon collection and before storing. These two processing modesprovide a high efficiency in terms of applying any desired techniques (machine learning, artificialintelligence, data mining, etc.) over the collected data.
Figure 1 presents the architecture of our platform with all layers, which are briefly introducedas follows:
• Real time patient monitoring: This layer consists of data sources and data ingestion tools. Datasources are the active biosensors which allow continuously monitoring a patient and send datain real-time toward the data storage via data ingestion tools. In addition, data sources could bean archive of patients’ records which is already built by the hospital, mostly based on relationaldatabase system, and should also be sent toward the data storage center. We use two ingestiontools, namely kafka [23] and sqoop [24], to process and store streaming of data coming fromdifferent data sources.
• Real time data decision and data storage: This layer uses Spark [25] and Hadoop HDFS (HadoopDistributed File System) [26] to process and store data, respectively. After installing it on themaster cluster node, Spark receives data coming from Kafka and applies two algorithms: the firstone allows detecting emergency situations and then taking the right action by the medical staffand the other searches for missing records before sending the final data to the HDFS for storage.Subsequently, data are stored in three Hadoop nodes according to HDFS cluster computing.
• Patient classification and disease diagnosis: This layer uses batch mode processing and aimsto classify and find the correlation after data storing. Two algorithms are proposed: The firstone uses an adapted version of Kmeans [27] clustering and aims to find patients with similarsituations. The second one uses the data mining approach to allow better understanding whendiagnosing any disease.
• Data retrieval and visualization: This layer allows medical staff to retrieve patient data from thedata storage and then to visualize them in order to analyze and understand the patient’s situation.We use two tools from the Hadoop ecosystems (Hive [28] and SparkSQL [25]) and Matplotlib [29]from Python.
BIO
SE
NS
OR
S F
OR
VIT
AL
SIG
NS
RE
LA
TIO
NA
L D
B
DA
TA
IN
GE
ST
ION
KAFKA DA
TA
PR
OC
ES
SIN
G
Emergency detection
and clinical response
Patient archiving
LAYER 2 ALGORITHMS
DA
TA
ST
OR
AG
E
Patients’ classification
Disease diagnosis
LAYER 3 ALGORITHMS
DA
TA
RE
TR
EIV
EL
& P
RE
SE
NT
AT
ION
LAYER 1: REAL TIME PATIENT MONITORING LAYER 2: REAL TIME DECISION AND DATA STORAGELAYER 3: PATIENT CLASSIFICATION
AND DISEASE DIAGNOSIS
LAYER 4: DATA RETRIEVAL
AND VISUALIZATION
Periodic collection
Figure 1. Architecture of our platform.

Sensors 2020, 20, 1931 5 of 20
4. Layer 1: Real Time Patient Monitoring
Data collection is the first step in the healthcare lifecycle. The first layer aims to collect datacoming from various data sources and sending them for a later storing. Mainly, it consists of datasources, Kafka, and Sqoop tools. In the following, we detail them.
4.1. Data Sources
In health applications, data collection is usually done through small biosensors implementedon the patient’s body in order to collect his vital signs. Subsequently, the vital signs of a patientinclude Heart Rate (HR), Systolic Blood Pressure (SBP), Respiration Rate (RR), Oxygen Saturations(OS), Body Temperature (BT), etc. Assume a set P of F patients as follows: P = [P1, P2, . . . , PF ]where each patient p ∈ P is assigned various types of biosensors to a set V of vital signs, e.g.,V = [HR, SBP, RR, OS, BT, . . . ] with T indicating the number of observed vital signs in V. For analysispurposes, we assumed that the set of biosensors Bp
V , assigned to the patient p, periodically monitor thevital signs and then send the set of collected records tR
pV at period t, where tR
pV = [r1, r2, . . . , rT ] and ri
is the collected reading of the vital sign vi ∈ V, toward the coordinator.Nowadays, saving an archive for patient vital signs during their hospitalization is a procedure in
all hospitals. Indeed, Relational Datadase (RDB) is the most preferred archiving system for almost ofthem due to its simplicity and flexibility. Hence, to make it more efficient, our platform uses Sqoop(as explained in (Section 4.3) to allow hospitals to insert their old archives into Hadoop cluster nodes.However, unlike biosensors, which operate in real-time mode, Sqoop processes patient archives inbatch mode.
4.2. Kafka
Kafka [23] is an open-source data ingestion tool used to handle massive real-time data. Today, itis used in many applications such as real-time monitoring of British gas smart home, matching driverand passenger at Uber, etc. Among other data ingestion tools, the selection of Kafka is motivated by:(1) its high horizontal scalability (up to hundreds of server nodes); (2) it can read data directly from thebiosensors; (3) it decreases latency much than other tools; and (4) it is easy to be implemented andused thanks to built-in libraries in Python.
Generally, Kafka is based on the concept of “topics” and data are stored in the form of key-values.In our platform, we installed Kafka on the master cluster node (called broker) and we create a topic,named “Col2Proc”, allowing to read streaming data from biosensors then send them to furtherprocessing (e.g., Spark tool).
4.3. Sqoop
Sqoop [24] is a command line interface application used to transfer data between relationaldatabases (RDB) and Hadoop nodes. Import and Export Sqoop are the major operations in Sqoop andused to transfer data from RDB to Hadoop and vice versa, respectively. In our platform, Sqoop is usedin allow medical administrators to directly integrate their patients’ archive, supposed to be built withRDB, into Hadoop cluster nodes without any further processing operation. This service makes ourplatform more efficient and attractive for hospitals.
5. Layer 2: Real Time Data Decision and Data Storage
In this section, we introduce the second layer used in our platform, which is responsible for dataprocessing and storing. This layer mainly relies on two tools, namely Apache Spark and HadoopHDFS system, as well as it proposes two data processing algorithms: emergency detection and clinicalresponse, and patient archiving.

Sensors 2020, 20, 1931 6 of 20
5.1. Apache Spark
Spark [25] is an open-source cluster computing platform which is widely used for data processingin Hadoop ecosystems. In our framework, Spark is selected among other existing tools due to threemajor characteristics required in sensing-based healthcare: first, it supports both batch and streamingprocessing which are necessary to apply various data analytical algorithms; second, it ensures a lowerlatency level than other tools such as MapReduce, which is strongly required in health applications;and third it guarantees scalability to any number of cluster nodes required for the health applicationrequirements. Therefore, in our platform, we implemented Spark on the master cluster node in orderto receive data streaming from Kafka, perform processing, and send data to the Hadoop HDFS forstoring purpose. Subsequently, data processing is done via two created scripts, one for the real timedecision and other for patient archiving (explained below).
5.2. Hadoop HDFS
Hadoop HDFS [26] It is a distributed file system that stores data across a set of machines, knownas cluster nodes. Hadoop HDFS splits received data into blocks, and then it distributes across thenodes. Generally, it is characterized by two aspects: First, it ensures high data reliability thanks tothe replication process of data into nodes (at least three). This aspect is very useful in sensing-basedhealthcare so patient archives will never be lost if any hardware failure occurs. Second, data in HadoopHDFS are treated in parallel computing so a high data retrieval process is ensured, which is necessaryfor heath application especially in emergency cases. In our platform, we created three cluster nodeswhile implementing Hadoop HDFS on each of them to store patient records in HDFS files.
5.3. Emergency Detection and Clinical Response Algorithm
After receiving periodic data sent from all biosensors, the coordinator should analyze them inreal time and alert the medical staff in case of a patient emergency detection. In the second layer ofour platform, we introduce an emergency detection algorithm that allows alerting in any abnormalsituation of the patient as well as it determines the appropriate response the should be taken by themedical staff. To verify abnormal situations, let us first define the Early Warning Score (EWS) guide.
EWS is a guide based on the vital signs, e.g., V, and it is used by the medical staff within a hospitalto track the criticality level of a patient. For each vital sign v ∈ V, the collected record ri ∈ tR
pV is
compared to a normal range in order to calculate a score si between 0 and 3; 0 means normal recordwhere other values indicate abnormal situations with increasing severity as the score increases. Hence,a set of record scores tS
pV = [s1, s2, . . . , sT ] is calculated for tR
pV . In Figure 2, we show one of the most
used EWS guides that is developed in UK and distributed around all the world, called National EWS(NEWS) [30].

Sensors 2020, 20, 1931 7 of 20
PHYSIOLOGICA
L PARAMETERS 3 2 1 0 1 2 3
Repiration Rate ≤ 8 9 - 11 12 - 20 21 - 24 ≥ 25
Oxygen
Saturations≤ 91 92 - 93 94 - 95 ≥ 96
Any Supplemental
OxygenYes No
Temperature ≤ 35.0 35.1 - 36.0 36.1 - 38.0 38.1 - 39.0 ≥ 39.1
Systolic BP ≤ 90 91 - 100 101 - 110 111 - 219 ≥ 220
Heart Rate ≤ 40 41 - 50 51 - 90 91- 110 111 - 130 ≥ 131
Level Of
ConscioucnessA V, P, or U
Figure 2. National Early Warning Score (NEWS) [30].
Once the score set at each period is calculated, we propose to directly analyze the collected recordsand alert, ideally using phone device, the medical staff by the appropriate response. In our platform,we are interested in the clinical responses guide proposed in [30] as one of the most used guidesaround the world. In this guide, the coordinator calculates the aggregated score of records received ateach period and then sends the corresponding response to the medical staff according to Figure 3. Forinstance, if the score set calculated during a period is tS
pV = [0, 2, 1, 2], then the aggregated score equals
5 (i.e., 0 + 2 + 1 + 2) and the coordinator sends an alert to medical staff informing that the frequency ofpatient monitoring should be increased to at least once per hour.
AGGREGATED SCOREFREQUENCY OF
MONITORINGCLINICAL RESPONSE
0 Minimum 12 hourly• Continue routine NEWS monitoring with every set of
observations
1 - 4 Minimum 4-6 hourly
• Inform registered nurse who must assess the patient
• Registered nurse to decide if increased frequency of
monitoring and/or escalation of clinical care is
required
5 or more
Or
3 in one parameter
Increased frequency to a
minimum of 1 hourly
• Registered nurse to urgently inform the medical team
caring for the patient
• Urgent assessment by a clinician with core
competencies to assess acutely ill patient
• Clinical care in an environment with monitoring
facilities
7 or moreContinuous monitoring of
vital signs
• Registered nurse to immediately inform the medical
team for the patient – this should be at least at
specialist registrar level
• Emergency assessment by a clinical team with critical
care competencies, which also includes a practitioner/s
with advanced airway skills
• Consider transfer of clinical care to a level 2 or 3 care
facility. i.e. higher dependency or ITU.
Figure 3. NEWS Clinical Response (NEWS-CR) [30].
Algorithm 1 describes the emergency detection and clinical response process, which is applied atthe coordinator level. The algorithm takes as input the vector of records collected by all biosensorsduring a period time t. Then, it calculates the score for each record followed by the aggregate score(Lines 2–5). Finally, the coordinator sends an alert to the medical team indicating the clinical responsethat should be taken according to the situation of the patient (Lines 6 and 7).

Sensors 2020, 20, 1931 8 of 20
Algorithm 1 Emergency detection and clinical response algorithm.
Require: A patient: p, Set of biosensors: BpV , A period time: t, Records collected during t: tR
pV =
[r1, r2, . . . , rT ].Ensure: A clinical response.
1: AggScore = 02: for each record ri ∈ tR
pV do
3: calculate score si of ri according to EWS4: AggScore += si5: end for6: find the corresponding clinical response from NEWS-CR according to AggScore7: send an alert containing the clinical response to the medical team
5.4. Patient Archiving Algorithm
Patient data archiving is a key operation in hospitals. On the one hand, it allows medical staff tonotice the progress of patient situation over time and, on the other hand, it helps professionals to betterunderstand diseases and improve the healthcare quality. Indeed, data collected by the biosensors arevulnerable to loss before reaching the coordinator due to several reasons: (1) a long distance; (2) thecongestion due to the overloaded network in the case of dense biosensors deployment; (3) obstacles;and (4) a failure in the biosensor itself. In such cases, the medical team cannot make the right decisionabout the patient situation or store missing records for a later analysis. Thus, to overcome missingrecords, a preprocessing of data should be made before any decision or storage process.
In our platform, we benefit from the Python open source libraries which offer a huge number offunctions allowing to preprocess the data before any analysis. Some of the most useful libraries dealingwith missing values in Python include Pandas, NumPy, and Scikit-Learn. Subsequently, the missingvalues can be estimated using functions such as replace, isnull, dropna, fillna, and fit_transform, orusing prediction functions such as interpolate. In our simulation, we created a script for Spark calledMissRec that allows estimating the missing records during a period of time while focusing on twomain functions: ExponentialSmoothing and nanmean. After estimating the missing records, the Sparkscript sends the regenerated records to the HDFS for storage.
6. Layer 3: Patient Classification and Disease Diagnosis
After data storage, the process of data analysis is started to better understand the diseases and tryto minimize their future effects. The first step of data analysis is to classify patients into clusters wherepatients in the same cluster have common characteristics (symptoms and situations). The second stepis the study of the correlation between vital signs of patients at the same cluster. This can help medicaldata analytics to understand disease causes and behaviors, and thus avoid false disease diagnosis andfind suitable treatments. In this layer, our objective is to propose two data analysis algorithms, onefor the patient classification and the other for the disease diagnosis. It is important to notice that bothalgorithms are implemented on batch processing mode on the Spark cluster node.
6.1. Patient Classification Algorithm
Data classification is a well-known approach for most domains. One can find a huge numberof data classification algorithms such as K-nearest neighbors, naïve Bayes, decision tree, etc. [31].However, Kmeans clustering is still the most used classification algorithm because it can be efficientlyadapted to a huge number of applications. Unfortunately, Kmeans has a significant negative impactin data latency, especially in applications that produce big amount of data such as sensing-basedhealthcare. To overcome this problem, we propose a new version of Kmeans, called SKmeans(Stability-based Kmeans), which is strictly dedicated to sensing-based healthcare applications.
To classify similar patients’ situations using SKmeans, we first determine the stability level of eachpatient during his journey in the hospital (according to his archive), and then we assign the patient

Sensors 2020, 20, 1931 9 of 20
to its nearest group of patients’ stability. Derived from tRpV , we define the subset s
t Rpv , which only
contains the records of the vital sign v ∈ V with a score s in tRpV , where s ∈ [0, 3]. Accordingly, s
t Spv is
the subset with scores s of tSpV for the set of records tR
pV . Thus, tR
pv = ∪3
i=0itR
pv while tS
pv = ∪3
i=0itS
pv .
Let |X| be the norm zero, i.e., the number of non-zero elements in a set X. For the sake of simplicity, letus assume a portion of records collected for two patients p and q during a period t where two recordvectors tR
pv and tR
qv are stored, respectively, for p and q. Then, the stability level, noted as stab, of the
vital sign v of the two patients can be calculated as the overlap between the number of similar records(having the same scores) in tR
pv and tR
qv, as shown in the following equation:
stab(tRpv , tR
qv) =
∑3k=0 min(|kt Rp
v |, |kt Rqv|)
min(|tRpv |, |tR
qv|)
× 100 (1)
where |kt Rpv |means the number of records with score k in tR
pv . Therefore, stab ranges between 0 and 100,
where 0 means that both patients have similar stable situation and 100 indicates a severely unstablesituation for both patients.
Basically, SKmeans allows patients with similar situation progress to be grouped together inorder to find patient correlation and understand the behavior of certain diseases. In our platform,patients can be classified according to one or all vital signs depending on the medical needs. For thesake of simplicity, we describe, in the next section, the process of SKmeans based on one patient’svital signs v ∈ V but similar process can be adapted to all other vital signs. Similar to traditionalKmeans, the idea of SKmeans is to first define a positive number of clusters (K) and then a set of Kdatasets is randomly selected as the initial centroids of the clusters. After that, for each dataset, thedistances to all centroids are calculated where the dataset is assigned to the nearest one. At this point,the new centroid is recomputed for each cluster and the process is repeated until the convergence ofthe algorithm. Obviously, the optimal number of clusters (K) can be selected depending on the numberof patients in the hospital and their situations. However, compared to traditional Kmeans, SKmeanshas two main differences:
• First, patients are grouped according to the scores of records and not the records themselves.• Second, in each iteration, a patient is assigned to the nearest centroid based on the stability level
calculated using Equation (1) and not the Euclidean distance over the whole record vectors as inthe traditional Kmeans. This leads to a huge reduction of the cost of calculation.
Algorithm 2 describes our SKmeans adapted to the stability level in order to classify patientsaccording to a vital sign situation. First, it computes the score vector of a record vector for a patient(Lines 1–5). Then, it randomly selects a set of K score vectors as the initial centroids of the clusters(Lines 6–8). For every iteration, it computes the stability between each vector score and all clustercentroids and assigns the patient to the nearest stable centroid (Lines 10–17). Finally, the algorithmcalculates the new cluster centroids and iterates until there are no longer changes in the clustermemberships.

Sensors 2020, 20, 1931 10 of 20
Algorithm 2 SKmeans algorithm.
Require: A set of patients: P = [P1, P2, . . . , Pγ], A stored at period t, A vital sign: v ∈ V, Set of storedrecords: tRv = [tR
1v, tR
2v, . . . , tR
Fv ], Cluster number: K.
Ensure: Set of patient clusters: C = {C1, C2, . . . , CK}.1: tSv ← ∅ // ∅ is an empty set2: for i = 1 to γ do3: calculate tS
iv
4: tSv ← tSv ∪ {tSiv}
5: end for6: for i = 1 to K do7: randomly choose centroid ci among tSv belongs to Cj
8: end for9: C ← ∅
10: repeat11: for each set of scores tS
iv ∈ tSv do
12: // calculate the stability between tSiv and all centroids
13: for k = 1 to K do14: stk = stab (tS
iv, ck)
15: end for16: Assign tS
iv to the cluster Ck with nearest centroid ck (i.e., |stk − cj∗| ≤ |stk − cj|; j ∈ {1, . . . , K})
17: end for18: Update the centroids of all clusters19: until no more changes in the cluster memberships20: return C
6.2. Disease Diagnosis Algorithm
Getting the correct diagnosis is a key for the patient. Otherwise, the consequences of misdiagnosisare most devastating, which may cause obstruction, getting incorrect medications, or even death.Hence, disease diagnosis takes, day after day, an increasing attention from both clinicians andresearchers. Indeed, finding a correlation between the variation of vital signs of the same patient isone of the most efficient ways to make a right diagnosis. The idea behind such approach is to linkbetween the variation of vital signs and the symptoms appeared on the patient, thus the mission ofdetermining the disease becomes easy for the clinicians. More formally, if two or more vital signsare strongly correlated for a huge number of patients while the same symptoms have appeared onsuch patients, then the accuracy of disease diagnosis is increased. In this section, a disease diagnosistechnique based on a modified version of association rule mining algorithm is proposed, which isapplied at each cluster after patient classification.
As in the traditional algorithm, our adapted version of association rule mining algorithm consistsof a two-step process: find frequent scores and generate strong association. However, our versionis more dedicated to sensing-based healthcare and takes into account the record sores when findingcorrelation among vital signs. Assume a cluster contains θ patients, where θ < γ, with theircorresponding stored record vectors tSv = [tS
1v, tS
2v, . . . , tS
γv ]. Then, we describe both steps used
in our algorithm as follows:
• Find frequent scores: This step aims to find the most repetitive scores of each vital sign of a patientto meet a certain threshold. We called the threshold as minimum score strength, expressed asµ, which takes a value between 0 and 100. Then, we calculate the strength, str, of each scorest Sp
v ∈ Spv , where s ∈ [0, 3], of a vital sign according to the following equation:
Sensors 2020, 20, 1931 11 of 20
str(st Sp
v ) =|st Sp
v ||tS
pv |× 100 (2)
where s ∈ [0, 3]. Therefore, if str(st Sp
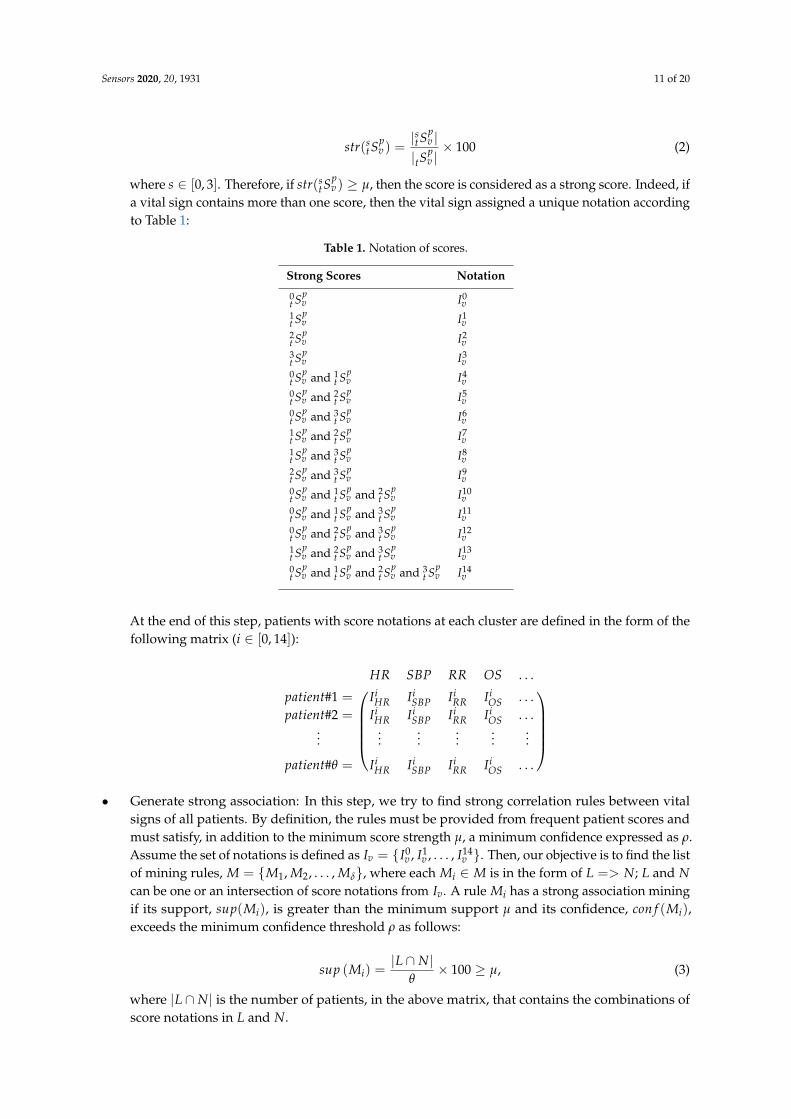
v ) ≥ µ, then the score is considered as a strong score. Indeed, ifa vital sign contains more than one score, then the vital sign assigned a unique notation accordingto Table 1:
Table 1. Notation of scores.
Strong Scores Notation
0t Sp
v I0v
1t Sp
v I1v
2t Sp
v I2v
3t Sp
v I3v
0t Sp
v and 1t Sp
v I4v
0t Sp
v and 2t Sp
v I5v
0t Sp
v and 3t Sp
v I6v
1t Sp
v and 2t Sp
v I7v
1t Sp
v and 3t Sp
v I8v
2t Sp
v and 3t Sp
v I9v
0t Sp
v and 1t Sp
v and 2t Sp
v I10v
0t Sp
v and 1t Sp
v and 3t Sp
v I11v
0t Sp
v and 2t Sp
v and 3t Sp
v I12v
1t Sp
v and 2t Sp
v and 3t Sp
v I13v
0t Sp
v and 1t Sp
v and 2t Sp
v and 3t Sp
v I14v
At the end of this step, patients with score notations at each cluster are defined in the form of thefollowing matrix (i ∈ [0, 14]):
HR SBP RR OS . . .
patient#1 = IiHR Ii
SBP IiRR Ii
OS . . .patient#2 = Ii
HR IiSBP Ii
RR IiOS . . .
......
......
......
patient#θ = IiHR Ii
SBP IiRR Ii
OS . . .
• Generate strong association: In this step, we try to find strong correlation rules between vitalsigns of all patients. By definition, the rules must be provided from frequent patient scores andmust satisfy, in addition to the minimum score strength µ, a minimum confidence expressed as ρ.Assume the set of notations is defined as Iv = {I0
v , I1v , . . . , I14
v }. Then, our objective is to find the listof mining rules, M = {M1, M2, . . . , Mδ}, where each Mi ∈ M is in the form of L => N; L and Ncan be one or an intersection of score notations from Iv. A rule Mi has a strong association miningif its support, sup(Mi), is greater than the minimum support µ and its confidence, con f (Mi),exceeds the minimum confidence threshold ρ as follows:
sup (Mi) =|L ∩ N|
θ× 100 ≥ µ, (3)
where |L ∩ N| is the number of patients, in the above matrix, that contains the combinations ofscore notations in L and N.

Sensors 2020, 20, 1931 12 of 20
con f (Mi) =|N||L| × 100 ≥ ρ, (4)
Algorithm 3 describes the process of finding the set of strong association rules among Iv. Theprocess starts by searching all the possible combinations of notations from Iv, and then finding the listof all association rules (Lines 1–4). After that, we calculate the support and confidence for each ruleand a rule is added to the list of strong rules only if its support and confidence are greater than thedefined thresholds µ and ρ, respectively (Lines 5–11). Indeed, the obtained rules will allow cliniciansto find the correlation between the variation of vital signs of patients. Consequently, in addition tothe symptoms appearing in the corresponding patients, they can have a better understanding about adisease and its diagnosis while giving the right patient medication.
Algorithm 3 Association mining rules algorithm.
Require: Set of notations: Iv = {I0v , I1
v , . . . , I14v }, Minimum score strength: µ, Minimum confidence
threshold: ρ.Ensure: Set of strong mining association rules: M.
1: find all combinations of notations, T, from Iv
2: T ← {Iiv, where i ∈ [0, 14]} ∪ {Ii
v ∩ I jv, where i, j ∈ [0, 14] and i 6= j} ∪ · · · ∪ Iv
3: find all combinations of mining rules, U4: U = {L => N, where L and N ∈ T}5: M← ∅6: for each rule Ui ∈ U do7: calculate sup (Ui) and con f (Ui)8: if sup (Ui) ≥ µ and con f (Ui) ≥ ρ then9: M← M ∪ {Ui}
10: end if11: end for12: return M
7. Layer 4: Data Retrieval and Visualization
The last layer of our platform is dedicated to allow medical staff access to the patient recordsstored in the Hadoop HDFS. It relies on two data retrieval tools (Hive and Spark SQL) and onegraphing tool (Matplotlib). On the one hand, data retrieval tools are responsible for obtaining datafrom the Hadoop storage system using a set of criteria defining via queries. The retrieved data aremostly stored in a file or displayed on the screen. On the other hand, data visualization is simply agraphical representation of the retrieved data using statistical graphics or plots. In the next sections,we highlight each tool used in our platform.
7.1. Hive
Hive [28] is software used for data warehousing implemented on top of Hadoop HDFS in orderto provide data query and analysis. In addition, Hive allows creating a metadata storage in the formof tables in a relational database system. This makes our platform more efficient in terms of reducingthe access time to the patient archive. On the other hand, it helps the medical staff to keep track of thecriticality of patients in real-time. In our platform, we installed Hive on the cluster master node andwe created an external table located in the HDFS main directory, where the medical staff can explorethe data imported to HDFS using HiveQL console. To retrieve the data, they have to write HiveQLqueries depending on their requirements. For instance, they can ask for all patient IDs having criticalHR records as follows:
SELECT patient_id FROM Patient WHERE record < 51 or record > 90
Sensors 2020, 20, 1931 13 of 20
7.2. Spark SQL
Spark SOL [25] is a component that can be installed on top of Spark core and aims to provide adata abstraction called DataFrames to handle structured database. DataFrames is usually handledusing a specific language named domain-specific language (DSL) [25], which is manipulated usingPython in our platform. After installing it on the master node, the medical staff can run the Spark SQLconsole using the command spark-sql to access the patient data on Hadoop storage. Then, they have touse HiveQL syntax, which is supported by Spark SQL to make various queries.
7.3. Matplotlib
Matplotlib [29] is the most used plotting library in Python programming with its extensionNumPy. In our platform, we created a Python script that allows reading periodic patient data sentto Hadoop storage and visualizing them, using Matplotlib, on a real-time graph to the medical staff.An important extension which can be added later to our platform is to send plotting graphs to theclinicians using mobile application, so that they can monitor the patient situation far from the hospital.
8. System Demonstration and Evaluation
To evaluate its performance, we developed our platform based on two phases: Hadoop installationand algorithms’ implementation. On the one hand, we installed Hadoop 3.0.1 on a physical machinewith an i7 processor, 8 CPUs 2.70 GHz, and 16 GB of memory. Then, we created a four-node Hadoopcluster on four virtual machines with Ubuntu 18.04 as an operating system. In addition, a virtualmachine was configured to act as the master node and the three other machines were configured toact as slave nodes. We installed all layer tools (ingestion, processing, and visualization) on the masternode while the slave nodes were responsible for storing patient data. On the other hand, we usedreal health data collected from MultipleIntelligent Monitoring in Intensive Care (MIMIC) database ofPhysioNet [32]. MIMIC contains data for about 72 patients where records about vital signs includeHeart Rate (HR), Systolic Blood Pressure (SBP), Respiration Rate (RR), and Oxygen Saturation (OS).Every second, the biosensor collects new reading for each vital sign, and then it sends toward theHadoop cluster for processing and archiving purposes. In our simulation, we used a file that includesa log of about 100,000 readings for each patient. To make our simulation more realistic, patient recordsare stored separately in a file in the main directory of the master node. Then, we created Java andPython scripts that allow reading data for each patient while applying one of the proposed algorithms.
Table 2 summarizes the parameters used in our platform with their tested values.
Table 2. Simulation environment.
Parameter Symbol Values
number of patients F 72number of features T [HR, SBP, RR, OS]number of clusters K 2, 3, 4, 5, 6
minimum score strength µ 30%, 40%, 50%minimum score confidence ρ 50%, 60%, 70%
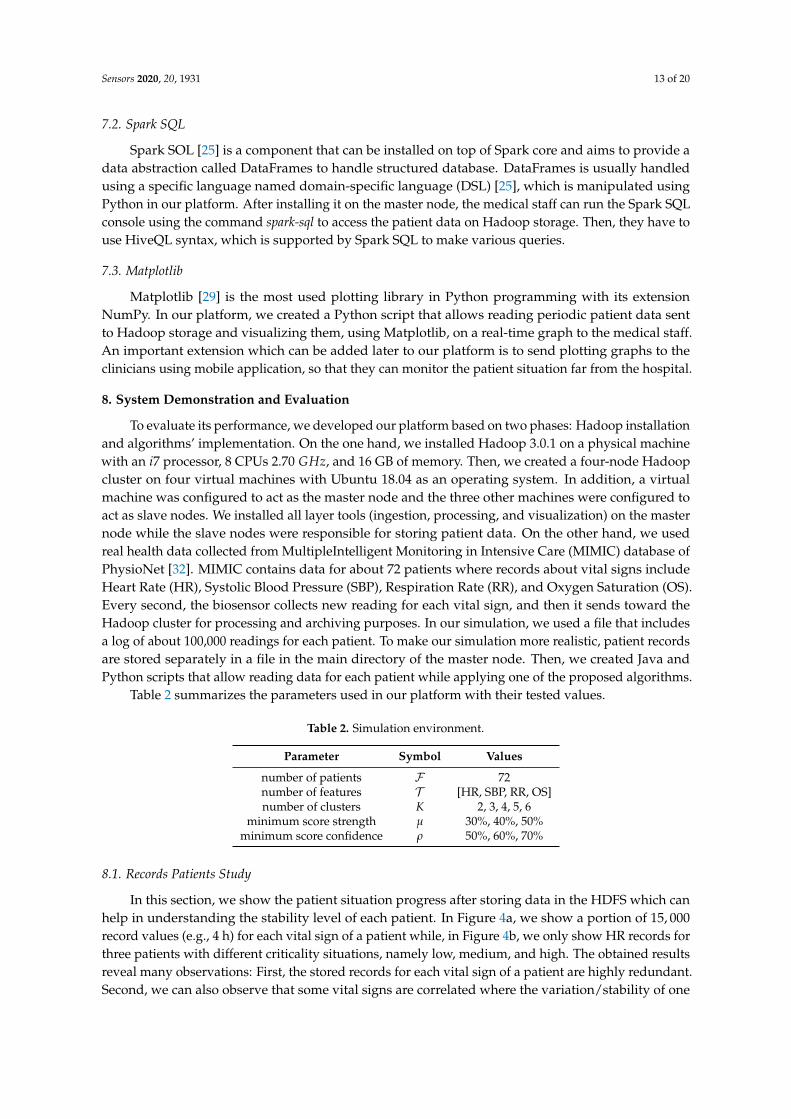
8.1. Records Patients Study
In this section, we show the patient situation progress after storing data in the HDFS which canhelp in understanding the stability level of each patient. In Figure 4a, we show a portion of 15, 000record values (e.g., 4 h) for each vital sign of a patient while, in Figure 4b, we only show HR records forthree patients with different criticality situations, namely low, medium, and high. The obtained resultsreveal many observations: First, the stored records for each vital sign of a patient are highly redundant.Second, we can also observe that some vital signs are correlated where the variation/stability of one
Sensors 2020, 20, 1931 14 of 20
can influence the others (Figure 4a). Third, we notice that low and high criticality patient situationsproduce more data redundancy than a patient with medium situation (Figure 4b).
HR SBP RR OS
0
20
40
60
80
100
120
140
reco
rd v
alue
0 3,000 6,000 9,000 12,000 15,000record number
(a) One patient with various vital signs
Low Medium High
70
80
90
100
110
120
130
140
150
160
HR
rec
ord
valu
e
0 3,000 6,000 9,000 12,000 15,000record number
(b) Three patients with the same vital sign (HR)
Figure 4. Variation of raw record data during 4 h of patient monitoring.
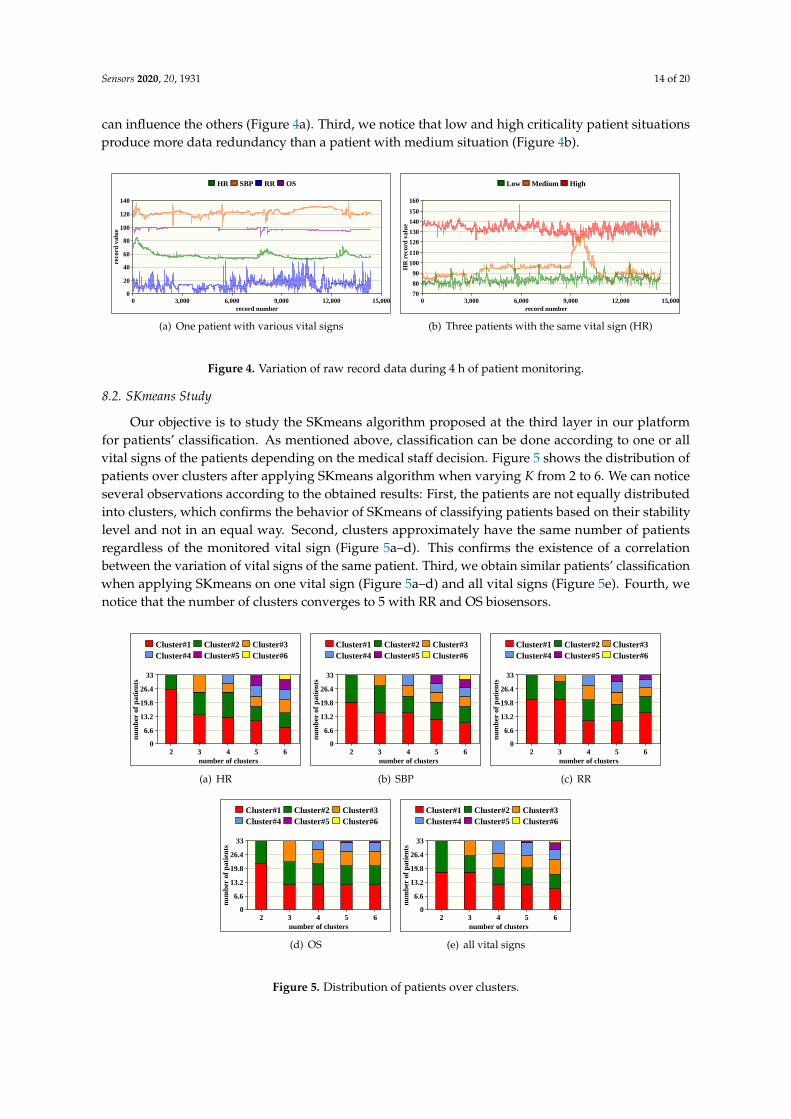
8.2. SKmeans Study
Our objective is to study the SKmeans algorithm proposed at the third layer in our platformfor patients’ classification. As mentioned above, classification can be done according to one or allvital signs of the patients depending on the medical staff decision. Figure 5 shows the distribution ofpatients over clusters after applying SKmeans algorithm when varying K from 2 to 6. We can noticeseveral observations according to the obtained results: First, the patients are not equally distributedinto clusters, which confirms the behavior of SKmeans of classifying patients based on their stabilitylevel and not in an equal way. Second, clusters approximately have the same number of patientsregardless of the monitored vital sign (Figure 5a–d). This confirms the existence of a correlationbetween the variation of vital signs of the same patient. Third, we obtain similar patients’ classificationwhen applying SKmeans on one vital sign (Figure 5a–d) and all vital signs (Figure 5e). Fourth, wenotice that the number of clusters converges to 5 with RR and OS biosensors.
Cluster#1 Cluster#2 Cluster#3Cluster#4 Cluster#5 Cluster#6
0
6.6
13.2
19.8
26.4
33
num
ber
of p
atie
nts
2 3 4 5 6number of clusters
(a) HR
Cluster#1 Cluster#2 Cluster#3Cluster#4 Cluster#5 Cluster#6
0
6.6
13.2
19.8
26.4
33
num
ber
of p
atie
nts
2 3 4 5 6number of clusters
(b) SBP
Cluster#1 Cluster#2 Cluster#3Cluster#4 Cluster#5 Cluster#6
0
6.6
13.2
19.8
26.4
33
num
ber
of p
atie
nts
2 3 4 5 6number of clusters
(c) RR
Cluster#1 Cluster#2 Cluster#3Cluster#4 Cluster#5 Cluster#6
0
6.6
13.2
19.8
26.4
33
num
ber
of p
atie
nts
2 3 4 5 6number of clusters
(d) OS
Cluster#1 Cluster#2 Cluster#3Cluster#4 Cluster#5 Cluster#6
0
6.6
13.2
19.8
26.4
33
num
ber
of p
atie
nts
2 3 4 5 6number of clusters
(e) all vital signs
Figure 5. Distribution of patients over clusters.

Sensors 2020, 20, 1931 15 of 20
According to Figure 5, Figure 6 shows a distribution map for the patient IDs classification overthe clusters after applying SKmeans. The objective of this figure is to verify if patients with similarstability are always assigned to the same cluster for various vital signs or not. The number of clustersis fixed to 4. As expected, the obtained results show a significant correlation between vital signs wherepatients with same records’ variation are grouped together. Therefore, we consider SKmeans as anefficient clustering algorithm for sensing-based healthcare application in terms of classifying patientsaccording to their stability level and their situation progress.
0
5
10
15
20
25
30
35
num
ber
of p
atie
nt
Cluster#1 Cluster#2 Cluster#3 Cluster#4
(a) HR
0
5
10
15
20
25
30
35
num
ber
of p
atie
nt
Cluster#1 Cluster#2 Cluster#3 Cluster#4
(b) SBP
0
5
10
15
20
25
30
35
num
ber
of p
atie
nt
Cluster#1 Cluster#2 Cluster#3 Cluster#4
(c) RR
0
5
10
15
20
25
30
35
num
ber
of p
atie
nt
Cluster#1 Cluster#2 Cluster#3 Cluster#4
(d) OS
0
5
10
15
20
25
30
35
num
ber
of p
atie
nt
Cluster#1 Cluster#2 Cluster#3 Cluster#4
(e) all vital signs
Figure 6. Illustrative example for distribution of patients’ IDs over clusters.
8.3. Iteration Number Study
In Figure 7, we show the iteration number required by SKmeans to find the final clusters ofpatients, compared to those obtained with traditional Kmeans. Indeed, this factor becomes importantto study in sensing-based healthcare since it affects the latency of decision making which is a criticalfactor in the study of emergency situations. The iteration number is mostly related to initial centroidswhich are randomly selected in both SKmeans and Kmeans. The obtained results show that SKmeansoutperforms Kmeans in terms of minimizing the number of iterations with all vital sign conditions.Subsequently, the number of iterations in SKmeans varies from 2, in the worst case, to 9, in the bestcase, and from 8 to 14 using Kmeans. Therefore, SKmeans ensures a fast computation process to themedical staff.

Sensors 2020, 20, 1931 16 of 20
SKmeans,HR
SKmeans,SBP
SKmeans,RR
SKmeans,OS
SKmeans,All vitalsigns
Kmeans, HR Kmeans,SBP
Kmeans, RR Kmeans, OS Kmeans, Allvital signs
0
2.8
5.6
8.4
11.2
14
num
ber
of lo
ops
2 3 4 5 6number of clusters
Figure 7. Number of iterations when applying SKmeans and traditional Kmeans.
8.4. Processing Speed Study
Figure 8 shows the processing speed, or the execution time, required to apply SKmeans andKmeans algorithms for the various vital signs. Mostly, the processing speed is an indicator to therobustness of any system. In our platform, the processing speed is highly dependent on the iterationnumbers shown in Figure 7; the greater is the iteration number, the longer is the processing timerequired and the lower is the robustness. Since SKmeans algorithm highly reduces the numberof iterations, it simultaneously reduces the execution time compared to the traditional Kmeans.Subsequently, SKmeans can optimize the processing time speed up to three times compared to Kmeans.
SKmeans,HR
SKmeans,SBP
SKmeans,RR
SKmeans,OS
SKmeans,All vitalsigns
Kmeans, HR Kmeans,SBP
Kmeans, RR Kmeans, OS Kmeans, Allvital signs
0200400600800
1,0001,2001,400
exec
utio
n ti
me
(ms)
2 3 4 5 6number of clusters
Figure 8. Execution time when applying SKmeans and Kmeans.
8.5. Clustering Accuracy Study
Clustering accuracy is one of the most important metric in order to evaluate the performance ofthe formed final clusters. Indeed, one can find various coefficients that is proposed in the literatureto evaluate the clustering. In this paper, we select the Silhouette coefficient [33] as one of the mostpopular metrics to evaluate the accuracy of SKmeans and Kmeans algorithms. By definition, theSilhouette coefficient score ranges between −1 (which indicates a low clustering accuracy) and +1(which indicates a high clustering accuracy) while 0 indicates nested clusters. Generally, the Silhouettecoefficient is a composite index that indicates the cohesion and separation of the clusters and can applyseveral distance measures. In this work, the Silhouette coefficient is adapted to the Euclidean distancethat is calculated as follows:
S =Ei(tR
pV)− Ej(tR
pV)
max(Ei(tRpV), Ej(tR
pV))
(5)
where Ei(tRpV) is the mean Euclidean distance of the record set tR
pV to other record sets within the
same cluster and Ej(tRpV) is the mean Euclidean of record set tR
pV to record sets in the other clusters.

Sensors 2020, 20, 1931 17 of 20
SKmeans Kmeans
0
0.06
0.12
0.18
0.24
0.3
Silh
ouet
te c
oeff
icie
nt2 3 4 5 6
number of clusters
Figure 9. Clustering accuracy of SKmeans and Kmeans.
Figure 9 shows the Silhouette coefficient of the heart rate vital sign when varying the number ofclusters K from 2 to 6. The obtained results show that both algorithms (SKmeans and Kmeans) giveimportant results regarding the clustering accuracy for various number of clusters. Subsequently, theclustering accuracy obtained with SKmeans varies between 0.09 and 0.18 while it varies between 0.07and 0.3 using Kmeans. We can also observe that the clustering accuracy decreases with the increasingof the number of clusters.
8.6. Vital Signs and Disease Diagnosis Study
Figure 10 shows the number of mining rules generated after applying association rule algorithmadapted to sensing-based healthcare. Indeed, these rules allow finding correlations between vital signsand thus help the medical staff to understand the disease behavior. The obtained results depend on theminimum support threshold (µ) and the minimum confidence threshold (ρ). As shown, our algorithmallows generating many rules—between 21 and 232—for various values of µ and ρ. Subsequently, wealso observe that the number of rules decreases when increasing µ or ρ values; however, this makesthe rules stronger and more accurate.
0
50
100
150
200
250
num
ber
of r
ules
50 60 70
Figure 10. Variation of number of rules as a function of µ and ρ.
8.7. Further Discussions
In this section, we give further consideration to the proposed SKmeans algorithm by discussingand analyzing its performance, regarding several metrics, under various conditions and circumstancesof the application.
From the processing speed point of view, SKmeans can highly reduce the execution time requiredfor the clustering process compared to the traditional Kmeans. This is due to two reasons: first, thefewer iterations required for the convergence of the SKmeans algorithm (see results on Figure 7), and,second, SKmeans assigns the patients into clusters according to their criticality level, that is calculatedonce during all iterations, which reduces the processing time overhead of the clustering (see results

Sensors 2020, 20, 1931 18 of 20
in Figure 8). Therefore, SKmeans can ensure a fast patient clustering technique, which is required inhealthcare applications, especially in emergency cases.
From the accuracy point of view, both SKmeans and traditional Kmeans ensure an acceptable levelof clustering accuracy for the healthcare applications. However, the random selection of the clustercentroids considered in both SKmeans and Kmeans should be optimized to increase their performance.Furthermore, in the healthcare cases where most of the patients have stable situations, SKmeans canensure an accurate data clustering; otherwise, the obtained clustering accuracy decreases.
9. Conclusions and Future Work
The investment in sensing-based healthcare applications continues to rise in this decade as thepublic health attracts more attention day by day from governments and industries. In this paper,we propose an efficient and robust big data analytics platform for real-time patient monitoring andassessment. The architecture of our platform is mainly based on Hadoop ecosystems and it consists offour layers: real time patient monitoring, real time decision and data storage, patient classification anddisease diagnosis, and data retrieval and visualization. In addition, our platform includes various dataanalytical algorithms for each layer in order to make patient classification and help to find correlationsbetween variable of vital signs and diseases. We demonstrated the relevance of our platform based onreal heath data according to several parameters.
As future work, we have three main directions to enhance our platform. First, we plan to testour platform in real-case scenarios in order to validate its performance. Second, we seek to adaptour platform to take into account various types of patient data such as images for organs, video foroperations, etc. Finally, we plan to develop a mobile application in order to help clinicians closely andremotely monitor critical patients.
Author Contributions: Conceptualization, H.H. and H.M.; methodology, E.M.C.; software, H.H.; validation,A.M. and A.N.; formal analysis, A.M.; investigation, H.M.; resources, H.H.; data curation, H.H.; writing–originaldraft preparation, H.H.; writing–review and editing, A.M.; visualization, A.N.; supervision, A.M.; projectadministration, E.M.C.; funding acquisition, H.M. All authors have read and agreed to the published version ofthe manuscript.
Funding: This research received no external funding and the APC was funded by the University of Nantes.
Conflicts of Interest: The authors declare no conflict of interest.
References
1. Giorgi, G. A combined approach for real-time data compression in wireless body sensor networks. IEEESens. J. 2017, 17, 6129–6135. [CrossRef]
2. Vitabile, S.; Marks, M.; Stojanovic, D.; Pllana, S.; Molina, J.M.; Krzyszton, M.; Sikora, A.;Jarynowski, A.; Hosseinpour, F.; Jakobik, A. Medical Data Processing and Analysis for Remote Healthand Activities Monitoring. High-Performance Modelling and Simulation for Big Data Applications; Kołodziej, J.,González-Vélez, H., Eds.; Springer: Basel, Switzerland, 2019; Volume 11400; pp. 186–220.
3. Boudargham, N.; Abdo, J.B.; Demerjian, J.; Guyeux, C.; Atechian, T. Efficient cluster-based routing algorithmfor body sensor networks. In Proceedings of the 2018 IEEE Middle East and North Africa CommunicationsConference (MENACOMM), Jounieh, Lebanon, 18–20 April 2018; pp. 1–6.
4. Syed, L.; Jabeen, S.; Manimala, S.; Elsayed, H.A. Data Science Algorithms and Techniques for SmartHealthcare Using IoT and Big Data Analytics. Smart Techniques for a Smarter Planet, Kołodziej, J.,González-Vélez, H., Eds.; Springer: Basel, Switzerland, 2019; Volume 11400; pp. 211–241.
5. Mohammadi, M.; Al-Fuqaha, A.; Sorour, S.; Guizani, M. Deep learning for IoT big data and streaminganalytics: A survey. IEEE Commun. Surv. Tutor. 2018, 2923–2960. [CrossRef]
6. Soufiene, B.O.; Bahattab, A.A.; Trad, A.; Youssef, H. Lightweight and confidential data aggregation inhealthcare wireless sensor networks. Trans. Emerg. Telecommun. Technol. 2016, 27, 576–588. [CrossRef]
7. Chiang, J.; Ward, R. Energy-efficient data reduction techniques for wireless seizure detection systems. Sensors2014, 14, 2036–2051. [CrossRef] [PubMed]

Sensors 2020, 20, 1931 19 of 20
8. Wang, T.; Bhuiyan, M.Z.A.; Wang, G.; Rahman, M.A.; Wu, J.; Cao, J. Big data reduction for a smart city’scritical infrastructural health monitoring. IEEE Commun. Mag. 2018, 56, 128–133. [CrossRef]
9. Bahi, J.; Elghazel, W.; Guyeux, C.; Haddad, M.; Hakem, M.; Medjaher, K.; Zerhouni, N. Resiliency indistributed sensor networks for prognostics and health management of the monitoring targets. Comput. J.2016, 59, 275–284. [CrossRef]
10. Begum, S.; Barua, S.; Ahmed, M. Physiological sensor signals classification for healthcare using sensor datafusion and case-based reasoning. Sensors 2014, 14, 11770–11785. [CrossRef] [PubMed]
11. Martínez Chávez, S.M.; Rivero-Angeles, M.E.; Garay-Jiménez, L.I.; Romero Ibarra, I.C. Priority Schemes forLife Extension and Data Delivery in Body Area Wireless Sensor Networks with Cognitive Radio Capabilities.Wirel. Commun. Mob. Comput. 2019, 2019, 22. [CrossRef]
12. Ward, R. Energy-efficient data reduction techniques for EEG wireless body sensor networks. In Proceedingsof the Qatar Foundation Annual Research Forum, Doha, Qatar, 24–25 November 2013.
13. Khourdifi, Y.; Bahaj, M. Hadoop and MapReduce technology as a solution for Wireless Body Area Networksin e-Health. In Proceedings of the 2nd International Conference on Computing and Wireless CommunicationSystems, New York, NY, USA, 14–16 November 2017; pp. 17–22.
14. Chen, H.; Fu, Z. Hadoop-based healthcare information system design and wireless security communicationimplementation. Mob. Inf. Syst. 2015, 2015, 9. [CrossRef]
15. Raja, P.V.; Sivasankar, E. Modern framework for distributed healthcare data analytics based on Hadoop. InInformation and Communication Technology-EurAsia Conference; Linawati, M.M.S., Neuhold, E.J., Tjoa, A.M.,You, I., Eds.; Springer: Berlin/Heidelberg, Germany, 2014; Volume 8407; pp. 348–355.
16. Saneja, B.; Rani, R. A scalable correlation-based approach for outlier detection in wireless body sensornetworks. Int. J. Commun. Syst. 2019, 32, e3918. [CrossRef]
17. Benhlima, L.; El aboudi, N. Big data management for healthcare systems: Architecture, requirements, andimplementation. Adv. Bioinform. 2018, 2018, 1–6.
18. Din, S.; Paul, A. Smart health monitoring and management system: Toward autonomous wearable sensingfor internet of things using big data analytics. Future Gener. Comput. Syst. 2019, 91, 611–619. [CrossRef]
19. Koussaifi, M.; Habib, C.; Makhoul, A. Real-time stress evaluation using wireless body sensor networks. InProceedings of the IEEE 2018 Wireless Days (WD), Dubai, United Arab Emirates, 3–5 April 2018.
20. Habib, C.; Makhoul, A.; Darazi, R.; Salim, C. Self-adaptive data collection and fusion for health monitoringbased on body sensor networks. IEEE Trans. Ind. Inform. 2016, 12, 2342–2352. [CrossRef]
21. Habib, C.; Makhoul, A.; Darazi, R.; Couturier, R. Real-time sampling rate adaptation based on continuousrisk level evaluation in wireless body sensor networks. In Proceedings of the IEEE 13th InternationalConference on Wireless and Mobile Computing, Networking and Communications (WiMob), Rome, Italy,9–11 October 2017; pp. 1–8.
22. Habib, C.; Makhoul, A.; Darazi, R.; Couturier, R.l. Health risk assessment and decision-making for patientmonitoring and decision-support using wireless body sensor networks. Inf. Fusion 2019, 47, 10–22. [CrossRef]
23. Apache Software Foundation. 2011. Available online: https://kafka.apache.org (accessed on 1 October 2019).24. Apache Software Foundation. 2009. Available online: http://sqoop.apache.org (accessed on 2 October 2019).25. Apache Spark. 2014. Available online: https://spark.apache.org (accessed on 3 October 2019).26. Apache Software Foundation. 2006. Available online: https://hadoop.apache.org/docs/r1.2.1/hdfs_design.
html (accessed on 15 October 2019).27. MacQueen, J. Some methods for classification and analysis of multivariate observations. In Proceedings of the
Fifth Berkeley Symposium on Mathematical Statistics and Probability; University of California Press: Berkeley,CA, USA, 1967; Volume 1, pp. 281–297.
28. Available online: https://hive.apache.org (accessed on 5 October 2019).29. Droettboom, M. Matplotlib Library. 2003. Available online: https://matplotlib.org (accessed on 10 October
2019).30. National Early Warning Score (NEWS); Royal College of Physicians: London, UK, 2015. Available online: http:
//www.rcplondon.ac.uk/resources/national-early-warning-score-news (accessed on 1 December 2019).31. Aggarwal, C.C. Data classification: Algorithms and applications. In Mining and Knowledge Discovery Series; 1st ed.,
Chapman & Hall/CRC: Data, FL, USA; 2014. Available online: https://www.crcpress.com/Data-Classification-Algorithms-and-Applications/Aggarwal/p/book/9781466586741 (accessed on 1 January 2020).

Sensors 2020, 20, 1931 20 of 20
32. MIMIC Database on PhysioNet. 2000. Available online: https://www.physionet.org/ (accessed on1 October 2019).
33. Rousseeuw, P. Silhouettes: A graphical aid to the interpretation and validation of cluster analysis. J. Comput.Appl. Math. 1987, 20, 53–65. [CrossRef]
c© 2020 by the authors. Licensee MDPI, Basel, Switzerland. This article is an open accessarticle distributed under the terms and conditions of the Creative Commons Attribution(CC BY) license (http://creativecommons.org/licenses/by/4.0/).