a guide to slideshare analytics - excerpts from hubspot's step by step guide to slideshare...
TRANSCRIPT

A Guide to SlideShare Analytics:
Excerpts from Hubspot’s Step-by-Step Guide to SlideShare Marketing

21HUBSPOT - The Step-by-Step Guide to Sl ideShare Market ing
You’ll be taken first to a “Summary” page, where you can see the total views and total actions (actions = likes, embeds, & comments) for all of your SlideShare presentations over the past month.
Use the black navigation bar in the top right corner to change the time period. Your options are 1 week, 1 month, 3 months, 6 months, 1 year, and all time.
m e a s u r i n g
p e r f o r m a n c e
w i t h a n a l y t i c sMonitoring the performance of your SlideShare presentations is a crucial -- but often overlooked -- part of SlideShare marketing as a whole.
Ultimately, if you’re not looking at the data to see which of your presentations are earning the most views, driving the most engagement (e.g., CTA clicks and downloads), or garnering the most social shares, you won’t have any insight into what’s working and what isn’t.
When you’re logged into your SlideShare account, you can review this important data by hovering over your logo in the top right hand corner and selecting “Analytics” from the dropdown.

22HUBSPOT - The Step-by-Step Guide to Sl ideShare Market ing
If you want to get data on a specific presentation, click the “uploads” button and choose the presentation from the carousel.
To go back to seeing data for all of your presentations combined, click on the folder/upload icon.
Using these filters, you can identify potential problems with your SlideShare marketing strategy.
For example, you might notice that all of your new SlideShare presentations experience a sharp decline in views after the first week.
This could lead you to start experimenting with staggering different promotional activities to try to stretch the lifespans of your presentations (e.g., week 1 you could send an email, week 2 you could do a big social push, and week 3 you could publish a blog post).
Alternatively, you might notice that all of your SlideShare presentations on topic A get way more views and engagement than presentations on topics B, C, or D. A natural next step here would be to dedicate more resources to creating presentations around topic A.
Scroll down on the “Summary” page and you’ll find a few more pieces of helpful information, including presentation views by country, a breakdown of specific actions taken (including downloads), and a breakdown of traffic sources (embed, referral, search, slideshare.net, direct, & social).

23HUBSPOT - The Step-by-Step Guide to Sl ideShare Market ing
Assuming you put a lead form in front of the .pdf version of your presentation, you can calculate its view-to-contact conversion rate by simply dividing downloads by views.
However, if you’ve also included lead forms elsewhere in your presentation, a better option may be to jump into your Lead Dashboard, where you can pull the total number of leads a presentation’s forms captured. You could then divide that total lead number by the number of views to calculate the conversion rate.
For a closer look at the amount of views your SlideShare presentations are generating, jump over to the “Views” tab.
Here, you’ll be able to see presentation views broken out by traffic sources and geography. You can also generate top 5, top 10, and top 20 lists of your biggest traffic sources and the countries that account for the biggest percentages of your presentation’s views (see screenshot on next page).

24HUBSPOT - The Step-by-Step Guide to Sl ideShare Market ing
Under the “Actions” tab, you’ll find a dashboard displaying clicks, likes, comments, downloads, and email shares.
If you’re viewing data for all of your presentations, you’ll see a chart with those same metrics broken out for each individual presentation you’ve published.
Alternatively, if you’re viewing data for one specific presentation, you’ll see thumbnails of SlideShare users who have recently downloaded or liked that presentation, as well as a Twitter stream showing all the times people have tweeted your presentation.
25HUBSPOT - The Step-by-Step Guide to Sl ideShare Market ing
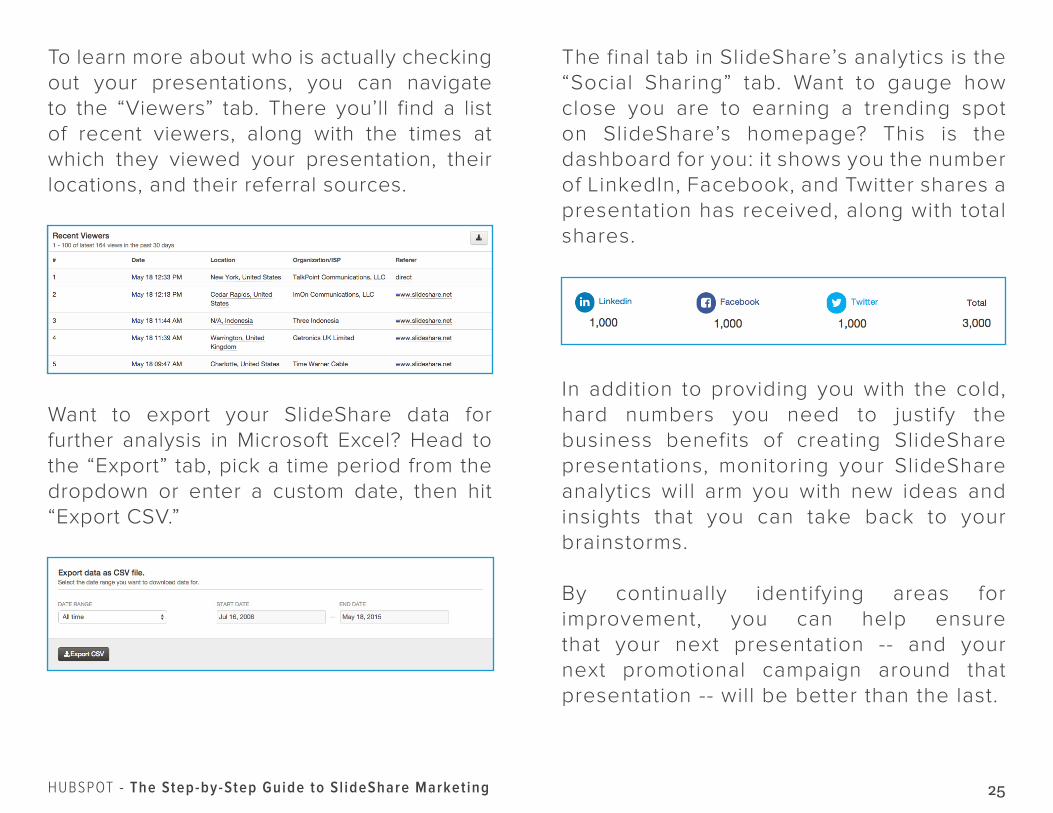
To learn more about who is actually checking out your presentations, you can navigate to the “Viewers” tab. There you’ll find a list of recent viewers, along with the times at which they viewed your presentation, their locations, and their referral sources.
Want to export your SlideShare data for further analysis in Microsoft Excel? Head to the “Export” tab, pick a time period from the dropdown or enter a custom date, then hit “Export CSV.”
The final tab in SlideShare’s analytics is the “Social Sharing” tab. Want to gauge how close you are to earning a trending spot on SlideShare’s homepage? This is the dashboard for you: it shows you the number of LinkedIn, Facebook, and Twitter shares a presentation has received, along with total shares.
In addition to providing you with the cold, hard numbers you need to justify the business benefits of creating SlideShare presentations, monitoring your SlideShare analytics will arm you with new ideas and insights that you can take back to your brainstorms.
By continually identifying areas for improvement, you can help ensure that your next presentation -- and your next promotional campaign around that presentation -- will be better than the last.