a generalized model for financial time series representation and prediction author: depei bao...
Post on 19-Dec-2015
218 views
TRANSCRIPT

A Generalized Model for Financial A Generalized Model for Financial Time Series Representation and Time Series Representation and
PredictionPrediction
Author: Depei BaoAuthor: Depei BaoPresenter: Liao ShuPresenter: Liao Shu
Acknowledgement: Some figures in this Acknowledgement: Some figures in this presentation are obtained from the paperpresentation are obtained from the paper

Outline of the PresentationOutline of the Presentation
IntroductionIntroduction Critical Point Model (CPM) for Financial Time Critical Point Model (CPM) for Financial Time
Series RepresentationSeries Representation Motivation and importance of using critical pointsMotivation and importance of using critical points The generalized CPM to represent financial time seriesThe generalized CPM to represent financial time series
Probabilistic model based on CPM for predictionProbabilistic model based on CPM for prediction Experimental ResultsExperimental Results Conclusion Conclusion

IntroductionIntroduction
Flow Chart of the General Financial Time Flow Chart of the General Financial Time Series Prediction Method:Series Prediction Method:
Input Data
Feature Extraction
Probabilistic ModelProbabilistic Model
Optimization
Forecast Value

IntroductionIntroduction Main Idea of the Proposed Method: Stock movements are Main Idea of the Proposed Method: Stock movements are
affected by two types of factorsaffected by two types of factors Gradual strength changes between the buying side and the Gradual strength changes between the buying side and the
selling side (Useful Information)selling side (Useful Information) Random factors such as emergent affairs or daily operation Random factors such as emergent affairs or daily operation
variations (Noise)variations (Noise) Motivation and Goal of the Proposed Method:Motivation and Goal of the Proposed Method:
Using the original raw price data to do prediction can be Using the original raw price data to do prediction can be problematic problematic
Remove the noise information and preserve the useful Remove the noise information and preserve the useful information to do the predictioninformation to do the prediction

Critical Point Model (CPM) for Critical Point Model (CPM) for Financial Time Series RepresentationFinancial Time Series Representation
Motivation (Why critical point model?)Motivation (Why critical point model?)
A fluctuant financial time series consists of a A fluctuant financial time series consists of a sequence of local maximal/minimal points. sequence of local maximal/minimal points. Some of Some of themthem mirrors the information of trend reversals mirrors the information of trend reversals

Motivation and Importance of using Motivation and Importance of using Critical Points: Pattern InformationCritical Points: Pattern Information
Based on the critical points, the input financial time series can be Based on the critical points, the input financial time series can be represented in a pattern-wised manner to reflect their trends over represented in a pattern-wised manner to reflect their trends over
different periodsdifferent periods

CPM Based RepresentationCPM Based Representation
A financial time series is comprised of a sequence of A financial time series is comprised of a sequence of critical points (local minimal/maximal)critical points (local minimal/maximal)
We only consider the critical pointsWe only consider the critical points Only some of the critical points are preserved Only some of the critical points are preserved
(remove those critical points which are considered as (remove those critical points which are considered as noise factors)noise factors)

Definition of NoiseDefinition of Noise
Defined based on two measure criterionsDefined based on two measure criterions Amount of oscillation between two critical pointsAmount of oscillation between two critical points Duration between two critical pointsDuration between two critical points
A small oscillation and a short duration will be A small oscillation and a short duration will be regarded as noise. regarded as noise.

Simple CPMSimple CPM
ExampleExample
Define a minimal time interval T (duration) and a minimal vibration percentage P Define a minimal time interval T (duration) and a minimal vibration percentage P (oscillation). Remove the critical points (X(i),Y(i)) and (X(i+1),Y(i+1)) if:(oscillation). Remove the critical points (X(i),Y(i)) and (X(i+1),Y(i+1)) if:

Drawbacks of the Simple CPMDrawbacks of the Simple CPM The Simple CPM is too rough, the critical points are accessed in a local range The Simple CPM is too rough, the critical points are accessed in a local range
(without looking ahead)(without looking ahead) Example of an exception:Example of an exception:
In this example, it is assume that AB, AD and BE don’t satisfy the removing criteria In this example, it is assume that AB, AD and BE don’t satisfy the removing criteria of the simple CPM, but BC, CD, DE satisfyof the simple CPM, but BC, CD, DE satisfy

Drawbacks of the Simple CPMDrawbacks of the Simple CPM
Another exception case:Another exception case:
In this example, BC is assumed to be satisfy the removing In this example, BC is assumed to be satisfy the removing criteria of simple CPMcriteria of simple CPM
Drawbacks of the Simple CPMDrawbacks of the Simple CPM
Root of the drawback of simple CPM:Root of the drawback of simple CPM: Only testing the distance between two Only testing the distance between two successivesuccessive
critical points to evaluate a vibrationcritical points to evaluate a vibration
The generalized CPM (GCPM) is proposed in The generalized CPM (GCPM) is proposed in this paper to overcome these shortcomingsthis paper to overcome these shortcomings

The Generalized CPMThe Generalized CPM
The time series is processed sequentially The time series is processed sequentially in the in the unit of three pointsunit of three points (two minimal points and (two minimal points and one maximal point)one maximal point)
Important Reminder: in GCPM, the three Important Reminder: in GCPM, the three points in a unit are not necessary to be points in a unit are not necessary to be successive critical pointssuccessive critical points

The Generalized CPMThe Generalized CPM
Main issues of GCPM:Main issues of GCPM: How to choose the next three-point unit to be How to choose the next three-point unit to be
processedprocessed How to choose preserved critical pointsHow to choose preserved critical points

Outline of the GCPMOutline of the GCPM
Initialization of GCPMInitialization of GCPM
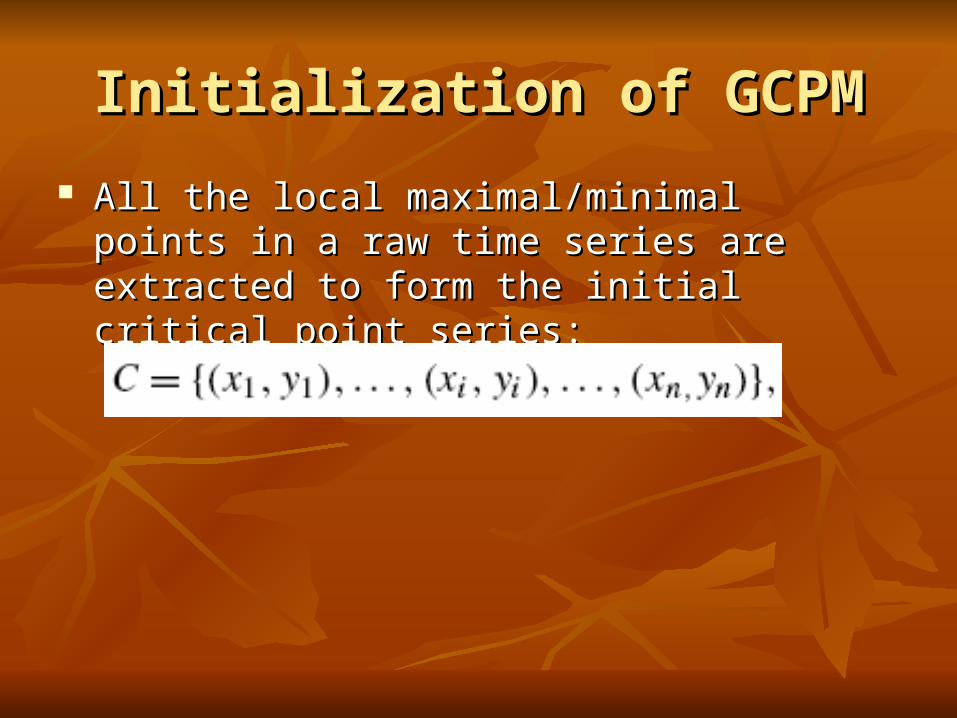
All the local maximal/minimal points in a raw All the local maximal/minimal points in a raw time series are extracted to form the initial time series are extracted to form the initial critical point series:critical point series:
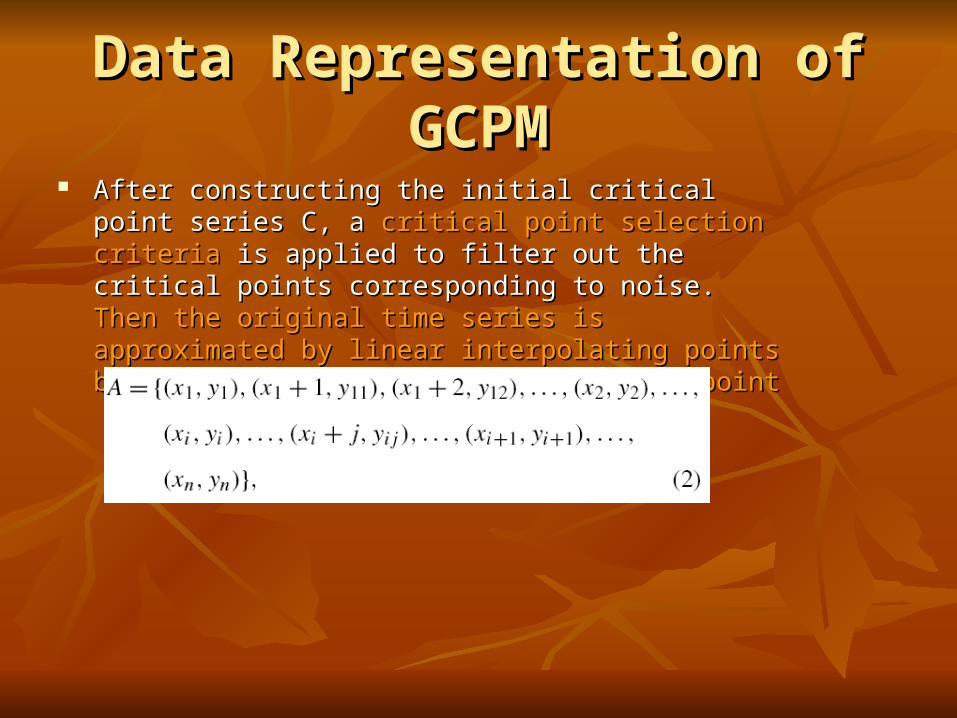
Data Representation of GCPMData Representation of GCPM After constructing the initial critical point series C, a After constructing the initial critical point series C, a critical critical
point selection criteriapoint selection criteria is applied to filter out the critical points is applied to filter out the critical points corresponding to noise. corresponding to noise. Then the original time series is Then the original time series is approximated by linear interpolating points between a maximal approximated by linear interpolating points between a maximal point and a minimal pointpoint and a minimal point

The Critical Point Selection Criteria of GCPMThe Critical Point Selection Criteria of GCPM
The first and the last data point in the original The first and the last data point in the original time series are preserved as the first and last point time series are preserved as the first and last point in Cin C
Local maximal and local minimal points in the Local maximal and local minimal points in the approximated series must appear alternatelyapproximated series must appear alternately
The Critical Point Selection Criteria of GCPMThe Critical Point Selection Criteria of GCPM
Selection is also based on the oscillation Selection is also based on the oscillation threshold P and the duration threshold Tthreshold P and the duration threshold T
Consider P first, there are four casesConsider P first, there are four cases Both the rise and the decline oscillations exceed PBoth the rise and the decline oscillations exceed P The rise over P, but the decline below PThe rise over P, but the decline below P The decline over P, but the rise below PThe decline over P, but the rise below P Neither the rise nor the decline over P.Neither the rise nor the decline over P.
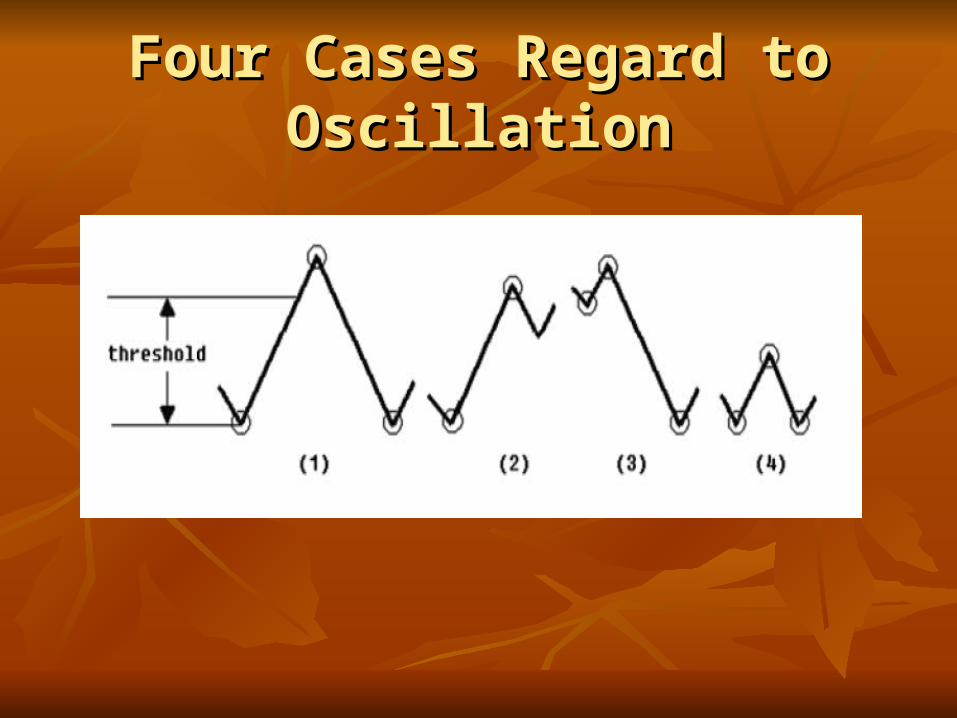
Four Cases Regard to OscillationFour Cases Regard to Oscillation
Second Layer Checking with Duration TSecond Layer Checking with Duration T
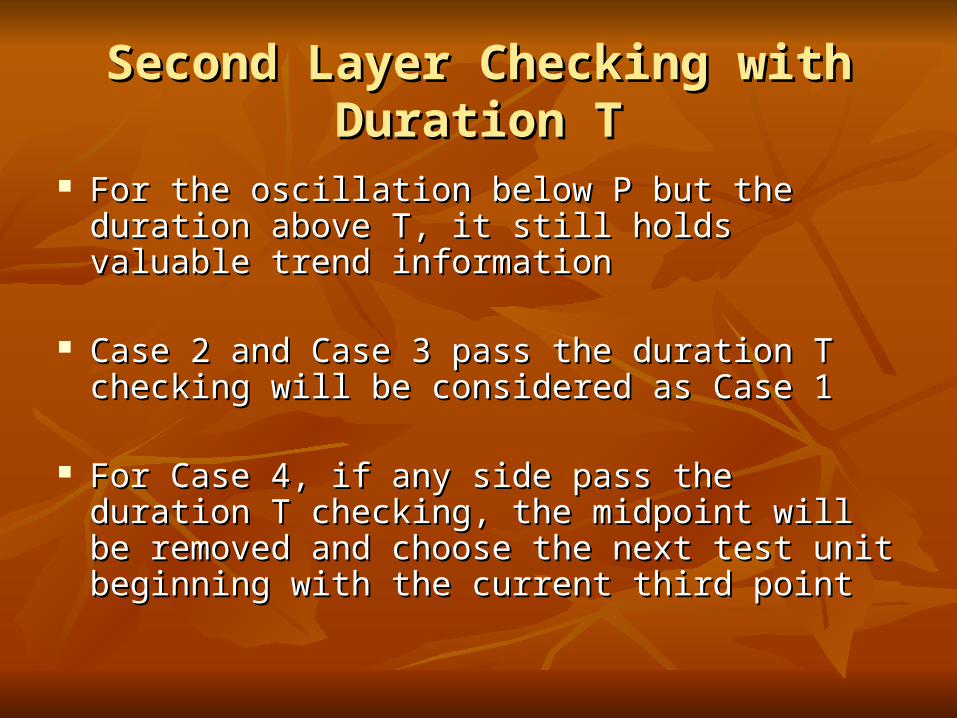
For the oscillation below P but the duration above T, For the oscillation below P but the duration above T, it still holds valuable trend informationit still holds valuable trend information
Case 2 and Case 3 pass the duration T checking will Case 2 and Case 3 pass the duration T checking will be considered as Case 1be considered as Case 1
For Case 4, if any side pass the duration T checking, For Case 4, if any side pass the duration T checking, the midpoint will be removed and choose the next test the midpoint will be removed and choose the next test unit beginning with the current third pointunit beginning with the current third point
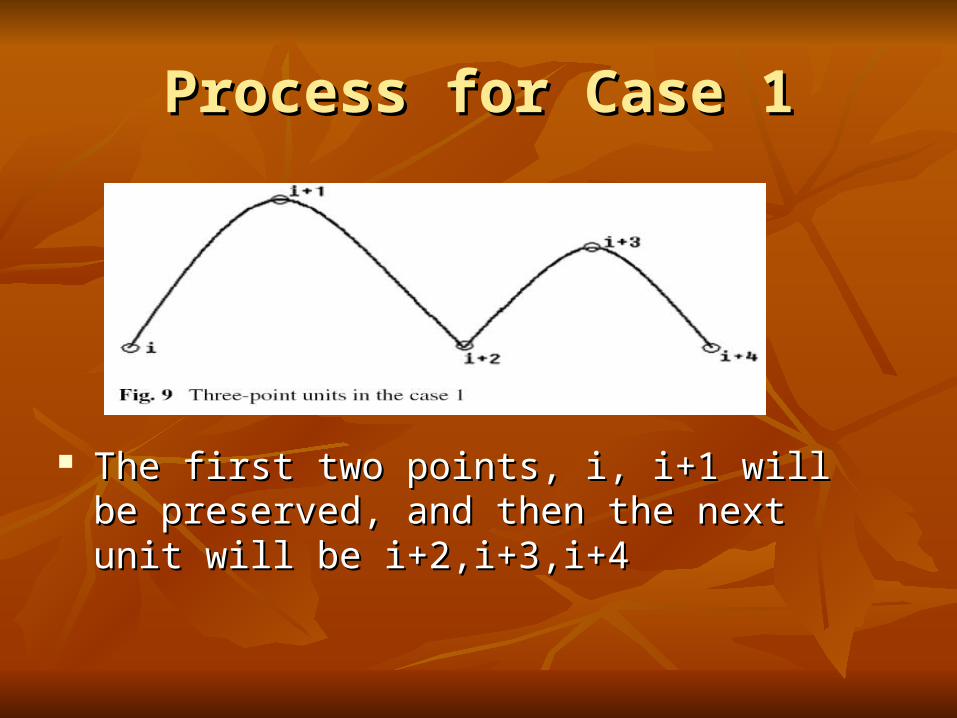
Process for Case 1Process for Case 1
The first two points, i, i+1 will be preserved, and The first two points, i, i+1 will be preserved, and then the next unit will be i+2,i+3,i+4then the next unit will be i+2,i+3,i+4

Process for Case 2Process for Case 2
Two sub-casesTwo sub-cases If Y(i+3) >= Y(i+1), the next unit will be i, i+3, i+4If Y(i+3) >= Y(i+1), the next unit will be i, i+3, i+4 Otherwise, the next unit will be i, i+1, i+4Otherwise, the next unit will be i, i+1, i+4

Process for Case 3Process for Case 3
Two sub-casesTwo sub-cases Y(i+3)>=Y(i+1)Y(i+3)>=Y(i+1) Y(i+3)<Y(i+1)Y(i+3)<Y(i+1)
The next unit will always be i+2,i+3,i+4 because Y(i+2)<=Y(i)The next unit will always be i+2,i+3,i+4 because Y(i+2)<=Y(i)

Process for Case 4Process for Case 4
Two sub-casesTwo sub-cases Y(i)<=Y(i+2): next unit will be i, i+3, i+4Y(i)<=Y(i+2): next unit will be i, i+3, i+4 Y(i)>Y(i+2): next unit will be i+2, i+3, i+4Y(i)>Y(i+2): next unit will be i+2, i+3, i+4

Price Pattern Matching in GCPMPrice Pattern Matching in GCPM
Two types of patterns:Two types of patterns: The point-wise patternsThe point-wise patterns
The trend patternThe trend pattern
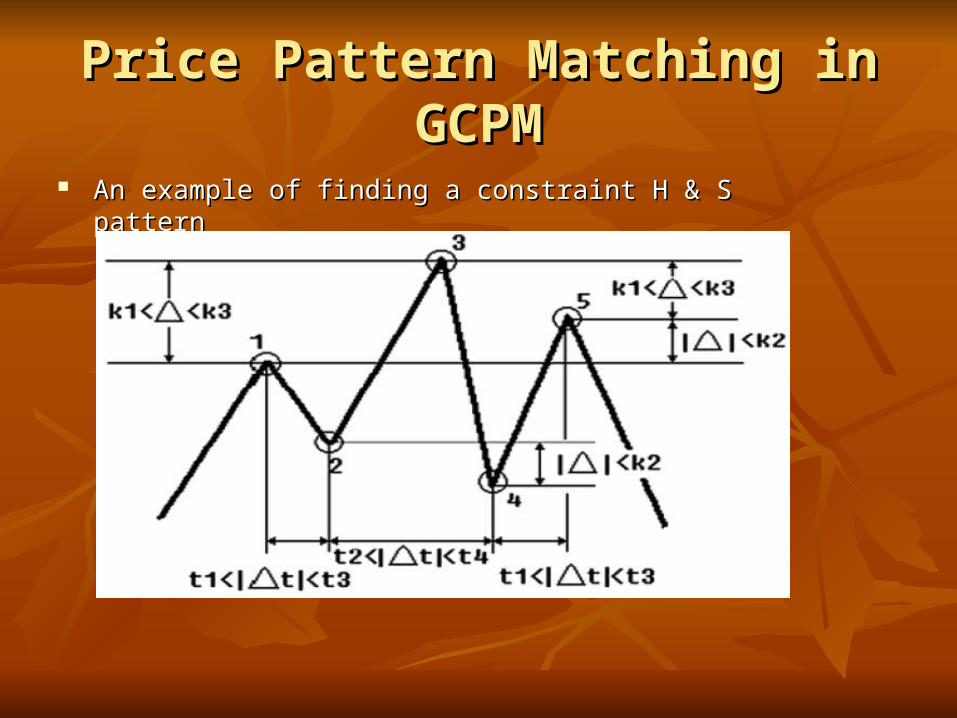
Price Pattern Matching in GCPMPrice Pattern Matching in GCPM
An example of finding a constraint H & S patternAn example of finding a constraint H & S pattern

Price Pattern Matching in GCPMPrice Pattern Matching in GCPM
Numerical formulation of the constraint H & S patternNumerical formulation of the constraint H & S pattern
Probabilistic model based on GCPM for predictionProbabilistic model based on GCPM for prediction
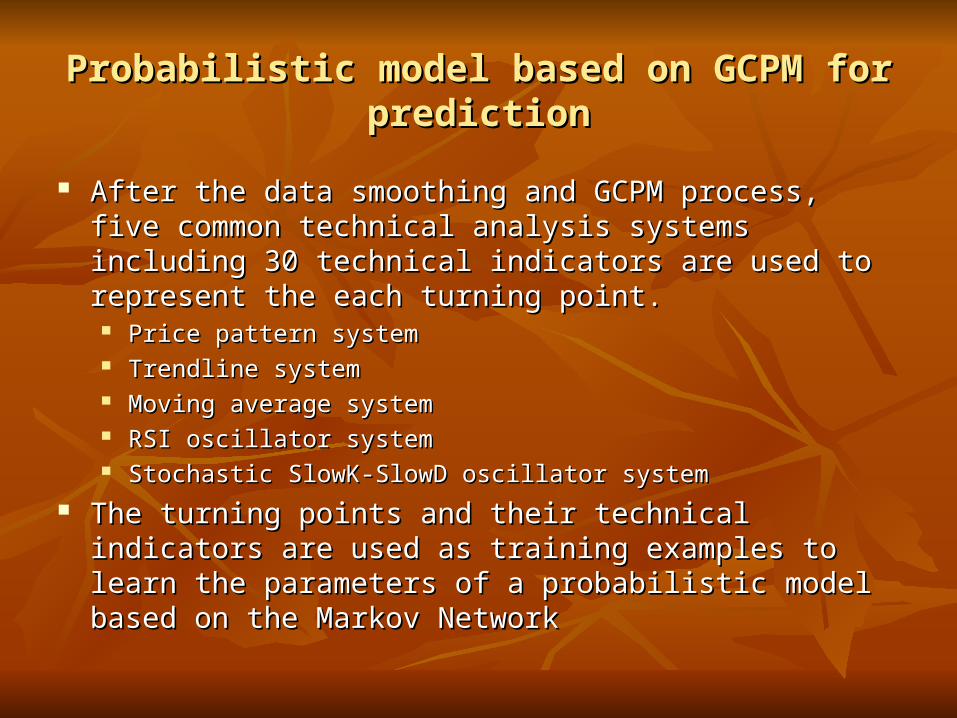
After the data smoothing and GCPM process, five common After the data smoothing and GCPM process, five common technical analysis systems including 30 technical indicators technical analysis systems including 30 technical indicators are used to represent the each turning point.are used to represent the each turning point. Price pattern systemPrice pattern system Trendline systemTrendline system Moving average systemMoving average system RSI oscillator systemRSI oscillator system Stochastic SlowK-SlowD oscillator systemStochastic SlowK-SlowD oscillator system
The turning points and their technical indicators are used as The turning points and their technical indicators are used as training examples to learn the parameters of a probabilistic training examples to learn the parameters of a probabilistic model based on the Markov Networkmodel based on the Markov Network

Probabilistic model based on GCPM for predictionProbabilistic model based on GCPM for prediction
The Markov NetworkThe Markov Network
Y = {true,false} represent whether a critical point is Y = {true,false} represent whether a critical point is the real turning pointthe real turning point
X = {X1,X2,…,Xn}, Xi = {true,false} is a vector X = {X1,X2,…,Xn}, Xi = {true,false} is a vector with Xi represents the i-th technical indicator and with Xi represents the i-th technical indicator and TRUE for the occurrence of the signal for the TRUE for the occurrence of the signal for the current critical pointcurrent critical point

Probabilistic model based on GCPM for predictionProbabilistic model based on GCPM for prediction
The Markov Network Can be Converted to:The Markov Network Can be Converted to:
For each indicator, if the corresponding rule Xi -> Y (~Xi V Y) For each indicator, if the corresponding rule Xi -> Y (~Xi V Y) is true, then fi(xi,y) = 1, otherwise fi(xi,y) = 0. The to-be-is true, then fi(xi,y) = 1, otherwise fi(xi,y) = 0. The to-be-estimated parameter wi corresponds to each rule.estimated parameter wi corresponds to each rule.
Optimization of ParametersOptimization of Parameters
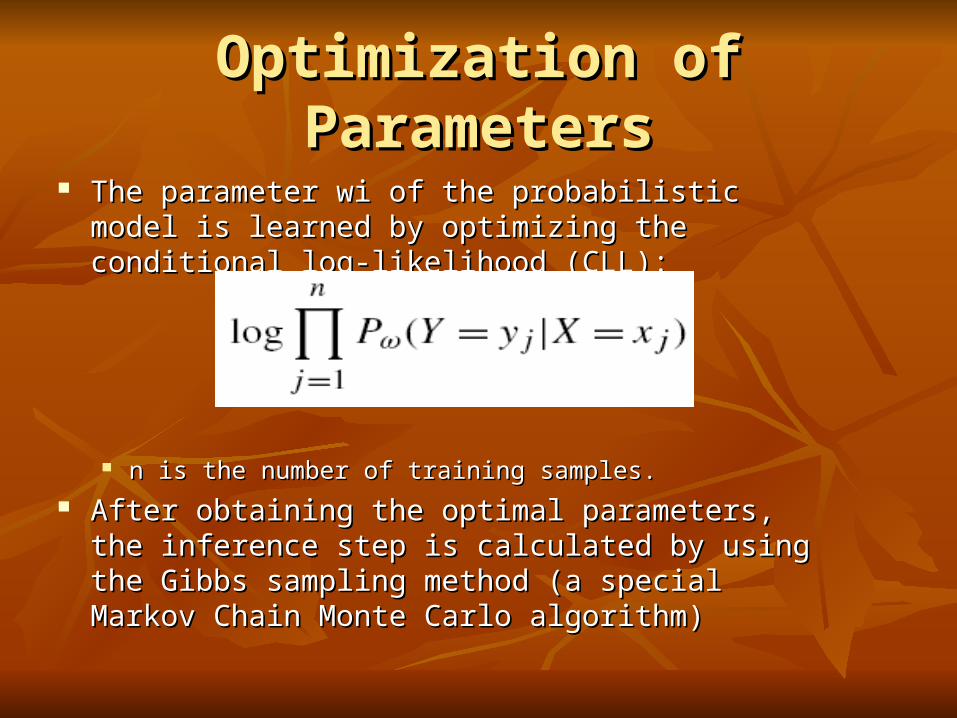
The parameter wi of the probabilistic model is learned by The parameter wi of the probabilistic model is learned by optimizing the conditional log-likelihood (CLL):optimizing the conditional log-likelihood (CLL):
n is the number of training samples.n is the number of training samples.
After obtaining the optimal parameters, the inference After obtaining the optimal parameters, the inference step is calculated by using the Gibbs sampling method (a step is calculated by using the Gibbs sampling method (a special Markov Chain Monte Carlo algorithm)special Markov Chain Monte Carlo algorithm)

Experimental ResultsExperimental Results
The approximation accuracy of GCPM, the The approximation accuracy of GCPM, the normalized error (NE) is adopted as the metricnormalized error (NE) is adopted as the metric
NE for approximating the prices of IBMNE for approximating the prices of IBM
Experimental ResultsExperimental Results
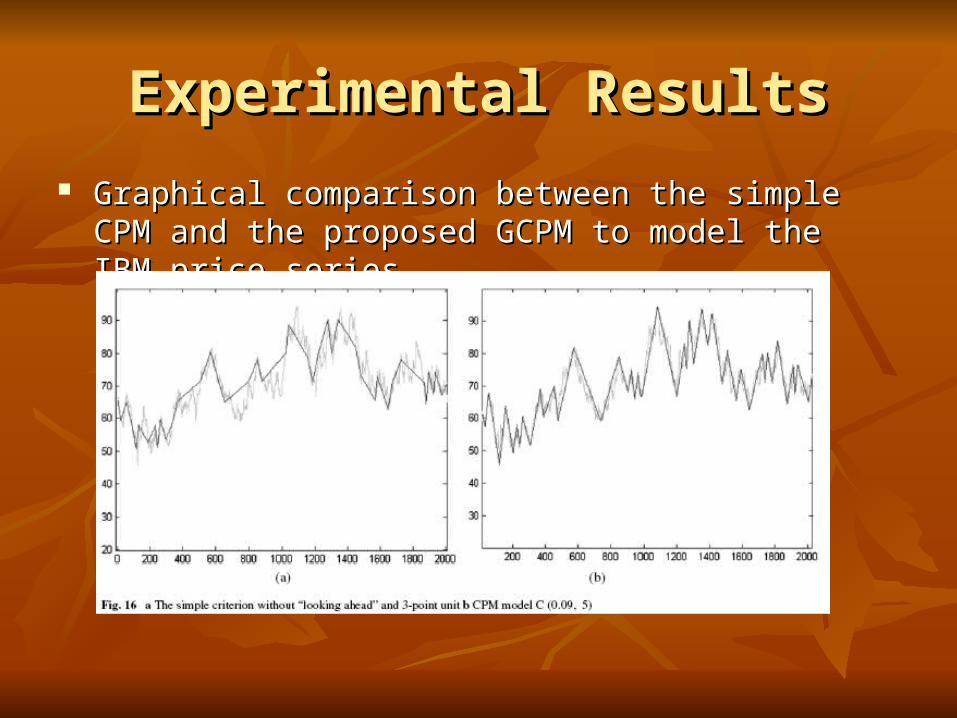
Graphical comparison between the simple CPM and the Graphical comparison between the simple CPM and the proposed GCPM to model the IBM price seriesproposed GCPM to model the IBM price series

Experimental ResultsExperimental Results
Test on Stock Trading:Test on Stock Trading: A simple trading rule: if the current reversal is from an uptrend to a A simple trading rule: if the current reversal is from an uptrend to a
downtrend over a certain probability estimated by the proposed downtrend over a certain probability estimated by the proposed model, then sell, and vice versa. With initial fund $1000model, then sell, and vice versa. With initial fund $1000
Trading log of ALCOA INC for 4 yearsTrading log of ALCOA INC for 4 years

Experimental ResultsExperimental Results
Test the system on the CBOT Soybeans future Test the system on the CBOT Soybeans future prices from 1/5/1970 to 12/21/2006prices from 1/5/1970 to 12/21/2006

Experimental ResultsExperimental Results The system is also evaluated for the simulated trades on 454 stocks of the The system is also evaluated for the simulated trades on 454 stocks of the
S&P 500c. Then stocks are randomly picked and examine their profits on S&P 500c. Then stocks are randomly picked and examine their profits on three periodsthree periods
ConclusionConclusion
This paper proposed a new financial time series This paper proposed a new financial time series representation method for prediction based on the representation method for prediction based on the generalized critical point model (GCPM)generalized critical point model (GCPM)
The GCPM based representation is general and robustThe GCPM based representation is general and robust
Experimental results demonstrated that even in a Experimental results demonstrated that even in a period where a stock has a significant downtrend, the period where a stock has a significant downtrend, the proposed method can still make profits.proposed method can still make profits.

End of My PresentationEnd of My Presentation
Thank you!Thank you!