a fresh look at ep energy - s3.amazonaws.com€¦ · n 2 cautionary statement regarding forward...
TRANSCRIPT
EP E
nerg
y Corp
ora
tion
1
INVESTOR UPDATE
A Fresh Look At EP Energy
January 23, 2018
EP ENERGY CORPORATION

EP E
nerg
y Corp
ora
tion
2
CAUTIONARY STATEMENT REGARDING FORWARD LOOKING STATEMENTSThis presentation includes certain forward-looking statements and projections of EP Energy. EP Energy has made every reasonable effort to ensure that the information and assumptions on which these statements and projections are based are current, reasonable, and complete. However, a variety of factors could cause actual results to differ materially from the projections, anticipated results or other expectations expressed, including, without limitation, the volatility of, and sustained low oil, natural gas, and NGL prices; the supply and demand for oil, natural gas and NGLs; changes in commodity prices and basis differentials for oil and natural gas; EP Energy’s ability to meet production volume targets; the uncertainty of estimating proved reserves and unproved resources; the future level of service and capital costs; the availability and cost of financing to fund future exploration and production operations; the success of drilling programs with regard to proved undeveloped reserves and unproved resources; EP Energy’s ability to comply with the covenants in various financing documents; EP Energy’s ability to obtain necessary governmental approvals for proposed E&P projects and to successfully construct and operate such projects; actions by the credit rating agencies; credit and performance risks of EP Energy’s lenders, trading counterparties, customers, vendors, suppliers, and third party operators; general economic and weather conditions in geographic regions or markets served by EP Energy, or where operations of EP Energy are located, including the risk of a global recession and negative impact on oil and natural gas demand; the uncertainties associated with governmental regulation, including any potential changes in federal and state tax laws and regulation; competition; and other factors described in EP Energy’s Securities and Exchange Commission filings. While EP Energy makes these statements and projections in good faith, neither EP Energy nor its management can guarantee that anticipated future results will be achieved. Reference must be made to those filings for additional important factors that may affect actual results. EP Energy assumes no obligation to publicly update or revise any forward-looking statements made herein or any other forward-looking statements made by EP Energy, whether as a result of new information, future events, or otherwise.
This presentation presents certain production and reserves-related information on an "equivalency" basis. Equivalent volumes are computed with natural gas converted to barrels at a ratio of six Mcf to one Bbl. These conversions are based on energy equivalency conversion methods primarily applicable at the burner tip and do not represent value equivalencies at the wellhead. Although these conversion factors are industry accepted norms, they are not reflective of price or market value differentials between product types.
This presentation refers to certain non-GAAP financial measures such as “Adjusted Cash Operating Costs”, “Adjusted EBITDAX” and “Adjusted General and Administrative Expenses”. Definitions of these measures are included in the Appendix of this presentation.

EP E
nerg
y Corp
ora
tion
3
OUR FOCUS
Enhance the value of our asset portfolio
Increase capital efficiency
Reduce cash costs per barrel
Maintain financial flexibility
Move toward cash flow neutrality
Pursue accretive A&D transactions
All decisions based on value creation
A DIFFERENTAPPROACH
More nimble company
Increased collaboration throughout organization
Pursuing new ideas in all asset programs
Optimized well designs
Utilize fresh operational concepts to reduce costs
Strategic use of A&D transactions with enhanced analytics
Apply new concepts to enhance quality asset base

EP E
nerg
y Corp
ora
tion
4
HIGH QUALITY ASSET PORTFOLIO EAGLE FORD (~93,000 NET ACRES) PERMIAN (~178,000 NET ACRES) ALTAMONT (~181,000 NET ACRES)
Low cost capital efficient program
Acquisition increases inventory and provides additional running room
Favorable market pricing
Significant resource and multi-decade drilling inventory
Multiple zone opportunities
Large contiguous acreage position supports efficient operating cost structure
Rich resource base
Strong performance from recompletion program
Demonstrated value marker for acreage
Note: Acreage positions as of 12/31/16
UT

EP E
nerg
y Corp
ora
tion
5
SUCCESSFUL A&D TRANSACTIONS
Largest acquisition in EPE’s history
Bolt-on acquisition with operational synergies
Adds ~200 future drilling locations
95% operated (EPE operates other 5%)
Lateral extension on 30 future locations
Favorable market valuation
Significantly accretive to valuation and improves credit metrics over time
Accelerates long-lead time value forward
Demonstrated value marker for acreage
EAGLE FORD ACQUISITION ALTAMONT DIVESTITURE
Transactions are credit neutral and accretive to production and cash flow
Divested Assets~14 percent of EPE
acreageLA SALLE
FRIO
EPE acreage
Acquired acreage

EP E
nerg
y Corp
ora
tion
6
IMPROVED FINANCIAL FLEXIBILITY
As of 12/31/15: $4.9 billion
As of 9/30/17 Pro Forma2: $4.0 billion
$1,222$497 $2,000 $350 $800
2018 2019 2020 2021 2022 2023 2024 2025
$593$21 $1,592 $1,000$246 $196 $380
2018 2019 2020 2021 2022 2023 2024 2025
1 Total operating revenue less adjusted cash operating costs. See Appendix for non-GAAP definition.2 Pro forma as of 9/30/17 to include 1/3/18 notes exchange transaction and the October 2017 Borrowing Base Redetermination
MATURITY PROFILES ($MM)Financial Priorities
Opportunistically extend debt maturities
Maintain ample financial flexibility
Improve cash margins1
Lower leverage via improved cash flows, accretive A&D
Execution
Retired or extended ~$2.8 billion of debt maturing by 2020 over the last two years
Manageable 2020 maturity stub
~$700 million of liquidity at 12/31/17 pro forma for the debt exchange

EP E
nerg
y Corp
ora
tion
7
SOLID HEDGE PROGRAM
EP E
nerg
y Corp
ora
tion
Note: Hedge positions are as of January 10, 2018 (Contract months: January 1, 2018 – Forward). Percent hedged based on midpoint of 2018 guidance. 1 If market prices settle at or below $50.00 in 2018, EPE will receive a “locked-in” cash settlement of the market price plus $10.00 per Bbl. As of December 31, 2017, the average forward price of oil was $59.31 per Bbl for 2018.
Substantial portion of 2018 crude oil volume hedged with floor at $58.46/Bbl
Crude oil option structures allow for significant upside participation as WTI price rises
Two-thirds of 2018 crude oil exposure open to upward price moves above current strip
Hedge-Adjusted 2018 Crude Oil Revenue at Various WTI Prices
Rev
enu
e (t
ho
usa
nd
$)
WTI Settlement Price ($/Bbl)
Crude Oil (MMbbls)
Fixed Price million bbls $/bbl million bbls $/bbl
Swaps 5.079 $56.47 0.73 $55.88
Costless Collar Ceiling 1.002 $64.98
Costless Collar Floor 1.002 $55.00
Three-way Ceiling 8.859 $68.15
Three-way Upper Floor 8.859 $60.00
Three-way Lower Floor 8.859 $50.00
Avg. Ceiling 14.94 $63.96 0.73 $55.88
Avg. Floor 14.94 $58.46 0.73 $55.88
Percentage Hedged
Natural Gas (Tbtu)
Fixed Price tBtu $/mmBtu tBtu $/mmBtu
Swaps 25.55 $3.04 7.3 $2.97
Avg. Ceiling 25.55 $3.04 7.3 $2.97
Avg. Floor 25.55 $3.04 7.3 $2.97
Percentage Hedged
NGLs (MMGal)
Fixed Price million gal $/gal million gal $/gal
Ethane Swaps 61.32 $0.30
Percentage Hedged
Propane Swaps 30.66 $0.75
Percentage Hedged
2018 2019
85% 4%
2018 2019
2018 2019
55% 16%
63%
42%
$900
$950
$1,000
$1,050
$1,100
$1,150
$1,200
$45 $50 $55 $60 $65 $70 $75
66%
34%
Cal-18 Crude Oil Hedge Position
Crude Volume with Upside Price Exposure
Crude Volume at Fixed Price
1
EP E
nerg
y Corp
ora
tion
8
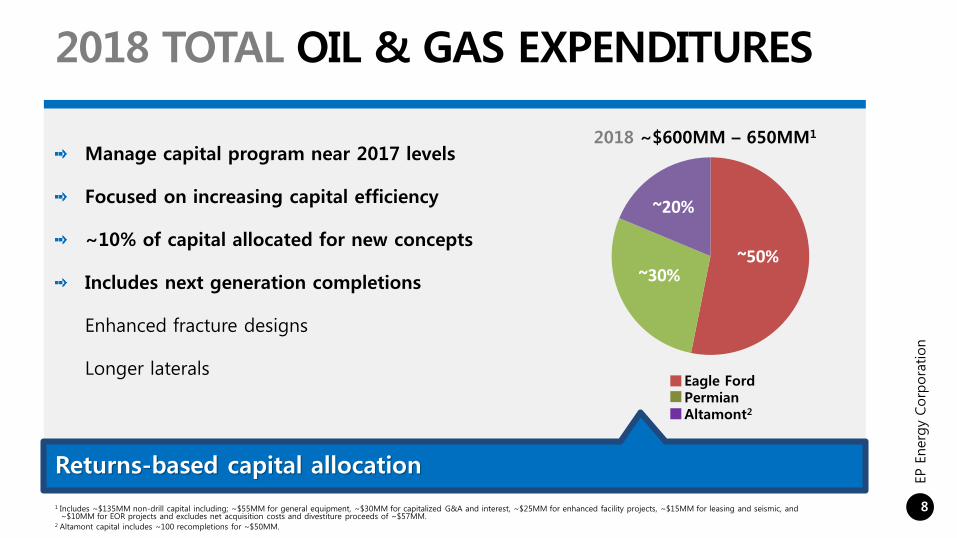
2018 TOTAL OIL & GAS EXPENDITURES
Returns-based capital allocation
Manage capital program near 2017 levels
Focused on increasing capital efficiency
~10% of capital allocated for new concepts
Includes next generation completions
Enhanced fracture designs
Longer lateralsEagle FordPermianAltamont2
2018 ~$600MM – 650MM1
1 Includes ~$135MM non-drill capital including; ~$55MM for general equipment, ~$30MM for capitalized G&A and interest, ~$25MM for enhanced facility projects, ~$15MM for leasing and seismic, and ~$10MM for EOR projects and excludes net acquisition costs and divestiture proceeds of ~$57MM.
2 Altamont capital includes ~100 recompletions for ~$50MM.
~50%
~20%
~30%
EP E
nerg
y Corp
ora
tion
9
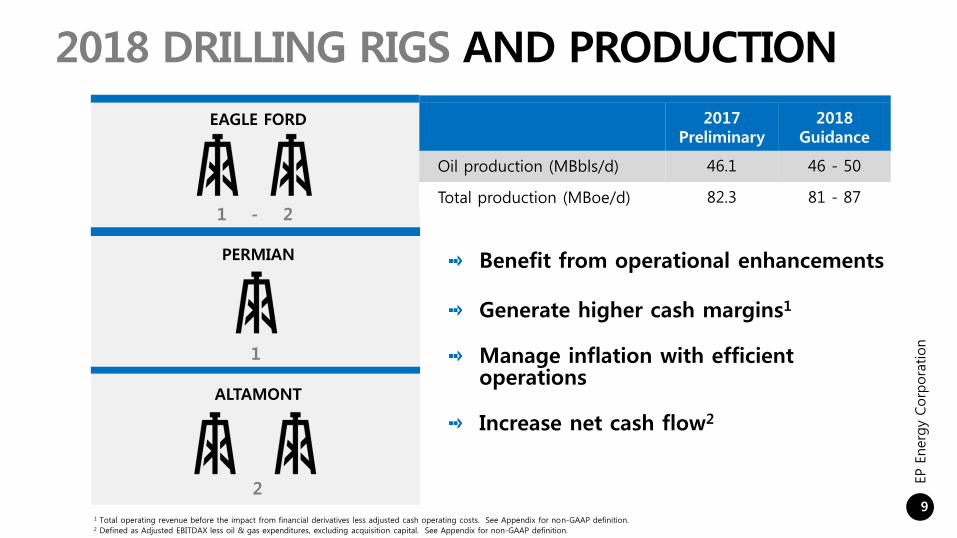
2018 DRILLING RIGS AND PRODUCTION
2017Preliminary
2018Guidance
Oil production (MBbls/d) 46.1 46 - 50
Total production (MBoe/d) 82.3 81 - 87
Benefit from operational enhancements
Generate higher cash margins1
Manage inflation with efficient operations
Increase net cash flow2
EAGLE FORD
PERMIAN
ALTAMONT
1 - 2
1
2
1 Total operating revenue before the impact from financial derivatives less adjusted cash operating costs. See Appendix for non-GAAP definition. 2 Defined as Adjusted EBITDAX less oil & gas expenditures, excluding acquisition capital. See Appendix for non-GAAP definition.

EP E
nerg
y Corp
ora
tion
10
EFFICIENT OPERATING COSTS
2018Guidance
% Change From 2017 Midpoint
Guidance
Lease operating expense ($/Boe) $5.00 - $5.70 6%Reduced salt water disposal and water handling costs plus focus on optimizing M&R
Adjusted G&A expenses ($/Boe)1 $2.30 - $2.60 17%More efficient organized structure and reduced non-labor costs
Transportation and commodity purchases ($/Boe)
$3.15 - $3.45 19%Reduced minimum volume commitment charges and reduction due to new revenue recognition standard
Taxes, other than income ($/Boe)2 $2.50 - $2.60 17% Higher commodity prices
DD&A ($/Boe) $16.50 - $17.50 3%Permian sliding scale reversion due to higher WTI prices
1 See Appendix for non-GAAP reconciliation and definition2 Assumes $55/Bbl WTI

EP E
nerg
y Corp
ora
tion
11
INVESTOR UPDATE
A Fresh Look At EP Energy
January 23, 2018
EP ENERGY CORPORATION

EP E
nerg
y Corp
ora
tion
12
APPENDIX
EP E
nerg
y Corp
ora
tion
13
NON-GAAP TERMS
Adjusted cash operating costs is a non-GAAP measure that is defined as total operating expenses, excluding depreciation, depletion and amortization expense, exploration expense, impairment charges, gains and/or losses on sale of assets, the non-cash portion of compensation expense (which represents compensation expense under our long-term incentive programs adjusted for cash payments made under these plans) and transition, severance and other costs that affect comparability.
EBITDAX is defined as net income (loss) plus interest and debt expense, income taxes, depreciation, depletion and amortization and exploration expense. Adjusted EBITDAX is defined as EBITDAX, adjusted as applicable in the relevant period for the net change in the fair value of derivatives (mark-to-market effects of financial derivatives, net of cash settlements and cash premiums related to these derivatives), the non-cash portion of compensation expense (which represents non-cash compensation expense under these programs adjusted for cash payments made under these plans), transition, restructuring and other costs that affect comparability, gains and losses on extinguishment/modification of debt and impairment charges.
Adjusted general and administrative expenses are defined as general and administrative expenses excluding the non-cash portion of compensation expense which represents compensation expense under our long-term incentive programs adjusted for cash payments under these plans. For 2018, we expect GAAP general and administrative expenses between approximately $2.90 per Boe - $3.25 per Boe which includes approximately $0.60 per Boe - $0.65 per Boe of non-cash compensation expense.