a framework for intelligent assessment...
TRANSCRIPT

A FRAMEWORK FOR INTELLIGENT ASSESSMENT
AND RESOLUTION OF COMMERCIAL-OFF-THE-
SHELF PRODUCT INCOMPATIBILITIES
by
Jesal Bhuta
A Dissertation Presented to the FACULTY OF THE GRADUATE SCHOOL
UNIVERSITY OF SOUTHERN CALIFORNIA In Partial Fulfillment of the
Requirements for the Degree DOCTOR OF PHILOSOPHY
(COMPUTER SCIENCE)
August 2007
Copyright 2007 Jesal Bhuta

ii
To my parents

iii
Acknowledgements
This dissertation could not have been completed without the support of many minds.
I am especially indebted to my advisor Dr. Barry Boehm, for his guidance and support
throughout my academic program. I am grateful to the members of my dissertation
committee whose invaluable guidance and support made this work possible. I would
like to specially thank to Dr. Nenad Medvidovic for his support during
experimentation in the software architecture course; and Dr. Ricardo Valerdi who
spent hours with me over the telephone from across the country to help me excel in
this research.
I’ve had the pleasure of working with numerous outstanding colleagues during my
time at USC. These include Ye Yang who has been an excellent associate and a
wonderful friend; Apurva Jain and Steven Meyers who were excellent sound boards
for my ideas; Monvorath Phongpaibul who helped with empirical assessments; and
finally teaching assistants of the software engineering and software architecture
courses at USC who supported my experiments. I’d also specifically like to thank
Chris Mattmann for his collaboration and support in providing a ready extension to
this framework. Chris is an excellent friend with extremely interesting ideas and
inspiring research.
Last, but certainly not least, I would like to thank my family for their love and support
during my study. My parents have inspired me to always strive for the excellence
since childhood.
iv
Table of Contents
Acknowledgements............................................................................................... iii
List of Figures ........................................................................................................ vi
List of Tables ......................................................................................................... ix
List of Acronyms .................................................................................................. xv
Abstract .............................................................................................................. xvii
Chapter 1: Introduction .......................................................................................... 1
1.1 Research Context and Motivation ..................................................................... 1
1.2 Research Statement and Hypotheses ............................................................... 6
1.3 Contributions ................................................................................................... 12
1.4 Definitions ........................................................................................................ 13
1.5 Organization of the Dissertation ..................................................................... 15
Chapter 2: Background and Related Work .......................................................... 17
2.1 Software Architecture ...................................................................................... 17
2.2 COTS-based System Development Processes ................................................. 18
2.3 Component Mismatches ................................................................................. 28
2.4 Component Interoperability Assessment ........................................................ 31
2.5 Software Connector Classification .................................................................. 46
2.6 COTS Integration Strategies ........................................................................... 47
2.7 COTS Cost Estimation Model ......................................................................... 50
Chapter 3: Research Approach ............................................................................. 51
Chapter 4: Framework Overview .......................................................................... 55
Chapter 5: Interoperability Representation Attributes ...................................... 59
5.1 General Attributes ........................................................................................... 62
5.2 Interface Attributes ......................................................................................... 66
5.3 Internal Assumptions Attributes ..................................................................... 73
5.4 Dependency Attributes ................................................................................... 79

v
Chapter 6: Interoperability Assessment Rules .................................................... 83
6.1 Interface Mismatch Analysis Rules ................................................................. 85
6.2 Internal Assumption Mismatch Analysis Rules ............................................. 92
6.3 Dependency Mismatch Analysis Rules .......................................................... 126
Chapter 7: Interoperability Evaluation Process ................................................. 131
7.1 Interoperability Definition Generation Process ............................................. 132
7.2 Interoperability Analysis Process ................................................................... 134
Chapter 8: Tool Support ...................................................................................... 137
8.1 COTS Selector ................................................................................................. 138
8.2 Interoperability Analyzer ................................................................................ 141
Chapter 9: Framework Validation and Results ................................................. 145
9.1 Validation Methodology ................................................................................ 145
9.2 Experiment Design ......................................................................................... 150
9.3 Experiment Results and Analysis ................................................................... 159
9.4 Summary of Analyses ..................................................................................... 178
9.5 Framework Utility Feedback .......................................................................... 180
9.6 Threats to Validity .......................................................................................... 182
Chapter 10: Conclusion and Future Work .......................................................... 187
10.1 Summary of Contributions ............................................................................ 187
10.2 Framework Limitations .................................................................................. 188
10.3 Limitations of Validation ............................................................................... 189
10.4 Future Work ................................................................................................... 190
Bibliography ........................................................................................................ 192
Appendices .......................................................................................................... 201
Appendix A: Empirical Evaluation Materials for Experiments P1 and P2 ............. 201
Appendix B: Empirical Evaluation Materials for Experiment C1 ........................... 205
Appendix C: Empirical Evaluation Materials for Experiment C2 .......................... 217
Appendix D: Case-Specific Results for Experiment C1 ........................................... 235
Appendix E: Case-Specific Results for Experiment C2 ........................................... 239

vi
List of Figures
Figure 1: COTS-Based Applications Growth Trend in USC e-Services Projects ..............2
Figure 2: COTS-Based Effort Distribution of USC e-Services Projects ............................ 3
Figure 3: COTS-Based Effort Distribution of COCOTS Calibration Data ....................... 3
Figure 4: Reduced Trade-Off Space ................................................................................. 6
Figure 5: Framework’s High Return on Investment Area .............................................. 12
Figure 6: University of Maryland (UMD) Waterfall Variant CBA Process ................... 20
Figure 7: Evolutionary Process for Integrating COTS-Based Systems ........................... 21
Figure 8: Process for COTS Product Evaluation ............................................................. 23
Figure 9: USC COTS-Based Applications Decision Framework .................................... 25
Figure 10: USC CBA Decision Framework - Assessment Process Element ................... 26
Figure 11: USC CBA Decision Framework - Glue Code Process Element ...................... 26
Figure 12: Models in the Comprehensive Reuse Model for COTS Product Reuse ........ 33
Figure 13: Contextual Reusability Metrics - Asset Component Specification ............... 44
Figure 14: Research Approach ......................................................................................... 51
Figure 15: Research Timeline ........................................................................................... 53
Figure 16: COTS Interoperability Assessment Framework Interactions ...................... 56
Figure 17: COTS Interoperability Representation Attributes ........................................ 60

vii
Figure 18: COTS Interoperability Evaluation Process ................................................... 132
Figure 19: Integration Studio Tool Architecture ........................................................... 138
Figure 20: Integration Studio Interface Screenshot ...................................................... 141
Figure 21: Research Methodology for Experiments C1 & C2 ..........................................155
Figure 22: Experiments P1 & P2 - Dependency & Interface Analysis Accuracy ........... 164
Figure 23: Experiments P1 & P2 - Interoperability Assessment & Integration Effort .. 164
Figure 24: Experiment C1 - Dependency Analysis Accuracy ........................................ 168
Figure 25: Experiment C1 - Interface Analysis Accuracy .............................................. 169
Figure 26: Experiment C1 - Interoperability Assessment Effort ................................... 169
Figure 27: Experiment C2 - Dependency Analysis Results ........................................... 174
Figure 28: Experiment C2 - Interface Analysis Results ................................................ 174
Figure 29: Experiment C2 - Interoperability Assessment Effort Results ..................... 175
Figure 30: Experiments C1 & C2 - Dependency Analysis Accuracy .............................. 179
Figure 31: Experiments C1 & C2 - Interface Analysis Accuracy .................................... 180
Figure 32: Experiment C1 & C2 - Interoperability Assessment Effort .......................... 180
Figure 33: Experiment C1 - Case 1, Student Staff Directories ...................................... 208
Figure 34: Experiment C1 - Case 2, Technical Report System ..................................... 209
Figure 35: Experiment C1 - Case 3, Online Shopping System........................................ 211
Figure 36: Experiment C1 - Case 4, Customer Relations Management Tool ............... 212

viii
Figure 37: Experiment C1 - Case 5, Online Bibliographies ........................................... 214
Figure 38: Experiment C1 - Case 6, Volunteer Database .............................................. 216
Figure 39: Experiment C2 - Case 1, Science Data Dissemination System .................... 220
Figure 40: Experiment C2 - Case 2, EDRM System for Cancer Research .................... 224
Figure 41: Experiment C2 - Case 3, Business Data Processing System ......................... 228
Figure 42: Experiment C2 - Case 4, Back Office System .............................................. 230
Figure 43: Experiment C2 - Case 5, SimCity Police Department System..................... 232
ix
List of Tables
Table 1: BASIS - Interface Point Table............................................................................ 40
Table 2: BASIS - COTS Resolution Complexity Factors ................................................ 40
Table 3: General Attributes Definition for Apache Webserver 2.0 ............................... 65
Table 4: Interface Attribute Definition for Apache Webserver 2.0 ............................... 72
Table 5: Internal Assumption Attribute Definition for Apache Webserver 2.0 ........... 78
Table 6: Dependency Attribute Definition for Apache Webserver 2.0 ......................... 81
Table 7: Interoperability Assessment Rule Description ................................................ 84
Table 8: Binding Mismatch ............................................................................................ 86
Table 9: Control Interaction Mismatch ......................................................................... 87
Table 10: Custom Component Interaction Mismatch ................................................... 88
Table 11: Data Format Mismatch .................................................................................... 89
Table 12: Data Interaction Mismatch ............................................................................. 90
Table 13: Data Representation Mismatch ....................................................................... 91
Table 14: Error Interaction Mismatch ............................................................................ 92
Table 15: Synchronization Mismatch ............................................................................. 94
Table 16: Layering Constraint Violation Mismatch ....................................................... 95
Table 17: Unrecognizable Trigger Mismatch ................................................................. 95
x
Table 18: Lack of Triggered Spawn ................................................................................. 96
Table 19: Unrecognized Triggering Event Mismatch .................................................... 96
Table 20: Trigger Forbidden Mismatch ......................................................................... 97
Table 21: Data Connection Mismatch ............................................................................ 98
Table 22: Shared Data Mismatch ................................................................................... 98
Table 23: Triggered Spawn Mismatch ............................................................................ 99
Table 24: Single Node Mismatch .................................................................................... 99
Table 25: Resource Overload Mismatch ....................................................................... 100
Table 26: Triggering Actions Mismatch ......................................................................... 101
Table 27: Inactive Control Component Deadlock Mismatch ........................................ 101
Table 28: Inactive Control Components Mismatch ..................................................... 102
Table 29: Single-Thread Assumption Mismatch .......................................................... 103
Table 30: Cyclic Component Mismatch ........................................................................ 104
Table 31: Underlying Platform Mismatch ..................................................................... 104
Table 32: Encapsulation Call Mismatch ........................................................................ 105
Table 33: Encapsulation Spawn Mismatch.................................................................... 106
Table 34: Private Data Mismatch .................................................................................. 106
Table 35: Multiple Central Control Unit Mismatch ..................................................... 107
Table 36: Reentrant Data Sharing Mismatch ................................................................ 107

xi
Table 37: Reentrant Data Transfer Mismatch ............................................................... 108
Table 38: Non-Entrant Call Mismatch .......................................................................... 109
Table 39: Non-Reentrant Spawn Mismatch .................................................................. 109
Table 40: Prioritized Component Mismatch ................................................................. 110
Table 41: Prioritized Node Sharing Mismatch ............................................................... 110
Table 42: Backtracking Call/Spawn Mismatch ............................................................... 111
Table 43: Backtracking Data Transfer Mismatch .......................................................... 112
Table 44: Backtracking Shared Data Mismatch ............................................................ 112
Table 45: Predictable Call Response Time Mismatch ................................................... 113
Table 46: Predictable Spawn Response Time Mismatch ............................................... 114
Table 47: System Reconfiguration Mismatch ................................................................ 114
Table 48: Synchronization Mechanism Mismatch ........................................................ 115
Table 49: Preemptable Call Mismatch ........................................................................... 116
Table 50: Preemptable Spawn Mismatch ....................................................................... 116
Table 51: Garbage Collector Mismatch ........................................................................... 117
Table 52: Encapsulation Instantiation Mismatch .......................................................... 118
Table 53: Data Sharing Instantiation Mismatch ............................................................ 119
Table 54: Different Response Time Granularity Mismatch........................................... 119
Table 55: Absolute Time Mismatch............................................................................... 120

xii
Table 56: Underlying Data Representation Mismatch .................................................. 121
Table 57: Resource Contention Mismatch ..................................................................... 121
Table 58: DBMS Heterogeneity Mismatch ................................................................... 122
Table 59: Inaccessible Shared Data Mismatch ............................................................. 122
Table 60: Distributed Control Units Mismatch ............................................................. 123
Table 61: Roll Forward Mismatch .................................................................................. 124
Table 62: Roll Back Error Mismatch ............................................................................. 124
Table 63: Error Handling Mismatch ............................................................................. 125
Table 64: Error Handling Synchronization Mismatch ................................................. 126
Table 65: Communication Dependency Mismatch ...................................................... 127
Table 66: Communication Incompatibility Mismatch ................................................. 127
Table 67: Execution Language Dependency Mismatch ............................................... 128
Table 68: Same Node Incompatibility Mismatch ......................................................... 129
Table 69: Underlying Dependency Mismatch .............................................................. 130
Table 70: False Positive & False Negative Mismatch Definition .................................. 146
Table 71: Validation Strategy & Experiments ................................................................ 149
Table 72: Experiments P1 & P2 Project Background ..................................................... 152
Table 73: Experiment C1 Student Distribution & Demographics..................................155
Table 74: Experiment C2 Student Distribution & Demographics ................................ 156

xiii
Table 75: Experiment C1 Case Description ................................................................... 157
Table 76: Experiment C2 Case Demographics .............................................................. 158
Table 77: Results for Experiment P1 & P2 ..................................................................... 160
Table 78: Results for Experiments P1 & P2 with Paired T-Test .................................... 162
Table 79: Cumulative Results for Experiments P1 & P2 ................................................ 163
Table 80: Experiment C1 Cumulative Results ............................................................... 165
Table 81: Experiment C1 On-Campus & Remote Subjects’ Results .............................. 166
Table 82: Experiment C2 Cumulative Results .............................................................. 170
Table 83: Experiment C2 On-Campus & Remote Subjects’ Results .............................. 171
Table 84: Distribution of False Positives & False Negatives in Cases ........................... 173
Table 85: Experiment C1 - Case 1 Results ...................................................................... 235
Table 86: Experiment C1 - Case 2 Results ..................................................................... 236
Table 87: Experiment C1 - Case 3 Results...................................................................... 236
Table 88: Experiment C1 - Case 4 Results ..................................................................... 237
Table 89: Experiment C1 - Case 5 Results ..................................................................... 237
Table 90: Experiment C1 - Case 6 Results ..................................................................... 238
Table 91: Experiment C2 - Case 1 Results ...................................................................... 239
Table 92: Experiment C2 - Case 1 Percentage Results ................................................. 240
Table 93: Experiment C2 - Case 2 Results .................................................................... 240
xiv
Table 94: Experiment C2 - Case 2 Percentage Results ................................................. 241
Table 95: Experiment C2 - Case 3 Results ..................................................................... 241
Table 96: Experiment C2 - Case 3 Percentage Results ................................................. 242
Table 97: Experiment C2 - Case 4 Results..................................................................... 242
Table 98: Experiment C2 - Case 4 Percentage Results ................................................. 243
Table 99: Experiment C2 - Case 5 Results..................................................................... 243
Table 100: Experiment C2 - Case 5 Percentage Results ............................................... 244
xv
List of Acronyms
ASCII American Standard Code for Information Interchange
BASIS Base Integration Software Integration System
CBA Commercial-Off-The-Shelf Based Applications
CBS Commercial-Off-The-Shelf Based Systems
COTS Commercial Off-The-Shelf
COCOMO Constructive Cost Estimation Model
COCOTS Constructive COTS Cost Estimation Model
CSE Center for Software Engineering
CSSE Center for Systems and Software Engineering (previously CSE)
DM Dependency Mismatch
DoF Degree of Freedom
EPIC Evolutionary Process for Integrating COTS-Based Systems
FDD Flight Dynamics Division
FTP File Transfer Protocol
GOTS Government Off-The-Shelf
HTML HyperText Markup Language
HTTP HyperText Transfer Protocol
IRR Inception Readiness Review
IAM Internal Assumption Mismatch
IM Interface Mismatch
IOC Initial Operational Capability
JAR Java ARchive
JDBC Java Database Connectivity
JPEG Joint Photographic Experts Group
LCO Life Cycle Objective
LCA Life Cycle Architecture
MP3 Moving Picture Experts Group, Layer-3 file format
NASA National Aeronautics and Space Administration

xvi
NRC National Research Council (Canada)
ODBC Open DataBase Connectivity
OTS Off-The-Shelf
PHP Hypertext PreProcessor
ROTS Research Off-The-Shelf
SEI Software Engineering Institute
TRR Transition Readiness Review
USC University of Southern California
UTF Unicode Transformation Format
xvii
Abstract
Software systems today are frequently composed from prefabricated commercial
components that provide complex functionality and engage in complicated
interactions. Such projects that utilize multiple commercial-off-the-shelf (COTS)
products often confront interoperability conflicts resulting in budget and schedule
overruns. These conflicts occur because of the incompatible assumptions made by
developers during the development of these products. Identification of such conflicts
and planning strategies to resolve them is critical for developing such systems under
budget and schedule constraints. Unfortunately, acquiring information to perform
interoperability analysis is a time-intensive process. Moreover, increase in the
number of COTS products available to fulfill similar functionality leads to hundreds
of COTS product combinations, further complicating the COTS interoperability
assessment activity.
This dissertation motivates, presents and validates an intelligent assessment and
resolution framework for Commercial-Off-The-Shelf (COTS) incompatibilities. The
framework can be used to perform high-level and automated interoperability
assessment to filter out COTS product combinations whose integration will not be
feasible within project constraints. The framework efficiently and effectively captures
knowledge on COTS product interoperability and allows a user to automatically
leverage this knowledge to perform interoperability assessment. The framework
elements have been utilized to develop an interoperability assessment tool –
Integration Studio.

xviii
This framework is empirically validated using controlled experiments and project
implementations in 25 projects from small, medium and large network centric
systems from diverse business domains. The empirical evidence consistently indicates
an increase in interoperability assessment productivity by about 50% and accuracy by
20% in small and medium systems.

1
Chapter 1
Introduction
1.1 Research Context and Motivation
Economic imperatives are changing the nature of software development processes to
reflect both opportunities and challenges of using Commercial-Off-The-Shelf (COTS)
products. Processes are increasingly moving away from the time-consuming
development of custom software from lines of code towards assessment, tailoring,
and integration of COTS and other reusable components. [Boehm et. al 2003b] [Yang
et al. 2005]. COTS-based systems provide several benefits such as reduced upfront
development costs, rapid deployment, and reduced maintenance and evolution costs.
These considerations entice organizations to piece together their software systems
with pre-built components.
This advent of COTS-based development has not occurred overnight. Fred Brooks in
his essay "No Silver Bullet: Essence and Accidents of Software Engineering" [Brooks
1987] presents the concept of ‘Buy vs. Build.’ In his essay Brooks describes the notion
as ‘the most radical possible solution for constructing software is to not construct it at
all.’ Brooks claims that this trend of buying vs. building has become a preferred
method due to the reduced hardware costs. Earlier an organization could afford an
additional $250,000 for a sophisticated payroll system for their two million dollar

2
machine. Now however, a buyer of $50,000 office machine(s) cannot afford such a
customized payroll program. Instead the buyer modifies his own business process to
suit the processes supported by vendor provided commercial software.
Figure 1: COTS-Based Applications Growth Trend in USC e-Services Projects
Figure 1 illustrates data collected from five years of developing e-service applications
at the University of Southern California, Center for Systems and Software Engineering
[USC CSSE 1995]. The data reveals an increasing number of COTS-Based Applications
(CBA): from 28% in 1997 to 70% in 2002 [Boehm et al. 2003] [Boehm et al. 2003b] (see
Figure 1). Standish group’s 2000 survey found similar results in the industry (54% -
indicated by a * in Figure 1) [Standish 2001]. At USC the major considerations for
adopting COTS products in these projects were: 1) clients’ request, 2) schedule
constraint, 3) compliance with organization standards, and 4) budget constraints. The
primary reason for growth in COTS content however, has been attributed to the large
increase in COTS products available in the market. In 1997, most teams programmed
0
10
20
30
40
50
60
70
80
1997 1998 1999 2000 2001 2002
Percentage
Year

their own search engines or shopping carts, by 2002 these functions were being
accomplished by COTS products. 2000
COCOTS [Boehm et al
development effort –
trends for USC e-service pr
Figure 2 and Figure 3 res
Figure 2: COTS
Figure 3: COTS-Based Effort Distribution of COCOTS Calibration Data
0%
20%
40%
60%
80%
100%
1 2 3
0%
20%
40%
60%
80%
100%
1 2 3
their own search engines or shopping carts, by 2002 these functions were being
OTS products. 2000 – 2002 USC e-services data and
COCOTS [Boehm et al. 2000] calibration data reveal three major sources of COTS
assessment, tailoring and glue code. The effort distribution
service projects and for COCOTS calibration data are shown in
respectively.
: COTS-Based Effort Distribution of USC e-Services Projects
Based Effort Distribution of COCOTS Calibration Data
4 5 6 7 8 9 10 11 12 13 14 15
Assessment Tailoring Glue Code
3 4 5 6 7 8 9 10 11 12 13 14 15
Assessment Tailoring Glue Code
3
their own search engines or shopping carts, by 2002 these functions were being
ervices data and 1996-2001
three major sources of COTS
assessment, tailoring and glue code. The effort distribution
ojects and for COCOTS calibration data are shown in
Services Projects
Based Effort Distribution of COCOTS Calibration Data
15 16 17
15 16 17

4
COTS-Based Application (CBA) development involves three major COTS-related
phases in addition to many of the traditional development activities: COTS
assessment, COTS tailoring, and COTS glue-code (also called glueware) development.
An ideal CBA development project with well-defined objectives, constraints and
priorities (OC&Ps) will undergo the process of COTS selection (assessment), COTS
adaptation and configuration (tailoring) and integration (glue-code) development.
However reality is far from ideal circumstances. COTS-based projects often face
significant budget and schedule overruns due to interoperability conflicts amongst
various COTS products.
The first such example of interoperability conflicts was documented by David Garlan
in [Garlan et al. 1995] when attempting to construct a suite of architectural modeling
tools using a base set of 4 reusable components. A project that was estimated to be
implemented in six months and one person-year, in reality took two years and 5
person years of effort. They referred to these conflicts as architectural mismatches
and found that it occurs due to conflicting assumptions that a COTS component
makes about the structure of the application in which it is to appear. Sullivan and
Knight faced some similar problems in [Sullivan and Knight 1996], when they were
attempting to build a tool for supporting the analysis of fault trees. In analyzing the
problems encountered, Garlan et al. identified four major forms of architectural
mismatches: component assumptions, connector assumptions, topology assumptions,
and construction process assumptions. Extending this research is the dissertation
work of Ahmed Abd-Allah [Abd-Allah 1996] and Cristina Gacek [Gacek 1998] where
they propose a set of 14 conceptual features and identified 46 mismatches across six

5
connector types. Mary Shaw in [Shaw 1995] defines a sub-problem of architectural
mismatch – packaging mismatches. Packaging mismatch occurs when “components
make different assumptions about how data is represented, about nature of the
system interaction, about specific details in interaction protocols, or about decisions
that are usually explicit.” Robert DeLine further expands the work done by Mary Shaw
in [DeLine 1999] and introduces 7 aspects that define component packaging. He
further catalogues several resolution techniques that can be used to resolve such
mismatches.
The best known solution to identifying architectural mismatches is prototyping COTS
interactions as they would occur in the conceived system. Unfortunately, such an
approach is extremely time and effort intensive. To compound this issue, the number
of COTS packages available in the market is rapidly increasing. Consider an
undertaking to develop entertainment portal for providing on-demand audio, video
and books. Minimally the solution would require a content management system, a
relational database system, digital rights management system and media encoding
system. A brief Internet search found that there were at least 42 relational database
systems, over 100 content management systems, 21 digital rights management
systems, and 44 streaming media encoding systems. The number of possible
architectural combinations this can produce is overwhelming for any development
effort (even after removing several combinations outright due to support constraints).
This excessive analysis cost often compels the developers, in the interest of limited
resources, to either neglect the interoperability issue altogether and hope that it will
not create problems during system integration, or neglect interoperability until late in

6
the COTS selection phase of the project when the number of COTS options available
have been significantly reduced based on high and low priority functional criteria as
illustrated in Figure 4 [Ballurio et al. 2003]. Both these options add significant risk to
the project. When interoperability assessments are neglected they risk writing a
significant amount of glue code to integrate the selected components, increasing
project effort. Otherwise, they risk omitting a COTS product combination that is easy
to integrate, but just “isn’t right” because of some low-priority functionality it did not
possess.
Figure 4: Reduced Trade-Off Space
1.2 Research Statement and Hypotheses
The preceding motivating problem leads to the following question that frames the
problem area for this research:
How can development teams evaluate COTS-based architectures to select the best
COTS product combination which can be integrated within the effort constraints of the
project?

7
In the above question best implies that the solution developed using the COTS
product combination, if deployed on time and within budget, will produce maximum
value for the planned software application.
In this dissertation, selection of COTS products based on functional criteria is not the
question or part of it. There are several frameworks that will enable functional
assessments such as [Albert and Brownsword 2002] [Boehm et al. 2003b] [CODASYL
1976] [Comella-Dorda et al. 2003] [Dowkont et al. 1967] and [Glib 1969]. What is in
question is the ability to trade-off between functional criteria and integration effort –
for selecting the best option that will require minimal (or feasible) integration effort.
This dissertation makes a primary logical assumption that a COTS combination with
minimal interoperability conflicts takes less effort to integrate over a combination that
has greater number of interoperability conflicts. Taking this assumption into account
the fundamental research question can be answered by a framework that can:
• Identify interoperability conflicts which can occur in a COTS-based
architecture.
• Identify such conflicts by applying significantly less effort than prototyping or
other interoperability assessment methods.
• Perform this assessment at an extremely early phase in the system
development cycle.
The existing interoperability conflict identification frameworks have been developed
for composition of custom components and sub-systems [Abd-Allah 1996] [Davis et
al. 2002] [Gacek 1998]. To identify interoperability conflicts in COTS-based

8
architectures, this dissertation adapts and extends these existing frameworks so that
they are applicable under constraints set by COTS-based architectures. In addition,
the experience in assessing COTS-based architectures has shown that a significant
amount of effort can be expended in identifying interoperability characteristics of a
COTS product [Bhuta and Boehm 2007] [Bhuta et al. 2007]. The interoperability
assessment effort can be significantly reduced if the COTS product interoperability
characteristics, once identified, are reused across multiple projects. Furthermore,
automating such interoperability evaluation can increase assessment accuracy and
decrease assessment effort.
This argument brings up the statement of purpose for this research:
To develop an efficient and effective COTS interoperability assessment framework by:
1. Enhancing existing research on COTS interoperability conflicts,
2. Introducing new concepts for representing COTS product interoperability
characteristics,
3. Synthesizing 1 and 2 above to develop a comprehensive framework for
performing interoperability assessment early in the system development cycle.
This research defines an efficient framework as one that provides results with minimal
effort, and effective as a framework that produces the desired effect i.e. identifies COTS
interoperability mismatches to avoid surprises during the COTS integration phase.
A successful product of this research is a framework that can perform intelligent
(automated) assessment of COTS-based architectures. The combination of

9
automation and COTS interoperability characteristic reuse enables development
teams to carry out assessments in as early as the inception phase of the project
[Boehm 1996] with minimal assessment effort over performing this assessment
manually.
This framework leverages upon work done by [Abd-Allah 1996] [DeLine 1999] [Gacek
1998] and [Mehta 2001] to define a set of attributes that can be used to represent
COTS product interoperability characteristics. Attributes are selected so that they are
high-level enough so as to not expose the inner workings of COTS products, making
it possible for COTS vendors to provide such information. Furthermore, the
framework defines a set of interoperability assessment rules that given a COTS-based
architecture and COTS interoperability characteristics, can identify interoperability
mismatches and recommend appropriate integration strategies to resolve these
mismatches. Finally, this work defines a guided process that can be manually
executed or automated to perform interoperability analysis. Upon completion of
analysis the framework will output a report that will:
• Provide a list of interface, (potential) internal assumption, and dependency
interoperability mismatches,
• Recommend connectors (both inbuilt and third-party packages) that can be
used to integrate the COTS in the specified architecture, and
• Recommend the type(s) of glueware, or off-the-shelf connectors required to
integrate the COTS products.

10
The above results and past integration knowledge will allow the development team to
identify integration risks and the amount of glue code required to integrate the
COTS-based system. The lines of glue-code required can serve as an input to cost
estimation models such as COCOTS [Abts 2004] to identify COTS glue code
development effort. Additionally the report will help them build test cases to evaluate
when prototyping for the final selection of COTS product set.
This research, based on the above discussions, defines the following null hypothesis
to validate the utility of this work:
For COTS-Based development projects with greater than or equal to 3 interacting COTS
products in their deployment architectures, the mean accuracy, assessment effort, and
integration effort will not differ between groups that will use this framework for COTS
interoperability assessment, and those that will perform the assessment using existing
interoperability assessment technologies.
Existing technologies in the above hypothesis imply the existing state of practice
interoperability assessment methods (manual assessment) and existing state of art
interoperability assessment methods (combination of several independently
developed technologies that evaluate distinct interoperability mismatch
characteristics).
This single large hypothesis is further reduced into four mini individually provable (or
disprovable) null hypotheses:

11
Individual Hypothesis 1 (IH1): The accuracy of dependency assessment between the
two groups will not differ.
Individual Hypothesis 2 (IH2): The accuracy of interface assessment between the
two groups will not differ.
Individual Hypothesis 3 (IH3): The effort for integration assessment between the two
groups will not differ.
Individual Hypothesis 4 (IH4): The effort for actual integration between the two
groups will not differ.
IEEE defines accuracy as a quantitative measure of the magnitude of error [IEEE
1990]. Based on the above definition:
Accuracy of dependency assessment = 1 – (number of unidentified dependencies/total
number of dependencies)
Accuracy of interface assessment = 1 - (number of unidentified interface
mismatches/total number of interface mismatches)
In addition to these hypotheses the framework is analyzed with respect to the
number of false positive instances as: 1 – (number of false positive mismatches / total
number of mismatches)
The scope of this dissertation does not include performing analysis or recommending
connectors for quality of service requirements such as scalability, reliability or
security of communication. However the proposed framework is designed so that it is

12
easily extensible to address such requirements. It is also important to note that the
framework does not free the development team from prototyping the application. It
instead provides a high-level interoperability assessment extremely early in the
software development life cycle (Figure 5) enabling the development team to discard
options that require effort that is beyond their project constraints; and trade-off
amongst other COTS-based architecture options.
Figure 5: Framework’s High Return on Investment Area
1.3 Contributions
This dissertation provides a principled intelligent approach to perform
interoperability assessment of COTS-based architectures. The contributions of this
dissertation include:
1. Representation attributes, extended from previous works, to define
interoperability characteristics of a COTS product. These are 42 attributes
classified into four groups – general attributes (4), interface attributes (16),
internal assumption attributes (16) and dependency attributes (6).

13
2. A set of 62 interoperability assessment rules, also extended from previous
works, to identify interoperability mismatches in COTS-based architectures.
These rules are classified into 3 groups – interface mismatch analysis rules (7),
internal assumption mismatch analysis rules (50), and dependency mismatch
analysis rules (5).
3. A guided process to efficiently implement the framework in practice.
4. An automated tool that implements 1, 2 and 3 in practice.
5. Integration of this technology with a real-world quality of service connector
selection in the area of voluminous data intensive connectors.
The hypotheses put forth by this dissertation have been examined and validated in
several controlled experiments in small and large systems; and project
implementations within small and medium e-services domain. These will be
presented later in this dissertation.
1.4 Definitions
This section will clarify a few definitions relevant to this work.
This dissertation adopts the Software Engineering Institute’s COTS-Based system
initiative’s definition [Brownsword et al. 2000] of a COTS Product as a product that is:
• Sold, leased, or licensed to the general public;
• Offered by a vendor trying to profit from it;
• Supported and evolved by the vendor, who retains the intellectual property rights;
• Available in multiple identical copies;

14
• Used without source code modification.
In addition to commercial off-the-shelf products other types of off-the-shelf (OTS)
products include Government off-the-shelf (GOTS) products, Research off-the-shelf
(ROTS), and open source off-the-shelf products. This research includes GOTS, ROTS,
and open source software products within the COTS product definition.
This dissertation also follows the Software Engineering Institute in defining a COTS-
based system generally as “any system, which includes one or more COTS products.”
This includes most current systems including many, which treat a COTS operating
system and other utilities as a relatively stable platform on which to build
applications. Such systems can be considered “COTS-based systems,” as most of their
executing instructions come from COTS products, but COTS considerations do not
affect the development process very much. To provide a focus on the types of
applications for which COTS considerations significantly affect the development
process, COTS-Based Application (CBA) is defined as a system for which at least 30%
of the end-user functionality (in terms of functional elements: inputs, outputs,
queries, external interfaces, internal files) is provided by COTS products, and at least
10% of the development effort is devoted to COTS considerations. The numbers 30%
and 10% are approximate behavioral CBA boundaries observed in the application
projects [Boehm et al. 2003b].
The three effort sources from Figure 2 and Figure 3 are defined as follows:
COTS assessment is the activity whereby COTS products are evaluated and selected as
viable components for a user application.

15
COTS tailoring is the activity whereby COTS software products are configured for use
in a specific context [Meyers and Oberndorf 2001].
COTS glue-code (also called glueware) development is the activity whereby code is
designed, developed and used to ensure that COTS products satisfactorily
interoperate in support of user application. Certain glueware definitions such as in
[Keshav and Gamble 1998] include addition of new features and functionality as part
for glue-code development. However this work restricts the purpose of glue-code to
integrate components.
Various stages in the project life cycle have been explained using MBASE/RUP
inception, elaboration, construction and transition phases, and the life cycle objective
(LCO), life cycle architecture (LCA) and initial operational capability (IOC)
milestones [Boehm et al. 1999]. This dissertation utilizes the terms COTS packages,
COTS products and COTS components interchangeably. The terms interoperability
conflicts and interoperability mismatches are also used interchangeably.
1.5 Organization of the Dissertation
The remainder of this dissertation is organized as follows. Chapter 2 contains a
literature review of the problem space; this includes background and related work in
the areas of software architecture, COTS software selection processes and
frameworks, component mismatches, interoperability assessment, software connector
classification, COTS integration strategies and COTS cost estimation models. Chapter
3 describes the approach to research the central question of this dissertation. Chapter

16
4 provides an overview of the proposed framework and its elements. Chapters 5, 6
and 7 provide detailed description of each element. Chapter 8 describes an
implementation of this framework in the form of a graphical tool. Chapter 9 contains
the validation experiments and their results. Chapter 10 rounds out the dissertation
with conclusions and future work. The appendices of this dissertation contain a full
listing of questionnaires and other information related to the validation experiments.

17
Chapter 2
Background and Related Work
Several researchers have been working on component-based software development,
component integration; Commercial-Off-The-Shelf (COTS) based system
development and architecture mismatch analysis. The following section describes
some of these past efforts that relate to addressing the central question of this
dissertation.
2.1 Software Architecture
In [Medvidovic and Taylor 2000] authors have abstracted software systems into three
fundamental building blocks:
• software component: an architecture unit of computation or data store (these
may be small as a single procedure or large as an entire application),
• software connector: an architectural building block used to model interactions
and the rules that govern those interactions,
• software configuration: connected graphs of components and connectors that
describe architectural structure
Software components can be of two types:

18
• a data component models data used to store state or it is transferred across
data connectors, and
• a control component models data that is executed by the underlying machine
(also called code) and which can initiate and respond to data and control
transfers [Abd-Allah 1996].
Software interactions can involve data interactions which transmit data from one
component to another, or control interactions which transmit the control i.e. the
sequence of execution from one component to the other. This work leverages upon
the above definitions of architectural elements to characterize the integration of
Commercial-Off-The-Shelf (COTS) components.
2.2 COTS-based System Development Processes
There is a significant amount of literature that defines the risks of using COTS
components to develop software intensive systems, particularly in relation with
requirements definition, product evaluation, and the relationship between product
evaluation and system design [Carney 2001] [Basili and Boehm 2001]. Researchers
have proposed several process frameworks that address these risks. This subsection
will highlight a few such works to provide a context where the work presented in this
dissertation fits into the overall COTS-Based Application (CBA) development
processes.

19
2.2.1 UMD Waterfall Variant CBA Development Process
In [Morisio et al. 2000] researchers have investigated 15 COTS-based systems
development projects developed at the Flight Dynamics Division (FDD) at NASA,
which have been responsible for the development of ground control support software
for NASA satellites. Over 30 different COTS packages were used by the 15 projects. A
minimum of 1 or 2 COTS components and a maximum of 13 COTS components were
integrated in a single project. Based on the risks and issues identified in the actual
NASA FDD process including unavailable, incomplete or unreliable documentation
and COTS incompatibilities during upgrades cycles; researchers identified a new
COTS development process shown in Figure 6.
The proposed waterfall variant process recommends performing a detailed feasibility
study to make the ‘buy vs. build’ decision. This includes developing a complete
requirements definition, a high level architecture, effort estimation and a risk
assessment model. Unfortunately the study has no support for identifying inter-
component incompatibilities and required integration effort. It instead recommends
that the architecture developed will allow the team to sketch dependencies,
incompatibilities and integration effort using methods in [Yakimovich et al. 1999a]
and [Yakimovich et al. 1999b]. These methods and their shortfalls with respect to
addressing the central question of this dissertation will be elaborated later in this
section.

20
Figure 6: University of Maryland (UMD) Waterfall Variant CBA Process
2.2.2 Evolutionary Process for Integrating COTS-Based Systems
Researchers in [Albert and Brownsword 2002] at the Software Engineering Institute
have proposed a process framework - Evolutionary Process for Integrating COTS-
Based Systems (EPIC) that utilizes the risk-based spiral development process for
developing COTS-Based Systems. This process is shown in Figure 7.
EPIC identifies four major process drivers: stakeholder needs and business processes,
market place, architecture and design elements, and programmatic and risk.
• Stakeholder needs and business processes which denote requirements, end-
user business processes, business drivers, and operational environment,
• Market place which denotes available and emerging COTS technology and
products, non-developmental items, and operational environments,
• Architecture and design elements which denote the essential elements of the
system and the relationships between them, and

21
• Programmatic and risk elements, which denote the management aspects of
the project.
Figure 7: Evolutionary Process for Integrating COTS-Based Systems
According to EPIC these process drivers are major spheres of influence that must be
concurrently and iteratively defined and traded during through the life-cycle of the
project because a decision in one of the spheres reduces the available trade space and
can constrain decisions made in other spheres. As the project proceeds the knowledge
about the stakeholder needs, capabilities, candidate components, architectural
alternatives, implications of components to stakeholder needs, and planning
necessary to implement and field the solution increase. With the accumulating
knowledge the stakeholders confirm and increase their buy-in and commitment to
the evolving definition of the solution. Unfortunately the framework as described in
[Albert and Brownsword 2002] has minimal process support for identifying
interoperability related issues when selecting COTS components. It merely provides a
set of questions with relation to the interoperability of components to aid the data
gathering effort. These questions include:

22
• Data model/format
o What data model and formats does the component employ?
o Are they published?
o What standard are they based on?
o What other components support the same data model/formats?
• Support for data access
o What interfaces or techniques are available to access component data?
o What effort is required to access component data?
o Is the granularity of data access appropriate for the target system?
• Support for control
o Can the component be invoked by other applications? How?
o At what granularity can the component be invoked?
o Can other components control low-level functions that might be
necessary in the integrated system (for example, commit for a
change)?
o Can the component invoke other applications? How?
o What constraints are placed on these invocations?
o How can execution of the component and other components be
synchronized?
o What timing concerns may arise?
• Infrastructure utilized
o What infrastructure is used to support communications of messages,
data, and control sequencing within the component?

23
o Can the infrastructure be used by other system components to interact
with the component?
The knowledge accumulated using these questions while definitely helpful is
significantly incomplete. These questions do not address several major
interoperability concerns such as those illustrated in [Garlan et al. 1995] and neither
does the process provide any guidance on how this knowledge can be used to analyze
a COTS-based architecture. Additionally the process does not account for the
significant effort expended as a result of a large number of COTS components
available in the software marketplace for any given function.
2.2.3 Process for COTS Software Product Evaluation
In [Comella-Dorda et al. 2003] researchers from the Software Engineering Institute
and National Research Council, Canada have proposed a COTS product evaluation
process – PECA, derived from ISO 14598 [ISO/IEC 14598-1 1999].
Figure 8: Process for COTS Product Evaluation

24
The proposed process consists, of four basic elements: planning the evaluation,
establishing the criteria, collecting and analyzing the data. The interactions between
these elements are highlighted in Figure 8. It begins with initial planning for
evaluating COTS components and concludes with a recommendation to the decision-
maker. The elements of the process are not executed sequentially; instead the process
is re-entrant reacting to changes in the evaluation circumstances. The process
unfortunately has little guidance on evaluation of COTS interoperability. It cautions
that the selection of one COTS component restricts the choice of others so that they
are interoperable with the already selected COTS; however provides no direction on
how one could perform such an analysis.
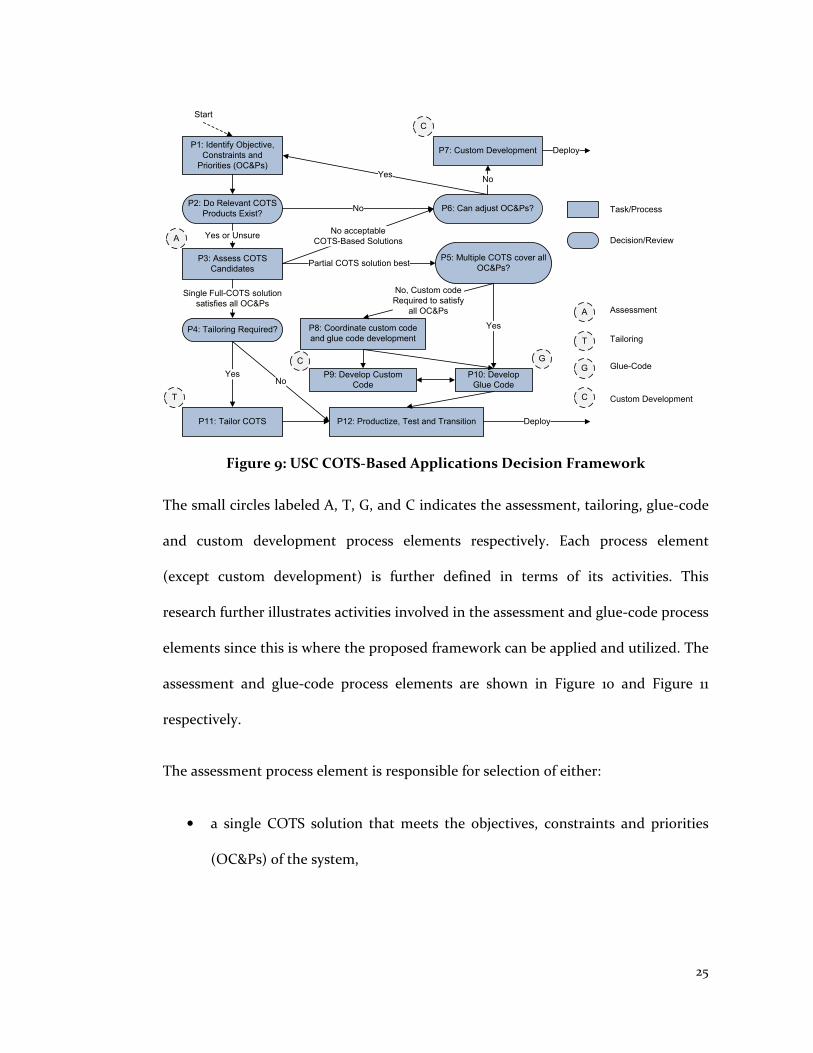
2.2.4 USC CBA Decision Framework
Researchers from the University of Southern California (USC), Center for Systems and
Software Engineering (formerly Center for Software Engineering) have proposed a
risk-driven spiral generated decision framework for developing COTS-Based
Applications (CBA) in [Boehm et al. 2003b]. The framework is further elaborated in
[Yang et al. 2005] and [Yang 2006]. The proposed framework illustrated in Figure 9
defines dominant decisions and activities within the CBA development.
The CBA process is undertaken by ‘walking’ a path from ‘start’ to ‘deploy’ that
connects (via arrows) activities as indicated by boxes and decisions that are indicated
as ovals. Activities produce information that is passed as an input to other activities
or used to make a decision. It is possible in this framework to perform multiple
activities simultaneously (e.g. developing custom application code and glue-code).
25
P1: Identify Objective,
Constraints and
Priorities (OC&Ps)
P2: Do Relevant COTS
Products Exist?
P3: Assess COTS
Candidates
P4: Tailoring Required?
Single Full-COTS solution
satisfies all OC&Ps
Yes or Unsure
P6: Can adjust OC&Ps?No
No acceptable
COTS-Based Solutions
P5: Multiple COTS cover all
OC&Ps?Partial COTS solution best
P7: Custom Development
NoYes
P10: Develop
Glue Code
P8: Coordinate custom code
and glue code development
P9: Develop Custom
Code
No, Custom code
Required to satisfy
all OC&Ps
Yes
P11: Tailor COTS P12: Productize, Test and Transition
YesNo
Deploy
Deploy
A
T
G
Task/Process
Decision/Review
A Assessment
T Tailoring
G Glue-Code
C
C
C Custom Development
Start
Figure 9: USC COTS-Based Applications Decision Framework
The small circles labeled A, T, G, and C indicates the assessment, tailoring, glue-code
and custom development process elements respectively. Each process element
(except custom development) is further defined in terms of its activities. This
research further illustrates activities involved in the assessment and glue-code process
elements since this is where the proposed framework can be applied and utilized. The
assessment and glue-code process elements are shown in Figure 10 and Figure 11
respectively.
The assessment process element is responsible for selection of either:
• a single COTS solution that meets the objectives, constraints and priorities
(OC&Ps) of the system,
26
• a partial COTS solution where a combination of multiple COTS components
or a combination of COTS components and custom development required to
meet the OC&Ps of the system, or
• a non-COTS solution where no COTS components are acceptable and pure
custom development is required to meet the OC&Ps of the system.
Figure 10: USC CBA Decision Framework - Assessment Process Element
Figure 11: USC CBA Decision Framework - Glue Code Process Element

27
In the event that a partial COTS solution is selected during COTS assessment, the
glue-code process element guides the development team through the process of
developing the glue-code to integrate the selected COTS components. Unfortunately
this framework lacks any specific methodology that will guide the development team
in assessing a set of COTS components which can be integrated within the project’s
budget and schedule constraints. The work presented in this dissertation will extend
this framework to add such an assessment process. The proposed methodology can be
applied during the initial filtering (A2) and detailed assessment (A3) activities in the
assessment process element (Figure 10). It will assist the developers in estimating the
effort required to integrate a set of COTS components, in turn eliminating COTS
choices whose integration may not be feasible within project constraints.
Furthermore, the architectural mismatch results provided by this work can be used to
design prototyping tests during the detailed assessment step (A3). In addition the
results produced will assist the developers to architect and design glueware (G1) in
the glue-code process element (Figure 11).
Similar to extending the capabilities of the USC CBA Decision framework, the
proposed methodology can be utilized to extend all the previously highlighted CBA
development frameworks. The UMD Waterfall Variant CBA (section 2.2.1)
development process could utilize this work to address the shortfalls in [Yakimovich
et al. 1999a] and [Yakimovich et al. 1999b]. The EPIC framework (section 2.2.2) can
make use of this work instead of utilizing a questionnaire-based method to identify
mismatches. This will result in both reduction of effort to perform interoperability
analysis, and increase in accuracy of the analysis results. The PECA framework
28
(section 2.2.3) can add the proposed methodology as part of their data collection and
analysis process to assess the effort required to integrate a set of COTS components.
2.3 Component Mismatches
In [Garlan et al. 1995] researchers defined the problem of architectural mismatch as a
mismatch that occurs where a reusable part makes conflicting assumptions about the
structure of the application in which it is to appear. They confronted this problem
during the development of a software architecture-modeling tool using a set of four
off-the-shelf products. The project which was estimated to take six months and one
person-year of effort, took two years and 5 person-years of effort. In spite of this
considerable effort performance of the system was unsatisfactory and several parts of
the system were hard to maintain without detailed, low-level understanding of
implementations. Based on their experience the authors classify four major forms of
architectural mismatches: component assumptions, connector assumptions, topology
assumptions, and construction process assumptions. Complementary to Garlan et
al.’s research, was work done by Ahmed Abd-Allah [Abd-Allah 1996] and Cristina
Gacek [Gacek 1998]. Both these works investigate the problem of architectural
mismatch when composing systems (and their subsystems). They define a set of
conceptual features which can be used to define an architectural style in order to
detect architectural mismatches. Cristina Gacek extended the work done by Ahmed
Abd-Allah [Abd-Allah 1996] by increasing the conceptual features set proposed by
Abd-Allah (marked with *) from seven to fourteen, as well as refining some features
initially proposed by Abd-Allah (marked with ⁺). These features include:

29
• Concurrency* - the number of concurrent threads that may execute within a
system.
• Distribution* - system entities are distributed across multiple nodes.
• Dynamism⁺ - if a system allows for changes in its control topology while it is
running.
• Encapsulation⁺ - ability of providing the users with a well-defined interface to
a set of functions (or objects) in a manner which hides their internal workings.
• Layering* - systems are organized hierarchically, each layer providing a virtual
machine to the layer immediately above it, and serving as a client to the layer
immediately below it.
• Supported data transfers⁺ - data transfer mechanisms a system supports.
• Triggering capability*- mechanisms that initiate specific interaction when
certain events occur.
• Backtracking - a scheme for solving a series of sub-problems, each may have
multiple possible outcomes and where the outcome chosen for one sub-
problem may affect outcomes of later sub-problems; to solve the overall
problem, find a solution to the first problem and then attempt to recursively
solve the other sub-problems based on this first solution.
• Control unit – mechanisms of execution ordering in a system.
• Component priorities – support for priorities in execution of tasks, where
some tasks have a higher priority over other tasks.
• Preemption – systems where the scheduler can interrupt and suspend a
currently running task in order to start or continue running another task.

30
• Reconfiguration – support for performing online reconfiguration in the event
of a failure (or special conditions), or if an offline intervention is required to
perform reconfiguration.
• Reentrance – if the system has multiple simultaneous, interleaved, or nested
invocations that will not interfere with each other.
• Response times - if the system requires that the response for certain events be
predictable, bounded or even unbounded.
Using the fourteen conceptual features, they identified 46 architecture mismatches
across six connector types: call, spawn, data connector, shared data, trigger, and
shared resource. This work has drawn significantly from this work on architectural
mismatches.
Mary Shaw in [Shaw 1995] defined the problem of packaging mismatch. Packaging
mismatch occurs when “components make different assumptions about how data is
represented, about the nature of system interactions, about specific details in
interaction protocols, or about decisions that are usually explicit.” Robert DeLine
expands the work by Mary Shaw in [DeLine 1999]. He defines the packaging
mismatch problem as: “when one or more of a component’s commitments about
interaction with other components are not supported in the context of integration.”
In the same work he identifies a set of aspects, which define component packaging.
These aspects include:
• Data representation – for two components to transfer or share a data item
they need to agree on its representation.

31
• Data and control transfer – for two components to transfer data or control
they must agree on mechanism to use and direction of transfer.
• Transfer protocol – for two components to interact they must agree on the
overall protocol for transferring data and control.
• State persistence – a component may vary in degree to which it retains state.
• State scope – a component may vary in the amount of its internal state it
allows other components to affect.
• Failure – component vary in the degree to which they tolerate interactions
that fail.
• Connection establishment – component’s packaging includes the details of
how the interaction mechanisms are setup and torn down.
DeLine further described a set of mismatch resolution techniques that can be used to
resolve such packaging mismatches. These techniques will be described later in this
section. Analysis of packaging mismatches and recommending resolution forms an
essential part of this work. This research utilizes the work on packaging mismatch in
defining of COTS representation attributes.
2.4 Component Interoperability Assessment
Several researchers, in addition to Ahmed Abd-Allah and Cristina Gacek have
presented models and frameworks to resolve the component interoperability
problem. This section will highlight the results of these past efforts.
32
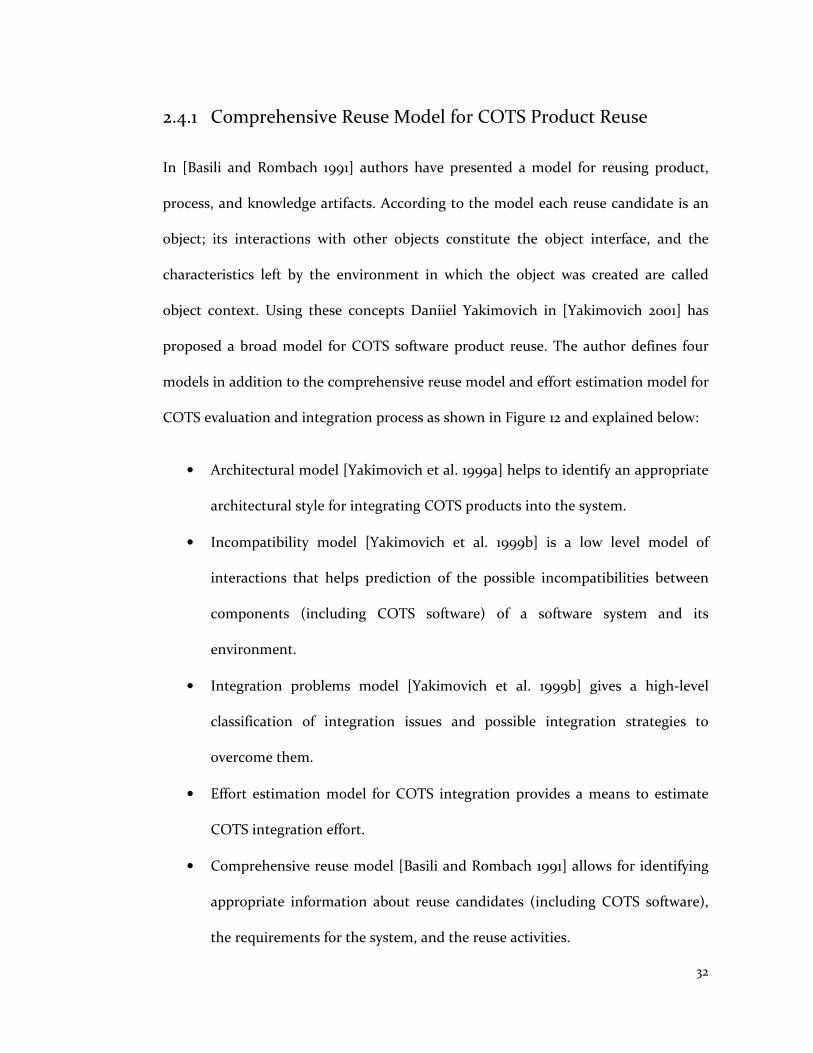
2.4.1 Comprehensive Reuse Model for COTS Product Reuse
In [Basili and Rombach 1991] authors have presented a model for reusing product,
process, and knowledge artifacts. According to the model each reuse candidate is an
object; its interactions with other objects constitute the object interface, and the
characteristics left by the environment in which the object was created are called
object context. Using these concepts Daniiel Yakimovich in [Yakimovich 2001] has
proposed a broad model for COTS software product reuse. The author defines four
models in addition to the comprehensive reuse model and effort estimation model for
COTS evaluation and integration process as shown in Figure 12 and explained below:
• Architectural model [Yakimovich et al. 1999a] helps to identify an appropriate
architectural style for integrating COTS products into the system.
• Incompatibility model [Yakimovich et al. 1999b] is a low level model of
interactions that helps prediction of the possible incompatibilities between
components (including COTS software) of a software system and its
environment.
• Integration problems model [Yakimovich et al. 1999b] gives a high-level
classification of integration issues and possible integration strategies to
overcome them.
• Effort estimation model for COTS integration provides a means to estimate
COTS integration effort.
• Comprehensive reuse model [Basili and Rombach 1991] allows for identifying
appropriate information about reuse candidates (including COTS software),
the requirements for the system, and the reuse activities.

33
• COTS activity model describes the whole COTS reuse process by augmenting
the software development life cycle with COTS-specific activities.
COTS Activity Model
Integration Problems ModelComprehensive Reuse
Model Effort Estimation Model
Architectural Model Incompatibility Model
Figure 12: Models in the Comprehensive Reuse Model for COTS Product Reuse
The architectural model presented in [Yakimovich et al. 1999a] provides a set of
variables to estimate the incompatibility between the system architecture and
components. These variables include component packaging, type of control,
information flow, synchronization, and component binding. Various architecture
styles (pipe and filters, event system, etc) are defined using the above variables and
component properties analyzed with those to identify the incompatibilities.
The incompatibility model presented in [Yakimovich et al. 1999b] provides a
classification of COTS incompatibilities. According to the model there are two major
causes of incompatibilities in COTS software interactions: syntax and semantic-
pragmatic. Syntax defines the representation of syntax rules of interaction, while
semantic-pragmatic defines the functional specifications of the interaction. Syntactic
incompatibilities may be caused by syntactic differences between two components.
Semantic-pragmatic incompatibilities can occur either by just one component, two
34
mismatching components, or three or more conflicting components. The semantic-
pragmatic incompatibilities are further typed as:
• 1-order semantic-pragmatic incompatibility or internal problem: if a
component alone has an incompatibility disregarding the components it is
interacting with. It means that the component either does not have the
required functionality (not matching the requirements) or its invocation can
cause a failure (an internal fault).
• 2-order semantic-pragmatic incompatibility or a mismatch: if an
incompatibility is caused by interaction of two components.
• N-order semantic-pragmatic incompatibility: if the incompatibility is caused
by interaction of several components.
The incompatibility model uses the above classification and identifies various
incompatibilities across the system (hardware and software) and environment
(development and target) related components.
The integration problems model presented in [Yakimovich 2001] provides strategies
that can be used for resolving component incompatibilities. These strategies include
tailoring, modification, re-implementation, glueware development, architectural
changes and architectural style changes. The model further identifies five types of
integration problems: functional problems, non-functional problems (e.g.
performance, portability, etc), architecture style problems, architectural problems,
and interface problems. The integration problems model uses the variables in the

35
architectural model and the classification in the incompatibility model to identify the
integration strategies that can be applied to build the system.
The comprehensive reuse model for COTS software products in [Yakimovich 2001]
provides a good overall approach for developing systems with COTS components.
However the integration strategies are recommended at extremely high-level and
require manual analysis for incompatibility identification within specific software
intensive architectures. Moreover several integration strategies recommended by
these models such as modification violate the definition of COTS and COTS-reuse.
The widely accepted definition in [Brownsword et al. 2000] defines a COTS as
software that is used without source code modification. The work presented in this
dissertation is focused upon 2nd order and to a limited extent the nth order semantic-
pragmatic incompatibilities and recommends a more detailed analysis of glueware
and/or connectors required to resolve those incompatibilities.
2.4.2 Notation for Problematic Architectural Interactions
In [Davis et al. 2001] researchers have presented a notation for representing
architectural interactions. These have been further elaborated in [Davis et al. 2002].
The goal of this work is to perform a multi-phase pre-integration analysis process for
component-based systems, which utilizes a simple notation to describe the
problematic interactions manifested in the integration. To do so, researchers have
defined a set of 21 characteristics to define components characteristics for identifying
problematic component interactions. These characteristics are classified at three
levels:

36
• Orientation level (represented by °) embodies most coarse grained information
to describe both application requirements and participating components.
• Latitude level (represented by ⁺) outlines a finer-grained description of a
component system that delineate where and how communication moves
through a system.
• Execution level (represented by *) provides the execution details of the
component pertaining to aspects of system implementation.
According to the authors information for orientation level characteristics should be
easy to obtain, even for COTS products. On the other hand information for latitude
level characteristics could be acquired from open source software. Finally the
execution level characteristics are detailed and require an understanding of the
source code. These characteristics include:
• Identity of components° - component’s awareness of the existence or identity
of those components with which it communicates [Sitaraman 1997].
• Blocking° - Whether a component suspends execution to wait for
communication [Kelkar and Gamble 1999].
• Module° - are loci of computation and state within a component (Each
module has an interface specification that defines its properties) [Shaw et al.
1995] [Shaw and Garlan 1996].
• Connector° - are the loci of relations among the modules. Each connector has
its protocol specification that defines its properties which include rules about
the type of interfaces it is able to mediate for, assurances about the properties
of the interaction, rules about the order in which the things happen, and the

37
commitments about the interaction [Allen and Garlan 1997] [Shaw et.al. 1995]
[Shaw and Garlan 1996].
• Control topology* – represents the geometric configuration of components in
a system corresponding to potential data exchange [Shaw and Clements 1997].
• Control flow⁺ – defines the way in which control moves between the modules
of a system [Allen and Garlan 1997].
• Control scope⁺ – defines the extent to which the modules internal to the
components within a system make their control available to other modules
[Kazman et al. 1997].
• Method of control communication* – refers to how control is delivered to
other modules [Barret et al. 1996].
• Control binding time* – time at which a control interaction is established
[Shaw and Clements 1997] [Shaw et al. 1995].
• Synchronicity* - defines the level of dependency of a module on another
module’s control state [Shaw and Clements 1997] [Shaw et al. 1995].
• Control structure* – represents the state of control and possibility of
concurrent execution [Sitaraman 1997].
• Concurrency* – defines the possibility that modules of a component can have
simultaneous control [Gacek 1998],
• Data topology* – represents the geometric configuration of modules in a
system corresponding to potential data exchange [Shaw and Clements 1997].
• Data flow⁺ – defines the way in which data moves between modules of a
system [Allen and Garlan 1997].

38
• Data scope⁺ – defines the extent to which the modules internal to the
component make their data available to other modules [Kazman et al. 1997].
• Method of data communication* – refers to how data is delivered to other
modules [Barret et al. 1996].
• Data binding time* - time at which a data interaction is established [Shaw and
Clements 1997].
• Continuity* – measures of the availability of data flow in the system [Shaw
and Clements 1997].
• Supported data transfer* – delineates the type and format of data
communication that a component supports as a precursor to actually
choosing a method to communicate [Abd-Allah, 1996].
• Data storage method* – defines how data is represented in a system
[Sitaraman 1997].
• Data mode⁺ –defines how data is communicated throughout the component
[Shaw and Clements 1997].
The researchers have also defined a set of problematic architectural interactions
[Davis et al. 2001]. They use the characteristics above to identify the problematic
architectural interactions and recommend the use of strategies in [Keshav and
Gamble 1998] and [Mehta et al. 2000] to resolve them. Furthermore they have
developed a tool ‘Collidescope’ [Collidescope 2005]. The tool provides a graphical user
interface where users can model component interactions. It allows users to select
values for 8 of the 21 characteristics described above, and analyzes the model to
identify 13 possible problematic architectural interactions.

39
This work relies on extremely detailed information, down to the understanding of the
source code, which makes it inappropriate for use on COTS-Based systems. Moreover
this work does not address certain details such as the deployment of the components
in the system nor does it report all the potential architectural mismatches addressed
in [Abd-Allah 1996][Gacek 1998], both of which would significantly affect decision-
making during COTS component and architecture selection. Furthermore the authors
claim that work done in [Keshav and Gamble 1998] and [Mehta et al. 2000] can help
users resolve the problematic architectural interactions, they do not provide any rules
to specify the types of connectors or integration strategies that would be applicable to
address a specific problematic architectural interaction. Research addressed in this
dissertation while similar to the work in [Davis et al. 2002] addresses problems
related COTS-based systems interoperability. In addition, this work also provides
some basic guidance on the strategies that can be used for integrating the COTS
components.
2.4.3 Base Application Software Integration System (BASIS)
In [Ballurio et al 2003] researchers from the Software Productivity Consortium (now
Systems and Software Consortium) propose a stepwise process for COTS evaluation.
The three steps of the Base Application Software Integration System process include:
• Component Evaluation Process – evaluates candidate components against
customer requirements,
• Vendor Viability Process – evaluated against criteria such as vendor maturity,
customer service, and cost/benefit ratio, and

40
• Difficulty Integration Index – calculates the amount of effort required to
integrate each of the products
These three steps constitute the filters through which COTS candidates are evaluated.
Candidates that pass through all three filters are considered for final evaluation and
decision-making. The work presented in this dissertation is related to the final step of
calculating the difficulty integration index.
Table 1: BASIS - Interface Point Table
COTS Product Name Mismatch Identification and Resolution Connection Indices
Interface Point Name
Interface Point Complexity
(IPC)
Mismatch ID Number
Resolution Name
Mismatch Resolution Difficulty
(MRD)
Connection Complexity Index (CCI)
Table 2: BASIS - COTS Resolution Complexity Factors
Type of Resolution Technique Relative Complexity
Bridge – Online 5
Bridge – Offline 4
Wrapper 6
Mediator 8
Negotiation - Unilateral 6
Negotiation - Bilateral 8
The difficulty of integration index is calculated by using information from an
interface point table illustrated in Table 1. This table is used to document analysis
information pertaining to mismatches and their resolution for interface points of the

41
COTS candidates. For each COTS product the following steps are required to be
performed in order to determine the difficulty of integration index:
1. Identify the component and its interfaces responsible for interactions allocate
a mnemonic for every interface represented by interface point name in the
interface point table (Table 1).
2. Define the interface point complexity (IPC) of the given interface using
metrics on coupling through abstract data types and message passing defined
by Wei Li in [Li 1998].
3. Identify the number of interactions the interface will support and for each
interaction and analyze them for mismatches using [Gacek 1998].
4. Identify a mismatch resolution method described in [DeLine 1999] to resolve
the mismatches.
5. Use the COTS resolution complexity factors from Table 2 corresponding to
the selected resolution technique as the mismatch resolution difficulty.
6. Calculate the connection complexity index for the interface point using the
interface point complexity and mismatch resolution difficulty.
7. The difficulty of integration index for a single COTS product is the average of
the connection complexity indices of its various interface points utilized.
Authors recommend that this difficulty of integration index can then be utilized in
the evaluation table as the final criteria for selecting a COTS product.
BASIS provides an appealing method of numerically calculating the difficulty of
integration to objectively compare COTS options. However there are several failings

42
of this method. Determining the interface point complexity requires knowledge of
the number of classes being used as abstract data types, or number of messages sent
out from a class to other classes. Obtaining this information will require a significant
knowledge of the COTS component interfaces and the architecture where it will be
used. Moreover the authors have no recommendation for calculating interface point
complexity where communication channel are streams or events. [Gacek 1998]
recommended by the authors to identify mismatches defines mismatches for an
interaction, and will not be applicable for a single COTS product. When a single
COTS component is used in multiple COTS-based architecture combinations a
mismatch analysis will be required for every combination - this factor that has been
overlooked by the authors. Authors provide no theoretical or empirical rationale for
allocating the relative complexity value for the resolution techniques in Table 2.
These relative complexity values could well vary over different domains or for
different COTS components. Finally, there has been no evidence that this method of
determining the difficulty of integration index has been successful on test or real-
world analysis of COTS-based architectures.
2.4.4 Contextual Reusability Metrics
In their paper [Bhattacharya and Perry 2005], researchers present a model to enable
quantitative evaluation of the reusability of a software component based on its
compliance to different elements of an architecture description using contextual
metrics. To obtain such metrics authors recommend defining component-based
architecture with the following key definitions for each architectural component:

43
1. Interface description – defines the interface information for the services
provided and required by the architectural element. These include associated
input and output descriptions of data and events and their corresponding pre
and post conditions.
2. Attribute descriptions – defines the domain data supported by the
architectural element.
3. Behavioral description – defines the state transitions supported by the
architectural element.
The authors then require that each reusable component being considered in the
architecture be defined similarly using the elements above (Figure 13). The authors
provide a mathematical evaluation model based on mapping the architectural
component’s definition to that of the reusable component. The mathematical
evaluation would indicate the components compliance to the specific architecture.
This method requires detailed specification for both - the architecture in
consideration and components being used in that architecture. Defining both these
details for several components can be significantly effort intensive. Moreover when
developing COTS-based architectures a COTS component can and usually does
impact the architecture definition. Furthermore authors are largely focused on
mapping the functional attributes and neglect to analyze several non-functional
attributes such as underlying platform and dependencies, and mismatches caused by
assumptions made by components’ assumptions about the system [Abd-Allah 1996]
[Gacek 1998] [Garlan et al. 1995].

44
Figure 13: Contextual Reusability Metrics - Asset Component Specification
2.4.5 Architecture Description Language - Unicon
Unicon’s primary focus is on supporting descriptions of architectures [Shaw et al.
1995]. The specific objectives of UniCon toolset include:
• provide uniform access to a wide range of components and connectors,
• discriminate among various types of components and connectors,
• facilitating the checking for proper configurations,
• supporting use of analysis tools developed by others, and different underlying
assumptions,
• handling existing component as any other component.

45
Components in UniCon are specified by their type, property lists (attribute-value
pairs), and interaction points (player) where connectors can be hooked while
connectors are described by their type, property lists, and interaction point (roles)
where they are supposed to interface with components [Zelesnik 1996]. UniCon
provides several types of pre-defined components and connectors that can be selected
for the appropriate situation. It discriminates amongst the type of components and
connectors by differentiating among types of interaction points provided by all types
of components (player), and connectors (roles). UniCon restricts the player-role
combinations by means of implicit rules. It uses such localized checks as a means of
mismatch detection (i.e. not all player role pairs are allowed during system
composition).
UniCon lacks the ability to define global systems constraints. Additionally, because
localized checks are the only means of mismatch detection, it is not possible to detect
mismatches that occur as side effects to the composition of components and
connectors. Moreover the level of details required in the UniCon property lists it is
likely that COTS vendors may not be inclined to provide all the information required
to define the product.
There are several other architecture description languages that were designed for
analyses of specific systems or properties. Most languages face similar problems such
as UniCon where the description parameters are too specific and/or to low level to
warrant their use in the analysis of COTS intensive system architectures at such an
early stage. For an overview of other languages please refer to [Medvidovic and Taylor
2000].

46
2.5 Software Connector Classification
There have been numerous works that provide a foundation for software connectors
[Medvidovic and Taylor 2000] [Perry and Wolf 1992] [Shaw 1993], however one
seminal source that influences this research is a taxonomy of software connectors
proposed by [Mehta et al. 2000].
The proposed taxonomy identifies eight types of software connectors: (1) Procedure
call, (2) Event, (3) Data Access, (4) Linkage, (5) Stream, (6) Arbitrator, (7) Adaptor,
and (8) Distributor. Each connector type is categorized across a set of dimensions and
sub-dimensions. For each dimension or sub-dimension valid values are identified.
Each of these connector types are also classified across four major service categories.
These include:
• Communication: supports transmission of data amongst components
• Coordination: support transfer of control among components.
• Conversion: convert the interaction provided by one component to that
required by another
• Facilitation: mediate and streamline component interaction, by providing
mechanisms for optimizing the interactions of components.
This work utilizes connector types to define interfaces of a COTS component. The
four service categories above are also employed by this framework when
recommending a custom wrapper require for integrating the two components.

47
2.6 COTS Integration Strategies
Keshav and Gamble in [Keshav and Gamble 1998] propose three basic integration
elements: Translator, Controller and Extender. A translator converts data and
functions between component formats, without changing the content of the
information. It does not need the knowledge of where the data came from, or where it
is sent. A controller coordinates and mediates the movement of information between
components using some pre-defined decision making process. The controller needs to
know the components for which the decisions are being made. An extender adds new
features and functionality. Whether or not the extender needs to know the identity of
components depends upon the application. Further, the authors propose the need for
combining multiple integration elements to interoperate certain component
combinations. Out of the three basic integration elements the translator and extender
map directly to the connector service categories of conversion and coordination
respectively, proposed in [Mehta et al. 2000].
Robert DeLine in [DeLine 1999] and [DeLine 1999b] catalogs a set of techniques for
resolving packaging conflicts. These include (For all the descriptions COTS
components A and B are incompatible due to certain packaging commitments made
by them during development time):
Online-Bridge: In this method a new component (Br) is introduced to resolve
packaging conflicts between two components (A and B). Component Br has interfaces
that are compatible with A on one end, and B on the other, and it forms a part of the
system’s final control structure (Example: JDBC-MySQL connector to streamline the

48
interaction between a Java component [Sun Java 1994] and MySQL database [MySQL
1999]).
Offline-Bridge: This is a specialized version of online-bridge except where one of the
components being integrated (B) is some form of persistent data, and the mismatch
between A and B is about data representation (see the data representation definition
in the Packaging Mismatch section above). Here, a component Br (typically a stand-
alone tool) is used to transform component B into B’; and component B’ is integrated
with component A. Offline bridges are often available as tools and so can be acquired
instead of being developed (RTFtoHTML: Converts a rich text format file into an
HTML file [Zielinski 2003]).
Wrapper: In this method component B encapsulates a wrapper W (with similar
functionality as Br of Online-Bridge). This combination of B’ and W forms a new
component which then interacts with A (Example: Database wrapper to convert a
File-based newline separated database to an SQL compatible database).
Mediator: Here a connector C is capable of supporting several alternatives for given
packaging commitments and is used to integrate components A and B (Example: Tom
[Ockerbloom 1998] a service which can convert amongst a variety of document
formats).
Intermediate Representation: This is a specialized case of a mediator, where the
mismatch is due to data representation. Here, connector C simultaneously supports
conversion amongst multiple data formats by first converting to a format of its own
commitment (Example: Corba provides basic data representation types, converts data
49
from source language {C++, Small Talk, Java etc.} components to its own data
representation and then re-converts them for the target language component [OMG
CORBA 1997]).
Unilateral Negotiation: Here, one of the components (B) supports multiple packaging
methods. In this case, component B is configured to support the packaging
commitment of component A. (Example: eBay API, which supports SOAP/WSDL as
well as HTTP/REST interfaces; interacting with a component that just supports
SOAP/WSDL).
Bilateral Negotiation: Both components (A and B) support multiple packaging
methods. Components have been developed so that they support negotiation in order
to prevent packaging mismatch (Example: a web-browser negotiates with a secure
server to identify the commonly supported security encryption protocol).
Component Extension Technique: In this case one of components provides supports
extension mechanisms, where it defers certain commitments to a set of modules
integrated when the component is initialized at run-time (Example: Mozilla supports
Plug-ins for Adobe Acrobat, Macromedia Flash etc.).
Above work on resolving packaging conflicts is utilized to identify and recommend
the glueware that can be used for component integration.

50
2.7 COTS Cost Estimation Model
There have been several attempts for development of models for estimating the cost
of COTS integration. COCOMO [Boehm et al. 2000] and SLIM cost estimation models
have been modified for systems using COTS [Smith et al. 1997][Borland et al. 1997].
One of the largest bodies of work for COTS integration cost estimation has been done
by Chris Abts in his dissertation [Abts 2004]. The model consists of three major COTS
related sub-models: COTS Assessment, COTS Tailoring and COTS Glue-code. The
COTS Glue-code sub-model consists of thirteen multiplicative cost drivers and one
scale factor. Using the estimated source lines of glue-code, and appropriate selections
of cost drivers and scale factors, the model can output the schedule and effort
required for developing glueware to make the components interoperate with each
other. The analysis output by the proposed interoperability assessment framework
can be used by the developers to estimate source-lines of glue-code based on their
past experiences. This estimate will then become the input to the COCOTS glue-code
sub-model along with the cost drivers and scale factor resulting in an early effort
estimate to integrate the COTS components in the proposed architecture.
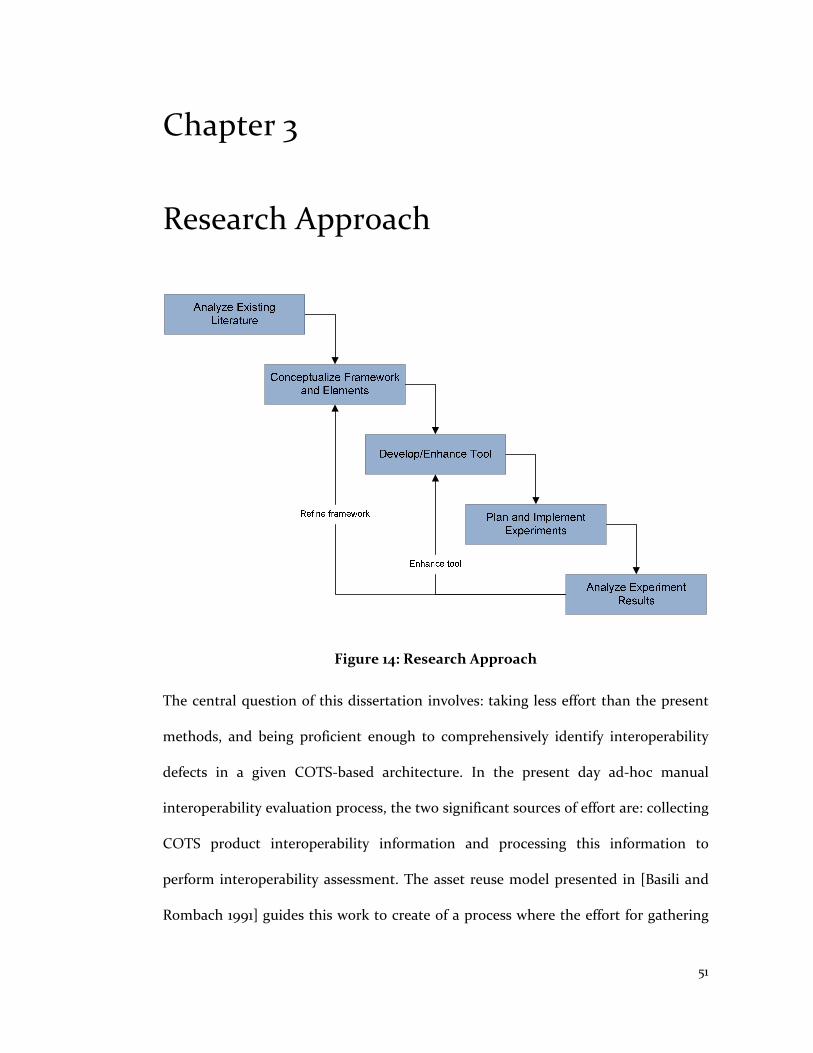
51
Chapter 3
Research Approach
Figure 14: Research Approach
The central question of this dissertation involves: taking less effort than the present
methods, and being proficient enough to comprehensively identify interoperability
defects in a given COTS-based architecture. In the present day ad-hoc manual
interoperability evaluation process, the two significant sources of effort are: collecting
COTS product interoperability information and processing this information to
perform interoperability assessment. The asset reuse model presented in [Basili and
Rombach 1991] guides this work to create of a process where the effort for gathering

52
COTS interoperability information is amortized across multiple assessments. In
addition, the proposed framework utilizes automation to reduce interoperability
analysis effort. Both these solutions are enabled by the development of a standardized
method to represent COTS interoperability characteristics and delineate conditions
for identifying interoperability mismatches. The above contention leads to the
development of COTS interoperability representation attributes, interoperability
assessment rules and interoperability evaluation process.
The apparent starting point to identify such a standardized set of interoperability
characteristics and conditions was the large body of research knowledge associated
with style-based and component-based system composition such as in [Abd-Allah
1996] [Davis et al. 2001] and [Gacek 1998] . In addition to these, the research utilized
assessments from past e-service projects developed at USC [eBase 2004]. The primary
challenge when developing the interoperability representation attributes was to
ensure that they were technically sound i.e. every attribute (not utilized in
component identification) was associated with at least one interoperability
assessment rule; and the COTS information required by these attributes would be
straightforward to obtain. This was accomplished by concurrently developing the
attribute set and interoperability assessment rules, and by making an attempt to
define every attribute value for a set of open source and non-open source COTS
products. This enabled the development of the first version of this framework which
had a total of 38 attributes and 60 rules. These attributes and rules built the first
version of the Integration Studio tool. This tool was used for the first experiment P1
(section 9.2), conducted in a graduate software engineering course. Since its first
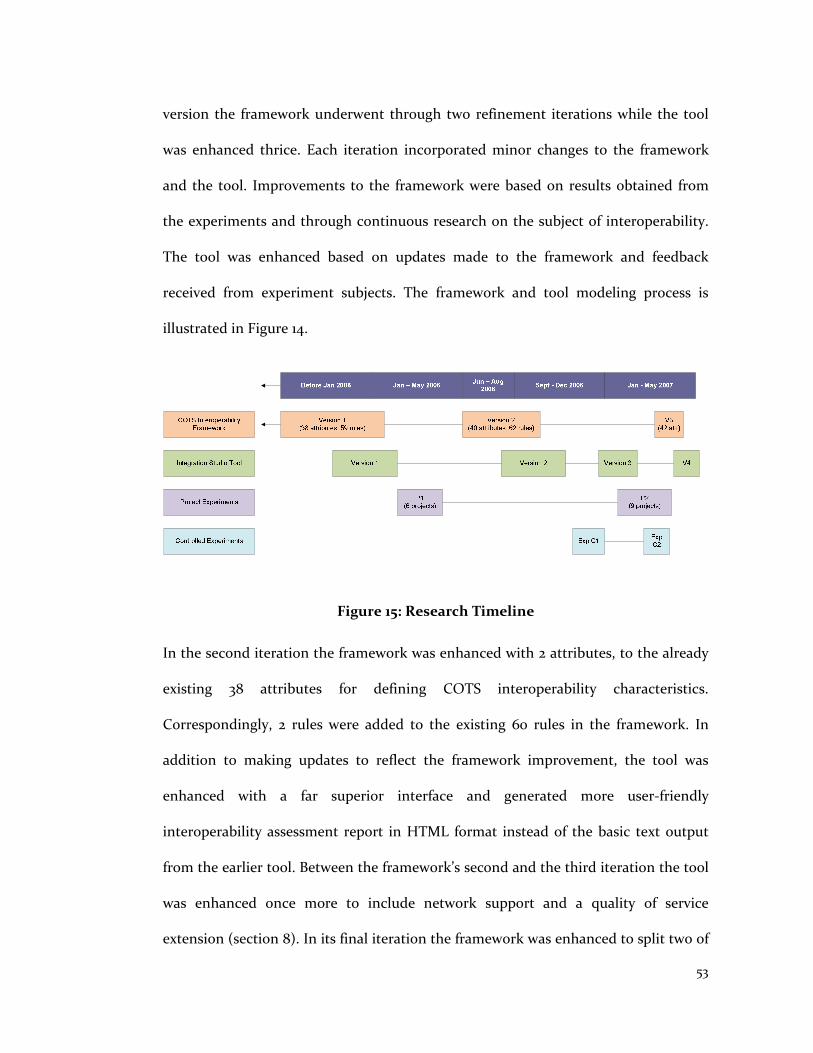
53
version the framework underwent through two refinement iterations while the tool
was enhanced thrice. Each iteration incorporated minor changes to the framework
and the tool. Improvements to the framework were based on results obtained from
the experiments and through continuous research on the subject of interoperability.
The tool was enhanced based on updates made to the framework and feedback
received from experiment subjects. The framework and tool modeling process is
illustrated in Figure 14.
Figure 15: Research Timeline
In the second iteration the framework was enhanced with 2 attributes, to the already
existing 38 attributes for defining COTS interoperability characteristics.
Correspondingly, 2 rules were added to the existing 60 rules in the framework. In
addition to making updates to reflect the framework improvement, the tool was
enhanced with a far superior interface and generated more user-friendly
interoperability assessment report in HTML format instead of the basic text output
from the earlier tool. Between the framework’s second and the third iteration the tool
was enhanced once more to include network support and a quality of service
extension (section 8). In its final iteration the framework was enhanced to split two of

54
its attributes to avoid a false negative scenario found in experiment C2 (section 9),
and one interoperability assessment rule was updated to reflect these changes. The
tool was similarly updated to address these framework modifications. The complete
research timeline is illustrated in Figure 15.

55
Chapter 4
Framework Overview
The goal of the proposed framework is to provide the development team with an
instrument to assess the interoperability characteristics of the proposed COTS-based
system architecture. The framework does this by analyzing COTS-based architecture
to identify interoperability mismatches.
Interoperability mismatches occur due to logical inconsistencies between assumptions
made by interacting components.
Interoperability mismatches are a major source of effort when integrating COTS-
based architectures [Garlan et al. 1995]. There are other sources of effort such as
COTS functional analysis, COTS acquisition, and vendor negotiation. However these
are outside the scope of this work and have been addressed by several other
researchers [Boehm et al. 2003b] [Brownsword et al. 2000] [Comella-Dorda et al.
2003] [Elgazzar et. al 2005] [Meyers and Oberndorf 2001] [Yang and Boehm 2004].
Using effort estimation models such as COCOTS [Abts 2004] this assessment can be
converted into a numeric effort figure to be utilized during the COTS evaluation
process [Ballurio et al 2002] [Comella-Dorda et al. 2003] [Yang and Boehm 2004]
when selecting COTS components.

56
Figure 16 describes the proposed framework and its interactions. The framework
inputs a system architecture and interoperability definitions of corresponding COTS
and non-COTS products used in the architecture. The framework consists of three
major elements:
Figure 16: COTS Interoperability Assessment Framework Interactions
COTS interoperability representation attributes are a set of characteristics used
to describe COTS interoperability behavior at a high and non-functional level of
abstraction. They contain information about COTS interfaces, internal assumptions
made by the COTS components, and dependencies required by the COTS product to
function in the system.
Interoperability assessment rules define the pre-conditions for occurrence of
interoperability mismatches. This framework defines three kinds of interoperability
assessment rules:

57
• Interface mismatch rules – that identify mismatches pertinent to incompatible
COTS component interfaces,
• Internal assumption mismatch rules – that define mismatches relevant to
incompatible COTS internal assumptions, and
• Dependency mismatch rules – which describe mismatches related to COTS
dependencies.
In addition, the interface incompatibility rules utilize a set of component integration
strategies [DeLine 1999] that are recommended when specific interoperability
mismatches occur. These strategies guide the development team in identifying
potential resolutions to COTS mismatches.
COTS interoperability evaluation process is a guided process that utilizes the
COTS-based system architecture definition, COTS interoperability definitions, and
interoperability assessment rules to assess interoperability mismatches. This process
has been designed such that it and be automated and can maximize reuse. The
automation and reuse allows the framework to perform multiple assessments in an
extremely short amount of time.
The framework employs the aforementioned elements to provide an interoperability
analysis of the proposed architecture. The analysis includes a list of:
COTS interface mismatches occur because of incompatible communication
interfaces between two interacting components. For example component A supports
communication via procedure calls while component B supports communication via
shared data.

58
COTS internal assumption mismatches occur due to incompatible assumptions
that interacting COTS components make about each other. For example: a non-
blocking and non-buffered data connector connects components A and B, and
component A assumes that component B is always active, which can result in a
situation where component A transmits data, but if component B is inactive the data
is lost.
COTS dependency mismatches occur due to missing components required by
existing COTS components in the architecture, or presence of components conflicting
with existing COTS components in the architecture. Alternately such mismatches can
also occur due to presence of certain incompatible components in the system
architecture. For example, a content management system written in PHP [PHP 2001]
may require an underlying PHP interpreter as well as a MySQL database as its data
component.
The assessment output produced by the framework, in addition to identifying
architecture integration risks can be used by the development team to estimate lines
of glue-code required to integrate the system. This estimate can serve as an input to
COCOTS [Abts 2004] which outputs the estimated effort and corresponding schedule
that will contribute to the decision-making process during COTS selection.
The next 3 chapters (chapters 5, 6 and 7) describe each of the framework components
and its constituent elements in details. This is followed by description of the tool
(chapter 8) which was developed at USC to perform interoperability assessment using
this framework.

59
Chapter 5
Interoperability Representation
Attributes
A major source of effort reduction in this framework occurs by storing and reusing
COTS interoperability information. The COTS interoperability representation
attributes describe interoperability characteristics of COTS products. COTS
components attribute definitions are utilized by the COTS interoperability evaluation
process along with interoperability assessment rules to perform interoperability
analysis. This chapter discusses these 42 attributes.
The COTS interoperability representation attributes are derived from various
literature sources, as well as observations in various software integration projects.
There were two major criteria used for selecting this set of attributes:
1. The attributes should be able to capture enough details on COTS
interoperability characteristics, so as to identify major sources of COTS
component interoperability mismatches and
2. They should be defined at a sufficiently high-level so that COTS vendors are
able to provide attribute definitions without revealing confidential product
information.

60
Several attributes such as data topology, control structure, and control flow [Davis et
al. 2001] were not included because they were either:
a. Too detailed and required an understanding of the internal designs of COTS
products,
b. They could be represented at a higher level by an already existing attribute, or
c. They did not address a mismatch issue which was significant enough to justify
including the attribute.
Figure 17: COTS Interoperability Representation Attributes

61
COTS interoperability representation attributes have been classified into four major
groups: general attributes, interface attributes, internal assumption attributes and
dependency attributes. The four groups and corresponding attribute list have been
illustrated in Figure 17. General attributes for a component X aid in component
identification and provide an overview of its roles in the system. COTS interface
attributes define the interaction information for component X such as inputs, outputs
and bindings. COTS internal assumption attributes for component X define its
internal characteristics such as concurrency, dynamism and preemption. Finally
dependency attributes specify a list of additional components and characteristics
required by component X to function as desired in the system. For example, Apache
Tomcat [Apache Tomcat 1999] requires Java Runtime Environment [Sun Java 1994].
They also include a list of components with which component X is known to be
incompatible. Several attributes such as version, data input and output can have
multiple values for a single COTS definition. A component may have multiple
interfaces and multiple dependencies. For example, Apache server [Apache 1999]
supports a web-interface via the hypertext transfer protocol [Fielding 2000], at the
same time it supports back-end communication interface via a procedure call [Mehta
et al. 2000]. The functions it provides for both these interfaces are different. The same
is applied to dependency attributes where a COTS product may support execution on
different platforms. For example, the Java runtime environment [Sun Java 1994] has
multiple versions which can be executed upon on Solaris [Sun Solaris 1989], Linux
[Linux 1994] and Windows [Microsoft Windows 1985] platforms.

62
This research utilized several literature sources to identify these 42 attributes and
their values. These literature sources included [DeLine 1999] [Mehta et al. 2000]
[Shaw 1993] and [Yakimovich 2001] for interface attributes, and [Abd-Allah 1996]
[Gacek 1998] and [Davis et al. 2001] for internal assumption attributes. In addition to
these, numerous attributes – including dependency attributes were identified from
interoperability studies of USC’s e-service project archives [eBase 2004] and other
project case studies [Garlan et al. 1995]. Several original attribute definitions (from
[Gacek 1998]) address architecture styles and custom components. These definitions
have been tailored for COTS-based systems. The rest of this section will describe the
attributes in details. In the descriptions below * refers to attributes that were not
found in the interoperability assessment literature and have been contributed by this
work.
5.1 General Attributes
The primary purpose of general attributes is to identify the COTS component,
whether the product is a component or a connector and identify the roles it can play
in the system. The general attributes include:
Name
Name indicates the designation of the COTS component.
Type
Type denotes if a product is a third-party component, legacy component, connector,
or a custom component. A single product can have only one value for this attribute.
63
Role
COTS components may fulfill various roles in the system. Possible roles for
components include:
• Operating System indicates that the component serves the function of as an
operating system e.g. Windows Vista [Microsoft Windows 1985], Mac OS
[Apple Mac OS 1984], Solaris [Sun Solaris 1989].
• Platform indicates that the component can serve as a platform in a given
system. E.g. Apache [Apache 1999] can be used as a platform for Perl [CPAN
1995] or HTML [W3 HTML 1999] based development.
• Middleware indicates that the component can act as a middleware for the
system e.g. CORBA [OMG CORBA 1997].
• Web Service indicates that a component is a web-service and resides elsewhere
on the Internet e.g. eBay API [eBay API 1995].
• Persistent Data Store indicates that the component provides a persistent data
storage capability in the system e.g. MySQL [MySQL 1995] provides the data
store function.
• Graphical User Interface indicates that the component provides GUI related
capabilities in the system e.g. Microsoft Visio [Microsoft Office Visio 2007].
• Data Analysis indicates that the component provides some data analysis
functionality e.g. Matlab [Matlab 1994].
• COTS Plugin defines a COTS product that inherently supports features which
allow other mini-components to extend its functionality. e.g. Acrobat plugin
[Adobe Acrobat 1993] for Internet Explorer [Microsoft Internet Explorer 2007].

64
• COTS Extension are an advanced type of plugins where the the binding
between the primary component and extension is much stronger than that in
a plugin. e.g. PHP [PHP 2001] extensions to Apache [Apache 1999].
• Data Broker indicates that the component (or connector) is responsible for
facilitating data transfer across other components. Note that this component
can have other functionalities in addition to being a data broker.
• Control Broker indicates that the component (or connector) is responsible for
facilitating control transfer across other components. Note that this
component can have other functionalities in addition to being a control
broker.
• Custom Extension indicates that the component is a custom product which
when integrated with another specific component provides certain additional
functionalities e.g. Extensions to Microsoft Office [Microsoft Office 2007]
developed in a Microsoft .NET programming language [Microsoft .NET
Framework 2007].
• Generic Component indicates that the component provides a particular
function in the system that is not included in the options above.
If the COTS product is a connector its roles include:
• Communication indicates that the component supports transmission of data
from amongst components e.g. JDBC-MySQL Connector [MySQL 1995].
• Coordination indicates that the component supports transmission of control
amongst components e.g. Event Manager.
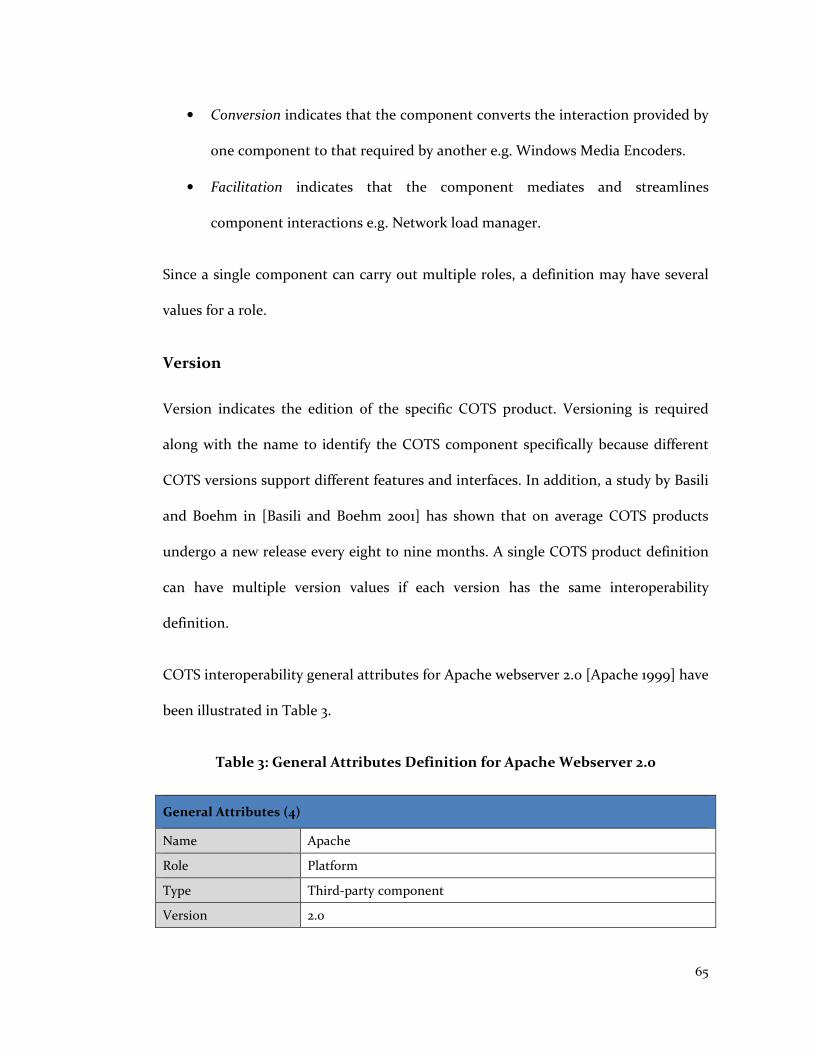
65
• Conversion indicates that the component converts the interaction provided by
one component to that required by another e.g. Windows Media Encoders.
• Facilitation indicates that the component mediates and streamlines
component interactions e.g. Network load manager.
Since a single component can carry out multiple roles, a definition may have several
values for a role.
Version
Version indicates the edition of the specific COTS product. Versioning is required
along with the name to identify the COTS component specifically because different
COTS versions support different features and interfaces. In addition, a study by Basili
and Boehm in [Basili and Boehm 2001] has shown that on average COTS products
undergo a new release every eight to nine months. A single COTS product definition
can have multiple version values if each version has the same interoperability
definition.
COTS interoperability general attributes for Apache webserver 2.0 [Apache 1999] have
been illustrated in Table 3.
Table 3: General Attributes Definition for Apache Webserver 2.0
General Attributes (4)
Name Apache Role Platform Type Third-party component Version 2.0
66
5.2 Interface Attributes
Interface attributes define the interactions supported by a component. An interaction
is defined by the exchange of data or control amongst components. A component
may have multiple interfaces, in which case it will have multiple interface definitions.
For example the component Apache [Apache 1999] has one interface definition for
the web-interface (interaction via http) and another definition for server interface
(interaction via procedure call).The interface attributes for COTS products include:
Binding:
Binding defines how interaction mechanisms are setup, and how the participants of
interactions are determined. There are four major types of binding:
• Static binding, also called early binding occurs at compile time when the
compiler determines the method of interaction in advance of the compilation.
This method of binding is largely prevalent in procedural languages such as C.
• Compile-Time Dynamic binding occurs at compile time when the compiler
determines the method of interaction at the time of compilation. This method
of binding usually occurs with object-oriented languages such as C++ and
Java.
• Run Time Dynamic binding occurs after compilation when the program
determines the method of interaction at runtime. Such binding takes place
when communicating with dynamic link libraries, or Java jar files.

67
• Topologically Dynamic binding occurs at runtime when the architecture
topology determines the participants of interaction. Topologically dynamic
binding occurs when a web-browser queries an apache web-server.
A single component can support several binding methods and can have multiple
values for this attribute.
Communication Support Language *
Certain COTS products provide communication and extension support for specific
languages. For example Microsoft Office [Microsoft Office 2007] provides extensive
support for .NET languages such as Visual Basic, C#, Visual C++, and Visual J++
[Microsoft .NET Framework 2007]. A COTS product may support multiple
communication support languages in a given interface.
Control Inputs
Control inputs denote the control input methods for the defined COTS component.
Major types of control inputs include procedure calls, events, remote procedure call,
and triggers and spawns. There can be multiple types of control inputs supported by a
single COTS product interface.
Control Outputs
Control outputs denote the control output methods for the defined COTS
component. Major types of control outputs include procedure calls, events, remote
procedure call, and triggers and spawns. There can be multiple types of control
outputs supported by a single COTS product interface.
68
Control Transmission Protocols *
Control transmission protocols indicate the standardized procedures a component
supports for transmitting control to other components in the system. Examples of
control transmission protocols include Activex data objects (ADODB) [Denning
1997]. There can be multiple types of control protocols supported by a single COTS
product interface.
Control Reception Protocols *
Control reception protocols indicate the standardized procedures a component
supports for receiving control transfers from other components in the system.
Examples of control transmission protocols include: Activex data objects (ADODB)
[Denning 1997]. There can be multiple types of control protocols supported by a
single COTS product interface.
Data Inputs
Data inputs denote the data input methods supported by a COTS component. Major
input types include: data streams, events, procedure calls, shared data, remote
procedure call and trigger. A single component interface can support multiple data
input outputs and hence can have multiple values.
Data Outputs
Data outputs indicate the data output methods supported by a COTS component.
Major output types include: data streams, events, procedure calls, shared data, remote

69
procedure call, and trigger. A single component interface can support multiple data
output types and hence can have multiple values.
Data Reception Protocols *
Data reception protocol indicate the standardized procedures a component supports
for making requests to other components in the system and receive data from them.
Examples of protocols include: hypertext transfer protocol (HTTP) [Fielding et al.
1999] [W3 HTTP 1996], file transfer protocols (FTP) [Postel and Reynolds 1985], and
open database connectivity protocol (ODBC) [Geiger 1995]. There can be multiple
types of data protocols supported by a single COTS product interface.
Data Transmission Protocols *
Data transmission protocol indicate the standardized procedures a component
supports for responding to requests by other components in the system and
transmitting data to them. Examples of protocols include: hypertext transfer protocol
(HTTP) [Fielding et al. 1999] [W3 HTTP 1996], file transfer protocols (FTP) [Postel
and Reynolds 1985], and open database connectivity protocol (ODBC) [Geiger 1995].
There can be multiple types of data protocols supported by a single COTS product
interface.
The earlier version of COTS interoperability representation attributes [Bhuta 2006]
had a single attribute for data protocols. The validation experiments found cases
where components could support to either query and receive data using certain
protocols (e.g. simple PHP application [PHP 2001] can only query and receive data in

70
HTTP) or respond or transmit to other components using certain protocols (e.g.
Apache Webserver [Apache 1999] can only respond in HTTP), but not both.
Data Formats
Data formats indicate the format in which data is represented for a given interaction.
Examples of data formats include: HTML[W3 HTML 1999], MP3 [Hacker 2000], and
JPEG file format [Miano 1999]. There can be multiple types of data formats supported
by a single COTS product interface.
Data Representation
Data representation indicates the manner in which data is represented during
transfer. The major methods of data representation include: ascii, binary, and unicode
(UTF-8 or UTF-16). There can be multiple types of data representations supported by
a single COTS product interface.
Extensions *
Often times COTS products supports extensions to the basic functionalities provided.
One type of such extension is called a plugin. Most plugins are stand-alone files that
do not require the user to make any changes to the COTS software. Examples of
plugin include Acrobat plugin [Adobe Acrobat 1993] for Internet Explorer [Microsoft
Internet Explorer 2007]. There are other types of third-party extensions or custom
developed extensions such as PHP [PHP 2001] extension for Apache [Apache 1999].
These extensions usually require a little more effort to be integrated with the parent
COTS product. For example to add PHP functionality to Apache, PHP needs to be
71
compiled with certain additional information from Apache. Alternately a COTS
product may not support any extensions or plugins. A COTS product may support
plugin as well as other types of extensions.
Error Inputs *
Error inputs indicate the error interpretation methods supported by the component
when an error occurs in other interacting system components. These methods can
include standardized error codes, error logs, etc. A single component can support
multiple error handling inputs and hence can have multiple values.
Error Outputs *
Error outputs indicate the method in which a component communicates the
occurrence of an error to other interacting components in the system. These methods
can include standardized error codes, error logs, etc. A single component can support
multiple error handling outputs and hence can have multiple values.
Packaging
Packaging indicates how a component is packaged. There are many possible
packaging types and subtypes, however the four major types of packaging include:
• Source Code Modules indicate components that are distributed as source code
modules to be integrated into the application statically or at compile-time e.g.
Xerces C++ [Apache Xerces 1999].
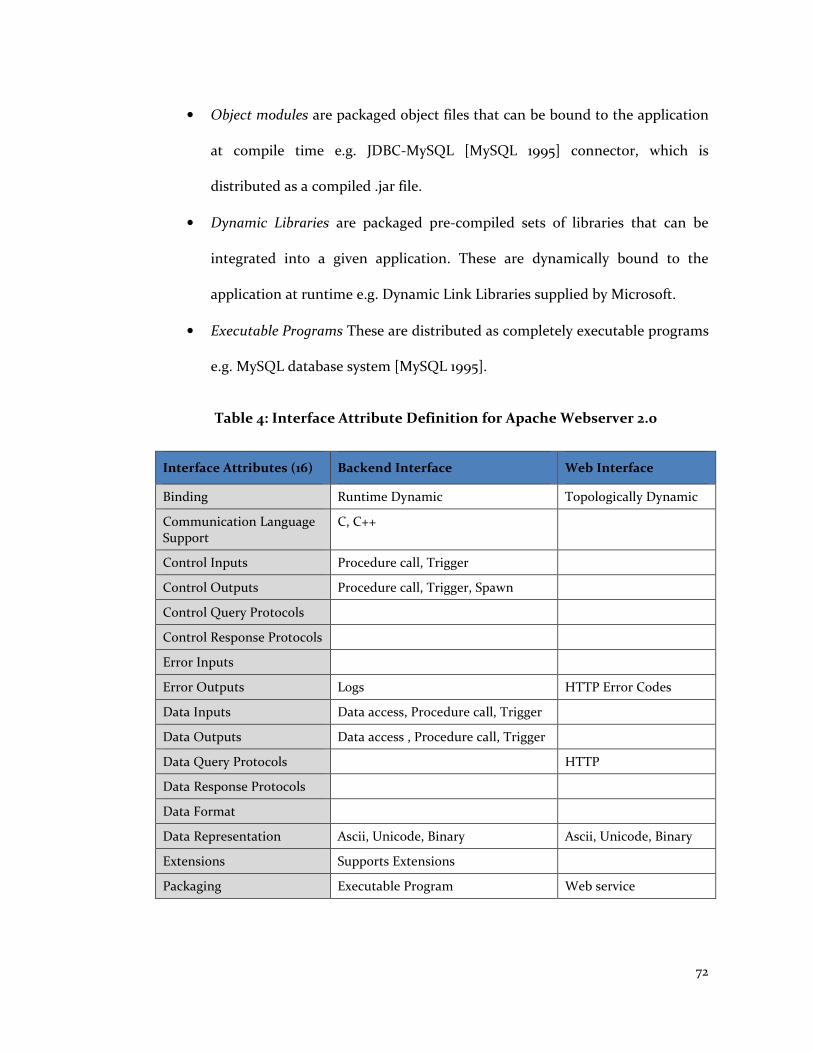
72
• Object modules are packaged object files that can be bound to the application
at compile time e.g. JDBC-MySQL [MySQL 1995] connector, which is
distributed as a compiled .jar file.
• Dynamic Libraries are packaged pre-compiled sets of libraries that can be
integrated into a given application. These are dynamically bound to the
application at runtime e.g. Dynamic Link Libraries supplied by Microsoft.
• Executable Programs These are distributed as completely executable programs
e.g. MySQL database system [MySQL 1995].
Table 4: Interface Attribute Definition for Apache Webserver 2.0
Interface Attributes (16) Backend Interface Web Interface
Binding Runtime Dynamic Topologically Dynamic
Communication Language Support
C, C++
Control Inputs Procedure call, Trigger
Control Outputs Procedure call, Trigger, Spawn
Control Query Protocols
Control Response Protocols
Error Inputs
Error Outputs Logs HTTP Error Codes
Data Inputs Data access, Procedure call, Trigger
Data Outputs Data access , Procedure call, Trigger
Data Query Protocols HTTP
Data Response Protocols
Data Format
Data Representation Ascii, Unicode, Binary Ascii, Unicode, Binary
Extensions Supports Extensions
Packaging Executable Program Web service

73
COTS interoperability interface attributes for Apache webserver 2.0 [Apache 1999]
have been illustrated in Table 4.
5.3 Internal Assumptions Attributes
This section describes the attributes that define the internal assumptions made by the
COTS product. All of the attributes but one (implementation language) will have only
a single value from a pre-defined set of options. Hence to simplify the description
possible values for each attribute have been listed next to them.
Backtracking
Backtracking indicates if the COTS product supports backtracking to an earlier state.
Backtracking can also be used to solve a series of sub-problems each of which may
have multiple possible solutions and where the chosen solution for one sub-problem
affects the possible solution for later sub-problems. To solve the problem one finds a
solution to the first sub-problem and then attempt to recursively solve the other sub-
problems based on this solution. To get all possible solutions one can backtrack and
try the next possible solution to the first sub-problem. Alternately, several database
management systems utilize a rollback feature that reverses the current transaction
out of the database, returning the database to its former state. A COTS component
may or may not exhibit backtracking features.
Component Priorities
Many components with central control units grant differing priorities for control
components to reflect the fact that some tasks’ results may be more urgent than

74
others, or that executing some other component first yields better results.
Component priorities indicate if a COTS component supports priorities in execution
of tasks. A COTS component may or may not exhibit prioritization.
Concurrency
Concurrency indicates the number of concurrent threads that may execute within the
COTS product. A single-threaded system is limited to only one thread of control
component, while a multi-threaded system allows more than one thread to execute
concurrently.
Control Unit
Different components have distinct control management mechanism. Control unit
indicates the inherent control management mechanism in a given COTS component.
Possible values for control unit include:
• Central control unit: where the component expects to arbitrate which
components are to execute at any given point in time on a given node.
• Distributed control unit: where the component expects to dictate the
execution ordering based on some pre-defined mechanism on multiple nodes.
• None: where the component has no inherent control management mechanism
and requires the user or an external component to pass control to it for every
interaction.

75
Distribution
A COTS component may be deployed on a single node or may require deployment on
multiple nodes. Distribution indicates if the component supports single-node or a
multi-node deployment.
Dynamism
A COTS component is dynamic if it allows for a change in its control topology while it
is running. This includes addition and termination of concurrent threads as it
executes. It is important to note that Dynamism and Concurrency are not the same. A
dynamic system is always concurrent (i.e. multi-threaded) while a concurrent system
may not be dynamic. This is because while a concurrent system may have multiple
threads, the number of threads may remain constant.
Encapsulation
Several COTS components provide users with a well-defined interface to a set of
functions in a way that hide its internal workings. This requires making (some) data
and processing within control components private, which allows internal
implementation to be modified without requiring any change to the application it
uses. Encapsulation defines whether the specific COTS interface has this capability. A
component may or may not support encapsulation.
Error Handling Mechanism *
Indicates the error handling mechanism’s supported by a COTS component. These
mechanisms include:

76
• Roll-back: where a component backtracks to an earlier state to recover from
an error.
• Roll-forward: where a component recovers an error by utilizing existing
information to move to the next anticipated state [Xu and Randell 1996].
• Notification: where a component provides an error notification to other
interacting components.
• None: where a component does not support any error handling mechanisms.
Implementation Language *
Implementation language indicates the programming or scripting language used to
develop the COTS product. COTS developers may have used multiple languages, so a
single definition can have multiple values for this attribute.
Layering
Layering indicates that the sub-components within the COTS product are organized
hierarchically with each layer providing a virtual machine to the layer immediately
above and serving a client immediately to the layer below. In such systems
interactions may be restricted to components within the same layer. Layering is
specified with respect to control connectors, data connectors, both, or a system may
have no layering.

77
Preemption
Preemption indicates if COTS component (usually fulfilling the role of an operating
system or a platform) supports interrupting one task and suspending it to run another
task. A component may or may not support preemption.
Reconfiguration
Reconfiguration indicates if the COTS product can perform reconfiguration online in
the event of a failure (or special conditions), or an offline intervention is required to
perform reconfiguration. It also indicates of the garbage collection is performed
online or off line. A component may support online reconfiguration, offline
reconfiguration, or on the fly garbage collection.
Reentrant
A COTS product may have multiple simultaneous, interleaved or nested invocations
that will not interfere with each other. Such calls are important for parallel
processing, recursive functions and interrupt handling. This attribute defines whether
a component supports reentrance.
Response Time
Some components require that the response times for certain events are predictable,
while others expect some bounded response time, yet others may have no bound as
far as response times is concerned. This attribute defines the response time variation
that occurs for different components. Possible values include predictable, bounded,
unbounded and cyclic.
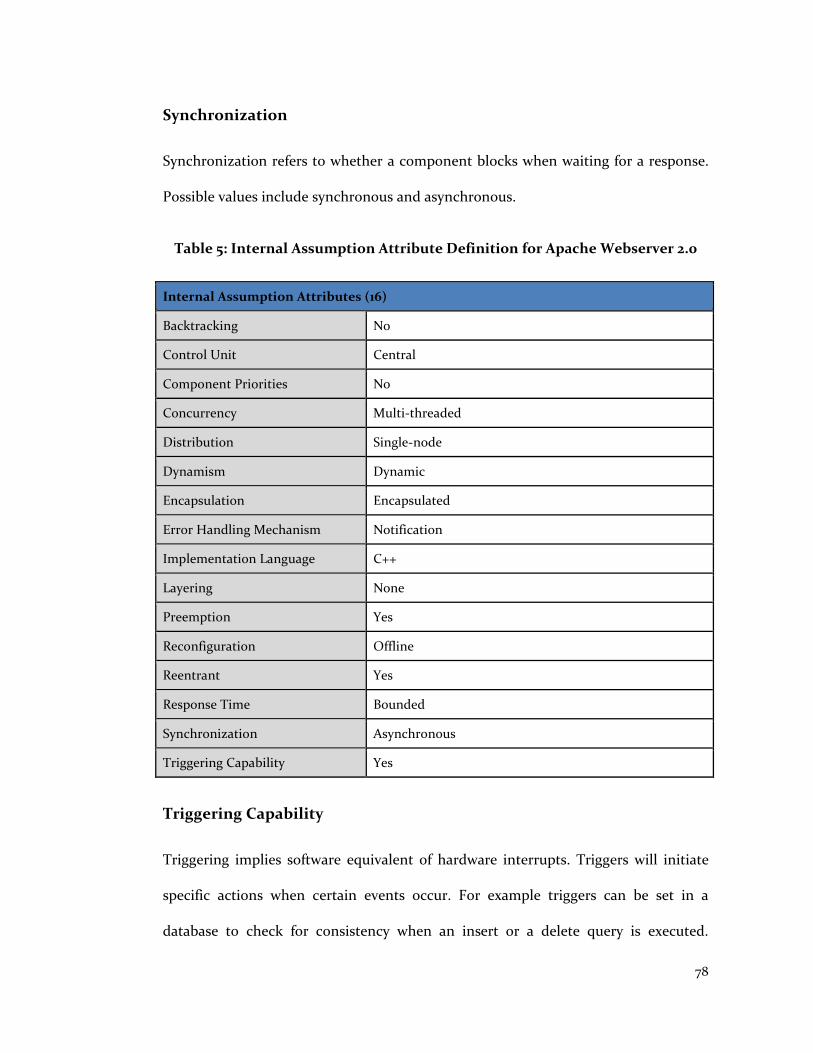
78
Synchronization
Synchronization refers to whether a component blocks when waiting for a response.
Possible values include synchronous and asynchronous.
Table 5: Internal Assumption Attribute Definition for Apache Webserver 2.0
Internal Assumption Attributes (16)
Backtracking No
Control Unit Central
Component Priorities No
Concurrency Multi-threaded
Distribution Single-node
Dynamism Dynamic
Encapsulation Encapsulated
Error Handling Mechanism Notification
Implementation Language C++
Layering None
Preemption Yes
Reconfiguration Offline
Reentrant Yes
Response Time Bounded
Synchronization Asynchronous
Triggering Capability Yes
Triggering Capability
Triggering implies software equivalent of hardware interrupts. Triggers will initiate
specific actions when certain events occur. For example triggers can be set in a
database to check for consistency when an insert or a delete query is executed.

79
Triggering capability indicates if the component supports triggering. A component
may or may not support triggering.
COTS interoperability internal assumption attributes for Apache Webserver 2.0
[Apache 1999] have been illustrated in Table 5.
5.4 Dependency Attributes
These attributes list the dependencies required by a COTS product. Dependencies of
COTS software are products that it requires for successful execution. For example any
Java-based system requires the Java Runtime Environment as a platform. These
attributes also list products which are incompatible with the given COTS software.
The dependency attributes for COTS products include:
Communication Dependencies *
Certain COTS product may restrict the pool of components they will interact with
which provides additional required functionalities. For example a certain content
management system may only work with Oracle [Oracle DBMS 1983] or MySQL
[MySQL 1995] database management systems. A COTS product may support multiple
groups of communication dependencies. A content management system may support
communications with Oracle and Microsoft Office or MySQL and Microsoft Office.
Communication Incompatibility *
There are several instances when COTS software packages are known to be
incompatible for interaction with certain other COTS products. For example certain

80
web-services will not work with specific versions of browsers or specific enterprise
solutions are known to be incompatible with particular database systems.
Communication incompatibility attribute maintains a list of such incompatible
products. To restrict the number of items on this list it should include only those
products with which the given COTS software is expected to interact. For example if
an enterprise customer relationship management solution is expected to interact with
a database management solution, only the incompatible enterprise-class database
management solutions should be included in this list instead of including all possible
database management solutions.
Deployment Language *
Deployment language indicates the scripting or compilation language in which a
COTS software product is deployed. Examples of deployment languages include, Java
bytecode, .NET bytecode, binary and interpreted scripts. Usually a single COTS
product supports just one deployment language; however there may be cases where
COTS support multiple deployment languages. For example Zend guard [Zend 1999]
is a PHP utility which can encode PHP applications that are usually deployed as
interpreted scripts. Thus a PHP application can be deployed as either an interpreted
scripts or a Zend intermediate code.
Execution Language Support *
Several platform-based COTS products provide execution support for a language
(mostly relevant to platform) or script. For example PHP interpreter [PHP 2001]

81
supports execution of PHP scripts. Execution language support lists the languages
which the COTS product can execute.
Same Node Incompatibility *
In several cases, presence of a different COTS product on the same node as the COTS
product being defined can cause incompatibility issues. This may also occur amongst
different versions of the same COTS product. The same node incompatibility lists all
such known incompatibility cases.
Table 6: Dependency Attribute Definition for Apache Webserver 2.0
Dependency Attributes (6)
Underlying Dependencies Linux, Unix, Windows, Solaris (OR)
Deployment Language Binary
Execution Language Support CGI
Communication Language Support C++
Same-node incompatibilities None
Communication incompatibilities None
Underlying Dependencies *
Several COTS products require some underlying platform, frameworks or libraries for
their successful execution. For example Apache Tomcat [Apache Tomcat 1999]
requires Java Runtime Environment and Java Software Development Kit [Sun Java
1994] for successful installation and execution. This attribute lists out such underlying
dependencies for the COTS product. Similar to interfaces a COTS product may
82
support multiple groups of underlying dependencies. A product such as Apache Web
server may support running on Windows, Linux, and Unix.
COTS interoperability dependency attributes for Apache Webserver 2.0 [Apache
1999] have been illustrated in Table 6.
The 42 attributes listed above provide the mechanism to define interoperability
characteristics of a COTS product. To date this research has created definitions for
over 60 COTS products using interoperability representation attributes. 30 of the 60
products were black-box COTS (non open-source). Of these black-box COTS
products at least 34 out of the 42 attributes were identified from publicly accessible
information itself. Attributes that could not be identified were part of the internal
assumption attributes group. The COTS software product definitions such as those
illustrated for Apache Webserver [Apache 1999] in Table 3, Table 4, Table 5, and
Table 6, are utilized in the framework to perform interoperability analysis for a given
architecture.

83
Chapter 6
Interoperability Assessment Rules
An interoperability assessment framework requires to delineate conditions where
specific logical inconsistencies between interacting components’ assumptions results
in additional integration complexity. These conditions in the proposed framework
have been characterized as interoperability assessment rules. Each rule is defined as a
set of pre-conditions and the corresponding mismatch which can potentially occur
when the pre-conditions become true. These pre-conditions utilize the
interoperability representation attribute values for COTS products and the definition
of interaction between the two components being assessed. An interaction between
two components is characterized by:
• Interaction type defines whether the interaction involves data exchange,
control exchange or both.
• Direction of interaction indicates the direction of data flow, or control
transfer; an interaction can be unidirectional or bidirectional.
• Initiator indicates bidirectional interactions that involve a query-response
style of operation and only one component is responsible for starting (or
initiating) the interaction. The initiator value indicates which component is
responsible for starting the data/control exchange.
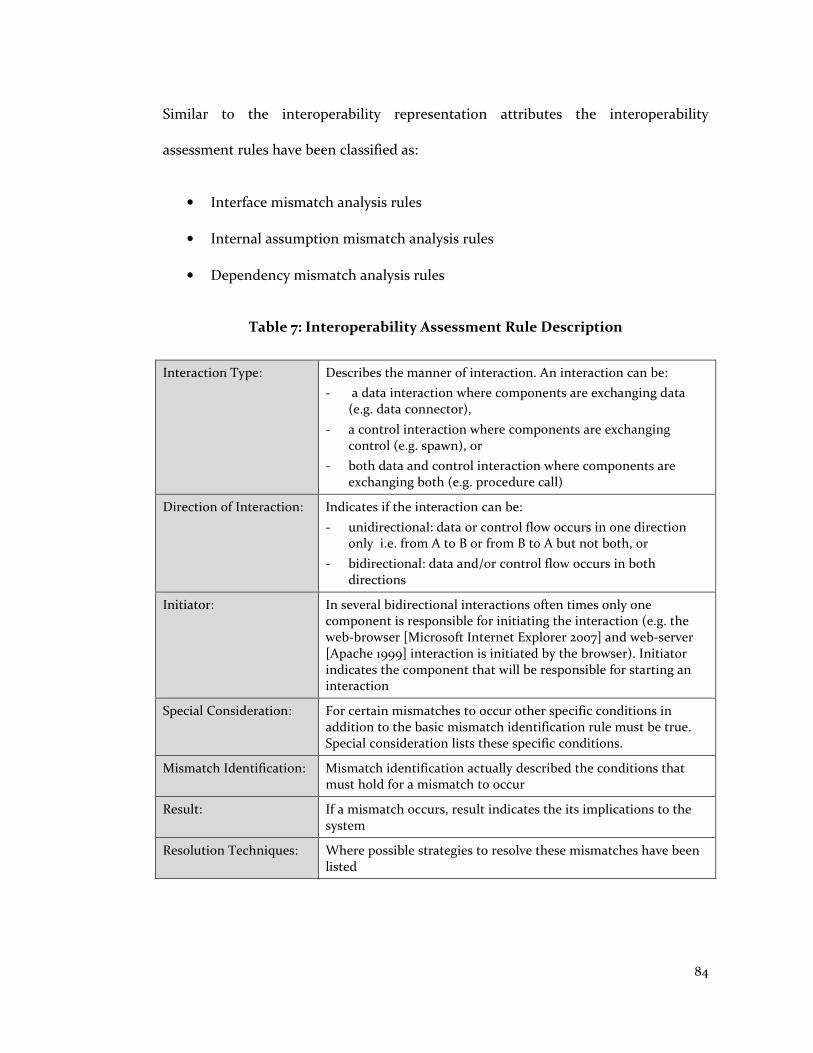
84
Similar to the interoperability representation attributes the interoperability
assessment rules have been classified as:
• Interface mismatch analysis rules
• Internal assumption mismatch analysis rules
• Dependency mismatch analysis rules
Table 7: Interoperability Assessment Rule Description
Interaction Type: Describes the manner of interaction. An interaction can be:
- a data interaction where components are exchanging data (e.g. data connector),
- a control interaction where components are exchanging control (e.g. spawn), or
- both data and control interaction where components are exchanging both (e.g. procedure call)
Direction of Interaction: Indicates if the interaction can be:
- unidirectional: data or control flow occurs in one direction only i.e. from A to B or from B to A but not both, or
- bidirectional: data and/or control flow occurs in both directions
Initiator: In several bidirectional interactions often times only one component is responsible for initiating the interaction (e.g. the web-browser [Microsoft Internet Explorer 2007] and web-server [Apache 1999] interaction is initiated by the browser). Initiator indicates the component that will be responsible for starting an interaction
Special Consideration: For certain mismatches to occur other specific conditions in addition to the basic mismatch identification rule must be true. Special consideration lists these specific conditions.
Mismatch Identification: Mismatch identification actually described the conditions that must hold for a mismatch to occur
Result: If a mismatch occurs, result indicates the its implications to the system
Resolution Techniques: Where possible strategies to resolve these mismatches have been listed

85
The remainder of this section presents these 3 groups of interoperability assessment
rules. Every rule is defined textually described followed by a table which contains a
detailed description of when such a mismatch can occur, how it can be identified
using this framework and if no steps have been taken to resolve the conflict what are
its implications to the functioning of the entire system. The information described in
these tables is illustrated in Table 7.
6.1 Interface Mismatch Analysis Rules
Interface mismatch analysis rules identify interoperability conflicts pertinent to
incompatible interface assumptions made by the two interacting COTS components.
The following sub-section lists these mismatches and corresponding rules utilized to
identify them in a COTS-based architecture.
IM1: Binding Mismatch
Binding mismatch occurs when two interacting components do not have any
common binding mechanisms through which they can establish communication.
Such a mismatch can be resolved by identifying a bridge connector which supports
binding mechanisms of both components. Another way to resolve this mismatch is to
utilize a bridge as the intermediate interaction mechanism. Alternately one could
build a wrapper around one of the two components and convert its binding
mechanism to one that is supported by the other component. Building a wrapper may
however significantly increase integration effort. A detailed description of this
mismatch and its preconditions are illustrated in Table 8.

86
Table 8: Binding Mismatch
Interaction Type: Data or Control
Direction of Interaction: Unidirectional or Bidirectional
Initiator: Either components A or B
Special Consideration: If components A and B are deployed on different nodes local binding mechanisms such static-binding and compile-time dynamic binding cannot constitute a common binding mechanism
Mismatch Identification: For every interaction in an architecture:
Identify common values for binding attribute in the definitions of the 2 products. If the components are deployed on multiple nodes discard the local binding techniques as possible mechanisms.
If no common binding methods are found a mismatch has occurred
Result: Communication cannot be established between components A and B
Resolution Techniques: Identify an online bridging connector which supports binding mechanisms of both components A and B, or
Build a wrapper around one component and convert its binding mechanism to one that is supported by the other component
IM2: Control Interaction Mismatch
Control interaction mismatch occurs when two components exchanging control do
not support any common control exchange connectors or protocols. Such mismatches
can either be resolved by a bridging connector that supports control exchange
mechanisms for both the interacting components. Alternately a mediator that
supports multiple control exchange mechanisms including those supported by the
interacting components can be used. Finally, if neither a bridge connector nor a
mediator is available, developers can extend one of the components’ to support to one
of the components or building a wrapper. A detailed description of this mismatch and
its preconditions are illustrated in Table 9.

87
Table 9: Control Interaction Mismatch
Interaction Type: Control
Direction of Interaction: Unidirectional or Bidirectional
Initiator: Either components A or B
Special Consideration: If components A and B are deployed on different nodes local control interaction mechanisms such procedure calls do not constitute common control exchange connectors
Mismatch Identification: For every control interaction in an architecture:
Identify common values for control output attribute of component A and control input attribute of component B (if direction of communication is from A to B); and vice versa (if direction of interaction is from B to A).
Identify common values for control transmission protocols of component A and control reception protocols of component B (if the direction of communication is from A to B); and vice versa (if direction of communication is from B to A).
If no common control exchange mechanisms or control protocols are found a mismatch has occurred.
Note: For bidirectional communication follow all the steps
Result: Control exchange is not possible
Resolution Techniques: Identify an online of offline bridging connector or mediator which supports control interaction mechanisms or protocols of both components A and B, or
Extend one component so that it supports control interaction mechanism of the other component , or
Build a wrapper around one component and convert its interaction mechanism to one that is supported by the other component
IM3: Custom Component Interaction Mismatch
Certain COTS products provide communication and extension support for specific
languages. For example Microsoft Office [Microsoft Office 2007] provides extensive
support for .NET languages such as Visual Basic, C#, Visual C++, and Visual J++
[Microsoft .NET Framework 2007]. The custom component interaction mismatch
occurs when a COTS component is interacting with a custom component and the
custom component is being built in a language not inherently supported by the COTS

88
product. Such a mismatch can be resolved by either building the custom component
in a language supported by the COTS product or by building a glueware that will
broker the interaction between the custom component and the COTS product. A
detailed description of this mismatch and its preconditions are illustrated in Table 10.
Table 10: Custom Component Interaction Mismatch
Interaction Type: Data or Control
Direction of Interaction: Unidirectional or Bidirectional
Initiator: Either components A or B
Mismatch Identification: For every interaction in an architecture where one component is a COTS product (A) and another is a custom component (C):
Identify values for implementation language for C and communication language support for A.
If no common control languages are found a mismatch has occurred.
(Note: If there are no languages listed for communication language support attribute for COTS A assume the languages listed in implementation attribute for this analysis)
Result: Interaction may be more effort intensive to setup
Resolution Techniques: Identify a language in which both custom and COTS components can interact with and build glue-code in that language to act as a broker for the interaction, or
Build the custom component in a language supported by the COTS product , or
Build a wrapper around the COTS product and/or the custom component to enable this interaction
IM4: Data Format Mismatch
Components exchanging data (usually more than standard parameters) follow a
certain pre-defined format or generally accepted standard such as HTML [W3 HTML
1999], XML [Harold and Means 2004] or JPEG [Miano 1999]. A data format mismatch
occurs when two communicating components do not support any common data
formats. This can be resolved by identifying a third-party mediator which would

89
convert data from a format supported by one component to a format supported by
the other component or extend the one component so that it can decipher the data
format supported by the other component. A description of this mismatch is shown
in Table 11.
Table 11: Data Format Mismatch
Interaction Type: Data
Direction of Interaction: Unidirectional or Bidirectional
Initiator: Either components A or B
Special Consideration: If one of the two components is a data broker or a data storage component, i.e. it is not required to decipher the data being exchanged; in such a case this mismatch may not occur
Mismatch Identification: For every data interaction in an architecture (if neither components are data brokers):
Identify common values for data format attribute of components A and B
If no common data formats are found a mismatch has occurred.
Result: Data exchanged cannot be deciphered
Resolution Techniques: Identify a mediator which supports data conversion for formats supported by components A and B (such as RTFtoXML converted [Zielinski 2003]), or
Extend one component so that it can decipher the data format supported by the other component
IM5: Data Interaction Mismatch
Data interaction mismatch occurs when two interacting components exchanging data
do not support any common data exchange connectors or protocols. Such
mismatches can be resolved by a bridging connector that supports data exchange
protocols for both interacting components. Alternately, a mediator could be used. If
neither a bridging connector or a mediator is available the developers can build an
extension or a wrapper to one of the components that will support the data

90
interaction mechanism supported by the other component. A detailed description of
this mismatch and its preconditions are illustrated in Table 12.
Table 12: Data Interaction Mismatch
Interaction Type: Data
Direction of Interaction: Unidirectional or Bidirectional
Initiator: Either components A or B
Special Consideration: If components A and B are deployed on different nodes local data interaction mechanisms such procedure calls and shared (local) data do not constitute common data exchange connectors
Mismatch Identification: For every data interaction in an architecture:
Identify common values for data output attribute of component A and data input attribute of component B (if direction of communication is from A to B); and vice versa (if direction of interaction is from B to A).
Identify common values for data transmission protocols of component A and data reception protocols of component B (if the direction of communication is from A to B); and vice versa (if direction of communication is from B to A).
If no common data exchange mechanisms or data protocols are found a mismatch has occurred.
Note: For bidirectional communication follow all the steps
Result: Data exchange is not possible
Resolution Techniques: Identify an online of offline bridging connector or mediator which supports data interaction mechanisms or protocols of both components A and B, or
Extend one component so that it supports interaction mechanism of the other component , or
Build a wrapper around one component and convert its interaction mechanism to one that is supported by the other component
IM6: Data Representation Mismatch
Components exchanging data (usually more than standard parameters) follow a
certain standard data representation method such as ASCII [ASCII 1963] and Unicode
[Unicode 2003]. A data representation mismatch illustrated in Table 13, occurs when

91
two communicating components do not support any common data representation
methods. This can be resolved by identifying a third-party mediator which would
convert data from a representation method supported by one component to a method
supported by the other component or extend the one component so that it can
decipher the data representation method supported by the other component.
Table 13: Data Representation Mismatch
Interaction Type: Data
Direction of Interaction: Unidirectional or Bidirectional
Initiator: Either components A or B
Special Consideration: If one of the two components is a data broker or a data storage component, i.e. it may or may not be required to decipher the data being exchanged; in such cases this mismatch may not occur.
Mismatch Identification: For every data interaction in an architecture:
Identify common values for data representation attribute of components A and B
If no common data representation methods are found a mismatch has occurred.
Result: Data exchanged cannot be deciphered
Resolution Techniques: Identify a mediator which supports data conversion for formats supported by components A and B, or
Extend one component so that it can decipher the data format supported by the other component
IM7: Error Interaction Mismatch
When an error occurs in an interacting component (A) it should make its counterpart
(B) aware of the error. If not component B can be blocked waiting for a response.
Error interaction mismatch occurs when there are no common error exchange
methods between the two components. Such a mismatch can be resolved through a
wrapper or extension around component B that can translate error information from
component A. A description of this mismatch is shown in Table 14.

92
Table 14: Error Interaction Mismatch
Interaction Type: Data or Control
Direction of Interaction: Unidirectional or Bidirectional
Initiator: Either components A or B
Special Consideration: None
Mismatch Identification: For every interaction in an architecture:
Identify common values for error output attribute of component A and error input attribute of component B (if direction of communication is from A to B); and vice versa (if direction of interaction is from B to A).
If no common error communication mechanisms are found a mismatch has occurred.
Result: Error messages cannot be deciphered resulting in undesirable consequences when an error occurs
Resolution Techniques: Extend one component so that it can decipher the error interaction mechanisms supported by the other component
6.2 Internal Assumption Mismatch Analysis Rules
Internal assumption mismatch analysis rules define interoperability conflicts related
to incompatible internal assumptions made by the two interacting COTS
components. Of the 50 mismatches listed in this section, 46 mismatches and the rules
to help identify them (IAM1 to IAM46) have been derived from the works of Ahmed
Abd-Allah [Abd-Allah 1996] and Christinia Gacek [Gacek 1998]. Abd-Allah and Gacek
originally defined several of these mismatches to address custom component and sub-
system integration. Where required such mismatches have been updated to address
COTS product integration. This work has added 4 mismatches pertinent to error
handling (IAM47 – IAM50) and rules to identify these mismatches. This work has also
updated several mismatches so that they are applicable in the COTS domain instead
of the architectural style domain for which they were originally developed. The
93
following sub-section lists mismatches and corresponding rules utilized to identify
them in a COTS-based architecture. These mismatch analysis rules have been defined
across 5 distinct connector types. The connector types include:
• Calls define a mechanism to exchange both data and control amongst two
components. Data is usually exchanged as simple parameters. Examples of
calls include procedure calls, remote procedure calls etc.
• Spawn defines a mechanism to begin a new process or a new thread in a
system.
• Data Connector defines a connector responsible for transferring data amongst
two components. Examples of data connectors include pipes and streams.
• Shared Data refers to a mechanism where two components access a shared
repository to exchange data. Example of shared data mechanisms include
database management systems [Silberschatz et al. 2005] and file systems
[Callaghan 1999].
• Trigger refers to an action (data or control transfer) associated with an event –
reception of data or control.
Internal assumption mismatches, because they are based upon internal assumptions
made by COTS component developers, may or may not occur depending upon the
architecture and system dynamics. This framework enables identification of cases
where such mismatches can potentially occur. It recommends that the developers test
for such mismatches when prototyping the application and running the integration
and acceptance tests. Additionally, since these mismatches are occur due to the

94
dynamics of system operation, the mismatch resolution is applied on a per-case basis
and the framework cannot recommend a resolution to these mismatches.
IAM1: Synchronization Mismatch
“Two concurrent threads share data, with potential synchronization problems”
In an interaction where two multi-threaded components or a multi-threaded and a
single threaded component are running concurrently and are sharing data a
synchronization problem can occur. A description of this mismatch is available in
Table 15.
Table 15: Synchronization Mismatch
Interaction Type: Data
Connectors: Shared Data
Direction of Interaction: Unidirectional or Bidirectional
Initiator: Either components A or B
Mismatch Identification: For every shared data interaction in an architecture:
If either component’s concurrency value is multi-threaded, a mismatch has occurred.
Result: Data synchronization problems can occur
IAM2: Layering Constraint Violation Mismatch
“A Layering Constraint is violated”
When either components in an interaction support layering, a connector could
potentially ignore constraints set on either control or data connector therefore
violating them. This mismatch may not cause a system failure but can create

95
problems during maintenance and refresh cycles. A description of this mismatch is
shown in Table 16.
Table 16: Layering Constraint Violation Mismatch
Interaction Type: Data or Control or Both
Connectors: Call, Spawn, Data Connector, Trigger
Direction of Interaction: Unidirectional or Bidirectional
Initiator: Either components A or B
Mismatch Identification: For every interaction using call, spawn, data connector or triggers in an architecture:
If either component supports layering, a mismatch can occur.
Result: Layering constraint maybe violated creating undesired effects during maintenance and refresh cycles.
IAM3: Unrecognizable Trigger Mismatch
“Different sets of recognized events are used by two components that permit triggers.”
In an interaction where both interacting components permit triggers, they may not
identify triggers in certain situations when they have different triggering events
creating problems in systems operation. This mismatch is described in Table 17.
Table 17: Unrecognizable Trigger Mismatch
Interaction Type: Data or Control or Both
Connectors: Call, Spawn, Data Connector, Shared Data, Trigger
Direction of Interaction: Unidirectional or Bidirectional
Initiator: Either components A or B
Mismatch Identification: For every interaction using call, spawn, data connector, shared data or triggers in an architecture:
If both components support triggers, a mismatch can occur.
Result: Triggers may not be identified creating undesired effects in systems operation
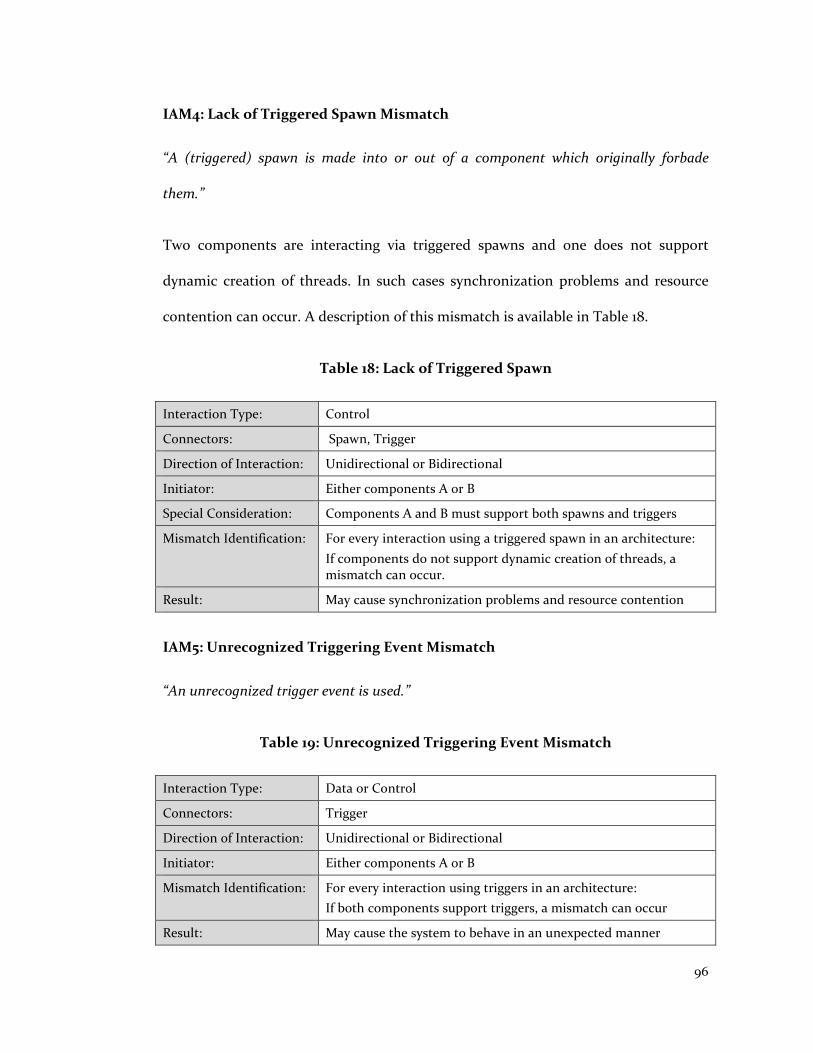
96
IAM4: Lack of Triggered Spawn Mismatch
“A (triggered) spawn is made into or out of a component which originally forbade
them.”
Two components are interacting via triggered spawns and one does not support
dynamic creation of threads. In such cases synchronization problems and resource
contention can occur. A description of this mismatch is available in Table 18.
Table 18: Lack of Triggered Spawn
Interaction Type: Control
Connectors: Spawn, Trigger
Direction of Interaction: Unidirectional or Bidirectional
Initiator: Either components A or B
Special Consideration: Components A and B must support both spawns and triggers
Mismatch Identification: For every interaction using a triggered spawn in an architecture:
If components do not support dynamic creation of threads, a mismatch can occur.
Result: May cause synchronization problems and resource contention
IAM5: Unrecognized Triggering Event Mismatch
“An unrecognized trigger event is used.”
Table 19: Unrecognized Triggering Event Mismatch
Interaction Type: Data or Control
Connectors: Trigger
Direction of Interaction: Unidirectional or Bidirectional
Initiator: Either components A or B
Mismatch Identification: For every interaction using triggers in an architecture:
If both components support triggers, a mismatch can occur
Result: May cause the system to behave in an unexpected manner

97
A trigger connector, in certain situations generates event do not occur causing
unexpected behavior. A description of this mismatch is shown in Table 19.
IAM6: Trigger Forbidden Mismatch
“A trigger refers to components which originally forbade triggering.”
When a triggering mechanism is used as the connector for components that do not
support triggers, these triggers may be ignored. Note that this mismatch will be
identified and filtered by interface mismatch IM2. A description of this mismatch is
available in Table 20.
Table 20: Trigger Forbidden Mismatch
Interaction Type: Data or Control
Connectors: Trigger
Direction of Interaction: Unidirectional or Bidirectional
Initiator: Either components A or B
Mismatch Identification: For every interaction using triggers in an architecture:
If either component does not support triggers, a mismatch can occur.
Result: May cause the system to behave in an unexpected manner
IAM7: Data Connection Mismatch
“A data connector utilized for interaction between components that forbade them.”
In a sub-system where a data connector is being used for an interaction between two
components but the interacting components do not support data connectors the
interaction will fail. Note that this mismatch will also be identified as an interface
mismatch (IM5). The data connection mismatch is illustrated in Table 21.
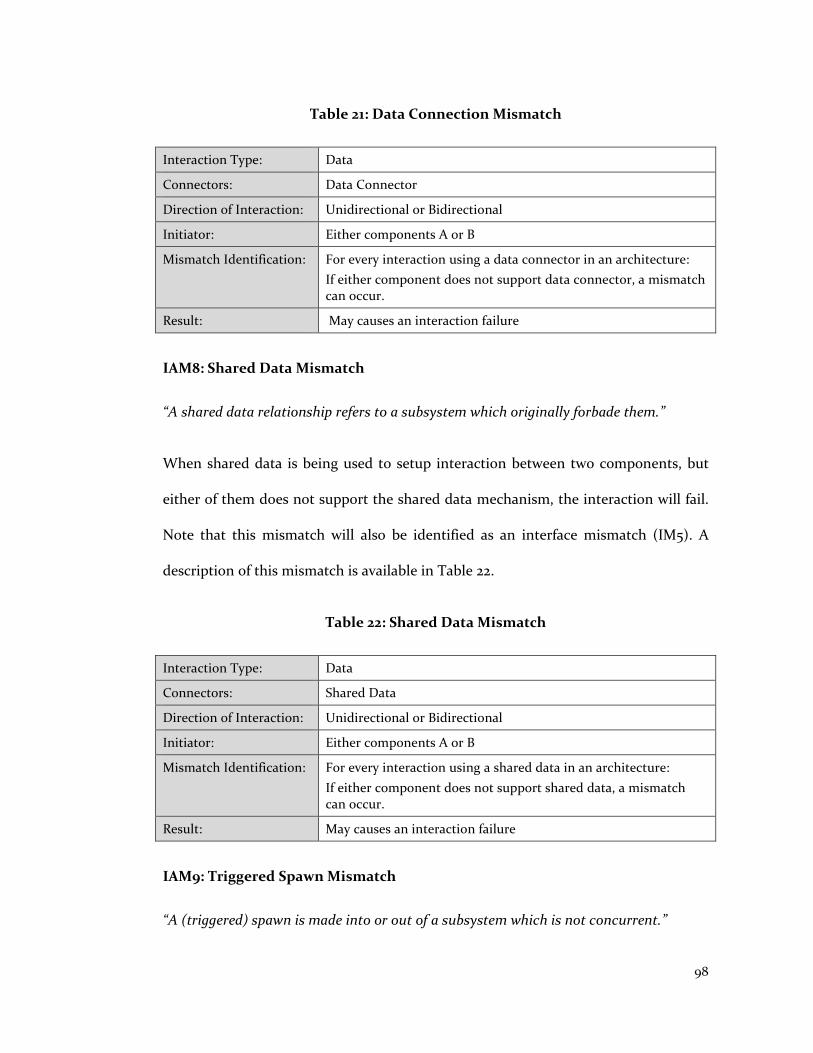
98
Table 21: Data Connection Mismatch
Interaction Type: Data
Connectors: Data Connector
Direction of Interaction: Unidirectional or Bidirectional
Initiator: Either components A or B
Mismatch Identification: For every interaction using a data connector in an architecture:
If either component does not support data connector, a mismatch can occur.
Result: May causes an interaction failure
IAM8: Shared Data Mismatch
“A shared data relationship refers to a subsystem which originally forbade them.”
When shared data is being used to setup interaction between two components, but
either of them does not support the shared data mechanism, the interaction will fail.
Note that this mismatch will also be identified as an interface mismatch (IM5). A
description of this mismatch is available in Table 22.
Table 22: Shared Data Mismatch
Interaction Type: Data
Connectors: Shared Data
Direction of Interaction: Unidirectional or Bidirectional
Initiator: Either components A or B
Mismatch Identification: For every interaction using a shared data in an architecture:
If either component does not support shared data, a mismatch can occur.
Result: May causes an interaction failure
IAM9: Triggered Spawn Mismatch
“A (triggered) spawn is made into or out of a subsystem which is not concurrent.”

99
A triggered spawn is used as a connector during an interaction between two
components, at least one of which does not support concurrent threads. This may
cause synchronization problem and resource contention. A description of this
mismatch is shown in Table 23.
Table 23: Triggered Spawn Mismatch
Interaction Type: Control
Connectors: Spawn, Trigger
Direction of Interaction: Unidirectional or Bidirectional
Initiator: Either components A or B
Special Consideration: Components A and B must support both spawn and triggers
Mismatch Identification: For every interaction using triggered spawns in an architecture:
If either component’s concurrency value is not multi-threaded and interacting components support both triggers and spawns, a mismatch can occur
Result: May cause synchronization problems and resource contention
IAM10: Single Node Mismatch
“A remote connector is extended into or out of a non-distributed component (i.e. a
component originally confined to a single node).”
Table 24: Single Node Mismatch
Interaction Type: Data or Control or Both
Connectors: Call, Spawn, Data Connector, Shared Data, Trigger,
Direction of Interaction: Unidirectional or Bidirectional
Initiator: Either components A or B
Mismatch Identification: For every interaction using call, spawn, connector, shared data and trigger in an architecture:
If either component’s distribution value is not single-node, a mismatch can occur.
Result: May cause synchronization problems and resource contention

100
When a remote connector is used in an interaction where one of the components is
designed as a single node system, the single node system may not be able to handle
delays or errors that occur during distributed communication. A description of this
mismatch is available in Table 24.
IAM11: Resource Overload Mismatch
“A node resource is overused.”
When multiple components are deployed on a single node over usage of resources
such as memory and disk space can create contention. A description of this mismatch
is shown in Table 25.
Table 25: Resource Overload Mismatch
Interaction Type: Not Applicable
Connectors: Not Applicable
Direction of Interaction: Not Applicable
Initiator: Not Applicable
Mismatch Identification: For every node in the system in an architecture:
If the nodes have 2 or more components deployed on it a mismatch can occur
Result: Resources such as memory and disk space can be overused
IAM12: Triggering Actions Mismatch
“There is a non-deterministic set of actions that could be caused by a trigger.”
When two interacting components support triggering and there is at least one trigger
associated with an event from each component, the sequence in which actions take

101
place may be unclear resulting in undesired effects. This mismatch is illustrated in
Table 26.
Table 26: Triggering Actions Mismatch
Interaction Type: Data or Control or Both
Connectors: Call, Spawn, Data Connector, Shared Data, Trigger
Direction of Interaction: Unidirectional or Bidirectional
Initiator: Either components A or B
Mismatch Identification: For every interaction using call, spawn, connector, shared data and trigger in an architecture:
If both components support triggering, a mismatch can occur.
Result: Sequence of execution may be unclear resulting in unexpected system behavior
IAM13: Inactive Control Component Deadlock Mismatch
“Data connectors connecting control components that are not always active may lead
into deadlock.”
Table 27: Inactive Control Component Deadlock Mismatch
Interaction Type: Data (only)
Connectors: Data Connector
Direction of Interaction: Unidirectional (From A to B only) or Bidirectional
Initiator: Both components A or B, or component A only
Special Consideration: Mismatch will not occur if the interaction includes both data and control
Mismatch Identification: For every interaction between components A and B using data connector in an architecture:
If component A is synchronous and component B does not have a central or distributed value for control unit the mismatch may occur
Result: A will transmit data to B and block, but component B may be inactive resulting in no response to A. Component A will be deadlocked

102
Two components are connected by a blocking bridging data connector. The initiating
component is synchronous and the other component lacks support for a control unit.
While the synchronous component transmits data the receiving component may be
inactive because it lacks support for a control unit. A component that transmits data
may block waiting for a response and enter a deadlock. A description of this
mismatch is shown in Table 27.
IAM14: Inactive Control Components Mismatch
“Data connectors connecting control components that are not always active may lead
into deadlock.”
Two components are connected by a data connector and the receiving component
may be inactive when the data is sent, resulting in a data loss. A description of this
mismatch is available in Table 28.
Table 28: Inactive Control Components Mismatch
Interaction Type: Data (only)
Connectors: Data Connector
Direction of Interaction: Unidirectional (From A to B) or Bidirectional
Initiator: Both components A or B, or component A only
Special Consideration: Mismatch will not occur if the interaction includes both data and control
Mismatch Identification: For every interaction between components A and B using data connector in an architecture:
If component B does not have a central or distributed value for control unit the mismatch may occur
Result: A will transmit data to B, but component B may be inactive resulting in data loss

103
IAM 15: Single-Thread Assumption Mismatch
“Erroneous assumption of single-thread.”
In two interacting control components a single-threaded component makes a call to
the multi-threaded component that may spawn a new thread and return control to
the single-threaded component. The single-threaded component assumes that it is
working alone. This can cause synchronization problems when accessing share data
and resource contention. A description of this mismatch is shown in Table 29.
Table 29: Single-Thread Assumption Mismatch
Interaction Type: Control, or Data and Control
Connectors: Call, Spawn, Trigger
Direction of Interaction: Unidirectional (from A to B) or Bidirectional
Initiator: Both components A or B, or component A only
Special Considerations: Synchronization problems are likely to occur of the two components are utilizing a shared data method in addition to call, spawn or trigger
Mismatch Identification: For every interaction between components A and B using call, spawn or trigger in an architecture:
If component A is single threaded and component B is multithreaded and supports spawn, a mismatch can occur
Result: A call made from A to B may cause B to spawn a new thread; while A may assume that it is working alone. This can cause synchronization problems or resource contention.
IAM16: Cyclic Component Mismatch
“(Triggered) Call to cyclic (non-terminating) control component.”
When two components are interacting via a triggered call mechanism and one
component is cyclic, hence non-terminating, control may never be returned to the
caller causing a deadlock. A description of this mismatch is available in Table 30.
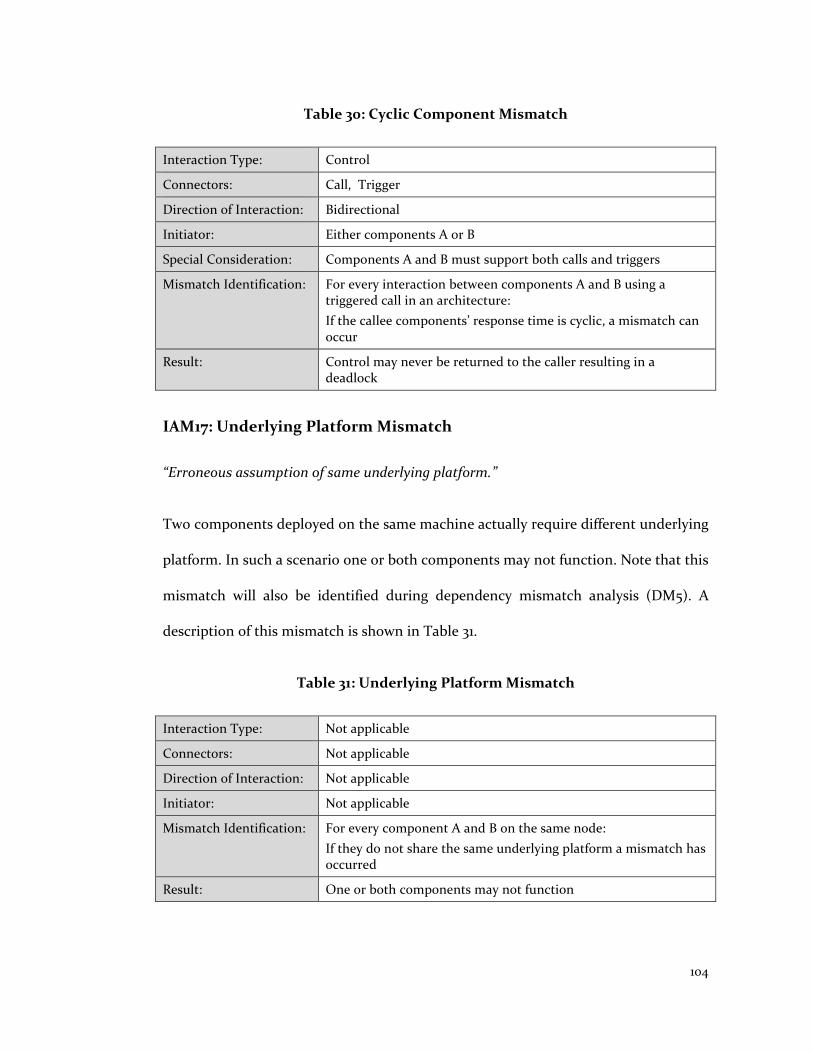
104
Table 30: Cyclic Component Mismatch
Interaction Type: Control
Connectors: Call, Trigger
Direction of Interaction: Bidirectional
Initiator: Either components A or B
Special Consideration: Components A and B must support both calls and triggers
Mismatch Identification: For every interaction between components A and B using a triggered call in an architecture:
If the callee components’ response time is cyclic, a mismatch can occur
Result: Control may never be returned to the caller resulting in a deadlock
IAM17: Underlying Platform Mismatch
“Erroneous assumption of same underlying platform.”
Two components deployed on the same machine actually require different underlying
platform. In such a scenario one or both components may not function. Note that this
mismatch will also be identified during dependency mismatch analysis (DM5). A
description of this mismatch is shown in Table 31.
Table 31: Underlying Platform Mismatch
Interaction Type: Not applicable
Connectors: Not applicable
Direction of Interaction: Not applicable
Initiator: Not applicable
Mismatch Identification: For every component A and B on the same node:
If they do not share the same underlying platform a mismatch has occurred
Result: One or both components may not function

105
IAM18: Encapsulation Call Mismatch
“(Triggered) Call to a private method.”
Two components are interacting via triggered calls and one component makes a call
to a private method of the other component. Since the method is not accessible the
interaction will fail. A description of this mismatch is available in Table 32.
Table 32: Encapsulation Call Mismatch
Interaction Type: Control
Connectors: Call, Trigger
Direction of Interaction: Bidirectional
Initiator: Either components A or B
Special Consideration: Components A and B must support both calls and triggers
Mismatch Identification: For every interaction between components A and B using a triggered call in an architecture:
If the callee component supports encapsulation, a mismatch can occur when attempting to access a private method
Result: The interaction will fail since the method is not accessible
IAM19: Encapsulation Spawn Mismatch
“(Triggered) Spawn to a private method.”
When two components are interacting via triggered spawns, a trigger in one
component may erroneously make a call to a method of the other component. If the
other component is encapsulated and the method called is private the method will
not be accessible resulting in interaction failure. This mismatch is further elaborated
in Table 33.

106
Table 33: Encapsulation Spawn Mismatch
Interaction Type: Control
Connectors: Spawn, Trigger
Direction of Interaction: Unidirectional or Bidirectional
Initiator: Either components A or B
Special Consideration: Components A and B must support both spawn and triggers
Mismatch Identification: For every interaction between components A and B using triggered spawn in an architecture:
If the callee component supports encapsulation, a mismatch can occur when attempting to access a private method
Result: The interaction will fail since the method is not accessible
IAM20: Private Data Mismatch
“Sharing Private Data.”
Two components are interacting via bridging shared data, but the data is private in
the original data component resulting in an interaction failure. A description of this
mismatch is available in Table 34.
Table 34: Private Data Mismatch
Interaction Type: Data
Connectors: Shared Data
Direction of Interaction: Unidirectional or Bidirectional
Initiator: Either components A or B
Mismatch Identification: For every interaction between components A and B using a shared data connector/data broker C:
If connector C supports encapsulation the interaction can fail
Result: The interaction will fail since the method is not accessible
IAM21: Multiple Central Control Unit Mismatch
“More than one central control unit exists.”

107
When two or more components with central control units are deployed on a single
node each may assume that they have absolute control of the system resulting in a
failure due to execution sequencing. A description of this mismatch is in Table 35.
Table 35: Multiple Central Control Unit Mismatch
Interaction Type: Data or Control or Both
Connectors: Call, Spawn, Data Connector, Shared Data, Trigger
Direction of Interaction: Unidirectional or Bidirectional
Initiator: Either components A or B
Mismatch Identification: For every interaction between components A and B in an architecture:
If A and B are on the same node and both have central control units
Result: Each component assumes that they have absolute control of the system resulting in an execution failure
IAM22: Reentrant Data Sharing Mismatch
“Sharing data with a reentrant component.”
Table 36: Reentrant Data Sharing Mismatch
Interaction Type: Data
Connectors: Shared Data
Direction of Interaction: Unidirectional or Bidirectional
Initiator: Either components A or B
Mismatch Identification: For every interaction between components A and B using a shared data in an architecture:
If either components support reentrance a mismatch can occur
Result: Data sharing can occur with the incorrect invocation of the component resulting in unexpected behavior
When two components are interacting via bridging shared data, and one of the
components is reentrant; data sharing may occur with incorrect invocation of the

108
component resulting in unexpected behavior. A description of this mismatch is
available in Table 36.
IAM23: Reentrant Data Transfer Mismatch
“A reentrant component is either sending or receiving a data transfer.”
Two components are interacting via a bridging data connector and at least one of the
components is reentrant. There can be an incorrect assumption of the specific
invocation of the component that is either sending or receiving data resulting in a
communication failure. A description of this mismatch is shown in Table 37.
Table 37: Reentrant Data Transfer Mismatch
Interaction Type: Data
Connectors: Data Connector, Trigger
Direction of Interaction: Unidirectional or Bidirectional
Initiator: Either components A or B
Mismatch Identification: For every interaction between components A and B using a data connector or trigger in an architecture:
If either components support reentrance a mismatch can occur
Result: Data sharing can occur with the incorrect invocation of the component resulting in unexpected behavior
IAM24: Non-Reentrant Call Mismatch
“(Triggered) Call to a non-reentrant component.”
When two components are interacting via a bridging call, the callee component is not
reentrant and may already be running; resulting in a communication failure. A
description of this mismatch is available in Table 38.

109
Table 38: Non-Entrant Call Mismatch
Interaction Type: Data and Control
Connectors: Call, Trigger
Direction of Interaction: Bidirectional
Initiator: Either components A or B
Special Consideration: Components A and B must support both calls and triggers
Mismatch Identification: For every interaction between components A and B using a triggered call in an architecture:
If either components support reentrance a mismatch can occur
Result: The callee component may already be running resulting in unexpected behavior
IAM25: Non-Reentrant Spawn Mismatch
“(Triggered) Spawn to a non-reentrant component.”
When two components are interacting via a bridging spawn, the spawnee component
is not reentrant and may already be running; resulting in a communication failure. A
description of this mismatch is shown in Table 39.
Table 39: Non-Reentrant Spawn Mismatch
Interaction Type: Data and Control
Connectors: Spawn, Trigger
Direction of Interaction: Unidirectional or Bidirectional
Initiator: Either components A or B
Special Consideration: Components A and B must support both spawns and triggers
Mismatch Identification: For every interaction between components A and B using a triggered spawn in an architecture:
If either components support reentrance a mismatch can occur
Result: The callee component may already be running resulting in unexpected behavior

110
IAM26: Prioritized Composition Mismatch
“Composition involves one or more prioritized parts.”
One of the two interacting components may support prioritization. This can cause
confusion in execution sequencing resulting in unexpected behavior. A description of
this mismatch is available in Table 40.
Table 40: Prioritized Component Mismatch
Interaction Type: Data and Control
Connectors: Call, Spawn, Data Connector, Shared Data, Trigger
Direction of Interaction: Unidirectional or Bidirectional
Initiator: Either components A or B
Mismatch Identification: For every interaction between components A and B using a call, spawn, data connector, shared data or trigger in the architecture:
If either components (or their parent components) support prioritization a mismatch can occur
Result: There sequence of execution maybe unexpected
IAM27: Prioritized Node Sharing Mismatch
“A prioritized component sharing a node with some other component.”
Table 41: Prioritized Node Sharing Mismatch
Interaction Type: Not applicable
Connectors: Not applicable
Direction of Interaction: Not applicable
Initiator: Not applicable
Mismatch Identification: For every components A and B deployed on the same node:
If one or either components (or their parent components) support prioritization a mismatch can occur
Result: The distribution of priorities will be unclear resulting in unexpected behavior
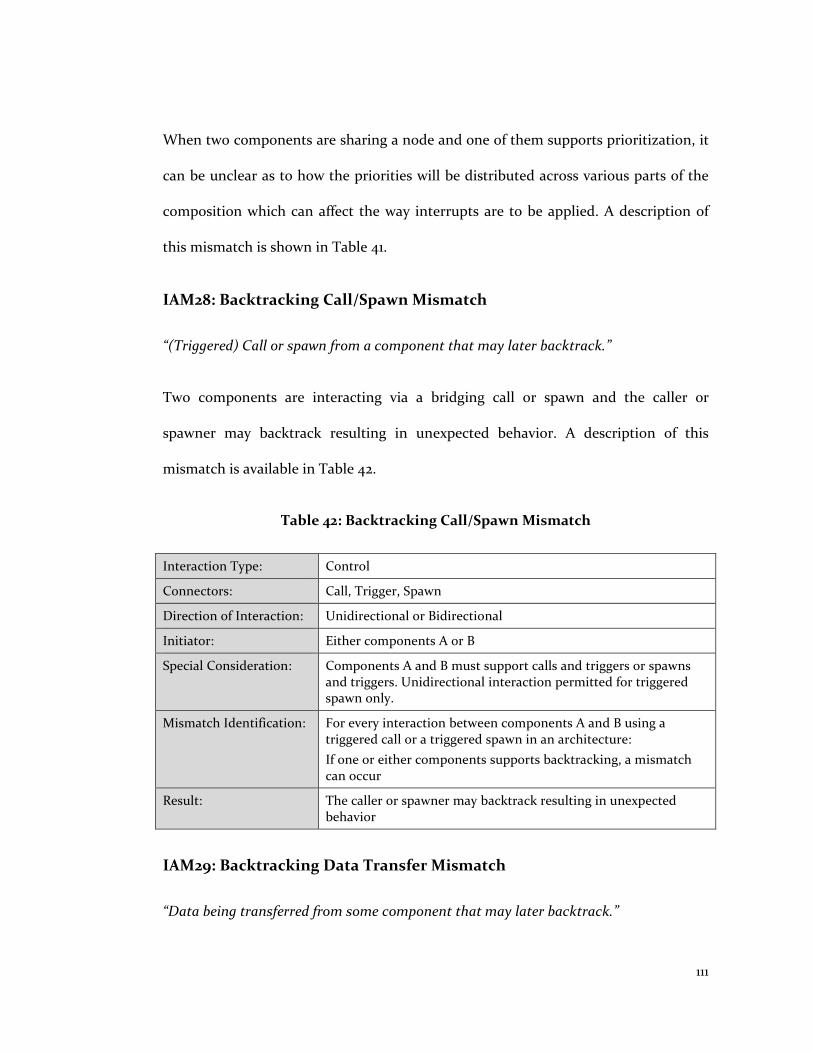
111
When two components are sharing a node and one of them supports prioritization, it
can be unclear as to how the priorities will be distributed across various parts of the
composition which can affect the way interrupts are to be applied. A description of
this mismatch is shown in Table 41.
IAM28: Backtracking Call/Spawn Mismatch
“(Triggered) Call or spawn from a component that may later backtrack.”
Two components are interacting via a bridging call or spawn and the caller or
spawner may backtrack resulting in unexpected behavior. A description of this
mismatch is available in Table 42.
Table 42: Backtracking Call/Spawn Mismatch
Interaction Type: Control
Connectors: Call, Trigger, Spawn
Direction of Interaction: Unidirectional or Bidirectional
Initiator: Either components A or B
Special Consideration: Components A and B must support calls and triggers or spawns and triggers. Unidirectional interaction permitted for triggered spawn only.
Mismatch Identification: For every interaction between components A and B using a triggered call or a triggered spawn in an architecture:
If one or either components supports backtracking, a mismatch can occur
Result: The caller or spawner may backtrack resulting in unexpected behavior
IAM29: Backtracking Data Transfer Mismatch
“Data being transferred from some component that may later backtrack.”

112
Two interacting components are exchanging data and the component which sends
the data supports backtracking. If the data sender backtracks it can cause undesired
side effects on the system. A description of this mismatch is shown in Table 43.
Table 43: Backtracking Data Transfer Mismatch
Interaction Type: Data or Control
Connectors: Data Connector, Trigger
Direction of Interaction: Unidirectional or Bidirectional
Initiator: Either components A or B
Mismatch Identification: For every interaction between components A and B using a data connector or trigger in an architecture:
If one or either components supports backtracking, a mismatch can occur
Result: The data sender may backtrack resulting in undesired effects
IAM30: Backtracking Shared Data Mismatch
“Shared data being modified by a component that may later backtrack.”
Table 44: Backtracking Shared Data Mismatch
Interaction Type: Data
Connectors: Shared Data
Direction of Interaction: Unidirectional or Bidirectional
Initiator: Either components A or B
Mismatch Identification: For every interaction between components A and B using a shared data connector in an architecture:
If one or either components supports backtracking, a mismatch can occur
Result: The data sender may backtrack resulting in undesired effects
Two components are interacting via shared data and one component supports
backtracking. The component may modify the shared data and backtracking causing

113
undesired effects in the overall system. A description of this mismatch is available in
Table 44.
IAM31: Predictable Call Response Time Mismatch
“(Triggered) Call from a component requiring some predictable response times to some
component(s) not originally considered.”
Two components are interacting via bridging (triggered) call connector and at least
one component requires predictable response times. In such a scenario if the one
component does not cater to the predictable response times of the other component,
it can result in undesired effects. A description of this mismatch is shown in Table 45.
Table 45: Predictable Call Response Time Mismatch
Interaction Type: Control
Connectors: Call, Trigger
Direction of Interaction: Bidirectional
Initiator: Either components A or B
Special Considerations: Components A and B must support both calls and triggers
Mismatch Identification: For every interaction between components A and B using a triggered call in an architecture:
If the response time value of one component is predictable, a mismatch can occur
Result: One component does not cater to predictable response time, while the other component requires a predictable response time resulting in undesired effects
IAM32: Predictable Spawn Response Time Mismatch
“(Triggered) Spawn from a component requiring some predictable response times to
some component(s) not originally considered.”

114
Two components are interacting via bridging (triggered) spawn connector and at least
one component requires predictable response times. In such a scenario if the one
component does not cater to the predictable response times required by the other
component can result in undesired effects. A description of this mismatch is available
in Table 46.
Table 46: Predictable Spawn Response Time Mismatch
Interaction Type: Control
Connectors: Spawn, Trigger
Direction of Interaction: Unidirectional or Bidirectional
Initiator: Either components A or B
Special Considerations: Components A and B must support both spawns and triggers
Mismatch Identification: For every interaction between components A and B using a triggered spawn in an architecture:
If the response time value of one component is predictable, a mismatch can occur
Result: One component does not cater to predictable response time, while the other component requires a predictable response time resulting in undesired effects
IAM33: System Reconfiguration Mismatch
Table 47: System Reconfiguration Mismatch
Interaction Type: Data or Control
Connectors: Call, Spawn, Data Connector, Shared Data, Trigger
Direction of Interaction: Unidirectional or Bidirectional
Initiator: Either components A or B
Mismatch Identification: For every interaction between components A and B using a call, spawn, data connector, shared data, spawn or trigger:
If only one component supports data online reconfiguration, a mismatch can occur
Result: Only the partial sub-system will recover upon the failure resulting in undesired effects

115
“Only part of the resulting system automatically reconfigures upon failure.”
Two components are interacting where only one component supports online
reconfiguration upon failure. This can result in partial system reconfiguring upon
failure causing undesired effects. A description of this mismatch is shown in Table 47.
IAM34: Synchronization Mechanism Mismatch
“Some components that were expected to synchronize have different synchronization
mechanisms.”
Two interacting components are executing concurrently on a system and have
different synchronization mechanisms. This can cause undesired effects. A
description of this mismatch is available in Table 48.
Table 48: Synchronization Mechanism Mismatch
Interaction Type: Data or Control
Connectors: Call, Spawn, Data Connector, Shared Data, Trigger
Direction of Interaction: Unidirectional or Bidirectional
Initiator: Either components A or B
Mismatch Identification: For every interaction between components A and B using a call, spawn, data connector, shared data spawn or trigger connector in an architecture:
If component A’s value for concurrency and synchronization; and component B’s value for concurrency and synchronization are not the same a mismatch can occur.
Result: Synchronization between components will fail resulting in undesired effects
IAM35: Preemptable Call Mismatch
“(Triggered) Call to a component that should be preemptable and isn’t.”

116
Two components interacting via bridging (triggered) call and the caller’s parent
component is preemptable and callee’s parent is not. This can result in situations
where the caller is preempted and callee is not. A description of this mismatch is
shown in Table 49.
Table 49: Preemptable Call Mismatch
Interaction Type: Control
Connectors: Call, Trigger
Direction of Interaction: Bidirectional
Initiator: Either components A or B
Special Consideration: Components A and B must support both calls and triggers
Mismatch Identification: For every interaction between components A and B using a triggered call in an architecture:
If only one component’s parent supports preemption a mismatch can occur
Result: In certain situations a caller will be preempted while callee is not
IAM36: Preemptable Spawn Mismatch
“(Triggered) Spawn to a component that should be preemptable and isn’t.”
Table 50: Preemptable Spawn Mismatch
Interaction Type: Control
Connectors: Spawn, Trigger
Direction of Interaction: Unidirectional or Bidirectional
Initiator: Either components A or B
Special Consideration: Components A and B must support both spawns and triggers
Mismatch Identification: For every interaction between components A and B using a triggered spawn in an architecture:
If only one component’s parent supports preemption a mismatch can occur
Result: In certain situations a caller will be preempted while callee is not

117
Two components interacting via bridging (triggered) spawn and the caller’s parent
component is preemptable and callee’s parent is not. This can result in situations
where the caller is preempted and callee is not. A description of this mismatch is
available in Table 50.
IAM37: Garbage Collector Mismatch
“(Triggered) Call to a component that performs on the fly garbage collection.”
Two components are interacting via a bridging (triggered) call and the callee
performs on the fly garbage collection while the caller has requirements for
predictable or bounded response times. This can result in undesirable side effects. A
description of this mismatch is shown in Table 51.
Table 51: Garbage Collector Mismatch
Interaction Type: Control
Connectors: Call, Trigger
Direction of Interaction: Bidirectional
Initiator: Either components A or B
Special Consideration: Components A and B must support both calls and triggers
Mismatch Identification: For every interaction between components A and B using a triggered call in an architecture:
If component B’s reconfiguration is ‘on the fly garbage collection’ and component A expects a bounded response time a mismatch can occur
Result: Component B’s response may be delayed resulting in undesired effects

118
IAM38: Encapsulation Instantiation Mismatch
“Incorrect assumption of which instantiation of an object is either sending or receiving
a data transfer.”
Two components interacting via a bridging data connector and at least one
component supports encapsulation. This can result in an incorrect assumption of
which instantiation of an object is sending or receiving data transfer resulting in
unexpected system behavior. A description of this mismatch is available in Table 52.
Table 52: Encapsulation Instantiation Mismatch
Interaction Type: Data and Control
Connectors: Data Connector, Trigger
Direction of Interaction: Bidirectional
Initiator: Either components A or B
Mismatch Identification: For every interaction between components A and B using data connector or trigger connector in an architecture:
If either components supports encapsulation a mismatch can occur
Result: Incorrect assumption of which instantiation of on object is sending or receiving data transfer resulting in unexpected system behavior
IAM39: Data Sharing Instantiation Mismatch
“Sharing data with the incorrect instantiation of an object.”
Two components are interacting via bridging shared data and at least one of the parts
involved supports encapsulation. This can result in data sharing with incorrect
instantiation of a component object. A description of this mismatch is available in
Table 53.

119
Table 53: Data Sharing Instantiation Mismatch
Interaction Type: Data
Connectors: Shared Data, Trigger
Direction of Interaction: Unidirectional or Bidirectional
Initiator: Either components A or B
Mismatch Identification: For every interaction between components A and B using shared data connector in an architecture:
If either components supports encapsulation a mismatch can occur
Result: Incorrect assumption of which instantiation of on object is sending or receiving data transfer resulting in unexpected system behavior
IAM40: Different Response Time Granularity Mismatch
“Time represented/compared using different granularities.”
Two interacting components have response times different than unbounded or cyclic
unbounded and are distributed over machines that compare times with different
granularities. This can cause undesired effects for time-related communication. A
description of this mismatch is available in Table 54.
Table 54: Different Response Time Granularity Mismatch
Interaction Type: Data or Control
Connectors: Not applicable
Direction of Interaction: Unidirectional or Bidirectional
Initiator: Either components A or B
Mismatch Identification: For every interaction between components A and in an architecture:
If the components are deployed on different nodes and both have response time values other than unbounded or cyclic unbounded, can cause a mismatch
Result: This can cause undesired effects for time-related communication

120
IAM41: Absolute Time Mismatch
“Absolute time values are off.”
Two interacting components have response times different than unbounded or cyclic
unbounded, and are distributed over machines that have failed clocks. This can cause
undesired effects for time-related communication. A description of this mismatch is
shown in Table 55.
Table 55: Absolute Time Mismatch
Interaction Type: Data or Control
Connectors: Not applicable
Direction of Interaction: Not applicable
Initiator: Not applicable
Mismatch Identification: For every interaction between components A and B in an architecture:
If the components are deployed on different nodes, a mismatch can occur if the nodes have failed clocks
Result: This can cause undesired effects for time-related communication
IAM42: Underlying Data Representation Mismatch
“Sharing or transferring data with differing underlying representations.”
Two interacting components communicating via data connector or shared data have
different underlying data representations, resulting in a communication failure. Note
that this mismatch will also be identified during interface mismatch analysis (IM4
and IM6). A description of this mismatch is shown in Table 56.
121
Table 56: Underlying Data Representation Mismatch
Interaction Type: Data
Connectors: Data Connector, Shared Data, Trigger
Direction of Interaction: Unidirectional or Bidirectional
Initiator: Either components A or B
Mismatch Identification: For every interaction between components A and B using data connector, shared data or trigger in an architecture:
a mismatch can occur because of different underlying data formats, units and coordinate systems
Result: This can result in communication failure
IAM43: Resource Contention Mismatch
“Resource Contention”
Two or more components are deployed on the same node and at least one component
requires predictable response times. This can result in response times being affected
indirectly because resource contention was not initially accounted for. A description
of this mismatch is shown in Table 57.
Table 57: Resource Contention Mismatch
Interaction Type: Not applicable
Connectors: Not applicable
Direction of Interaction: Not applicable
Initiator: Not applicable
Mismatch Identification: For every component deployed in an architecture:
If two components are deployed on the same node and either components require a predictable response time a mismatch can occur
Result: Some resource contention which was not originally accounted for can occur affecting the response time.

122
IAM44: DBMS Heterogeneity Mismatch
“Potential database and/or DBMS heterogeneity problems may occur.”
Two or more data repositories are present resulting in problems on semantic
heterogeneity, differing data item granularity, distribution, replication and different
structural organization. A description of this mismatch is available in Table 58.
Table 58: DBMS Heterogeneity Mismatch
Interaction Type: Data
Connectors: Not applicable
Direction of Interaction: Not applicable
Initiator: Not applicable
Mismatch Identification: If an architecture has 2 data repositories a mismatch can occur
Result: This can result in communication failure
IAM45: Inaccessible Shared Data Mismatch
“Inaccessible Shared Data”
Table 59: Inaccessible Shared Data Mismatch
Interaction Type: Data
Connectors: Shared data
Direction of Interaction: Unidirectional and Bidirectional
Initiator: Either components A or B
Mismatch Identification: For every interaction between components A and B using shared data component C in an architecture:
If either components A or B cannot access C a mismatch can occur
Result: This can result in communication failure
123
Two components are interacting via a shared data connector. Communication is
effected through a third data component and one component does not have access to
the data repository causing communication failure. A description of this mismatch is
shown in Table 59.
IAM46: Distributed Control Units Mismatch
“Distributed control units are present.”
Two interacting components have distributed control units. Here components may
assume that the problem is being solved elsewhere by some other control unit. A
description of this mismatch is shown in Table 60.
Table 60: Distributed Control Units Mismatch
Interaction Type: Data
Connectors: Shared data
Direction of Interaction: Unidirectional and Bidirectional
Initiator: Either components A or B
Mismatch Identification: For every interaction between components A and B using shared data component C in an architecture:
If either components A or B do not have access to C a mismatch can occur
Result: This can result in communication failure
IAM47: Roll Forward Error Mismatch
“One component rolls forward upon error while the other component does not assume
roll forward.”

124
There are two interacting components where one rolls forward upon error while the
other component does not assume a roll forward resulting in undesired effects. A
description of this mismatch is available in Table 61.
Table 61: Roll Forward Mismatch
Interaction Type: Data and Control
Connectors: Call, Spawn, Data Connector, Shared Data, Trigger
Direction of Interaction: Unidirectional and Bidirectional
Initiator: Either components A or B
Mismatch Identification: For every interaction between components A and B using call, spawn, data connector, shared data or trigger in an architecture:
If component A’s error handling supports roll forward and component B’s error handling does not support roll forward or assume it
Result: This can result in unexpected system behavior
IAM48: Roll Back Error Mismatch
“One component rolls back upon error while the other component does not assume roll
back.”
Table 62: Roll Back Error Mismatch
Interaction Type: Data and Control
Connectors: Call, Spawn, Data Connector, Shared Data, Trigger
Direction of Interaction: Unidirectional and Bidirectional
Initiator: Either components A or B
Mismatch Identification: For every interaction between components A and B using call, spawn, data connector, shared data or trigger in an architecture:
If component A’s error handling supports roll back and component B’s error handling does not support roll back or assume it
Result: This can result in unexpected system behavior

125
There are two interacting components where one rolls back upon error while the
other component does not assume a roll back resulting in undesired effects. A
description of this mismatch is available in Table 62.
IAM 49: Error Handling Mismatch
“One of the components does not support any error handling mechanism”
There are two communicating components where at least one component does not
support any error handling mismatch resulting in synchronization issues, and other
undesired effects. A description of this mismatch is available in Table 63.
Table 63: Error Handling Mismatch
Interaction Type: Data and Control
Connectors: Call, Spawn, Data Connector, Shared Data, Trigger
Direction of Interaction: Unidirectional and Bidirectional
Initiator: Either components A or B
Mismatch Identification: For every interaction between components A and B using call, spawn, data connector, shared data or trigger in an architecture:
If either component does not support an error handling mechanism a mismatch can occur
Result: The component that does not support error handling mechanisms will not decipher a failure resulting in a synchronization issues and unexpected system behavior
IAM50: Error Handling Synchronization Mismatch
“Two communicating components do not share common error handling mechanisms.”
There are two interacting components and they do not share common error handling
mismatches resulting in data synchronization issues and undesired system behavior.

126
Note that this conflict will also be identified as an interface mismatch (IM7). A
description of this mismatch is available in Table 64.
Table 64: Error Handling Synchronization Mismatch
Interaction Type: Data and Control
Connectors: Call, Spawn, Data Connector, Shared Data, Trigger
Direction of Interaction: Unidirectional and Bidirectional
Initiator: Either components A or B
Mismatch Identification: For every interaction between components A and B using call, spawn, data connector, shared data or trigger in an architecture:
If they do not share a common error handling mechanism mechanisms a mismatch can occur
Result: Upon failure neither components may be able to exchange error information resulting in synchronization issues and undesired system behavior.
6.3 Dependency Mismatch Analysis Rules
Dependency mismatch analysis rules enable identification of dependency
interoperability conflicts in a COTS-based architecture. The following sub-section
lists these dependency mismatches and corresponding rules utilized to identify them.
DM1: Communication Dependency Mismatch
Several COTS products require communicating with other components to fulfill
certain missing required functionalities. A common example of such an occurrence is
where customer relationship management [Sharp 2002] requires a database
management system [Silberschatz et al. 2005] to perform data storage and retrieval
function amongst others. This mismatch occurs when such a communication
dependency is missing in the architecture or there is no interaction between the

127
COTS product (A) and dependent component (B). Note that there can be multiple
options for dependent components (B) for any COTS product (A). A description of
this mismatch is available in Table 65.
Table 65: Communication Dependency Mismatch
Mismatch Identification: For every component in an architecture:
Identify communication dependency values for the component and evaluate the component’s interactions to verify if these dependencies are being met
If a dependency is not met a mismatch has occurred.
Result: The component will not function as required
Resolution: Add the missing product(s) and/or interaction in the architecture
DM2: Communication Incompatibility Mismatch
Table 66: Communication Incompatibility Mismatch
Mismatch Identification: For every component in an architecture:
Identify communication incompatibility values for the component and evaluate the component’s interactions to verify the component is communicating with any components listed in the communication incompatibility value.
If an interaction is found where the component is communicating with another component on the communication incompatibility attribute list a mismatch has occurred.
Result: The component interaction will not function as required
Resolution: Replace the incompatible component with an alternate compatible product with a similar functionality
COTS products often times have known incompatibilities with other components. For
example certain content management systems [Addey et. al 2003] are known to be
incompatible with certain database management systems [Silberschatz et al. 2005].
Communication incompatibility mismatch occurs when such an interaction exists.
Such a mismatch can be resolved by identifying an alternate component that can

128
replace the incompatible component. The incompatibility mismatch while easier to
identify, is more difficult to resolve because of economic, strategic and technical
considerations. A description of this mismatch is available in Table 66.
DM3: Execution Language Dependency Mismatch
COTS components require underlying frameworks, virtual machines or other
software components for executing its compiled or un-compiled code. For example a
Java program must be deployed on a Java runtime environment or an environment
which supports Java-byte code execution [Sun Java 1994]. An execution language
dependency mismatch occurs when such a COTS component (A) is deployed on a
product that cannot support execution A’s code. A description of this mismatch is
available Table 67.
Table 67: Execution Language Dependency Mismatch
Mismatch Identification: For every component in an architecture:
Identify deployment language attribute values for the component and evaluate if the component’s parent’s (i.e. where the component was deployed) execution language support attribute includes those languages.
If the parent component’s execution language support attribute does not support the component’s deployment language attributes a mismatch has occurred
Result: Product A will not function
Resolution: Deploy product A on a component which will support executing A’s compiled or un-compiled code
DM4: Same Node Incompatibility Mismatch
There are several cases where a component does not appropriately function when
deployed on the same node with another specific incompatible product, regardless of

129
whether they interacting with each other. This is often observed with different
versions of COTS products. One possible reason for such incompatibility is that both
components are competing for the same resources. A same node incompatibility
mismatch occurs when products A and B are incompatible when deployed on the
same node. Resolving such a mismatch requires redesigning the architecture of the
node where such a mismatch can occur. A description of this mismatch is available in
Table 68.
Table 68: Same Node Incompatibility Mismatch
Mismatch Identification: For every component in an architecture:
Check every component deployed with the component A’s same node incompatibility attribute
If there is a component that has been deployed on the same node as A and is in A’s same node incompatibility list a mismatch has occurred
Result: Product A and/or B will not function
Resolution: Redesign the architecture so that COTS product A and B are not on the same node
DM5: Underlying Dependency Mismatch
COTS products require support of other components to fulfill certain missing
functionalities. For example .NET based web applications [Microsoft .NET Framework
2007] require an Internet Information Services server [Tulloch 2003]. The underlying
dependency mismatch occurs when such COTS product dependencies are missing in
the architecture. It is not necessary that the COTS have explicit interaction with its
required components (such as described in communication dependency mismatch).
The COTS product may be deployed on its required component or the presence of the
component on the node may be sufficient enough for the COTS to function as
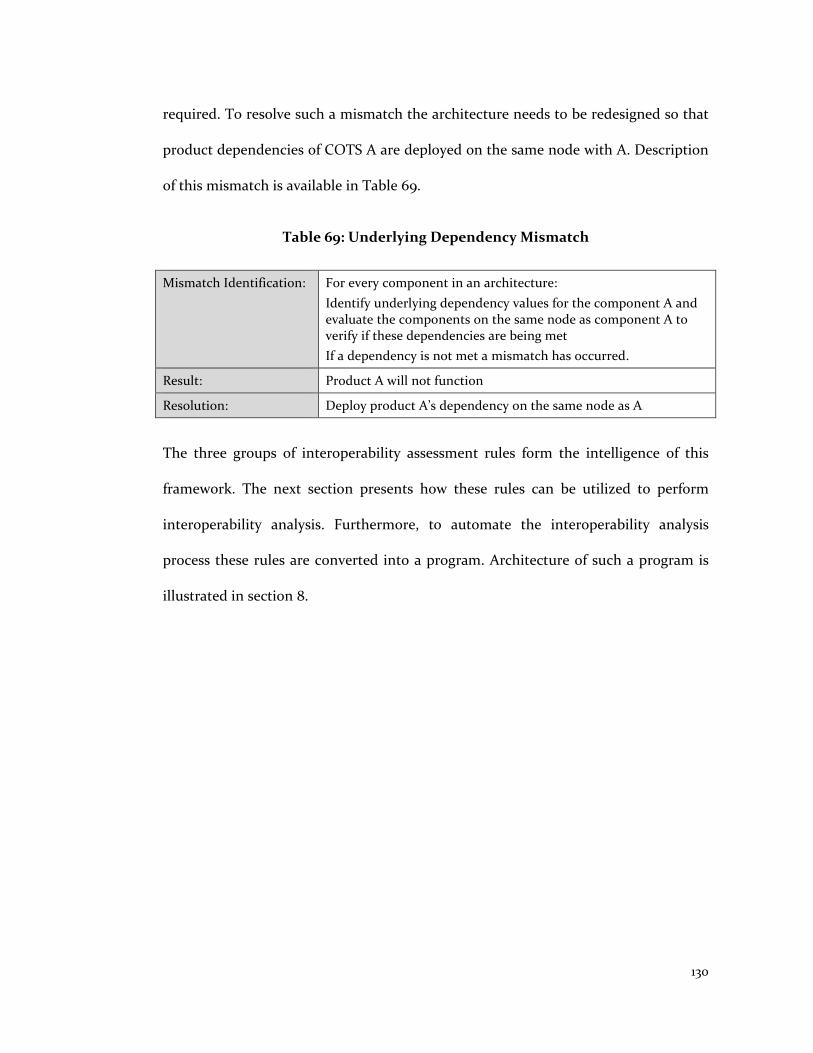
130
required. To resolve such a mismatch the architecture needs to be redesigned so that
product dependencies of COTS A are deployed on the same node with A. Description
of this mismatch is available in Table 69.
Table 69: Underlying Dependency Mismatch
Mismatch Identification: For every component in an architecture:
Identify underlying dependency values for the component A and evaluate the components on the same node as component A to verify if these dependencies are being met
If a dependency is not met a mismatch has occurred.
Result: Product A will not function
Resolution: Deploy product A’s dependency on the same node as A
The three groups of interoperability assessment rules form the intelligence of this
framework. The next section presents how these rules can be utilized to perform
interoperability analysis. Furthermore, to automate the interoperability analysis
process these rules are converted into a program. Architecture of such a program is
illustrated in section 8.

131
Chapter 7
Interoperability Evaluation Process
The COTS interoperability evaluation process is the third and final component of this
framework. This is a guided process that enables analysis of a COTS-based systems
architecture using COTS product definitions characterized using interoperability
representation attributes and interoperability assessment rules. This analysis will
enable the development team to estimate the amount of integration effort, which can
then become part of the COTS selection evaluation criteria and aid in the decision
making process. This section presents the guided process termed COTS
interoperability evaluator. One primary benefit of this process is that using the
attributes and interoperability assessment rules, this process can be significantly
automated – reducing the effort spent in analyzing COTS-based architectures.
The COTS interoperability evaluation process is illustrated in Figure 18. The process
has been designed for effective reuse across an organization. The COTS
interoperability evaluation process consists of two sub-processes – the
interoperability definition generation process and the interoperability analysis
process (indicated by the shaded block in Figure 18). The remainder of this section
will describe each of these two sub-processes in details.

132
Figure 18: COTS Interoperability Evaluation Process
7.1 Interoperability Definition Generation Process
This process involves building a COTS interoperability definitions repository. In an
organization the COTS interoperability experts (i.e. personnel with significant
amount of experience in COTS assessment) will be responsible for building the
maintaining such a repository. Building the definition repository is a multi-step
process:
1. The first step involves creating a standard representation format for storing
attributes and values in a COTS interoperability definition. This may be as

133
simple as attribute value pairs or a complex XML schema [Harold and Means
2004] for storing these values.
2. The second step entails identifying COTS products whose interoperability
characteristics are required. These will be requested by project managers
performing interoperability assessment for their respective projects.
3. The COTS interoperability experts will now research every product on the list
to identify their interoperability attribute values. Sources where such
information can be found include, but is not restricted to:
a. COTS product websites: Most general attributes, interface attributes
and some dependency attributes should be easily accessible from the
COTS product websites itself.
b. COTS product support team: For the attributes not identified from
COTS product websites, product vendors could be contacted to obtain
information. Alternately, product manuals could be utilized to identify
some of these attribute values.
c. Developers who have had experience in integrating the product: These
developers would be instrumental in identifying some dependency
values attributes such as same node incompatibilities and
communication incompatibility.
d. COTS product related newsgroups and forums: An alternative to
experience developers such newsgroups could be visited to identify
dependency attributes.

134
4. This information will then be stored in the format defined in step 1. Steps 2 to
4 will be repeated in order to create definitions for every product required for
assessment.
5. The final step involves maintaining these definitions and updating them as
new COTS product versions are released.
These COTS interoperability definitions stored in the repository will be used during
the COTS interoperability analysis process.
7.2 Interoperability Analysis Process
This process is responsible for guiding the development team to perform
interoperability assessment of the COTS-based system architecture. The process
follows the steps below:
P1 - Design COTS-based Architecture:
The process begins with the development team designing a COTS-based architecture.
The design includes placeholders for COTS products and their interactions. Every
interaction between two COTS or a COTS and custom products is characterized by:
Interaction type defines whether the interaction involves data exchange, control
exchange or both.
Direction of interaction indicates the direction of data flow, or control transfer; an
interaction can be unidirectional or bidirectional.

135
Initiator indicates bidirectional interactions that involve a query-response style of
operation where only one component is responsible for starting (or initiating) the
interaction. The initiator value indicates which component is responsible for starting
the data/control exchange.
P2 - Identify Potential COTS Component Combinations:
The development team next identifies potential COTS component combinations
which can fulfill the functionalities required by the empty COTS placeholders in the
architecture. Custom products can be used for functionalities where COTS products
are unavailable. (S)He will then extract the interoperability definitions for the
selected COTS products from the COTS interoperability definition repository. If the
definitions are not available he will request to the COTS interoperability experts to
make the definitions available.
P3 - Analyze COTS-Based Architecture(s):
Utilizing the rules from the interoperability assessment rules repository, the
development team will assess every COTS-COTS and COTS-custom interaction for
potential mismatches. The results of the analysis will be saved in the COTS
interoperability analysis report.
P4 – Search for Bridge, Mediator and Quality of Service Connectors:
In the event that the development team identifies interface mismatches and requires
bridging connectors they will again search the interoperability definition repository
for COTS connectors which can act as bridges or mediators to facilitate the

136
interaction. In addition to searching for simple bridging and mediator connectors this
framework can also be extended to accommodate quality of service (QoS) connectors.
One such quality of service extension to identify connectors for voluminous data
intensive system has been developed by Chris Mattmann as part of his dissertation
[Mattmann 2007]. To utilize this extension the architect defines QoS scenario
parameters. The extension will utilize this and a set of its own rules that evaluate the
best possible high voluminous data intensive COTS connector which would best fit
the given scenario.
P5 – Evaluate COTS Interoperability Analysis Report
The team will finally evaluate the COTS interoperability analysis report to identify the
source lines of glue-code it will take to integrate the specific COTS-based systems
architecture. This estimate will be used in the COCOTS [Abts 2004] cost estimation
tool to obtain an effort estimate to integrate the architecture.
Steps P3 to P5 will be repeated for every COTS combination and the resulting effort
estimates will become evaluation criteria during the COTS selection process.
The interoperability evaluation process defined above is simple and easy to
understand. However this process can become effort intensive when analyzing
multiple COTS-based architectures, especially given that there are about 62 rules to
evaluate for every interaction. To mitigate this, the framework components have been
designed such that they can be automated. An example of such automation is
discussed in the next section.

137
Chapter 8
Tool Support
One significant benefit of this framework is its capability to be automated. Using the
three components of this interoperability framework: representation attributes,
assessment rules and guided evaluation process; a tool titled Integration Studio has e
have developed a tool – Integration Studio. This section will describe the tool its
architecture and its component in details.
A successful automation of this framework was required to address two significant
challenges:
1. Ensure that the effort spent in COTS interoperability assessment is much less
than the effort spent in performing this assessment manually.
2. Ensure that the framework supports extensibility i.e. it should be upgradable
to the prevailing COTS characteristics.
These challenges are addressed by developing a framework that is modular,
automated and where COTS interoperability definitions and interoperability
assessment criteria can be updated on the fly. The architecture of the Integration
Studio tool is illustrated in Figure 19. The tool allows for an organization to maintain
a reusable and frequently updated portion (COTS selector) remotely and a portion
that is minimally updated (interoperability analyzer) on the client side. This allows
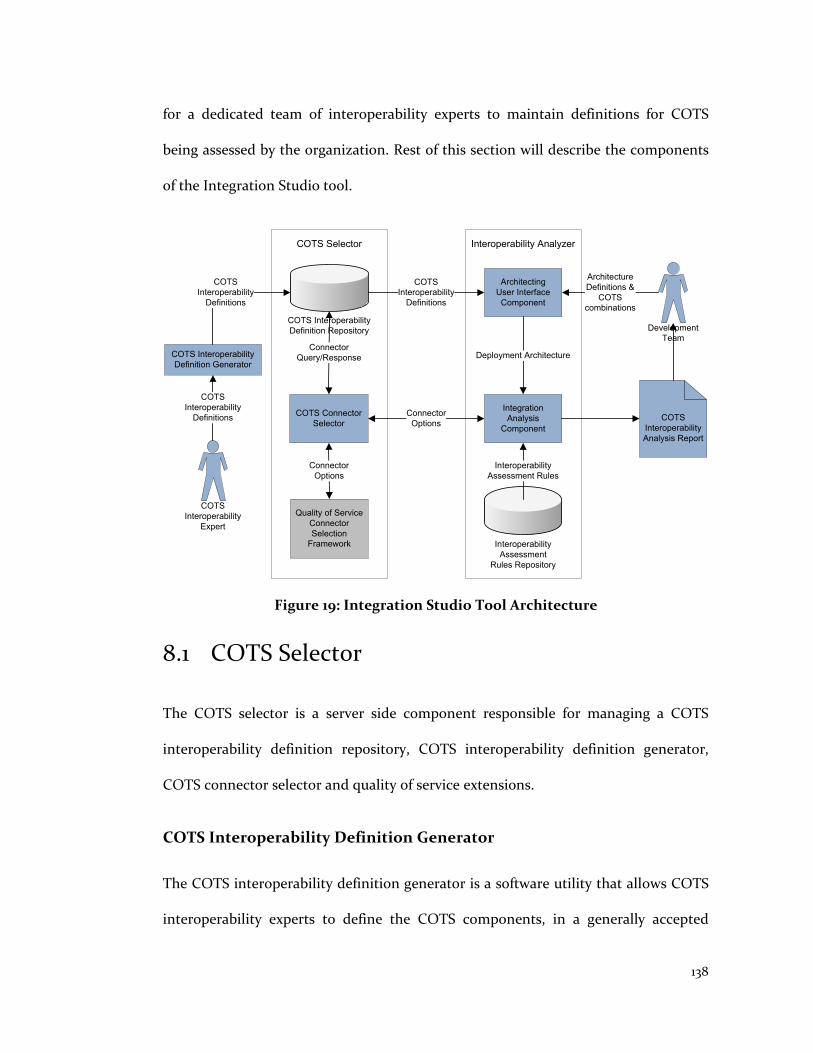
138
for a dedicated team of interoperability experts to maintain definitions for COTS
being assessed by the organization. Rest of this section will describe the components
of the Integration Studio tool.
COTS Interoperability
Definition Generator
COTS Connector
Selector
Architecting
User Interface
Component
COTS
Interoperability
Definitions
Deployment Architecture
COTS
Interoperability
Definitions
Connector
Query/Response
Integration
Analysis
Component
Connector
Options
Interoperability AnalyzerCOTS Selector
Quality of Service
Connector
Selection
Framework
COTS
Interoperability
Analysis Report
COTS Interoperability
Definition Repository
Interoperability
Assessment
Rules Repository
Interoperability
Assessment Rules
Connector
Options
Development
Team
Architecture
Definitions &
COTS
combinations
COTS
Interoperability
Expert
COTS
Interoperability
Definitions
Figure 19: Integration Studio Tool Architecture
8.1 COTS Selector
The COTS selector is a server side component responsible for managing a COTS
interoperability definition repository, COTS interoperability definition generator,
COTS connector selector and quality of service extensions.
COTS Interoperability Definition Generator
The COTS interoperability definition generator is a software utility that allows COTS
interoperability experts to define the COTS components, in a generally accepted

139
standard format. Should this framework be widely accepted, the COTS vendors may
develop such definitions for their components and make them available to
development teams. Up to that point in time online repositories such as Sourceforge
[Sourceforge 2001] can aid in development and dissemination of the COTS
definitions. The COTS interoperability definition generator component is currently a
PHP-based [PHP 2001] online tool which assists experts in building COTS definitions
in an XML format.
COTS Interoperability Definition Repository
The COTS definition repository is an online storage of various COTS interoperability
definitions (in XML format) indexed and categorized by their roles and the
functionality they provide (i.e. database systems, graphic toolkits etc.). The PHP-
based repository provides access to an interoperability analyzer via a HTTP/REST
service [Fielding 2000], so that it can query the repository to obtain definitions of
COTS products that are being analyzed. In commercial use such a repository could
potentially be maintained by a standards organization and licensed to commercial
and government organizations developing a sizable amount of COTS-Based
Applications.
COTS Connector Selector
This component provides an interface for the interoperability analysis framework to
be queried when there is an incompatibility identified that may be resolved by the use
of a bridge connector. The interoperability analysis component queries the connector
selector component with the source of incompatibility between the two components

140
such as data format, incompatible input/output data interfaces, etc. and interaction
properties of the two components. Based on this information the connector selector
queries the COTS interoperability definition repository to identify if there exists a
bridging connector that can resolve such in incompatibility. If such a connector is
found the COTS interoperability assessment report will recommend use of such a
connector. Currently this functionality has not been implemented. This is because
the present COTS interoperability definition repository does not have enough
connector definitions to warrant such a service. Note that this functionality can also
be extended to provide a combination of connectors as shown by [Spitznagel and
Garlan 2001] [Spitznagel and Garlan 2003]. For interactions where such a bridge does
not exist in the COTS repository the tool will recommend development of a custom
wrapper with information pertinent to the type of wrapper functionality, language
used and connectors supported.
Quality of Service Connector Selection Framework
This framework can be extended to recommend quality of service connectors for
specific architectural scenarios. The current Integration Studio tool has been
integrated with one such high voluminous data intensive connector selection
framework [Mattmann 2007]. The tool interface is extended to support a specific
connector that will represent a high voluminous data intensive connector and will
store scenario parameters. These parameters are then passed to this extension via
HTTP/REST service [Fielding 2000] and the service responds with a prioritized list of
COTS connectors that will satisfy the data distribution scenario. This list is then
included in the interoperability assessment report for the development team.

141
8.2 Interoperability Analyzer
The Interoperability Analyzer is a client side component responsible for providing an
architecting user interface, an integration analysis component and an interoperability
assessment rules repository. The interoperability analyzer is currently implemented in
C# .NET [Microsoft .NET Framework 2007].
Architecting User Interface Component
Figure 20: Integration Studio Interface Screenshot
This component provides a drag-n-drop graphical user interface for the developers to
create the deployment diagram. The component also queries the COTS
interoperability definition repository via an HTTP/REST service in the COTS selector

142
component to obtain the definitions of COTS products being used in the conceived
system. The graphical user interface has also been extended to accommodate for
quality of service connector representation in the deployment diagrams. After
completing the architecture deployment diagram, the user instructs the tool to
perform its analysis at which point the graphical user interface retrieves all the
definitions and develops an architecture specification to be sent to the
interoperability analysis component. A screenshot of the architecting user interface
component is illustrated in Figure 20.
Interoperability Analysis Component
This component contains the actual algorithm for analyzing the COTS-based system
architecture. It utilizes the interoperability assessment rules specified in the rules
repository along with the architecture specification to identify internal assumption
mismatches, interface (or packaging) mismatches and dependency analysis. When it
encounters an interface dependency mismatch the component queries the COTS
connector selector component to identify if there is an existing bridge connector
which could be used for integration of the components. If not it will recommend in
the report that a wrapper of the appropriate type (communication, coordination,
conversion or facilitation [Mehta et al. 2000]) and provide some specific details as to
the functionality of the wrapper required to enable interaction between the two
components. Users can estimate the source lines of glue code required to integrate
the two components via details of wrapper functionality and general COTS
information (size of COTS and complexity of interface).

143
Interoperability Assessment Rules Repository
This repository is the knowledgebase of the system. It specifies the interoperability
assessment rules that drive the analysis results. These rules utilize the COTS
interoperability attribute, definitions and based on their values provide results. The
repository includes rules for identifying interface mismatches and corresponding
resolutions, internal assumption mismatches and dependency mismatches. Currently
this repository is in the form of a component within the program. However it is
possible to convert these rules in an ontology language such as OWL [Owl 2004],
which supports representation and processing of rules.
COTS Interoperability Analysis Report
The final outcome of the proposed framework is this report. The report contains three
major sections: interface mismatch analysis, internal assumptions mismatch analysis
and dependency mismatch analysis. In addition it will recommend the use of various
integration strategies for supporting component interaction. This report is presented
in HTML format [W3 HTML 1999].
The Integration Studio tool experienced 4 major version releases. The first version V1
was built using 60 rules, utilized COTS definitions with 38 interoperability attributes
and provided extremely simple user interface with no saving feature. The report
produced in this version was in plain text format. The next version of the tool, V2, was
built to support all 62 rules, utilized COTS definition with 40 interoperability
attributes and provided an advanced user interface with a saving feature. The report
generated in version V2 was in HTML format and had better navigability than the

144
report produced by V1 of the tool. Versions 3 (V3) of Integration Studio included
network support so that COTS interoperability definitions could be automatically
downloaded from the server into the tool. It also incorporated support to include
quality of service extensions such as the voluminous data intensive systems. The final
version of the tool, V4, was enhanced to support interoperability definitions with 42
attributes and one rule out of the 62 rules was updated to reflect changes in the
framework.
145
Chapter 9
Framework Validation and Results
9.1 Validation Methodology
The framework was evaluated specifically with respect to the following qualities:
Completeness
Completeness indicates if the framework identifies all possible mismatches that can
be recognized at its high-level of assessment in a given domain. The framework will
demonstrate completeness if there are no false negatives in the mismatch
identification process. A false negative occurs when the framework cannot identify a
mismatch that exists in a given COTS-based architecture (Table 70).
Correctness
Correctness indicates that all mismatches reported by this framework are conflicts
which will actually occur when implementing the system. The framework will
demonstrate correctness if there are no false positives in the mismatch identification
process. A false positive occurs when the framework identifies a mismatch but it does
not really exist (Table 70).
Note that completeness and correctness together satisfy the effectiveness criteria
specified in the statement of purpose (section 1).
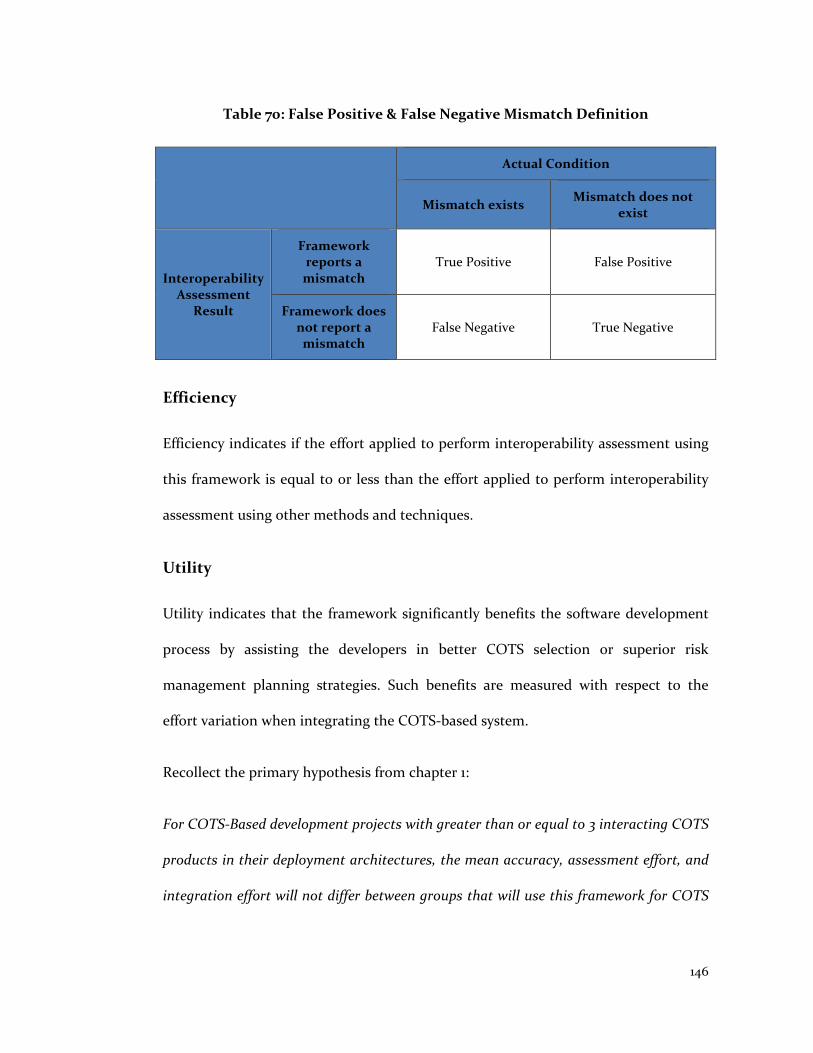
146
Table 70: False Positive & False Negative Mismatch Definition
Actual Condition
Mismatch exists Mismatch does not
exist
Interoperability Assessment
Result
Framework reports a
mismatch True Positive False Positive
Framework does not report a mismatch
False Negative True Negative
Efficiency
Efficiency indicates if the effort applied to perform interoperability assessment using
this framework is equal to or less than the effort applied to perform interoperability
assessment using other methods and techniques.
Utility
Utility indicates that the framework significantly benefits the software development
process by assisting the developers in better COTS selection or superior risk
management planning strategies. Such benefits are measured with respect to the
effort variation when integrating the COTS-based system.
Recollect the primary hypothesis from chapter 1:
For COTS-Based development projects with greater than or equal to 3 interacting COTS
products in their deployment architectures, the mean accuracy, assessment effort, and
integration effort will not differ between groups that will use this framework for COTS
147
interoperability assessment, and those that will perform the assessment using existing
interoperability assessment technologies.
The corresponding individual hypotheses are:
Individual Hypothesis 1 (IH1): The accuracy of dependency assessment between the two
groups will not differ.
Individual Hypothesis 2 (IH2): The accuracy of interface assessment between the two
groups will not differ.
Individual Hypothesis 3 (IH3): The effort for integration assessment between the two
groups will not differ.
Individual Hypothesis 4 (IH4): The effort for actual integration between the two groups
will not differ.
The individual hypotheses IH1, IH2, IH3 and IH4 support the framework evaluation
with respect to aforementioned qualities. Evaluation of the framework’s completeness
and correctness with respect to interface and dependency rules is supported by
hypotheses IH1 and IH2. Evaluation of framework’s efficiency is supported by
hypothesis IH3 while the evaluation of framework’s utility is supported by hypothesis
IH4.
Analysis of internal assumption mismatches is not considered as part of completeness
or correctness. The level where the internal assumption attributes, rules and
interaction details are defined do not allow an accurate assessment of internal
148
assumption mismatches that can occur in the COTS-based architecture. Instead the
framework recommends internal assumption mismatches as potential conflicts that
can occur and suggests that the development team to make appropriate cases to test
for such mismatches during prototyping and/or application integration.
A specific set of metrics is required to evaluate these four hypotheses. IH1 is
concerned with the accuracy of dependency assessment information. IH2 is involved
with accuracy of interface assessment information. IH3 is related to the effort spent
during interoperability assessment of the COTS-based architecture and, finally IH4 is
related to the effort spent during COTS product integration. Each of these null
hypotheses can be disproved by demonstrating that an interoperability assessment
performed by the group that will use this framework is (statistically) significantly
different then the group that performs this assessment manually. Based on the above
hypotheses there are four metrics of direct interest to validation:
1. Accuracy of dependencies identified by the framework calculated as: 1 – (number
of unidentified dependency mismatches / total number of dependencies).
Correctness for dependency mismatch identification will be separately calculated
as: 1 – (number of false positive dependency mismatches / number of actual
dependency mismatches).
2. Accuracy of interface incompatibilities identified by the framework calculated as:
1 – (number of unidentified interface mismatches / total number of interface
mismatches). Correctness for interface mismatch identification will be separately
calculated as: 1 – (number of false positive interface mismatches / number of
actual interface mismatches).

149
3. Interoperability assessment effort which is the amount of effort utilized to analyze
a given COTS-based architecture for interoperability mismatches.
4. Architecture integration effort which is the amount of effort used to integrate the
given COTS-based architecture.
Table 71: Validation Strategy & Experiments
Completeness, Correctness* Efficiency Utility
Method of
Analysis
Accuracy of Dependency
Analysis*
(IH1)
Accuracy of Interface Analysis*
(IH2)
Interoperability Assessment
Effort
(IH3)
Integration Effort
(IH4)
Experiment P1
(Jan – May 2006)
Framework applied to projects being implemented in a graduate software engineering course (Spring 2006)
Sample Size 6 projects – compared with similar past efforts
T-Test
Experiment C1
(Nov 2006)
Framework applied to case studies derived from previous projects implemented in the graduate software
engineering course
Sample size 156 students (81 control, 75 treatment)
Experiment P2
(Jan – May 2007)
Framework applied to projects being implemented in a graduate software engineering course (Spring 2007)
Sample size 9 projects – compared with similar past efforts
Experiment C2
(Feb 2007)
Framework applied to case studies derived from large information systems projects
Sample size 115 students (57 control, 58 treatment)
* includes analysis of false positive
These metrics were collected through four experiments conducted in graduate
software engineering, and software architecture courses. A summary of these
experiments and the metrics gathered during each experiment is provided in Table 71.

150
Student’s t-test [Student 1908] was used to analyze these metrics for statistical
significance (unpaired t-test was used unless where explicitly specified).
Experiments P1 and P2 were conducted in a graduate software engineering course at
USC. They were designed so that they could gather metrics for all four hypotheses
IH1, IH2, IH3 and IH4. Experiments C1 and C2 were controlled experiments
conducted in graduate level software engineering and software architecture courses
respectively. They were designed so that they could gather metrics for three
hypotheses IH1, IH2 and IH3.
It is important to note that for all four experiments COTS interoperability definitions
were created by in-house experts and not by experiment subjects. Gathering
information on COTS interfaces and dependencies is a major source of effort when
evaluating for COTS interoperability. The proposed interoperability assessment
framework allows the users to reuse this information once it has been created and
stored in a central repository, distributing the cost of creating such definitions over
several assessments.
9.2 Experiment Design
This section presents the experimental design for evaluating the framework with
respect to the 4 individual hypotheses IH1, IH2, IH3 and IH4 representing
completeness, correctness, efficiency and utility of the framework.

151
9.2.1 Experiments P1 and P2
Experiments P1 and P2 are identical in design, the only difference being that P1 was
the pilot experiment conducted in the spring 2006 semester and utilized version V1 of
the Integration Studio tool and P2 was a replication experiment carried out in the
spring 2007 semester and utilized version V3 of the Integration Studio tool (see
section 8). Both experiments P1 and P2 were conducted in a graduate software
engineering course at USC. The course focuses on the development of a software
system requested by a real-world client [Boehm et al. 1998]. Over the last few years
the course has received requests to develop software systems for e-services, research
(medicine and software) and business domains. Graduate students enrolled in the
course form five or six person teams to design and implement a project over a period
of two semesters (24 weeks). During these 24 weeks the project goes from its
inception and elaboration to construction and transition phases [Boehm 1996].
Experiments P1 and P2 were conducted as part of a homework assignment in the late
elaboration phase when the team is about to select a feasible architecture and present
its feasibility to an architecture review board at the life cycle architecture anchor
point. A background of the projects’ business domains and solution domains is
available in Table 72.
Subjects underwent a 60 minute tutorial session where COTS interoperability
mismatch issues were discussed. In addition the subjects were trained in the
utilization of the framework-based tool - Integration Studio to perform
interoperability assessments on their own system architecture. After the tutorial in

152
class COTS interoperability homework was assigned where each team was required to
evaluate their system architectures for COTS interoperability mismatches.
Table 72: Experiments P1 & P2 Project Background
Experiment Business Domain Solution (Technical) Domain
P1
(6 projects)
1 Data analysis system
1 Desktop office system
1 Education tool
1 Resource tracking and management system
1 Software development tool
1 Web data tracking system
1 .NET-based e-service project
2 Java-based e-service projects
1 Java-based single user system
1 Java-based client-server small office system
1 PHP-based e-services project
P2
(9 projects)
1 Back office management system
2 Communication and coordination system
5 Communications and marketing software systems
1 Multimedia archiving and dissemination system
2 .NET-based e-services projects
1 Java-based e-services project
6 PHP-based e-services project
Data collection in this experiment was done by means of two questionnaires. The first
questionnaire was conducted when the team applied the framework on their
respective projects. It included information pertaining to the system architecture,
mismatches identified and effort spent in performing the assessment. The second
questionnaire was collected after the team had completed implementing the system –
during the transition phase of the project. This questionnaire included collected
information on whether the team found mismatches which were not identified during
the assignment and the amount of effort spent in actually integrating the system.
Both the assignment and the questionnaire are available in Appendix A.

153
Both experiments compared the number of interface and dependency mismatches left
unidentified in the architecture before the team applied the framework (pre-
framework application) and number of interface and dependency mismatches left
unidentified in the architecture after applying this framework. Since the projects
evaluated in these experiments were built into complete functioning systems, the
exact number of mismatches which actually occurred during system development is
available. To analyze interoperability assessment effort and integration effort (IH3
and IH4), equivalent projects were used from archives [eBase 2004] based on
similarity of architecture, COTS products and experience in developing software
applications. Statistical analysis was performed using data reported from these past
equivalent projects and data reported by project teams using this framework.
9.2.2 Experiments C1 and C2
Experiments C1 and C2 were two controlled experiments conducted in the fall
semester of 2006 in a graduate software engineering course and spring semester of
2007 in graduate software architecture course. These experiments were designed to
evaluate hypotheses IH1, IH2 and IH3. Subjects for both the experiment were
graduate students with 0 to 20 years of work experience. In both of these experiments
the class was split into two groups – treatment and control group. In experiment C1
the treatment group subjects were required to use this framework and corresponding
Integration Studio tool while the control group subjects were required to follow a
manual process to perform interoperability assessment. In experiment C2 the
treatment group subjects were required to use this framework and corresponding
Integration Studio tool while the control group subjects were required to follow a

154
manual process to perform interoperability assessment use a combination of
[Collidescope 2005] [Davis et al. 2001] [Mehta et al. 2000] and a manual process to
perform COTS interoperability analysis. [Collidescope 2005] is an interoperability
assessment tool that is build upon 13 rules that address interface and internal
assumption mismatches identified in [Davis et al. 2001]. [Mehta et al. 2000] provide a
connector taxonomy that the control group subjects can utilize to perform a manual
but guided interface analysis. These were chosen because, together, this combination
of technologies is most similar to this work for identifying and resolving
interoperability conflicts. Moreover, [Collidescope 2005] is one of the few other
interoperability analysis technology that provides tool support. Other technologies
for performing interoperability assessment were either too limited by their research
[Ballurio et al. 2003] or addressed the mismatch problem at a different level [Zelesnik
1996]. The research methodology for experiments C1 and C2 is illustrated in Figure 21.
Distribution of students in experiment E1 into these groups was based on their project
teams (i.e. students from the same team are cannot be in both treatment and control
group). This experiment had no utility or impact on project teams; however a team
based distribution was employed to reduce the risk of treatment leakage given that
the interaction of students within the same team is much higher than students from
different teams. Since several students who attend the graduate software engineering
course in the fall semester also attend the graduate software architecture course, the
distribution of students in experiment C2 was based on their experience with using
the Integration Studio tool in pervious semester. Subjects who had previous

155
experience with the tool were identified using a pre-assignment survey and were
placed in the treatment group.
Figure 21: Research Methodology for Experiments C1 & C2
Table 73: Experiment C1 Student Distribution & Demographics
Control Group
Treatment Group
P-Value
Number of Students 81 75
Average Experience 1.49 years 1.47 years 0.97
(t = 0.039)
On Campus Students 65 60
Average On Campus Student Experience 0.62 years 0.54 years 0.61
(t = 0.513)
Remote Students 16 15
Average Remote Student Experience 5 years 5.2 years 0.91
(t = 0.115)
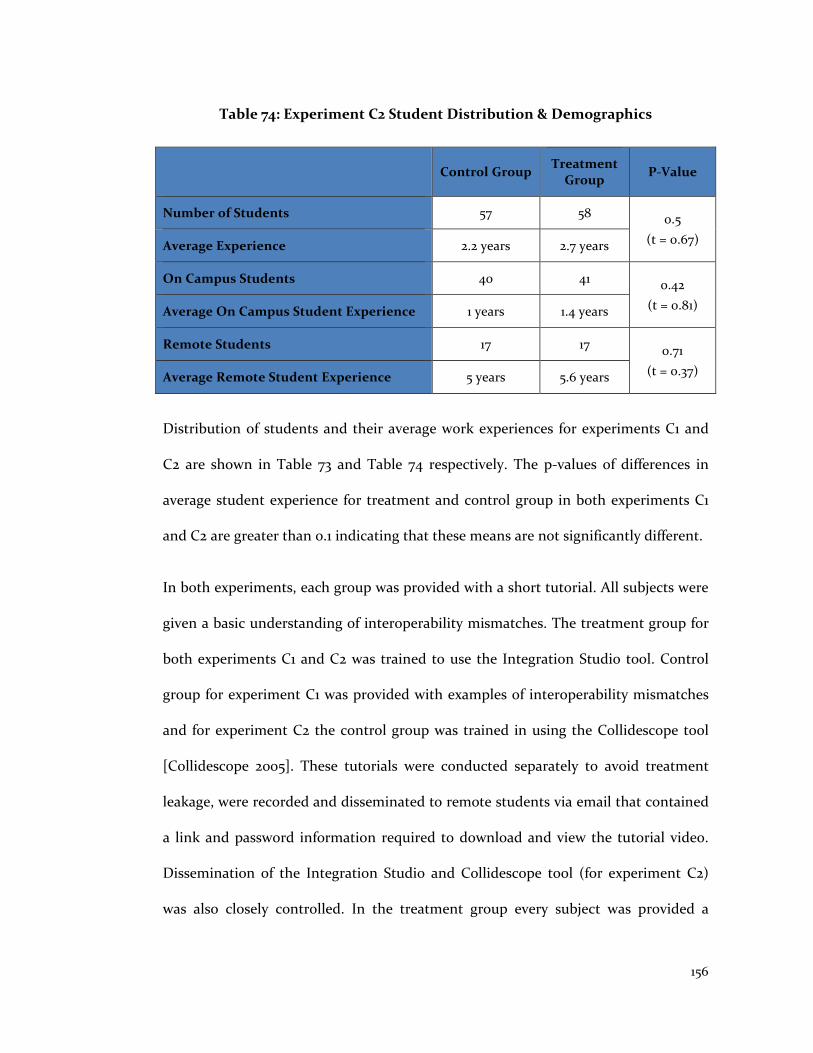
156
Table 74: Experiment C2 Student Distribution & Demographics
Control Group Treatment
Group P-Value
Number of Students 57 58 0.5
(t = 0.67) Average Experience 2.2 years 2.7 years
On Campus Students 40 41 0.42
(t = 0.81) Average On Campus Student Experience 1 years 1.4 years
Remote Students 17 17 0.71
(t = 0.37) Average Remote Student Experience 5 years 5.6 years
Distribution of students and their average work experiences for experiments C1 and
C2 are shown in Table 73 and Table 74 respectively. The p-values of differences in
average student experience for treatment and control group in both experiments C1
and C2 are greater than 0.1 indicating that these means are not significantly different.
In both experiments, each group was provided with a short tutorial. All subjects were
given a basic understanding of interoperability mismatches. The treatment group for
both experiments C1 and C2 was trained to use the Integration Studio tool. Control
group for experiment C1 was provided with examples of interoperability mismatches
and for experiment C2 the control group was trained in using the Collidescope tool
[Collidescope 2005]. These tutorials were conducted separately to avoid treatment
leakage, were recorded and disseminated to remote students via email that contained
a link and password information required to download and view the tutorial video.
Dissemination of the Integration Studio and Collidescope tool (for experiment C2)
was also closely controlled. In the treatment group every subject was provided a

157
unique identifier using which (s)he could download the tool and access the COTS
interoperability definitions.
In experiment C1, six distinct case studies were derived from past projects [eBase
2004] in the small and medium business e-services domain. Every case included a
brief description of the project goals and provided a deployment diagram of the
architecture that included the COTS products used and interactions between them.
Experiment C1 cases had certain number of seeded interface and dependency
mismatches which were identified in the past system architectures. The business
domain information and seeded defect information for each case is illustrated in
Table 75. The six case studies are made available in appendix B (section B.3). To avoid
treatment leakage, the case studies were distributed such that every on campus
subject in the same project team had different case study.
Table 75: Experiment C1 Case Description
Business Domain Total
Interfaces
# of Interface
Errors
Total # of Dependencies
# of Dependency
Errors
Case 1 Data Search and Retrieval System
6 1 6 1
Case 2 Data Dissemination
System 4 1 7 2
Case 3 e-Commerce
System 7 2 9 4
Case 4 Back Office System 4 1 9 4
Case 5 Data Dissemination
System 4 2 7 2
Case 6 Back Office System 4 1 6 2

158
Table 76: Experiment C2 Case Demographics
Business Domain
# of Components°
# of Interactions
Component Types
Case 1 Satellite Data Dissemination
System 17 20
COTS*: 12 (Open Source: 5)
Custom: 5
Case 2
Science Data Processing &
Dissemination System
16 13 COTS*: 15
(Open Source: 8) Custom: 1
Case 3 Business Data
Processing System
11 11 COTS*: 7
(Open Source: 3) Custom: 4
Case 4 Back-office
System 12 14 COTS*: 10
(Open Source: 2) Custom: 2
Case 5 Police dept
management system (SoS)
20 20 COTS*: 16
(Open Source: 2) Custom: 4
° # does not include operating systems; * COTS includes open source components
Experiment C2 involved developing five distinct case studies derived from large
complex systems via several colleagues who have worked on these projects, each case
from a distinct business domain. A breakdown of these cases is available in Table 76.
The COTS-based architectures used in these cases were far more complicated than
the architecture in cases utilized in experiment C1. A summary of the cases used is
available in appendix C (C.3). Initially one more case based in the gaming domain was
planned to be included in this experiment. However the gaming sector largely utilizes
an API-based interaction standard significantly reducing the utility of this framework
in this domain. The cases were randomly distributed to subjects in treatment and
control group. Unlike C1, in experiment C2 development-time information was not

159
available, resulting in an uncertainty as to the exact number of interoperability
mismatches in these five COTS-based architectures.
Data in both experiments C1 and C2 was collected by means of two questionnaires.
First pre-assignment questionnaire was designed to gather student experience
information (Table 73 and Table 74). Second questionnaire was designed to collect
information on the number of interface and dependency mismatches identified by the
control and treatment groups, and the effort spent by to perform the interoperability
assessment. In addition the questionnaire for treatment group solicited user feedback
on the tool and the framework, while questionnaire for control group required
students to specify their data sources used and analysis method they applied to
perform interoperability assessment. Both the assignment and the questionnaires for
experiments C1 and C2 are available in appendix B and appendix C respectively.
9.3 Experiment Results and Analysis
9.3.1 Experiments P1 and P2
Results for experiments P1 and P2 are shown in Table 77. In these experiments the
teams that were used to gather metrics for evaluation of hypotheses IH1 (accuracy of
dependency analysis) and IH2 (accuracy of interface analysis) are the same. These
teams were trained with the framework and framework-based tool Integration Studio
after they completed their initial assessment. Cases where the samples to be
compared are not randomly selected but where the second sample is the same as the
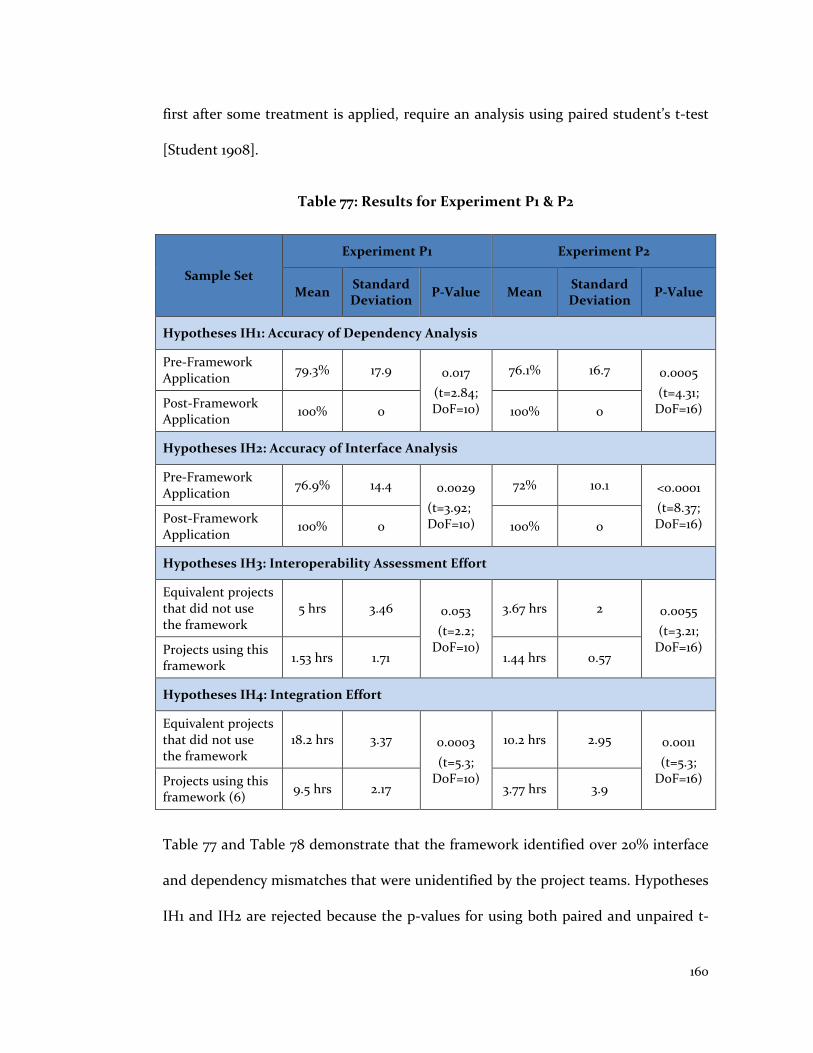
160
first after some treatment is applied, require an analysis using paired student’s t-test
[Student 1908].
Table 77: Results for Experiment P1 & P2
Sample Set
Experiment P1 Experiment P2
Mean Standard Deviation
P-Value Mean Standard Deviation
P-Value
Hypotheses IH1: Accuracy of Dependency Analysis
Pre-Framework Application
79.3% 17.9 0.017
(t=2.84; DoF=10)
76.1% 16.7 0.0005
(t=4.31; DoF=16) Post-Framework
Application 100% 0 100% 0
Hypotheses IH2: Accuracy of Interface Analysis
Pre-Framework Application
76.9% 14.4 0.0029
(t=3.92; DoF=10)
72% 10.1 <0.0001
(t=8.37; DoF=16) Post-Framework
Application 100% 0 100% 0
Hypotheses IH3: Interoperability Assessment Effort
Equivalent projects that did not use the framework
5 hrs 3.46 0.053
(t=2.2; DoF=10)
3.67 hrs 2 0.0055
(t=3.21; DoF=16) Projects using this
framework 1.53 hrs 1.71 1.44 hrs 0.57
Hypotheses IH4: Integration Effort
Equivalent projects that did not use the framework
18.2 hrs 3.37 0.0003
(t=5.3; DoF=10)
10.2 hrs 2.95 0.0011
(t=5.3; DoF=16) Projects using this
framework (6) 9.5 hrs 2.17 3.77 hrs 3.9
Table 77 and Table 78 demonstrate that the framework identified over 20% interface
and dependency mismatches that were unidentified by the project teams. Hypotheses
IH1 and IH2 are rejected because the p-values for using both paired and unpaired t-

161
test are less than the alpha value of 0.05. The mean effort for performing
interoperability assessment in P1 reduced by about 70% for projects that used this
framework for performing interoperability assessment, while experiment P2 saw a
mean interoperability assessment effort reduction of about 60%. However the p-value
for experiment P1 is close to significant (0.05) but not entirely conclusive. For
experiment P2 the null hypotheses IH3 is rejected because the p-value is less than an
alpha value of 0.05. Finally the effort spent in integrating the architecture also
reduced in case of project teams that used this framework by about 48% for
experiment P1 and 63% in P2. Since the p-value is less than the alpha value of 0.05 in
both experiments hypothesis IH4 is rejected. In addition the post development
questionnaire found no cases of false positives reported by this framework. The post
development questionnaire for experiment P1 also found that two of the six project
teams identified several critical integration challenges from the report produced by
this framework resulting in significant changes to their architectures.
Of the four quality attributes – completeness, correctness, efficiency and utility the
results of experiments P1 and P2 have shown that this framework is:
• Complete – no false negatives were found during interoperability assessment,
this was verified through post development questionnaire;
• Correct - no false positives were found during interoperability assessment, this
was verified through post development questionnaire;
• Efficient – mean interoperability assessment effort for teams that utilized this
framework was 65% less than the mean interoperability assessment effort for
teams that performed this assessment in an ad-hoc fashion; and

162
• Useful – project teams that utilized this framework experienced a mean
integration effort reduction of 55% over project teams that performed
interoperability assessment manually.
Table 78: Results for Experiments P1 & P2 with Paired T-Test
Sample Set
Experiment P1 Experiment P2
Mean Standard Deviation
P-Value (Paired T-Test)
Mean Standard Deviation
P-Value (Paired T-Test)
Hypotheses IH1: Accuracy of Dependency Analysis
Pre-Framework Application
79.3% 17.9 0.036
(t=2.89; DoF=5)
76.1% 16.7 0.003
(t=4.31; DoF=16) Post-Framework
Application 100% 0 100% 0
Hypotheses IH2: Accuracy of Interface Analysis
Pre-Framework Application
76.9% 14.4 0.011
(t=3.92; DoF=5)
72% 10.1 <0.0001
(t=8.67; DoF=8) Post-Framework
Application 100% 0 100% 0
Table 79 shows the cumulative evaluation results for experiments P1 and P2. These
results indicate an increase in accuracy of dependency and interface interoperability
analysis for project teams that utilized this framework by over 20%. For teams that
utilized this framework, the interoperability assessment effort reduced by about 65%
over teams that did not. Finally, project teams that employed this framework to
perform interoperability assessment observed a 55% integration effort reduction over
teams that performed the assessment manually. Effort reduction during the
integration phase occurs because the framework provides development teams with a
foreknowledge of integration risks providing an opportunity for them to completely

163
avert the risk or plan for mitigations before these risks become problems. All four
hypotheses (IH1, IH2, IH3 and IH4) are rejected because the p-value is less than the
alpha of 0.05.
Table 79: Cumulative Results for Experiments P1 & P2
Sample Set Mean Standard Deviation
P-Value (Unpaired
T-Test)
P-Value (Paired T-
Test)
Hypotheses IH1: Accuracy of Dependency Analysis
Pre-Framework Application (15) 77.3% 16.6 <0.0001
(t = 5.29;
DoF=28)
<0.0001
(t=5.29; DoF=14) Post-Framework Application (15) 100% 0
Hypotheses IH2: Accuracy of Interface Analysis
Pre-Framework Application (15) 74% 11.8 <0.0001
(t = 8.58; DoF=28)
<0.0001
(t=8.59; DoF=14) Post-Framework Application (15) 100% 0
Hypotheses IH3: Interoperability Assessment Effort
Equivalent projects that did not use the framework (15)
4.2 hrs 2.65 0.001
(t = 3.67; DoF=28)
Not applicable
Projects using this framework (15) 1.48 hrs 1.11
Hypotheses IH4: Integration Effort
Equivalent projects that did not use the framework (15)
13.4 hrs 5.03 0.0002
(t = 4.28; DoF=28)
Not applicable
Projects using this framework (15) 6.06 hrs 4.34
The experiment results for P1 and P2 show that the framework allows for a 20%
increase in accuracy of dependency and interface analysis (Figure 22). The framework
also leads to a 60% reduction in interoperability assessment effort, and 50% reduction
in integration effort (Figure 23). Results also show that the framework possesses a
sweet spot in the area of smaller e-services applications with relatively

164
straightforward COTS components, but with enough complexity that less COTS-
experienced software engineers are unlikely to succeed fully in interoperability
assessment.
Figure 22: Experiments P1 & P2 - Dependency & Interface Analysis Accuracy
Figure 23: Experiments P1 & P2 - Interoperability Assessment & Integration Effort
79.3% 76.1% 77.3% 76.9%72.0% 74.0%
100% 100% 100% 100% 100% 100%
P1 P2 P1 & P2 P1 P2 P1 & P2
Pre Framework Post Framework
Dependency Accuracy Interface Accuracy
*0.017 *0.0005 *<0.0001 *0.029 *<0.0001 *<0.0001
* = P-Value
53.67 4.2
18.2
10.2
13.4
1.53 1.44 1.48
9.5
3.77
6.06
P1 P2 P1 & P2 P1 P2 P1 & P2
Equivalent Projects Projects using this Framework
Interoperability Assessment Effort Integration Effort
* 0.053 * 0.0055 * 0.001
* 0.0003
* 0.0011
* 0.0002
* = P-value
All effort values are in hours

165
9.3.2 Experiment C1
Table 80 explains cumulative results for experiment C1. The number next to the
group titles indicates the number of subjects in that group. Since remote students
have a far greater work experience than on campus students (as evidenced in Table
73) a separate analysis was conducted for on-campus and remote students. This is
illustrated in Table 81.
Table 80: Experiment C1 Cumulative Results
Sample Set Mean Standard Deviation
P-Value
Hypotheses IH1: Accuracy of Dependency Analysis
Control Group (81) 72.5% 11.5 <0.0001
(t = 20.7; DoF = 154) Treatment Group (75) 100% 0
Hypotheses IH2: Accuracy of Interface Analysis
Control Group (81) 80.5% 13 <0.0001
(t = 13.0: DoF = 154) Treatment Group (75) 100% 0
Hypotheses IH3: Interoperability Assessment Effort
Control Group (81) 185 min 104 <0.0001
(t = -9.04; DoF=154) Treatment Group (75) 72.8 min 28.2
Cumulative results in Table 80 indicate that dependency and interface analysis
accuracies for the treatment group increased by 27.5% and 19.5% respectively.
Moreover there were no false positives identified in the analysis by this framework.
Individual statistical results for on campus and remote groups yield similar results.
Since the p-values for all these results are significantly less than alpha = 0.05
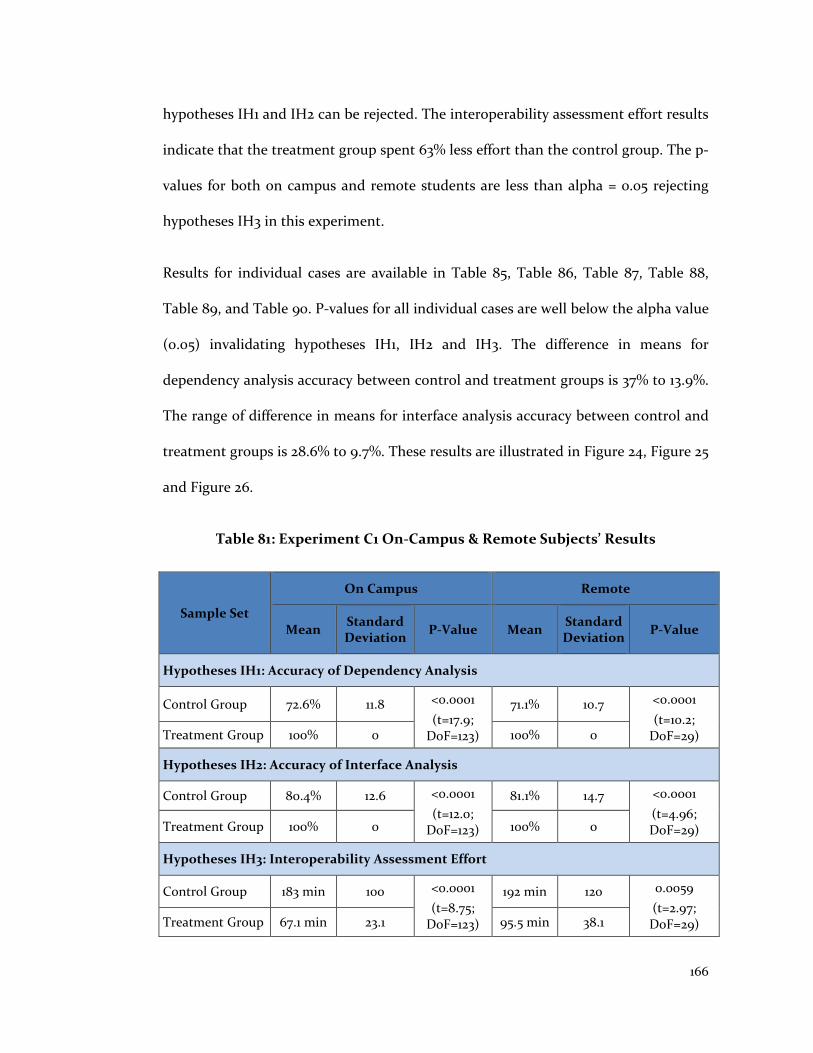
166
hypotheses IH1 and IH2 can be rejected. The interoperability assessment effort results
indicate that the treatment group spent 63% less effort than the control group. The p-
values for both on campus and remote students are less than alpha = 0.05 rejecting
hypotheses IH3 in this experiment.
Results for individual cases are available in Table 85, Table 86, Table 87, Table 88,
Table 89, and Table 90. P-values for all individual cases are well below the alpha value
(0.05) invalidating hypotheses IH1, IH2 and IH3. The difference in means for
dependency analysis accuracy between control and treatment groups is 37% to 13.9%.
The range of difference in means for interface analysis accuracy between control and
treatment groups is 28.6% to 9.7%. These results are illustrated in Figure 24, Figure 25
and Figure 26.
Table 81: Experiment C1 On-Campus & Remote Subjects’ Results
Sample Set
On Campus Remote
Mean Standard Deviation
P-Value Mean Standard Deviation
P-Value
Hypotheses IH1: Accuracy of Dependency Analysis
Control Group 72.6% 11.8 <0.0001
(t=17.9; DoF=123)
71.1% 10.7 <0.0001
(t=10.2; DoF=29) Treatment Group 100% 0 100% 0
Hypotheses IH2: Accuracy of Interface Analysis
Control Group 80.4% 12.6 <0.0001
(t=12.0; DoF=123)
81.1% 14.7 <0.0001
(t=4.96; DoF=29) Treatment Group 100% 0 100% 0
Hypotheses IH3: Interoperability Assessment Effort
Control Group 183 min 100 <0.0001
(t=8.75; DoF=123)
192 min 120 0.0059
(t=2.97; DoF=29) Treatment Group 67.1 min 23.1 95.5 min 38.1

167
In addition to the aforementioned results a few observations made during the
processes of evaluation have been listed below:
• Cumulatively the control group subjects found almost all the seeded
mismatches (except 1), but no single subject in the control group managed to
find all the mismatches for both interface and dependencies
• The standard deviations for interoperability assessment for the control group
are extremely high because they were not following any specific process for
performing interoperability analysis. That being the case some subjects could
devote minimal time to perform interoperability assessment. To minimize
cases where subjects devoted excess effort to this evaluation or did not spend
enough effort, data points that were either over the 3 times or less than 30% of
the original mean effort value were not considered in this analysis. However in
this experiment no data-point was eliminated because of this criterion.
• The means of the effort spent by remote students in both control and
treatment groups were higher than the corresponding means of on campus
students (Table 81). This may be due to the fact that remote students were
trained by a pre-recorded video tutorial while on campus students were
trained in person allowing them to seek any clarifications upfront.
Experiment C1 demonstrates three of the four quality attributes being evaluated
(completeness, correctness, efficiency, and utility):

168
• Complete – the framework identified all seeded mismatches. These
mismatches were derived from errors that actually occurred in architectures
of past COTS-based applications developed here at USC [eBase 2004].
• Correct - no false positives were found during interoperability assessment.
• Efficient – mean interoperability assessment effort for treatment group was
63% less than the mean interoperability assessment effort for the control
group.
Figure 24: Experiment C1 - Dependency Analysis Accuracy
Similar to experiments P1 and P2 the results in experiment C1 further substantiate
that the framework possesses a sweet spot in the area of smaller e-services
applications with relatively straightforward COTS components. Further, experiment
C1 shows that the results were not confined to students, but were also realized by the
professional-practitioner off-campus students.
72.5% 72.6% 71.1%
86.1%
74.7%
63.0% 63.5%
78.6%71.8%
100% 100% 100% 100% 100% 100% 100% 100% 100%
Control Group Treatment Group
*<0.0001 *<0.0001 *<0.0001 *<0.0001 *<0.0001 *<0.0001 *<0.0001 *<0.0001 *<0.0001
* = P-Value

169
Figure 25: Experiment C1 - Interface Analysis Accuracy
Figure 26: Experiment C1 - Interoperability Assessment Effort
9.3.3 Experiment C2
Statistical analysis results using t-test and corresponding standard deviations for
experiment C2 is shown in Table 82. The number next to the group titles indicates the
80.5% 80.4% 81.1%90.3%
82.7%74.3%
89.3%
71.4%76.9%
100% 100% 100% 100% 100% 100% 100% 100% 100%
Control Group Treatment Group
*<0.0001 *<0.0001 *<0.0001 *0.007 *<0.0001 *<0.0001 *0.006 *<0.0001 *<0.0001
* = P-Value
185 183192
202
137
216
180
205
165
72.8 67.1
95.585.8
74.8 75.862.7 68.3 70
Cumulative On-Campus Remote Case 1 Case 2 Case 3 Case 4 Case 5 Case 6
Control Group Treatment Group
*<0.0001 *<0.0001 *0.0059 *0.0003
0.0011
*0.0002
*<0.0001
*0.0024
*0.017
* = P-Value

170
number of subjects in that group. Similar results for on-campus and remote subjects
are illustrated in Table 83.
Table 82: Experiment C2 Cumulative Results
Sample Set Mean Standard Deviation
P-Value
Hypotheses IH1: Accuracy of Dependency Analysis
Control Group (57) 1.79
(10.3%)
2.52
(14.5) <0.0001
(t = 44.4) Treatment Group (58)
17.1
(100%)
0.76
(0)
Hypotheses IH2: Accuracy of Interface Analysis
Control Group (57) 15.8
(42.3%)
10.9
(29.8) <0.0001
(t = 12.4) Treatment Group (58)
38.6
(96.9%)
8.58
(4.05)
Hypotheses IH3: Interoperability Assessment Effort
Control Group (57) 413 min 192 <0.0001 (t = 5.02) Treatment Group (58) 249 min 157
COTS-based architectures were analyzed for false positives and false negatives that
were not reported by this framework. In this process 20 instances of false positives
and 6 instances of false negatives were identified for interface mismatches in the five
case studies (Table 84). A percentage figure is calculated assuming that the
mismatches found during expert analysis are 100% correct and complete. These
percentage values are indicated in parentheses in the mean and standard deviation
column of Table 82 and Table 83. The percentage figure does not account for false
positives (i.e. conflicts identified by the framework which are not actually

171
mismatches). However they do account for false negatives (conflicts not identified by
the framework which are actually mismatches) in the framework.
Table 83: Experiment C2 On-Campus & Remote Subjects’ Results
Sample Set
On Campus Remote
Mean Standard Deviation
P-Value Mean Standard Deviation
P-Value
Hypotheses IH1: Accuracy of Dependency Analysis
Control Group 1.62
(9.4%)
2.33
(13.5) <0.0001
(t=40.5)
2.18
(12.5%)
2.96
(16.8) <0.0001
(t=20.1) Treatment Group
17.1
(100%)
0.748
(0)
17.2
(100%)
0.809
(0)
Hypotheses IH2: Accuracy of Interface Analysis
Control Group 18.9
(49.6%)
9.82
(26.4) <0.0001
(t = 9.81)
8.59
(25.3%)
10.3
(31.3) <0.0001
(t=8.86) Treatment Group
38.9
(96.9%)
8.49
(4.05)
37.9
(96.7%)
9.02
(4.18)
Hypotheses IH3: Interoperability Assessment Effort
Control Group 428 min 195 <0.0001
(t=4.39)
378 min 185 min <0.022
(t=2.42) Treatment Group 253 min 163 239 min 146 min
Note that the exact number of mismatches that occurred in these cases is not
available. However using:
1. results from interoperability evaluation of the control group, and
2. independent expert analysis done by the author and a colleague familiar with
the COTS interoperability research domain experiment.
Statistical results in Table 82 indicate that:

172
• Number of dependency mismatches found by the treatment group is over 9
times greater than the number of dependency mismatches identified by the
control group.
• Number of interface mismatches found by the treatment group is over 2 times
greater than the number of interface mismatches identified by control group.
• The treatment group spent 40% less effort to perform interoperability
assessment than control group. To minimize cases where subjects devoted
excess effort to this evaluation or did not spend enough effort, data points
that were either over the 3 times or less than 30% of the original mean effort
value were removed. About 10 data-points were eliminated because of this
criterion. 7 additional data points were eliminated because they were
suspected of treatment leakage.
P-values for cumulative results are well below the alpha value of 0.05. Statistical
results for on campus and remote groups yield similar results (Table 83). Since the p-
values for all these results are significantly less than an alpha of 0.05, hypotheses IH1,
IH2 and IH3 can be rejected in this experiment.
Of the 20 instances of interface mismatch false positives identified 12 occurred
because of errors in defining COTS products. The remaining 8 instances of false
positives occurred due to a short coming in the framework definition. The framework
assumes that the components involved in an interaction must decipher the
information exchanged. This however does not hold true in scenarios where one of
the component exchanging data is data broker or data storage. 2 of the 6 instances of
false negatives occurred because the framework had a single attribute to represent
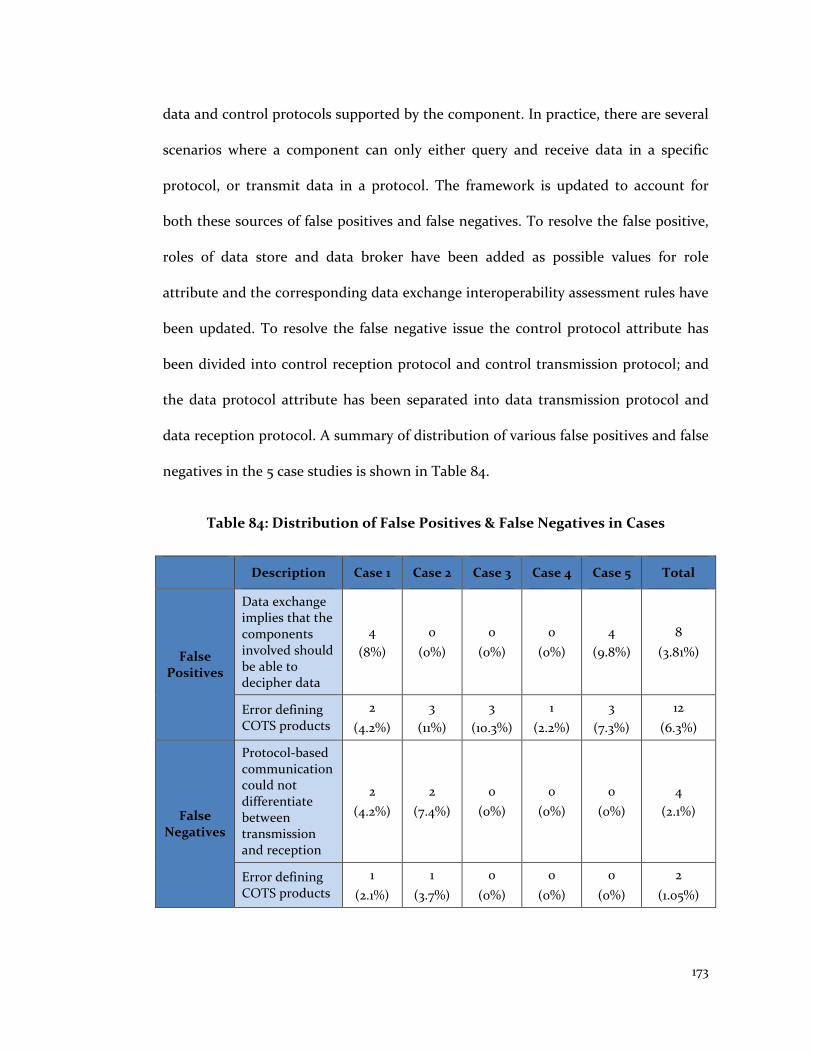
173
data and control protocols supported by the component. In practice, there are several
scenarios where a component can only either query and receive data in a specific
protocol, or transmit data in a protocol. The framework is updated to account for
both these sources of false positives and false negatives. To resolve the false positive,
roles of data store and data broker have been added as possible values for role
attribute and the corresponding data exchange interoperability assessment rules have
been updated. To resolve the false negative issue the control protocol attribute has
been divided into control reception protocol and control transmission protocol; and
the data protocol attribute has been separated into data transmission protocol and
data reception protocol. A summary of distribution of various false positives and false
negatives in the 5 case studies is shown in Table 84.
Table 84: Distribution of False Positives & False Negatives in Cases
Description Case 1 Case 2 Case 3 Case 4 Case 5 Total
False Positives
Data exchange implies that the components involved should be able to decipher data
4
(8%)
0
(0%)
0
(0%)
0
(0%)
4
(9.8%)
8
(3.81%)
Error defining COTS products
2
(4.2%)
3
(11%)
3
(10.3%)
1
(2.2%)
3
(7.3%)
12
(6.3%)
False Negatives
Protocol-based communication could not differentiate between transmission and reception
2
(4.2%)
2
(7.4%)
0
(0%)
0
(0%)
0
(0%)
4
(2.1%)
Error defining COTS products
1
(2.1%)
1
(3.7%)
0
(0%)
0
(0%)
0
(0%)
2
(1.05%)
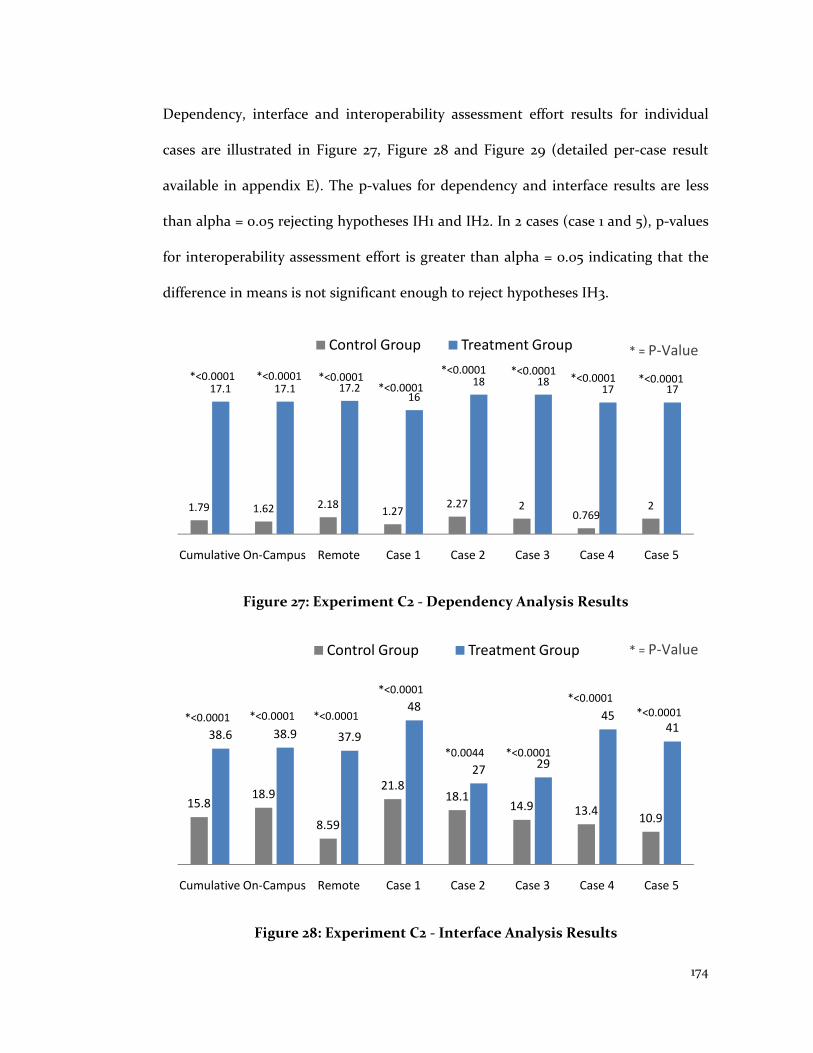
174
Dependency, interface and interoperability assessment effort results for individual
cases are illustrated in Figure 27, Figure 28 and Figure 29 (detailed per-case result
available in appendix E). The p-values for dependency and interface results are less
than alpha = 0.05 rejecting hypotheses IH1 and IH2. In 2 cases (case 1 and 5), p-values
for interoperability assessment effort is greater than alpha = 0.05 indicating that the
difference in means is not significant enough to reject hypotheses IH3.
Figure 27: Experiment C2 - Dependency Analysis Results
Figure 28: Experiment C2 - Interface Analysis Results
1.79 1.62 2.181.27
2.27 20.769
2
17.1 17.1 17.216
18 1817 17
Cumulative On-Campus Remote Case 1 Case 2 Case 3 Case 4 Case 5
Control Group Treatment Group
*<0.0001 *<0.0001 *<0.0001*<0.0001
*<0.0001 *<0.0001*<0.0001 *<0.0001
* = P-Value
15.818.9
8.59
21.818.1
14.9 13.410.9
38.6 38.9 37.9
48
2729
4541
Cumulative On-Campus Remote Case 1 Case 2 Case 3 Case 4 Case 5
Control Group Treatment Group * = P-Value
*<0.0001 *<0.0001 *<0.0001
*<0.0001
*0.0044 *<0.0001
*<0.0001
*<0.0001

175
Figure 29: Experiment C2 - Interoperability Assessment Effort Results
There are several possible explanations for such a result:
1. It is possible that the technologies utilized by the control group indeed allow
for performing interoperability assessment with the same effort required for
performing interoperability assessment with this framework. However the
cumulative results and results from other three cases indicate that the
interoperability assessment effort applied by the two groups are significantly
different. Moreover the p-value in case 1 is extremely close to alpha =0.05.
2. Another possible explanation for this could be that the control group subjects
were well aware of technologies utilized in this specific case. A primary source
of effort saving in this framework is reusing COTS product interoperability
information. Should the subjects be well aware of COTS product
interoperability information this source of effort saving is no longer possible
when comparing this framework with another framework.
413428
378
329
430
475440
320
249 253 239273
255
158192
308
Cumulative On-Campus Remote Case 1 Case 2 Case 3 Case 4 Case 5
Control Group Treatment Group
*<0.0001 *<0.0001
*0.0022
*0.07
*<0.047
*<0.0028
*0.0006
*<0.87
* = P-Value

176
3. Dependency analysis accuracy, interface analysis accuracy and interoperability
assessment effort are not unrelated metrics. Conceivably, extremely high
efforts can lead to identification of most mismatches and extremely low
efforts can lead to identification of no mismatches in a COTS-based
architecture. In case of control group it was up to the subjects to decide when
to conclude interoperability analysis. It is possible that subjects implementing
these cases prematurely concluded their analysis. This is further evident by
the fact that control group subjects assessing cases 2, 3 and 4 identified and
average of 47% of interface mismatches, while control subjects evaluating
cases 1 and 5 identified 35.1% interface mismatches (note that the percentage
is calculated based upon the assumption that a combined assessment using
this framework and expert analysis identified all possible mismatches in the
given COTS-based architecture).
Results for experiment C2 show that the (treatment) group that utilized this
framework for interoperability assessment significantly outperformed the (control)
group that utilized an assorted array of methods. Assuming that the framework and
expert analysis identified all interoperability mismatches, accuracy of interface
analysis was 50% better when the architecture was analyzed using this framework.
The accuracy of dependency analysis was almost 90% better when the architecture
was analyzed using this framework. These results have been significantly better than
the results of past experiments C1, P1 and P2. This may have occurred because the
complexity of architectures analyzed in this experiment was much higher than the
complexity of architectures analyzed in experiments C1, P1 and P2. Moreover there

177
was a 40% effort savings when using this framework over other methods. This result
is consistent with the findings in experiment C1. Of the four quality attributes –
completeness, correctness, efficiency, and utility the results of experiments C2
support:
Completeness – assuming that the framework evaluation coupled with expert analysis
could identify all dependency and interface mismatches the framework identified
100% dependency mismatches and almost 97% interface mismatches. The framework
has been fine tuned to identify the 3% mismatches that were missed in this
experiment.
Correctness - assuming that the framework evaluation coupled with expert analysis
could identify all dependency and interface mismatches the framework reported just
over 3% false positive cases (cases where false positives occurred due to errors in
creating COTS interoperability definitions have been neglected). The framework has
been fine tuned to address and neglect the case where false positive can occur.
Efficiency – the effort applied by the treatment group when performing
interoperability assessment was 40% less than the effort applied by the control group
indicating the efficiency of this framework.
The above results and have been demonstrated both for students and professional
subjects.

178
9.4 Summary of Analyses
Analyses and results of the 4 experiments described above illustrate:
1. The framework has a demonstrated sweet spot in the small and medium e-
services project domain. During the 3 experiments: P1, P2 and C1 the
framework identified 100% dependency and interface mismatches and
reduced the interoperability assessment effort by over 60% compared to
assessing the architectures manually.
2. When applied to larger projects the framework demonstrated an
improvement of over 90% to identify dependency mismatches and over 50%
to identify interface mismatches over an array of competing technologies. The
framework also reduced the interoperability assessment effort by 40% over
the group of competing technologies used to identify interoperability
mismatches (Figure 29).
3. In experiment C1 the framework identified over 25% more dependency
mismatches than manual assessment and about 20% more interface
mismatches than manual assessment. In experiment C2 the framework
identified about 90% more dependency mismatches than manual dependency
assessment (none of the competing technologies provided guidance on
performing dependency analysis, the subjects were required to do this analysis
manually), and 50% more interface mismatches than competing technologies.
This is illustrated in Figure 30 and Figure 31. This leads to a possibility where

179
this framework performs better in more complex analyses over the simpler
ones.
4. The framework reduced interoperability assessment effort by 57% in
experiment C1 over manual assessment; and by 40% in experiment C2 over an
array of competing technologies (Figure 32).
5. Experiments C1 and C2 utilized case studies from different business and
solution domains. These experiments indicate that the framework is useful in
multiple business and solution domains.
6. The framework demonstrated its utility in experiments P1 and P2 where the
integration effort reduced by almost 55% in projects where the framework was
applied. The framework enables identification of mismatches early which
allows the development teams to plan and mitigate integration risks, or avert
the risks completely reducing integration effort. Since experiments P1 and P2
included only a small number of projects in a restricted domain further
experimentation is required to validate these results.
Figure 30: Experiments C1 & C2 - Dependency Analysis Accuracy
72.5% 72.6% 71.1%
10.3% 9.4% 12.5%
100% 100% 100% 100% 100% 100%
C1 Cumulative C1 On-Campus C1 Remote C2 Cumulative C2 On-Campus C2 Remote
Control Group Treatment Group
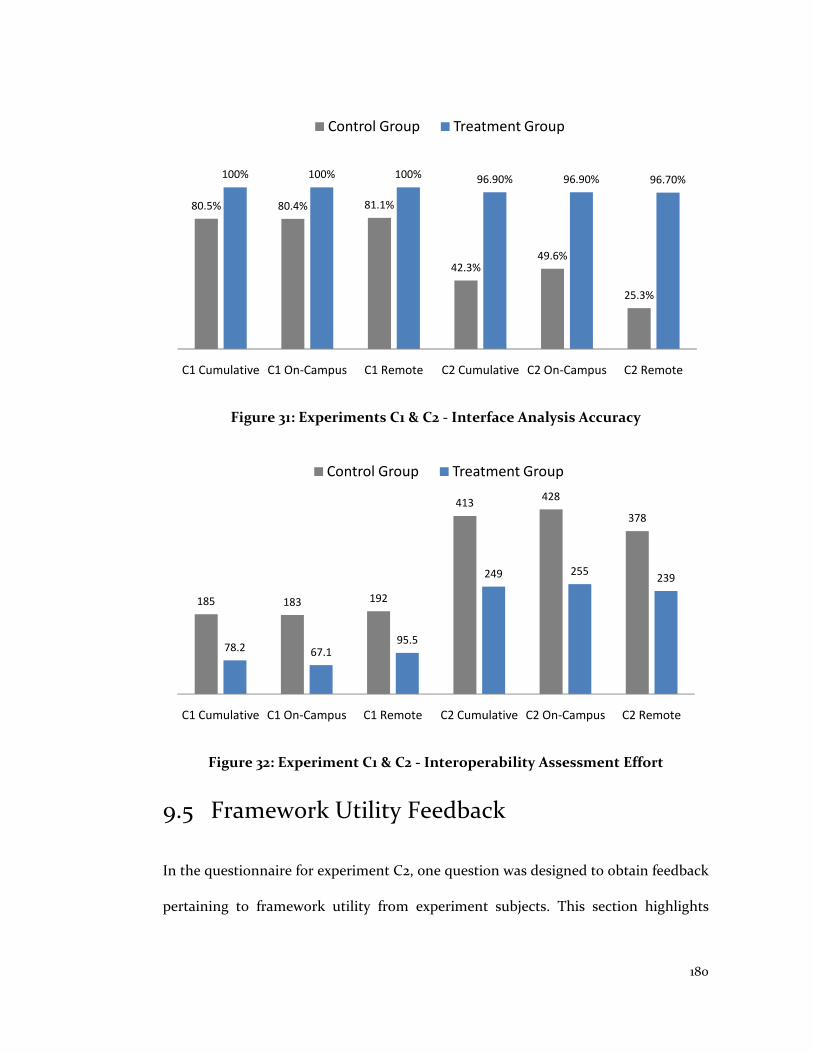
180
Figure 31: Experiments C1 & C2 - Interface Analysis Accuracy
Figure 32: Experiment C1 & C2 - Interoperability Assessment Effort
9.5 Framework Utility Feedback
In the questionnaire for experiment C2, one question was designed to obtain feedback
pertaining to framework utility from experiment subjects. This section highlights
80.5% 80.4% 81.1%
42.3%49.6%
25.3%
100% 100% 100% 96.90% 96.90% 96.70%
C1 Cumulative C1 On-Campus C1 Remote C2 Cumulative C2 On-Campus C2 Remote
Control Group Treatment Group
185 183 192
413428
378
78.2 67.195.5
249 255239
C1 Cumulative C1 On-Campus C1 Remote C2 Cumulative C2 On-Campus C2 Remote
Control Group Treatment Group

181
some feedback provided by subjects with industrial work experience between 4 to 20+
years.
“I think developing a framework for evaluation of COTS product selections is an excellent idea. At my company, there has been increasing interest in integration of COTS products, over the last 15 years or so. Although I have not been involved in any projects whose main focus was integration of COTS products, so far, I expect to eventually be involved in such projects. I can see how a framework such as this and a tool to support it could be very useful.”
“I think this COTS analysis framework is a good way to analyze the interoperability of COTS products for a given system design. I really like the way it determines dependencies of all the different components so that you can see if you are missing some critical components needed to support the rest of your design. It can help you to quickly identify glaring errors in terms of which components are necessary. I also like how the framework takes the given interface mismatches and translates them into a set of internal assumptions. It kind of shows how the effects that may be seen due to a given connector utilization.”
“The integration rules used in the framework are pretty thorough for analyzing mismatches in the deployment diagram. Some rules are more cryptic than others, but overall they do provide a foundation for an analyst to start redesigning the architecture so that mismatches can be eliminated.”
“The framework itself combined with Integration Studio tool is quite powerful at methodically considering all the factors that may come into play when combining COTS components together to produce a system. This tool holds a lot of promise, and the idea of collecting the relevant information of a COTS component and then providing a user friendly interface in which to allow a developer to combine it with other components and then see a compatibility analysis report is a very useful one.”
“Integration Studio and the underlying framework is a powerful tool to analyze COTS interoperability by an analyst with intermediate to advanced experience.”
“The Integration Studio tool provides a very effective interoperability assessment and analysis platform for various COTS-based architectures. Since majority of the systems now being manufactured are composed of COTS, widespread adoption and use of the tool presents a great opportunity to the practitioners to reduce risks and create better effort estimates.”
“The Integration Studio tool is useful in that it provides a clean interface with which to represent a COTS-based architecture. I believe that such a tool would

182
be useful in real world situations in which many disparate components and connectors are assembled in order to determine the viability of COTS-based system architectures.”
“Overall, I think this tool has promise and can be useful for someone who is really familiar with the COTS domain and has more than just cursory knowledge of the types of components under analysis.”
“The COTS interoperability evaluation framework provided gives us an excellent paradigm for analyzing the dependencies and interfaces among a given COTS architecture.”
In addition these and several other comments by experimental subjects provided
valuable feedback on improving the utility of Integration Studio tool.
9.6 Threats to Validity
Two types of threats to validity exist: controllable and uncontrollable [Campbell and
Stanley 1963]. Great care has been taken to make sure that this framework is a useful
model for COTS-based systems assessment. Experimental design, however, is not
perfect. Several external factors can affect the experiment and influence the overall
result. This section attempts to identify the most significant threats to the validity of
this framework and outlines ways in which they were reduced. This section will
discuss some validation threats that the experimental results may counter.
9.6.1 Controllable Threats
Inconsistent Effort Reporting
Threat: Effort reported by the subjects may be inaccurate.
Threat Control: For most the experiments at least 2 forms of effort reporting
mechanisms were employed:

183
• Using a post-experiment questionnaire, and
• Using the classroom effort reporting system.
During the experimental analysis, in situations where the two efforts did not match,
the issue was discussed with the subject in question (wherever possible) to accurately
identify the effort applied.
Learning Curve
Threat: There is a learning curve for candidates using this framework and those using
competing technologies.
Threat Control: Experiment subjects were provided with a 45 minute to 1 hour tutorial
in all 4 experiments. The tool has been designed so that it is extremely easy to use and
similar to Microsoft Visio or Rational Rose in look and feel. Candidates in the course
were trained in using both these tools. The tool utilized in validation experiments did
not employ any advanced notation, just simple boxes and lines, which further reduces
the need of a complex learning curve. Moreover the questionnaires required that the
efforts spent by subjects on tools and technology education, and actually applying
them to the projects are separately reported. Feedback received from experiment
subjects indicated that the tool lacked some desired features – such as copy paste,
group formatting, etc. However all subjects were able to use the tools without any
significant problems.

184
Non uniformity of motivation
Threat: Candidates in one group may have assumed that theirs is an inferior method
and will be de-motivated to perform well in these experiments.
Threat Control: Both groups were trained separately with regards to concepts of
interoperability mismatches in the classroom. Subjects were advised not to discuss or
collaborate with students from their own groups or with students from other group.
In addition while the grading criteria were uniform across both groups, they were
graded on separate curves for the purpose of this assignment.
Treatment Leakage
Threat: There is a possibility that the candidates from the control group obtained
access the information in treatment group and use it to identify mismatches.
Threat Control: During the experiments various security precautions were utilized.
These included:
• controlled dissemination of the tools utilized in validation experiments and
• unique identification key for every candidate in the experiment to access the
tool and related materials to ensure these treatments were not leaked.
In some cases where treatment leakage was identified those specific data points were
removed from this analysis.

185
9.6.2 Uncontrollable Threats
Non-representativeness of Projects
Threat: Experiments will involve projects developed in an advanced software
engineering course. There is a threat that such projects are not representative of
projects in the real world.
Threat Reduction: While the above may be true for some projects it is applicable for
most, especially those that are COTS intensive. This is because: projects developed in
the course are from diverse domains (research – medicine and engineering, library
information systems, and even industry). In addition projects developed at CSSE
utilize many of the COTS products that are used in industry projects (industry
strength databases, and application servers, commercial graphic tools). This has been
more visible of late because the industry has started accepting open source products
such as JBOSS [Davis 2005] application server as their primary platforms. Moreover
experiment C2 obtained similar results for industrial projects.
Uniformity of Projects
Threat: There is a possibility that the projects selected for these experiments will be
from the same domain, or have similar architectural style characteristics.
Threat Reduction: Of the two controlled experiments one experiment did include
cases utilizing web-based architectural style, however this was compensated from the
second controlled experiment (C2) where all selected projects were from different
domains and had distinct architecture styles.

186
Non representativeness of Subjects
Threat: The experimental candidate pools consisted of full-time masters’ level
students and a set of independent validation and verification (IV&V) students who
are full-time professional employees. There is a possibility that this pool does not
represent the industry candidates.
Threat Reduction: Many of the experimental candidates while full-time students come
to school with a certain amount of industry experience. Candidates work experience
information was collected as part of the course data collection. The experience
information for the two groups has been reported alongside experiment results.
Moreover researchers have shown [Höst et al. 2000] that under selected factors there
are only minor differences between conception of students and professionals; and
that there is no significant difference between correctness of students and
professionals.
Noisy Data
Threat: Effort data utilized in experimental analyses for experiments P1 and P2 from
past projects may be inaccurate.
Threat Reduction: In several cases where possible, the respective project team
members for past projects used were contacted to verify the interoperability
assessment and integration efforts that they spent in their projects.

187
Chapter 10
Conclusion and Future Work
10.1 Summary of Contributions
The present work on interoperability assessment and resolution framework makes the
following contributions to the body of knowledge:
1. A set of COTS interoperability representation attributes, extended from previous
works, to define interoperability characteristics of a COTS product. These are 42
attributes classified into four groups – general attributes (4), interface attributes
(16), internal assumption attributes (16) and dependency attributes (6). This
research added 16 attributes to the interoperability assessment literature.
2. A set of 62 interoperability assessment rules, also extended from previous works,
to identify interoperability mismatches in COTS-based architectures. These rules
are classified into 3 groups – interface mismatch analysis rules (7), internal
assumption mismatch analysis rules (50), and dependency mismatch analysis
rules (5).This research added and enhanced 15 rules interface, dependency an
internal assumption rules and updated several internal assumption rules to enable
identification of interoperability mismatches.
3. A guided process to efficiently implement the framework in practice.
4. An automated tool that implements 1, 2 and 3 in practice.

188
5. Integration of this technology with a real-world quality of service connector
selection in the area of voluminous data intensive connectors.
10.2 Framework Limitations
Following are some limitations of this framework:
• Accuracy of the framework relies significantly on COTS product interoperability
definitions. Errors in defining COTS interoperability characteristics will result in
imprecise mismatch analysis.
• The framework was found to provide less value in certain domains where COTS
components pre-dominantly follow a specific methodology of development and
adhere to strict standards of defining component interfaces. For example in the
gaming domain where most components are object oriented and a significant
amount of interaction takes place via APIs and method calls the framework will
not provide significant value-added analysis.
• This framework does not eliminate the need to prototype the application. It
provides a high-level assessment which can be used to filter candidate COTS
choices.
• A large part of effort reduction in the framework is due to the assumption that the
upfront effort required to build interoperability definitions is amortized across
multiple assessments. If this assumption fails, the application of this framework
may become more expensive than other methods (although the validations
demonstrated that the accuracy of this framework is better than current
methods).

189
10.3 Limitations of Validation
The empirical validation of this framework was primarily limited by the available data
and experimental subjects. The projects for 3 of the 4 experiments (P1, P2 and C1)
were taken from a university class. Only one experiment (C3) was conducted where
the projects were from the industry, however an accurate profile of mismatches that
occurred in these projects was unavailable. Given these constraints this validation has
the following drawbacks:
• There are a limited number of technologies in the research domain and almost
none in the industry domain to set a benchmark for this work.
• The entire evaluation of this framework was performed by means of a tool. This
validation does not account for human errors should this framework be used
manually by interested parties.
• Validation of this research has primarily involved information services and
network centric projects. Utility of this framework in has not been assessed in
other project types such as real-time embedded systems or safety-critical systems.
• The validation as performed evaluates the complete framework including the
three elements: interoperability representation attributes, interoperability
assessment rules and guided process for performing interoperability assessment
and its ability to be automated. This validation does not demonstrate which
elements within the framework are more useful over others.
• Correctness and completeness were demonstrated for only interface and
dependency interoperability assessment rules and not for internal assumption
190
rules. Incidence of internal assumption mismatches is largely dependent upon the
specific and detailed deployment characteristics of the system. Deployment
diagram information utilized by this framework is insufficient to substantiate the
occurrence of internal assumption mismatches. The framework however warns
the user where such mismatches could potentially occur.
The proposed framework thus requires further validation in the area of industrial
projects.
10.4 Future Work
This research has focused on providing the developers with a better and faster
decision analysis framework to maximize their trade-off space when selecting,
refreshing and integrating COTS products. There are several possible avenues of
future work. Some of these are:
1. Building and integrating this framework with quality of service extensions, such
as the voluminous data intensive extension already integrated with the
framework-based tool – Integration Studio.
2. Validate this research on projects across non-information system domains such as
real-time or safety-critical software.
3. The outline and concept behind this work can be utilized in performing
interoperability assessment in areas such as systems engineering. An avenue of
future work would include identifying attributes and rules that can enable
interoperability assessments in the systems engineering domain.

191
4. Currently manual intervention is required to transfer the mismatches identified in
the interoperability assessment report into source lines of glue codes estimate. An
automated model which could convert these mismatch results into source lines of
glue code estimates would eliminate this human intervention, and can provide a
completely automated system (along with COCOTS model) which will input an
architecture and output integration effort estimate.

192
Bibliography
[Abd-Allah 1996] Abd-Allah A. (1996). "Composing Heterogeneous Software Architectures." PhD dissertation, Computer Science Department, University of Southern California.
[Abts 2004] Abts C. (2004). "Extending the COCOMO II Software Cost Model to Estimate Effort and Schedule for Software Systems Using Commercial-Off-The-Shelf (COTS) Software Components: The COCOTS Model." PhD Dissertation. Industrial Systems Engineering Department, University of Southern California.
[Addey et. al 2003] Addey D., Ellis J., Suh P. and Theimecke D. (2003). "Content Management Systems (Tools of the Trade)." A-Press, ISBN 978-1590592465.
[Adobe Acrobat 1993] Adobe Systems (1993). “Adobe Acrobat Family.” Available at: http://www.adobe.com/acrobat/, accessed 2007.
[Albert and Brownsword 2002] Albert C. and Brownsword L. (2002). “Evolutionary Process for Integrating COTS-Based Systems (EPIC).” CMU/SEI Technical Report CMU/SEI-2002-TR-005.
[Allen and Garlan 1994] Allen R. and Garlan, D. (1994). "Formalizing Architectural Connection.” 16th International Conference on Software Engineering.
[Allen and Garlan 1997] Allen R. and Garlan D. (1997). "A Formal Basis for Architectural Connection." ACM Transactions on Software Engineering and Methodology.
[Apache 1999] The Apache Software Foundation (1999). “Apache.” Available at: http://www.apache.org/, accessed 2007
[Apache Tomcat 1999] The Apache Software Foundation (1999). “Apache Tomcat.” Available at: http://tomcat.apache.org/, accessed 2007.
[Apache Xerces 1999] The Apache Software Foundation (1999). “Xerces C++ Parser.” Available at: http://xml.apache.org/xerces-c/, accessed 2007.
[Apple Mac OS 1984] Apple Computer (1984). “Macintosh OS.” Available at: http://www.apple.com/macosx/, accessed 2007.
[ASCII 1963] American Standards Association (1963) "American Standard Code for Information Interchange." ASA Standard X3.4-1963.
193
[Ballurio et al. 2002] Ballurio K., Scalzo B. and Rose L. (2002). “Risk Reduction in COTS Software Selection with BASIS,” Proceedings of International Conference on COTS-Based Software Systems.
[Barret et al. 1996] Barret D., Clarke L., Tar P. and Wise A. (1996). "An Event-Based Software Integration Framework." Technical Report 95-048, University of Massachusetts.
[Basili and Boehm 2001] Basili V. and Boehm B. (2001). “COTS-Based Systems Top 10 List." IEEE Computer.
[Basili and Rombach 1991] Basili V. and Rombach H. (1991). “Support for Comprehensive Reuse.” Software Engineering Journal.
[Bhattacharya and Perry 2005] Bhattacharya S. and Perry D. (2005). "Contextual Reusability Metrics for Event-Based Architectures." Proceedings of International Symposium on Empiral Software Engineering.
[Bhuta 2006] Bhuta J. (2006). “A Framework for Intelligent Assessment and Resolution of Commercial Off-The-Shelf (COTS) Product Incompatibilities.” University of Southern California, Center for Systems and Software Engineering technical report USC-CSE-2006-608.
[Bhuta and Boehm 2007] Bhuta J. and Boehm B. (2007). “Attribute-Based COTS Product Interoperability Assessment.” International Conference on COTS-Based Software Systems.
[Bhuta et al. 2007] Bhuta J., Mattmann C., Medvidovic N. and Boehm B. (2007). “Framework for the Assessment and Selection of Software Components and Connectors in COTS-based Architectures.” Sixth Working IEEE/IFIP Conference on Software Architecture.
[Boehm 1996] Boehm B. (1996). "Anchoring the Software Process." IEEE Software, Volume 13, Issue 4.
[Boehm and Scherlis 1992] Boehm B. and Scherlis B. (1992) “Megaprogramming.” Proceedings of DARPA Software Technology Conference.
[Boehm et al. 1998] Boehm B., Egyed A., Port D., Shah A., Kwan J. and Madachy R. (1998). “A Stakeholder Win-Win Approach to Software Engineering Education.” Annals of Software Engineering Volume 6, Issue 1-4.
[Boehm et al. 1999] Boehm B., Abi-Antoun M., Port D., Kwan J. and Lynch A. (1999). "Requirements Engineering, Expectations Management, and the Two Cultures." Proceedings of IEEE International Symposium Requirements Engineering.

194
[Boehm et al 2000] Boehm B., Abts C., Brown A., Chulani S., Clark B., Horowitz E., Madachy R., Reifer D. and Steece B. (2000). "Software Cost Estimation with Cocomo II." Prentice Hall PTR, ISBN: 0130266922.
[Boehm et al. 2003] Boehm B., Port D., Yang Y. and Bhuta J. (2003). "Not All CBS Are Created Equally." Proceedings of Second International Conference on COTS-Based Software Systems.
[Boehm et al. 2003b] Boehm B., Port D., Yang Y., Bhuta J. and Abts C. (2003). "Composable Process Elements for Developing COTS-Based Applications." Proceedings of 2003 International Symposium on Empirical Software Engineering.
[Borland et al. 1997] Borland D., Coon R., Byers K., Levitt D., (1997). “Calibration of a COTS Integration Model Using Local Project Data.” Proceedings of the 22nd Software Engineering Workshop, NASA/Goddard Space Flight Center Software Engineering Laboratory.
[Brooks 1987] Brooks F. Jr. (1987). "No Silver Bullet: Essence and Accidents of Software Engineering." IEEE Computer, Volume 20, Issue 4.
[Brownsword et al. 2000] Brownsword L., Obnerndorf P. and Sledge C. (2000). “Developing New Processes for COTS-Based Systems.” IEEE Software, Volume 17, Issue 4.
[Callaghan 1999] Callaghan B. (1999). "NFS Illustrated." Addison-Wesley Professional Computing Series, ISBN 978-0201325706.
[Campbell and Stanley 1963] Campbell D. and Stanley J. (1963). “Experimental and Quasi-Experimental Designs for Research.” Houghton Mifflin Company, ISBN 978-0395307878.
[Carney 2001] Carney D. (2001). "Assembling Large Scale Systems from COTS Components: Oppurtinities, Cautions, and Complexities." SEI Monograph on the Use of Commercial Software in Government Systems.
[CODASYL 1976] CODASYL Systems Committee (1976). "Selection and Acquisition of Data Base Management Systems." ACM Press.
[Comella-Dorda et al. 2003] Comella-Dorda S., Dean J., Morris E. and Oberndorf P. (2002). "A Process for COTS Software Product Evaluation." Proceedings of First International Conference on COTS-Based Software Systems.
[Collidescope 2005] Software Engineering Architecture Team. (2005) "Collidescope." Available at http://www.seat.utulsa.edu/collidescope.php, accessed 2007.
[CPAN 1995] Comprehensive Perl Archive Network, “CPAN Website.” Available at: http://www.cpan.org/, accessed 2007.

195
[Davis 2005] Davis S. (2005). "JBoss at Work: A Practical Guide." O'Reilly Media, Inc., ISBN 978-0596007348.
[Davis et al. 2001] Davis L., Gamble R., Payton J., Jónsdóttir G. and Underwood D. (2001)"A Notation for Problematic Architecute Interactions." 3rd joint meeting of the European Software Engineering Conference and ACM SIGSOFT´s Symposium on the Foundations of Software Engineering.
[Davis et al. 2002] Davis L., Gamble R. and Payton J. (2002) "The Impact of Component Architectures on Interoperability." Journal of Systems and Software, Volume 61, Issue 1.
[DeLine 1999] DeLine R. (1999). "A Catalog of Techniques for Resolving Packaging Mismatch." Proceedings of Symposium on Software Reuse.
[DeLine 1999b] DeLine R. (1999). “Resolving Packaging Mismatch.” PhD dissertation, Computer Science Department, Carnegie Mellon University.
[Denning 1997] Denning A. (1997) "Activex Controls Inside Out." Microsoft Press, ISBN 978-1572313507.
[DeRemer and Kron 1975] DeRemer F. and Kron H. (1975). "Programming-in-the Large versus Programming-in-the-Small." Proceedings of the International conference on Reliable software.
[Dowkont et al. 1967] Dowkont A., Morris W. and Buetell T. (1967). "A Methodology for Comparision of Generalized Data Base Management System." PEGS Informatics, Inc.
[eBase 2004] "USC-CSE Experience Base Repository." Available at: http://ebase.usc.edu/, accessed 2007.
[eBay API 1995] eBay Inc. (1995) "eBay Developer Website." Available at: http://developer.ebay.com/common/api, accessed 2007.
[Elgazzar et al. 2005] Elgazzar S., Kark A., Putrycz E. and Vigder M. (2005). "COTS Acquisition: Getting a Good Contract." International Conference on COTS-Based Software Systems.
[Fielding 2000] Fielding R. (2000). “Architectural Styles and the Design of Network-based Software Architectures.” PhD Dissertation, University of California, Irvine.
[Fielding et al. 1999] Fielding R., Gettys J., Mogul J., Frystyk H., Masinter L., Leach P. and Berners-Lee T. (1999). "Hypertext Transfer Protocol -- HTTP/1.1." Request for Comments 2616.

196
[Gacek 1998] Gacek C. (1998). "Detecting Architectural Mismatches During System Composition." PhD dissertation, Computer Science Department, University of Southern California.
[Garlan et al. 1995] Garlan D., Allen R. and Ockerbloom J. (1995). “Architectural Mismatch or Why it’s hard to build systems out of existing parts.” Proceedings of International Conference on Software Engineering.
[Geiger 1995] Geiger K. (1995) "Inside ODBC." Microsoft Press, ISBN 978-1556158155.
[Glib 1969] Glib T. (1969) "Weighted Ranking by Levels." IAG Journal, Issue 2.
[Hacker 2000] Hacker S. (2000) "MP3: The Definitive Guide." O'Reilly Media, ISBN 978-1565926615.
[Harold and Means 2004] Harold E. and Means S. (2004) "XML in a Nutshell." O'Reilly Media, Inc., ISBN 978-0596007645.
[Höst et al. 2000] Höst M., Regnell B. and Wohlin C. (2000). “Using Students as Subjects - A Comparative Study of Students and Professionals in Lead-Time Impact Assessment.” Empirical Software Engineering, Volume 5, No 3.
[IEEE 90] Institute of Electrical and Electronics Engineers. (1990). "IEEE Standard Computer Dictionary: A Compilation of IEEE Standard Computer Glossaries." ISBN: 1559370793, The Institute of Electrical and Electronics Engineers Inc.
[ISO/IEC 14598-1 1999] International Organization for Standardization (1999). "Information Techonology – Software Product Evaluation." ISO/IEC 14598-1:1999.
[Kelkar and Gamble 1999] Kelkar, A. and Gamble, R. (1999). "Understanding The Architectural Characteristics Behind Middleware Choices." Proceedings of 1st Conference on Information Reuse and Integration.
[Keshav and Gamble 1998] Keshav R. and Gamble R. (1998). "Towards a Taxonomy of Architecture Integration Strategies." 3rd International Software Architecture Workshop.
[Kazman et al. 1997] Kazman R., Clements P., Bass L. and Abowd G. (1997). "Classifying Architectural Elements as Foundation for Mechanism Matching." Proceedings of 21st Annual International Computer Software and Applications Conference.
[Li 1998] Li W. (1998). "Another Metric Suite for Object-Oriented Programming." The Journal of Systems and Software, Volume 44, Issue 2.
[Linux 1994] Linux Online (1994). “Linux Online.” Available at: http://www.linux.org/, accessed 2007.

197
[Matlab 1994] MathWorks (1994). “Matlab - The Language of Technical Computing.” Available at: http://www.mathworks.com/products/matlab/, accessed 2007.
[Mattmann 2007] Mattmann C. (2007) "Software Connectors for Highly Distributed and Voluminous Data Intensive Systems," PhD Dissertation, Computer Science Department, University of Southern California.
[Medvidovic 2006] Medvidovic N. (2006). "Moving Architectural Description from Under the Technology Lamppost." 32nd EUROMICRO Conference on Software Engineering and Advanced Applications.
[Medvidovic and Taylor 1997] Medvidovic N. and Taylor R. (1997). "A Classification and Comparison Framework for Software Architecture Description Languages." IEEE Transactions on Software Engineering, Volume 26, Issue 1.
[Mehta et al. 2000] Mehta N., Medvidovic N. and Phadke S. (2000) "Towards a Taxonomy of Software Connectors." Proceedings of 22nd International Conference on Software Engineering.
[Meyers and Oberndorf 2001] Meyers B. and Oberndorf P. (2001) "Managing Software Acquisition: Open Systems and COTS Products," ISBN: 0201704544, Addision Wesley.
[Microsoft .NET Framework 2007] Microsoft Corporation (2007). “Microsoft .NET Framework.” Available at: http://msdn.microsoft.com/netframework/, accessed 2007.
[Microsoft Internet Explorer 2007] Microsoft Corporation (2007). “Microsoft Internet Explorer.” Available at: http://www.microsoft.com/ie, accessed 2007.
[Microsoft Office 2007] Microsoft Corporation (2007). “Microsoft Office.” Available at: http://office.microsoft.com/, accessed 2007
[Microsoft Office Visio 2007] Microsoft Corporation (2007). “Microsoft Office Visio.” Available: http://office.microsoft.com/en-us/visio/default.aspx, accessed 2007.
[Microsoft Windows 1985] Microsoft Corporation (1985). “Microsoft Windows.” Available at: http://www.microsoft.com/windows/, accessed 2007.
[Microsoft Office 2007] Microsoft Office (2007). “Microsoft Office.” Available at: http://office.microsoft.com/, accessed 2007.
[Mielnik et al. 2003] Mielnik J., Lang B., Lauriere S., Schlosser J. and Bouthors V., “eCOTS Platform: An Inter-industrial Initiative for COTS-Related Information Sharing.” Proceedings of Second International Conference on COTS-Based Software Systems.
[Miano 1999] Miano J. (1999) "Compressed Image File Formats: JPEG, PNG, GIF, XBM, BMP." Addison-Wesley Professional, ISBN 978-0201604436.

198
[Morisio et al. 2000] Morisio M., Seaman C., Parra A., Basili V., Kradt S. and Condon S. (2000). "Investigating and Improving a COTS-Based Software Development Process." Proceedings of 22nd International Conference on Software Engineering.
[MySQL 1995] MySQL AB (1995). “MySQL Database System.” Available at: http://www.mysql.com/, accessed 2007.
[Ockerbloom 1998] Ockerbloom J. (1998). "Mediating among Diverse Data Formats." PhD Dissertation, Computer Science Department, Carnegie Mellon University, 1998.
[OMG CORBA 1997] Object Management Group (1997). “Common Object Request Broker Architecture (CORBA).” Available at: http://www.corba.org/, accessed 2007.
[Oracle DBMS 1983] Oracle Corporation (1983). “Oracle Database Management System.” Available at: http://www.oracle.com/database/, accessed 2007.
[Owl 2004] "OWL Web Ontology Language Overview." Available at: http://www.w3.org/TR/owl-features/, accessed 2007.
[Perry and Wolf 1992] Perry D. and Wolf A. (1992). "Foundations for the Study of Software Architectures," ACM SIGSOFT Software Engineering Notes, Volume 17, Issue 4.
[Postel and Reynolds 1985] Postel J. and Reynolds J. (1985) "File Transfer Protocol." Request for Comments (RFC) 959.
[PHP 2001] The PHP Group (2001). "PHP Website." Available at: http://www.php.net/, accessed 2007.
[Sharp 2002] Sharp D. (2002). "Customer Relationship Management Systems." Auerbach, ISBN 978-0849311437.
[Shaw 1993] Shaw M. (1993). “Procedure Calls are Assembly Language of Software Interconnections: Connectors Deserve a First Class Status.” Proceedings of Workshop on Studies of Software Design.
[Shaw 1995] Shaw M. (1995). "Architectural Issues in Software Reuse: It's Not Just the Functionality, It's the Packaging," Proceedings of the Symposium on Software Reuse at the 17th International Conference on Software Engineering.
[Shaw et al. 1995] Shaw M., DeLine R., Klein D., Ross T., Young D. and Zelesnik G. (1995). "Abstractions of Software Architecture and Tools to Support Them." IEEE Transactions on Software Engineering, Volume 21, Issue 4.
[Shaw and Clements 1997] Shaw M. and Clements P. (1997). "A Field Guide to Boxology: Preliminary Classification of Architectural Styles for Software Systems." Proceedings of 21st International Computer and Applications Conference.

199
[Shaw and Garlan 1996] Shaw M. and Garlan D. (1996). "Software Architecture: Perspectives on an Emerging Discipline." ISBN: 978-0131829572, Prentice Hall.
[Silberschatz et al. 2005] Silberschatz A., Korth H. and Sudarshan S. (2005). "Database Systems Concepts." McGraw-Hill, ISBN 978-0072958867.
[Sitaraman 1997] Sitaraman R. (1997). "Integration Of Software Systems At An Abstract Architectural Level." M.S. Thesis, University of Tulsa.
[Smith et al. 1997] Smith R., Parrish A. and Hale J. (1997). "Component Based Software Development: Parameters Influencing Cost Estimation.” Proceedings of the 22nd Software Engineering Workshop, NASA/Goddard Space Flight Center Software Engineering Laboratory.
[Sourceforge 2001] Open Source Technology Group (2001). “Sourceforge.” Available at: http://www.sourceforge.net/, accessed 2007.
[Spitznagel and Garlan 2001] Spitznagel B. and Garlan D. (2001). "A Compositional Approach for Constructing Connectors," Proceedings of Working IEEE/IFIP Conference on Software Architecture.
[Standish 2001] “Extreme Chaos.” 2001 update to the CHAOS report available at: http://www.standishgroup.com/, accessed 2007.
[Student 1908] Student. (1908) "The Probable Error of a Mean." Biometrika 6.
[Sullivan and Knight 1996] Sullivan K. and Knight J. (1996). "Experience Assessing an Architectural Approach to Large-Scale Systematic Reuse," Proceedings of 18th International Conference of Software Engineering.
[Sun Java 1994] Sun Microsystems (1994). “Sun Developer Network.” Available at: http://java.sun.com/, accessed 2007.
[Sun Solaris 1989] Sun Microsystems (1989). “Solaris Operating System.” Available at: http://www.sun.com/solaris/ accessed 2007.
[Unicode 2003] The Unicode Consortium, Aliprand J., Allen J., Becker J., Davis M., Everson M., Freytag A., Jenkins J., Ksar M., McGowan R., Muller E., Moore L., Suignard M. and Whistler K. (2003). "The Unicode Standard, Version 4.0." Addison-Wesley Professional, ISBN 978-0321185785.
[USC CSSE 1995] “University of Southern California, Center for Systems and Software Engineering.” Available at: http://csse.usc.edu/, accessed 2007.
[W3 HTTP 1996] World Wide Web Consortium (1993). “Hypertext Transfer Protocol.” Available at: http://www.w3.org/Protocols/, accessed 2007.

200
[W3 HTML 1999] World Wide Web Consortium (1999). “HTML Specification.” Available at: http://www.w3.org/TR/html401/, accessed 2007.
[Xu and Randell 1996] Xu J. and Randell B. (1996). "Roll-Forward Error Recovery in Embedded Real-Time Systems." In proceesings of International Conference on Parallel and Distributed Systems.
[Yakimovich et al. 1999a] Yakimovich D., Bieman J., and Basili V. (1999). "Software Architecture Classification for Estimating the Cost of COTS Integration." Proceedings of 21st International Conference on Software Engineering.
[Yakimovich et al. 1999b] Yakimovich D., Travassos G., and Basili V. (1999). "A Classification of Software Component Incompatibilities for COTS Integration." Proceedings of 24th Software Engineering Workshop.
[Yakimovich 2001] Yakimovich D. (2001). "A Comprehensive Reuse Model for COTS Software Products." PhD Dissertation, University of Maryland, College Park.
[Yang and Boehm 2004] Yang Y. and Boehm B. (2004). “Guidelines for Producing COTS Assessment Background, Process, and Report Documents.” USC CSSE Technical Report, USC-CSE-2004-502.
[Yang et al. 2005] Yang Y., Bhuta J., Boehm B. and Port D. (2005). "Value-Based Processes for COTS-Based Systems." IEEE Software Special Issue on COTS-Based Development, Volume 22, Issue 4.
[Yang 2006] Yang Y. (2006). "Composable Risk-Driven Processes for Developing Software Systems from Commercial-Off-The-Shelf Products." PhD dissertation, Computer Science Department, University of Southern California, 1996.
[Zelesnik 1996] Zelesnik G., “The UniCon Language Reference Manual,” Available at: http://www-cgi.cs.cmu.edu/afs/cs/project/vit/www/unicon/reference-manual/Reference_Manual_1.html, accessed 2007.
[Zend Guard 1999] Zend Technologies Ltd. (1999). “Zend Guard.” Available at: http://www.zend.com/products/zend_guard, accessed 2007
[Zielinski 2003] Zielinski I. (2003). “RTFtoHTML Converter.” Available at: http://www.ireksoftware.com/RTFtoHTML/, accessed 2007.

201
Appendices
Appendix A: Empirical Evaluation Materials for
Experiments P1 and P2
A.1 Interoperability Assignment and Questionnaire
Problem: In this assignment you are going to use the COTS integration analyzer tool
– Integration Studio and analyze your own system architecture for COTS
interoperability conflicts. Using your architecture definition create a deployment
diagram in the tool and perform the analysis.
Submission Contents
• A screen shot of your completed deployment diagram in the tool
• Summary of analysis
• COTS Analysis Report as produced by the tool (email version only)
• Answers to the following questions:
1. How much effort did it take for you to perform the COTS interoperability
analysis:
a. Effort taken to develop the deployment diagram in the tool: _________ Min
b. Effort taken to analyze the report to identify potential mismatches: _________
Min
2. Number of interface mismatches found: ___________
202
3. Number of dependency mismatches found: ___________
4. List these mismatches – clearly indicate which mismatches are interface
mismatches and which mismatches are dependency mismatches:
5. Based on the report do you think you will need to write glue-code, or incorporate
additional COTS components or connectors to implement the system?
6. Is your architecture sound? Based on this analysis are you going to make any
changes in your architecture based on this analysis?
7. Are you planning to conduct any tests due to internal assumption mismatches
identified in the report? Or is any of the internal assumption mismatch a risk to
your project? If so list these mismatches?
8. Paste a screenshot of your analysis here:
A.2 Post Development Questionnaire
1. Name of the students filling this questionnaire:
2. Team Number:
3. Is your system largely dependent on COTS products? _____ Yes ______ No
4. Did your system utilize three or more COTS products? _____ Yes ______ No
5. List the name of COTS products used in your system. For each product listed,
estimate the percentage of system requirements covered by that COTS product.
(Note: You can be using COTS that does not meet any system requirements, but is
required for running other COTS, for example Java Runtime Environment to run
Apache Tomcat)

203
6. Select the COTS related activities that your project performed:
___ Initial filtering ___ Detailed Assessment ___ Market Analysis
___ Vendor Conflict ___ Initialization and Setup ___ Glue Code Development
___ Tailoring ___ License Negotiation ___ Integration Testing
Other (Specify what):
7. Did you identify any missing interface mismatches that were not initially identified
in the interoperability assessment report? ____ Yes ______ No
If yes how many? ___________
List them:
8. Did you identify any missing dependency mismatches that were not initially
identified in the interoperability assessment report? _____ Yes ______ No
If yes how many? ___________
List them:
9. Did you identify any internal assumption mismatches during system testing or
integration? _____ Yes ______ No
If yes how many? ___________
List them:

204
10. How many mismatches specified in your integration analysis report (Team
Assignment 2) actually occurred? Which ones? :
11. How much effort in person hours did you require to integrate the COTS:
- Effort to setup and configure the COTS: ______ Person Hours
- Effort to develop the glue code and integrate: _______ Person Hours
- Effort to test: _______ Person Hours
12. Did the architecture analysis you performed in team assignment 2 impact the
overall development of your system? If so describe the impact it had? If not why do
you think it did not have any impact?

205
Appendix B: Empirical Evaluation Materials for
Experiment C1
B.1 Interoperability Assignment: Control Group
Instructions:
The case provided with this assignment contains a COTS-based architecture that you
need to assess for interoperability.
Questions:
1. How much effort did it take for you to perform the COTS analysis:
a. Effort taken to research COTS products used: _________ Min
b. Effort taken to analyze and identify mismatches: _________ Min
2. Number of mismatches found: _________
3. List these mismatches:
4. Briefly explain the process using which you found the mismatches? Indicate data
sources?
5. Indicate any assumptions you have made when executing this assignment?

206
B.2 Interoperability Assignment: Treatment Group
Instructions:
The case provided with this assignment contains a COTS-based architecture that you
need to assess for interoperability using the Integration Studio tool.
Questions:
1. How much effort did it take for you to perform the COTS analysis:
a. Time taken to develop the deployment diagram in the tool to obtaining the
report: _________ Min
b. Time taken to analyze the report to identify mismatches: _________ Min
2. Number of interface mismatches found: ________
3. Number of dependency mismatches found: _________
4. List these mismatches (clearly identify which mismatches are interface
mismatches and which mismatches are dependency mismatches).
5. For this case study do you think this information is enough for you to identify
interoperability mismatches? If not what additional information is required?
6. Indicate any assumptions you have made when executing this assignment?

207
B.3 Interoperability Assignment Case Studies
B.3.1 Case 1, Student Staff Directories
Client for this project is a university with over 50,000 students and thousands of Staff
and Faculty. The university desires to build a website that provides a convenient way
to access general information for students and staff via the internet.
After initial assessment the client and the COTS assessment team has decided to
select the following COTS products :
- MySQL Database 5.0 (http://www.mysql.com/): That will store the system
data.
- Zope Content Management System (http://www.zope.org/): That will provide
the business logic for the system.
- Apache Webserver 2.0 (http://www.apache.org/): That will communicate with
Zope and exchange data request information.
- Internet Explorer (http://www.microsoft.com/ie): A browser that will form
the user interface for Windows users.
- Mozilla Firefox 2 (http://www.mozilla.org/): A browser that will form the user
interface for Mac OS X users.
For products whose version is not specified assume the latest version. The initial
architecture based on their findings is shown in Figure 33.

208
Figure 33: Experiment C1 - Case 1, Student Staff Directories
B.3.2 Case 2, Technical Report System
Client for this system is a sub-department within a University. They would like to
build a technical report system that automates the entry and storage of technical
journals and related meta-data (other examples include ACM Digital library and IEEE
explore). It will upgrade the current manual entry process to a multi-user automatic
archiving system.

209
MySQL Database 5.0
Solaris File System
Internet Explorer 7
Solaris
Data
Data
Data
Solaris
Windows XP
Mozilla Firefox 2.0
Apple Mac OS X
Data
Apache Tomcat 5.0
Custom Java Servlets
and JSP
Figure 34: Experiment C1 - Case 2, Technical Report System
After initial assessment the client and the COTS assessment team has decided to
select the following COTS products:
- MySQL Database 5.0 (http://www.mysql.com/): That will store the system
meta-data.
- Solaris File System: That will store the documents to provide the business
logic for the system.
- Apache Tomcat 5.0 Webserver (http://tomcat.apache.org/): that will host the
custom business logic.
- Custom Java servlets and Java server pages: These will form the business logic
of the application.
210
- Internet Explorer 7 (http://www.microsoft.com/ie): A browser that will form
the user interface for Windows users.
- Mozilla Firefox 2(http://www.mozilla.org/): A browser that will form the user
interface Mac OS X users.
For products whose version is not specified assume the latest version. The initial
architecture based on their findings is shown in Figure 34.
B.3.3 Case 3, Online Shopping System
Client for this engagement is a commercial website selling vintage articles on the
Internet that requires a new and automated system which supports searching and a
shopping cart function where users can add, modify or remove products they would
like to purchase. The system should be integrated with Bank of America's eStore
credit card payment system, for customers to make credit card payments online.
During the assessment phase the client and the assessment team have decided to go
with a Windows centric approach adopting the following products :
- MS SQL 2005 (http://www.microsoft.com/sql/): as their database
management system
- Microsoft IIS 6.0 server (http://www.microsoft.com/WindowsServer2003/): as
the server which will host system’s business logic
- Catalogue Integrator Cart (http://www.catalogintegrator.com/home.asp): to
manage the inventory and shopping interface.

211
- Custom ASP .NET pages: That will provide additional business logic required
by the system.
- Internet Explorer 7 (http://www.microsoft.com/windows/ie): A browser that
will form the user interface for Windows users.
- Mozilla Firefox 2(http://www.mozilla.org/): A browser that will form the user
interface Mac OS X users.
- Bank of America Merchant Credit Card Processing System for Internet and
Ecommerce (http://www.bankofamerica.com/small_business/): that will
manage all credit-card transactions.
For products whose version is not specified assume the latest version. The initial
architecture is shown in Figure 35.
Figure 35: Experiment C1 - Case 3, Online Shopping System

212
B.3.4 Case 4, Customer Relations Management Tool
The customer in this engagement desires to develop a Customer Relations
Management Tool will help small businesses owners to manage a database of their
customer’s names, addresses, buying histories, purchase preferences, occasions, and
other pertinent information that will allow the store to better serve and manage their
business and generate promotional products such as coupons and fliers.
Linux
Postgres SQL
Linux
Data
Internet Explorer 7
Windows XP
Mozilla Firefox 2.0
Apple Mac OS X
Data
Tomcat 5.0
Custom CRM Application
using JSP and Servelets
iText PDF Java
Libraries
Data &
Control
Data
Figure 36: Experiment C1 - Case 4, Customer Relations Management Tool
After initial assessment the client and the COTS assessment team has decided to use
the following COTS products:
- PostGres SQL database 8 (http://www.postgresql.org/): That will store the
system data.

213
- iText PDF Java Libraries (http://www.lowagie.com/iText/): To create reports
in PDF.
- Apache Tomcat 5 Webserver (http://tomcat.apache.org/): That will host the
custom business logic.
- Custom Java servlets and Java server pages: These will form the business logic
of the application.
- Internet Explorer 7 (http://www.microsoft.com/ie): A browser that will form
the user interface for Windows users.
- Mozilla Firefox 2 (http://www.mozilla.org/): A browser that will form the user
interface Mac OS X users.
For products whose version is not specified assume the latest version. The initial
architecture is shown in Figure 36.
B.3.5 Case 5, Online Bibliographies
The client for this engagement desires an online version of the currently electronic
but isolated volumes or bibliographies to be made available for fellow scholars and
the general public. The system would provide text as well as graphical content to
enrich the user experience.
After initial assessment the client and the COTS assessment team has decided to use
the following COTS products:
- MySQL 5.0 Database (http://www.mysql.com/): That will store the system
meta-data.

214
- Text2PDF Libraries (http://www.text2pdf.com/): To create reports in PDF.
- Apache 2.0 Webserver (http://www.apache.org/): That will manage
requests/responses.
- Custom PHP pages: These will form the business logic of the application.
- Internet Explorer 7 (http://www.microsoft.com/ie): A browser that will form
the user interface for Windows users.
- Mozilla Firefox 2 (http://www.mozilla.org/): A browser that will form the user
interface Mac OS X users.
Figure 37: Experiment C1 - Case 5, Online Bibliographies

215
For products whose version is not specified assume the latest version. The initial
architecture is shown in Figure 37.
B.3.6 Case 6: Volunteer Database
Client for this engagement is a non-profit organization that desires a system that will
help them track information of volunteers. The system should provide mechanisms
for contacting them via mass email as well as text messages.
After initial assessment the client and the COTS assessment team has decided to use
the following COTS products:
- MS SQL 2005 (http://www.microsoft.com/sql/): as their database
management system
- Microsoft IIS 6.0 server (http://www.microsoft.com/WindowsServer2003): as
the server which will host system’s business logic
- Custom ASP .NET pages: That will provide additional business logic required
by the system.
- Internet Explorer 7 (http://www.microsoft.com/ie): A browser that will form
the user interface for Windows users.
- Mozilla Firefox 2 (http://www.mozilla.org/): A browser that will form the user
interface Mac OS X users.
- SMS Gateway (http://www.winsms.com/): that will enable text-message
communication

216
For products whose version is not specified assume the latest version. The initial
architecture is shown in Figure 38.
Figure 38: Experiment C1 - Case 6, Volunteer Database

217
Appendix C: Empirical Evaluation Materials for
Experiment C2
C.1 Interoperability Assignment: Control Group
Instructions:
You are an independent software interoperability analyst, and have been engaged to
analyze system architecture (as in your assigned case study). Analyze the COTS-based
architecture case for interoperability mismatches using the methods (dependency
analysis, interface analysis, internal assumption analysis) discussed during the
tutorials and answer the questions below.
Questions:
1. How much effort did it take for you to perform the COTS analysis (this effort does
not include time required to complete question 6):
i. Effort spent for training: _________ Min
ii. Effort spent researching the COTS products used: _________ Min
iii. Effort spent to analyze the architecture to identify mismatches: _________
Min
2. Number of interface mismatches found: _________
3. Number of dependency mismatches found: _________

218
4. Summarize these mismatches
5. Analyze and summarize the internal assumption mismatches and recommend
which potential mismatches should be tested.
6. Explain the process using which you found the mismatches? Indicate data
sources?
C.2 Interoperability Assignment: Treatment Group
Instructions:
You are an independent software interoperability analyst, and have been engaged to
analyze system architecture (as in your assigned case study). Analyze the COTS-based
architecture case for interoperability mismatches using the methods (dependency
analysis, interface analysis, internal assumption analysis) discussed during the
tutorials and answer the questions below.
1. How much effort did it take for you to perform the COTS analysis (this effort does
not include time required to complete question 6):
a. Effort spent for (iStudio) training: _________ Min
b. Effort spent in developing the deployment diagram to obtain the analysis:
_________ Min
c. Effort spent to analyze the report to identify mismatches: _________ Min
2. Number of interface mismatches found: _________

219
3. Number of dependency mismatches found: _________
4. Summarize the interface and dependency mismatches (clearly identify the
components involved when citing the mismatches).
5. Review the internal assumption analysis portion of the report and recommend
which potential mismatches should be tested.
C.3 Interoperability Assignment Case Studies
C.3.1 Case 1: Science Data Dissemination System
NASA’s various unmanned satellites and rovers transmit over 10 Terabytes of data
including images, sensor data, and videos every month. This data needs to be
disseminated to NASA’s counterparts in the European Space Agency (ESA),
researchers at various universities and other interested parties. Similarly, NASA also
needs to retrieve data received by European satellites from ESA. For this purpose and
taking into account various legacy system, the designers have recommended the
system illustrated in Figure 39. The system comprises of 3 sub-systems:
1. NASA dissemination system
2. ESA dissemination system
3. Access sub-system for university researchers and other interested parties.

220
Internet Explorer
Windows XP
Digital Asset
Database
(MySQL)
Sensor Database
(Oracle)
Query Handler
(Java Servelet)
Digital Asset
Management System
(Dspace)
Data
Data
Data
Data retrieval
component
(Java Application)
Data
Data
Linux
Linux
LinuxLinux Windows Server 2003
Video Database
(MS SQL Server)
Video Data Manager
(ASP .NET Pages)
Video Encoder
(Windows Media
Encoder)
Media Streaming
Server
(Windows Media
Server)
DataData
Data
Data
ESA Sensor
Database (Oracle)
ESA Query Handler
(PHP Application)
ESA Data retrieval
component
(Java Application)
Linux
Linux
LinuxLinux
Data
DataData
Data Data
Data Data
Windows Medial
Player
Data &
Control
Data Data
Data
Uni-directional interaction
Bi-directional interaction
Component
Sub-system
Node/Operating System Framework
Key
NASA Dissemination System
ESA Dissemination System
University Researchers and Interested Parties
ESA Digital Asset
Management System
(Dspace)
ESA Digital Asset
Database
(MySQL)
Data
MS IIS
Custom Component
Figure 39: Experiment C2 - Case 1, Science Data Dissemination System
The NASA dissemination system includes the following components:
- Data retrieval component (Java Application): is responsible for retrieval and
dissemination of high-quality data to be disseminated to ESA. The data
retrieved and transmitted by this component is in the order of several
hundred gigabytes per day.
221
- Query Manager (Java servelet application): is responsible for retrieval of
limited amounts of data in the order of a few hundred gigabytes per day.
- Digital Asset Management System (DSpace): is responsible for managing
digital image assets and associated meta-data. (URL: http://www.dspace.org/)
- Digital Asset Database (MySQL): is responsible for managing storing digital
images and related meta-data. (URL: http://www.mysql.com/)
- Sensor Database (Oracle): is responsible for storage and retrieval of sensor
data. (URL: http://www.oracle.com/database/index.html)
- Video Encoder (Windows Media Encoder): is responsible for encoding video
data retrieved from various satellites. (URL:
http://www.microsoft.com/windows/windowsmedia/forpros/encoder/default.
mspx)
- Video Database (MSSQL Server 2005): is responsible for storage dissemination
of video data encoded by windows media encoder (URL:
http://www.microsoft.com/sql/default.mspx).
- Media Streaming Server (Windows Media Server): is responsible for streaming
video files to interested parties (URL:
http://www.microsoft.com/windows/windowsmedia/forpros/server/version.as
px)
- Video Query Handler (ASP .NET Pages): is an interface for managing and
disseminating digital video data (Microsoft IIS:
http://www.microsoft.com/windowsserver2003/iis/default.mspx).

222
The ESA dissemination system is similar to that of NASA’s except that it lacks the
components related to digital videos (Windows media encoder, Video database,
Windows Media Server, and Video Query Handler), and the query manager is a PHP
application.
University researchers and other interested parties utilize Internet Explorer and a
windows media player as their interface to these systems.
- Internet Explorer (URL: http://www.microsoft.com/ie)
- Windows Media Player (URL: http://www.microsoft.com/windowsmedia/)
Operating systems utilized for these applications include:
- Windows XP (URL: http://www.microsoft.com/windowsxp)
- Linux (Redhat) (URL: http://www.redhat.com/rhel/)
- Windows Server 2003 (URL: http://www.microsoft.com/windowsserver2003)
C.3.2 Case 2: EDRM System for Cancer Research
The medical research community has collaborated to develop an Electronic
Document and Records Management (EDRM) system to facilitate research in the area
of cancer treatment. The system consists of 5 sub-systems as illustrated in Figure 40.
1. Bio-marker database: stores and retrieves various cancer symptoms
2. Science data-processing system: processes large amounts of cancer related
scientific data
3. Specimen management system: stores and disseminates cancer related
specimens and corresponding meta-data

223
4. Study management tools: provides a set of tools for the researchers to perform
their analysis
5. User portal: extracts data from the four systems above and provides an
interface for researchers to access the information
Bio-marker database:
- Bio-marker front-end (Java Servelets): provides a front-end interface to
retrieve bio-marker data. (Apache Tomcat URL: http://tomcat.apache.org/)
- Bio-marker datastore (MySQL): stores bio-marker related information. (URL:
http://www.mysql.com)
Science Data-Processing System:
- Workflow Manager (Oracle BPEL Workflow Manager): manages science data
processing flow (URL: http://www.oracle.com/technology/products/ias/bpel/)
- File Management (DSPACE): manages science assets for the data-processing
system. (URL: http://www.dspace.org/)
- Science Database (MySQL): stores data-processing system assets (URL:
http://www.mysql.com)

224
Microsoft IIS
Windows XP
Mozilla Firefox
Data
File Management System
(DSPACE)
Solaris
Science Database
(MySQL)
Data
Mozilla Firefox
Windows XP
Portal Front-end
(Plone)
Solaris
Portal Database
(MySQL)
Data
Data
Workflow Manager
(Oracle BPEL Workflow
Manager)
Data*
Bio-Marker Data Store
(MySQL)
Bio-marker Front-end
(Java Servelets & JSP)
Data
Data
Internet Explorer 7
Data
Windows Server 2003
Specimen Management
(Freezerworks)
Data
Windows Server 2003
Data
Study Tools
(ASP .NET Application)
Study Results Database
(MSSQL)
Data
Linux
Data
Bio-marker database – Indication of Cancer
Science Data-Processing System
User Portal
Study Management Tools
Specimen Management System
Uni-directional interaction
Bi-directional interaction
Component
Custom Component
Node/Operating System
Key
Apache Tomcat
Specimen Database
(MSSQL Server)
Data
Framework
Figure 40: Experiment C2 - Case 2, EDRM System for Cancer Research

225
Specimen Management System:
- Specimen Management (Freezerworks): provides a user interface for
managing cancer related specimen information (URL:
http://www.dwdev.com/)
- Specimen Database (MSSQL Server): stores specimen related information
(URL: http://www.microsoft.com/sql/default.mspx)
Study Management Tools:
- Study Tools (ASP .NET): Provides a set of tools used to perform cancer
research analysis. (Microsoft IIS URL:
http://www.microsoft.com/windowsserver2003/iis/)
- Study Database (MSSQL Server 2005): manages study related data and
corresponding results. (URL: http://www.microsoft.com/sql/default.mspx).
User Portal:
- Portal Front-End (Plone): Provides a front-end to users to access the portal
information. Retrieves data from the accompanying systems and stores it in
the portal database. (URL: http://plone.org/)
- Portal Database (MySQL): Stores data as required by the portal. (URL:
http://www.mysql.com/)
Users utilize Internet Explorer and Mozilla firefox browsers as their interface to these
systems.
- Internet Explorer URL: http://www.microsoft.com/ ie/
226
- Mozilla Firefox URL: http://www.mozilla.org/
Operating systems utilized for these applications include:
- Windows XP: http://www.microsoft.com/windowsxp
- Linux (Redhat): http://www.redhat.com/rhel/
- Solaris (Sun): http://www.sun.com/software/solaris/
- Windows Server 2003: http://www.microsoft.com/windowsserver2003/
C.3.3 Case 3: Business Data Processing System
A multi-million banking organization requires to process the large amount of market
financial data that it collects every-day to predict future scenarios. To this end they
developed a sophisticated, distributed system that splits the analysis multiple jobs
and executes each job at distributed nodes. The system architecture is illustrated in
Figure 41.
The components utilized in this system include:
- Operator interface (Java Servelets and JSPs): provides an interface for the
operator to initiate and manage analysis. (Oracle AIS URL:
http://www.oracle.com/appserver/index.html)
- Market information database (Oracle): stores information related to past and
on-going market activities. (Oracle URL:
http://www.oracle.com/technology/software/products/database/oracle10g/in
dex.html)
227
- Workflow Manager ((Oracle BPEL Workflow Manager)): manages data
processing workflow. Allocates jobs to Adaptors based on Partitioner’s
analysis.
(URL: http://www.oracle.com/technology/products/ias/bpel/index.html)
- Resource Manager (Torque Workload Manager): tracks resource utilization,
responds to query from the Partitioner and advises it of available resources.
(URL: http://www.clusterresources.com/pages/products/torque-resource-
manager.php)
- Partitioner (Java Application): Partitions the analysis into several sub-jobs,
utilizes information from the resource manager to allocate jobs to nodes, and
returns the information to the workflow manager.
- Adapter (Java Application): Performs analysis on the sub-job.
- Aggregator (Java Application): Queries partially completed jobs from the File
Manager and combines them into the final product.
- File Manager (DSPACE): Stores job analyses results and provides an interface
for the operator to retrieve the analysis. (URL: http://www.dspace.org)
- File Management Database (MySQL): Provides file management support to
DSpace, stores partially and completely analyzed job-results and the . (URL:
http://www.mysql.com)
Operator utilizes Internet Explorer to interface with these systems.
- Internet Explorer URL: http://www.microsoft.com/ie/
Operating systems utilized for these applications include:

228
- Windows XP: http://www.microsoft.com/windowsxp
- Linux (Redhat): http://www.redhat.com/rhel/
- Solaris (Sun): http://www.sun.com/software/solaris/
Oracle AIS
Operator Interface
(Java Servlets and
JSPs)
Internet Explorer
Windows XP
Data
Linux Linux
Workflow manager
(Oracle BPEL Workflow
Manager)
Linux
Partitioner
(Java Application)
Linux
Adaptor
(Java Application)
Data Data
Data
Linux
Resource Manager
(Torque Workload
Manager)
Solaris
File Manager
(DSPACE)
Data*
Data
Data*
Linux
Aggregrator
(Java Application)
Data
Data*
File Management
Database
(MySQL)
Data
Market
Information
Database
(Oracle)
Data
Linux
Data
Uni-directional interaction
Bi-directional interaction
Component
Custom Component
Node/Operating System Framework
Key
Figure 41: Experiment C2 - Case 3, Business Data Processing System
C.3.4 Case 4: Back Office System
A multi-million dollar network service provider, specializing in providing internet
services to large organizations and their campuses is re-designing its back office
system. The system architecture is illustrated in Figure 42.
The system components are given below.

229
- Database Management System (Oracle): This is the data-backbone of the
system. It stores all the client, billing, pricing etc. information. (URL:
http://www.oracle.com/database/index.html)
- Network Monitoring System (NimBUS): monitors users’ network
consumption, provides the latest user consumption information available to
the customer center and stores the monitoring results in the database (URL:
http://www.nimsoft.com/solutions/network-monitoring/index.php)
- Customer Care system (Siebel Call center and service): Manages customer
information, provides an interface for call-center operators to manage
customer data and provide them with call service. (URL:
http://www.oracle.com/crmondemand/index.html)
- Order entry system (Oracle Webcache Order Entry System): is an order entry
system to enter user orders, maintenance and support requests etc.
(URL:http://www.oracle.com/technology/sample_code/products/ias/web_cac
he/htdocs/OrderEntryReadme.html)
- Enterprise billing system (PeopleSoft Enterprise Customer Relationship
Management): responsible for billing the users. (URL:
http://www.oracle.com/applications/peoplesoft/srm/ent/index.html)
- Mobile Sales System (Salesforce): Provides an interface for mobile salesmen to
access the CRM data. (URL: http://www.salesforce.com/)
- Pricing configuration (Java Servlet Application): is a custom application which
manages special packages in deals available to customers.
- (Oracle Application Server URL:
http://www.oracle.com/appserver/index.html)
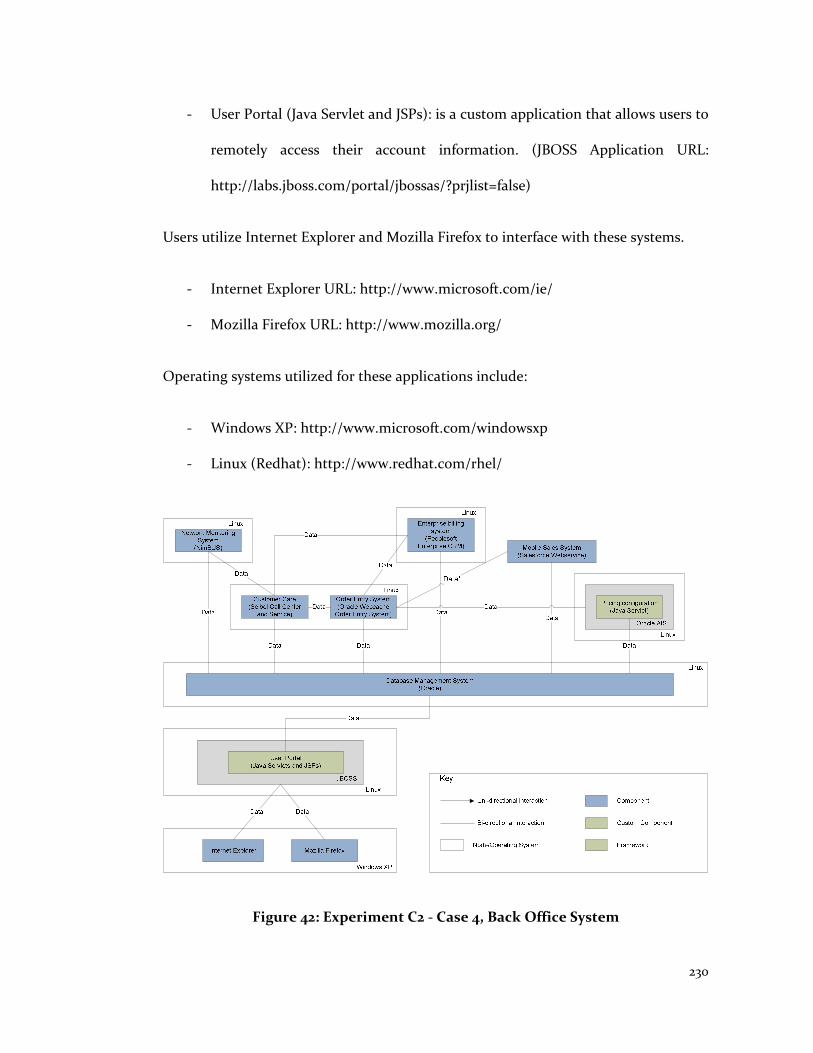
230
- User Portal (Java Servlet and JSPs): is a custom application that allows users to
remotely access their account information. (JBOSS Application URL:
http://labs.jboss.com/portal/jbossas/?prjlist=false)
Users utilize Internet Explorer and Mozilla Firefox to interface with these systems.
- Internet Explorer URL: http://www.microsoft.com/ie/
- Mozilla Firefox URL: http://www.mozilla.org/
Operating systems utilized for these applications include:
- Windows XP: http://www.microsoft.com/windowsxp
- Linux (Redhat): http://www.redhat.com/rhel/
Figure 42: Experiment C2 - Case 4, Back Office System
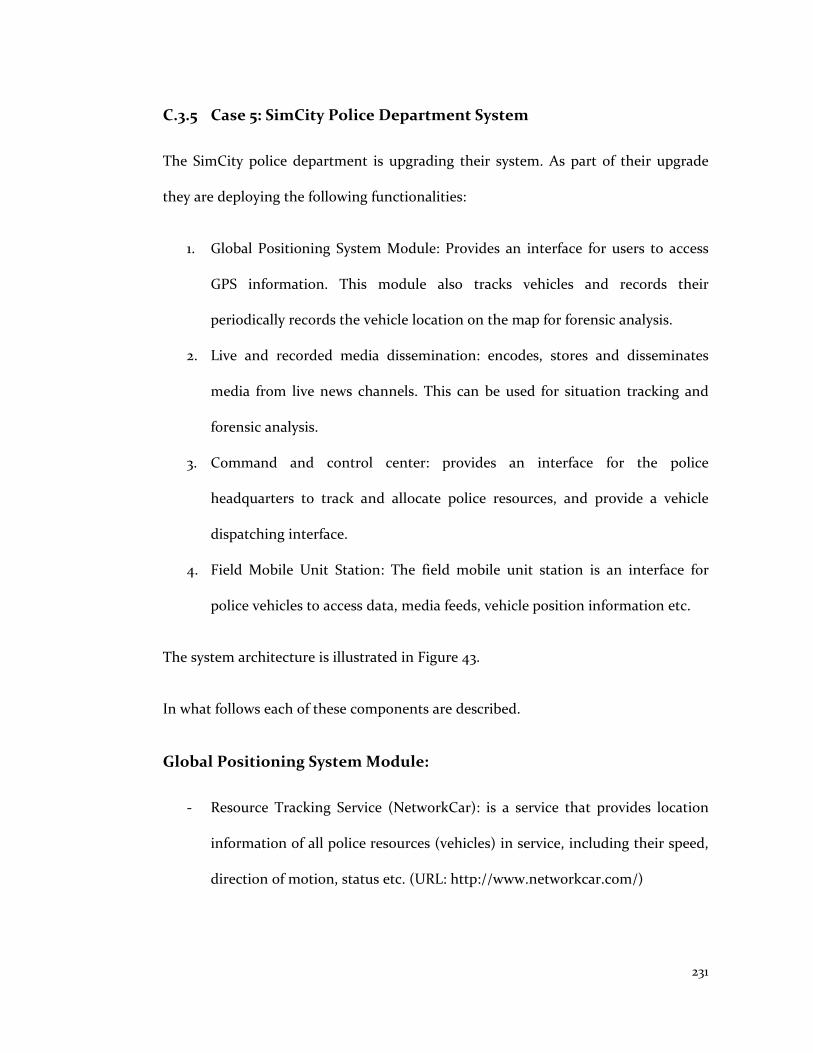
231
C.3.5 Case 5: SimCity Police Department System
The SimCity police department is upgrading their system. As part of their upgrade
they are deploying the following functionalities:
1. Global Positioning System Module: Provides an interface for users to access
GPS information. This module also tracks vehicles and records their
periodically records the vehicle location on the map for forensic analysis.
2. Live and recorded media dissemination: encodes, stores and disseminates
media from live news channels. This can be used for situation tracking and
forensic analysis.
3. Command and control center: provides an interface for the police
headquarters to track and allocate police resources, and provide a vehicle
dispatching interface.
4. Field Mobile Unit Station: The field mobile unit station is an interface for
police vehicles to access data, media feeds, vehicle position information etc.
The system architecture is illustrated in Figure 43.
In what follows each of these components are described.
Global Positioning System Module:
- Resource Tracking Service (NetworkCar): is a service that provides location
information of all police resources (vehicles) in service, including their speed,
direction of motion, status etc. (URL: http://www.networkcar.com/)

232
- Mapping Software (ArcGIS Server): is a mapping server which utilizes
information provided from networkcars to display location of police resources
in various parts of the city. (URL:
http://www.esri.com/software/arcgis/arcgisserver/)
- Vehicle Tracking System (.NET Application): takes a periodic snapshot of
resource locations and stores it in the database. This data is used for forensic
analysis. (Microsoft Internet Information Services (IIS) URL:
http://www.microsoft.com/windowsserver2003/iis/default.mspx)
- Vehicle Tracking Database (Oracle DBMS): stores the periodic snapshot of
resource location in the database. (Oracle DBMS URL:
http://www.oracle.com/database/enterprise_edition.html)
MS IIS
Mapping Software
(ArcGIS Server)
JBoss
Linux
Resource Tracking Service
(NetworkCar)
Data*
Global Positioning System Module
Resource Manager
(Peoplesoft 9.0)
Linux
Resource Management
Database
(Oracle DBMS)
Linux
Command and
Control Manager
(JSP and
JavaServelets)
JBoss
LinuxData*
Data
Data
Windows XP
User Interface(Java Application)
Internet Explorer
DataDataData
Command and Control Center
Data
Windows Server 2003
Media Streaming
Server
(Windows Media Server)
Data
Live and Recorded Media dissemination System
Media Storage
System
(MS SQL Server)
MS IIS
Media Manager
(ASP .NET Application)
Video Encoder
(Windows Media
Encoder)
Data Data
Data
Windows XP
Field Mobile Unit Station
Internet Explorer
Data
Data Data
Windows Media
Player
Data &
Control
Data
Windows Server 2003
Vehicle Tracking System
Interface
(.NET Application)
Windows Media Player
Data & Control
Data
Vehicle Tracking
Database
(Oracle DBMS)
Linux
Data
Data
Uni-directional interaction
Bi-directional interaction
Component
Sub-systemNode/Operating System
FrameworkKey
Data
Custom Component
Figure 43: Experiment C2 - Case 5, SimCity Police Department System

233
Live and Recorded Media dissemination system:
- Video Encoder (Windows Media Encoder): Encodes supplied news and video
feeds in windows media format for storage and dissemination. (URL:
http://www.microsoft.com/windows/windowsmedia/forpros/encoder/default.
mspx)
- Media Storage System (MS SQL Server): Stores the windows media files and
corresponding meta-data. (URL: http://www.microsoft.com/sql/default.mspx)
- Media Manager (ASP .NET Application): Manages media and corresponding
meta-data.
- Media Streaming Server (Windows Media Server): streams out windows
media files to the command center and mobile units. (URL:
http://www.microsoft.com/windows/windowsmedia/forpros/server/server.as
px)
Command and Control Center
- Command and Control Manager (JSP and Java Servlets): provides an interface
for users at the command and control center to resource mapping system,
resource manager and the database. (JBoss Application Server URL:
http://www.redhat.com/jboss/details/application/)
- Resource Manager (Peoplesoft): Manages police department resources
(people, vehicles, trucks etc.) (URL:
http://www.oracle.com/applications/peoplesoft-enterprise.html)

234
- Resource Management Database (Oracle DBMS): Stores SimCity police
department resource information. (URL:
http://www.oracle.com/database/enterprise_edition.html)
The field mobile unit station utilizes a browser and a media player as their user
interface.
Users utilize Internet Explorer and Mozilla firefox to interface with these systems.
- Internet Explorer URL: http://www.microsoft.com/ie/default.mspx
Operating systems utilized for these applications include:
- Windows XP: http://www.microsoft.com/windowsxp
- Linux (Redhat): http://www.redhat.com/rhel/

235
Appendix D: Case-Specific Results for Experiment C1
Results for experiment C2 cases 1 to 5 are available in Table 85, Table 86, Table 87,
Table 88 and Table 89. The figure next to the sample set value indicates the number
of subjects in that group.
Table 85: Experiment C1 - Case 1 Results
Sample Set Mean Standard Deviation
P-Value
Mean Experience - Control: 1.25 yrs; Treatment: 1.25 yrs
Degree of Freedom: 22
Hypotheses IH1: Accuracy of Dependency Analysis
Control Group (12) 86.1% 6.5 <0.0001
(t = 7.42) Treatment Group (12) 100% 0
Hypotheses IH2: Accuracy of Interface Analysis
Control Group (12) 90.3% 8.6 0.0007
(t = 3.92) Treatment Group (12) 100% 0
Hypotheses IH3: Interoperability Assessment Effort
Control Group (12) 202 min 83 0.0003
(t = 4.24) Treatment Group (12) 85.8 min 46

236
Table 86: Experiment C1 - Case 2 Results
Sample Set Mean Standard Deviation
P-Value
Mean Experience - Control: 1.1 yrs; Treatment: 1.29 yrs
Degree of Freedom: 23
Hypotheses IH1: Accuracy of Dependency Analysis
Control Group (13) 74.7% 8.6 <0.0001
(t = 10.2) Treatment Group (12) 100% 0
Hypotheses IH2: Accuracy of Interface Analysis
Control Group (13) 82.7% 12 <0.0001
(t = 4.98) Treatment Group (12) 100% 0
Hypotheses IH3: Interoperability Assessment Effort
Control Group (13) 137 min 53 0.0011
(t = 3.71) Treatment Group (12) 74.8 min 23
Table 87: Experiment C1 - Case 3 Results
Sample Set Mean Standard Deviation
P-Value
Mean Experience - Control: 1.73 yrs; Treatment: 1.07 yrs
Degree of Freedom: 26
Hypotheses IH1: Accuracy of Dependency Analysis
Control Group (15) 63% 9.1 <0.0001
(t = 14.7) Treatment Group (13) 100% 0
Hypotheses IH2: Accuracy of Interface Analysis
Control Group (15) 74.3% 5.9 <0.0001
(t = 15.6) Treatment Group (13) 100% 0
Hypotheses IH3: Interoperability Assessment Effort
Control Group (15) 216 min 115 0.0002
(t = 4.38) Treatment Group (13) 75.8 min 16.3
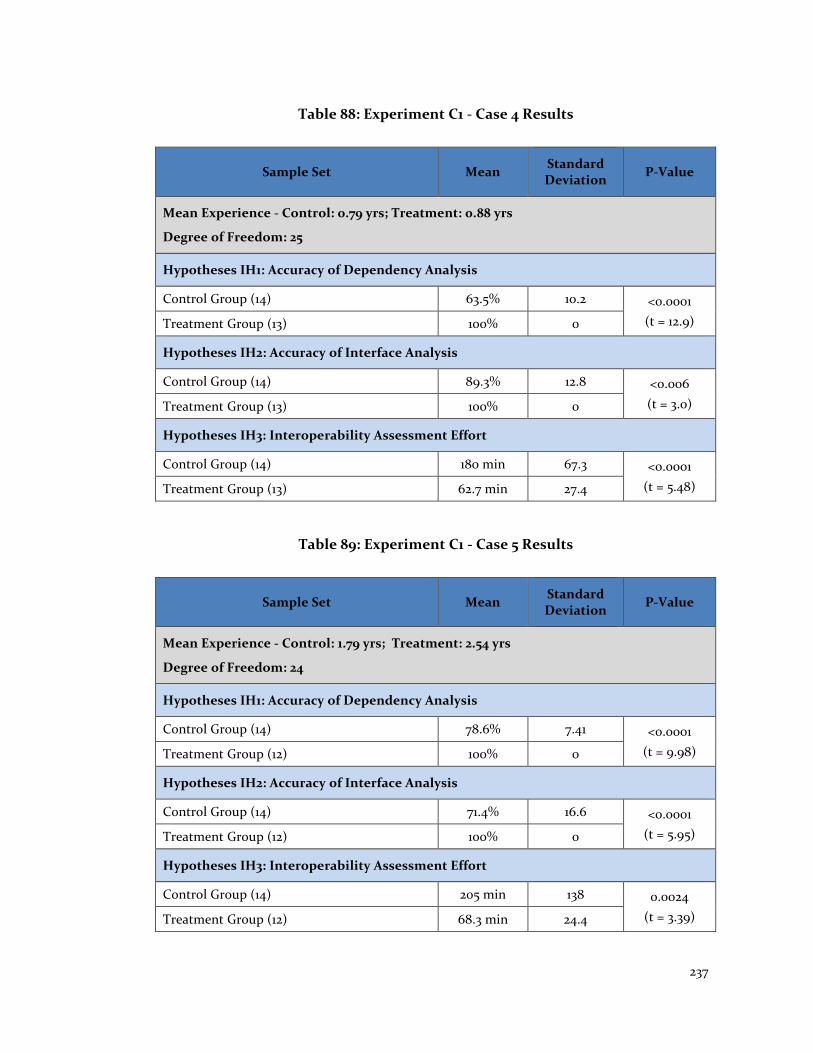
237
Table 88: Experiment C1 - Case 4 Results
Sample Set Mean Standard Deviation
P-Value
Mean Experience - Control: 0.79 yrs; Treatment: 0.88 yrs
Degree of Freedom: 25
Hypotheses IH1: Accuracy of Dependency Analysis
Control Group (14) 63.5% 10.2 <0.0001
(t = 12.9) Treatment Group (13) 100% 0
Hypotheses IH2: Accuracy of Interface Analysis
Control Group (14) 89.3% 12.8 <0.006
(t = 3.0) Treatment Group (13) 100% 0
Hypotheses IH3: Interoperability Assessment Effort
Control Group (14) 180 min 67.3 <0.0001
(t = 5.48) Treatment Group (13) 62.7 min 27.4
Table 89: Experiment C1 - Case 5 Results
Sample Set Mean Standard Deviation
P-Value
Mean Experience - Control: 1.79 yrs; Treatment: 2.54 yrs
Degree of Freedom: 24
Hypotheses IH1: Accuracy of Dependency Analysis
Control Group (14) 78.6% 7.41 <0.0001
(t = 9.98) Treatment Group (12) 100% 0
Hypotheses IH2: Accuracy of Interface Analysis
Control Group (14) 71.4% 16.6 <0.0001
(t = 5.95) Treatment Group (12) 100% 0
Hypotheses IH3: Interoperability Assessment Effort
Control Group (14) 205 min 138 0.0024
(t = 3.39) Treatment Group (12) 68.3 min 24.4
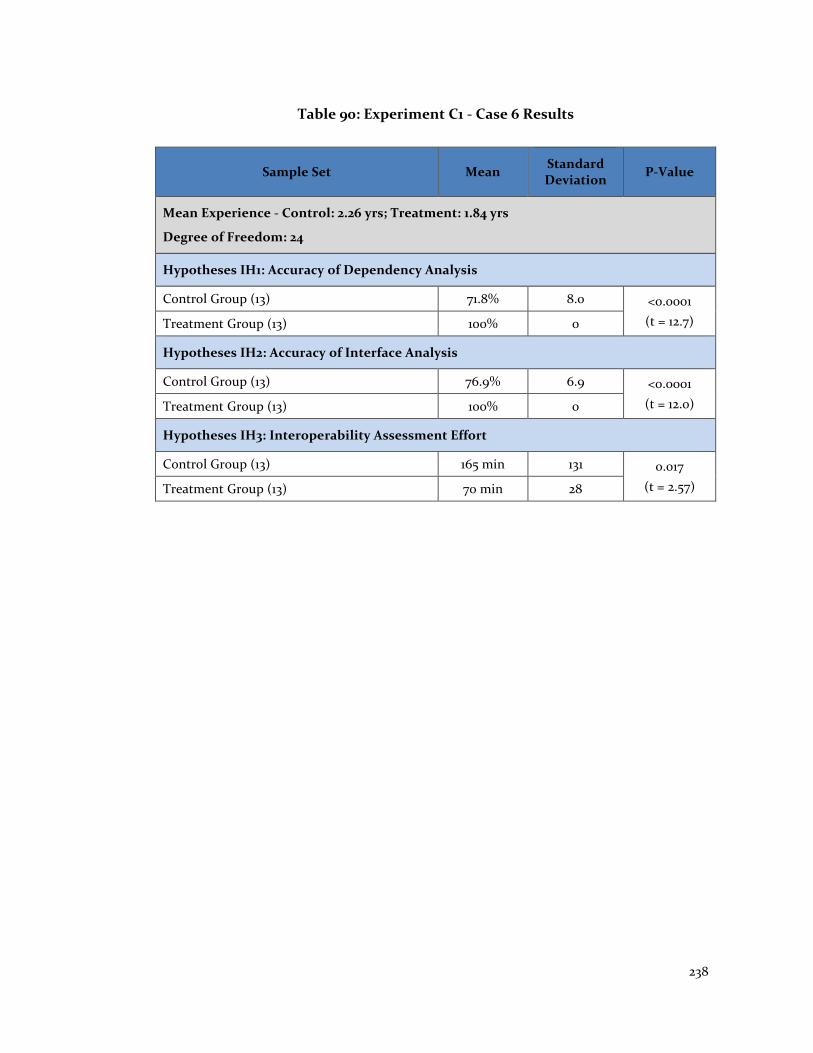
238
Table 90: Experiment C1 - Case 6 Results
Sample Set Mean Standard Deviation
P-Value
Mean Experience - Control: 2.26 yrs; Treatment: 1.84 yrs
Degree of Freedom: 24
Hypotheses IH1: Accuracy of Dependency Analysis
Control Group (13) 71.8% 8.0 <0.0001
(t = 12.7) Treatment Group (13) 100% 0
Hypotheses IH2: Accuracy of Interface Analysis
Control Group (13) 76.9% 6.9 <0.0001
(t = 12.0) Treatment Group (13) 100% 0
Hypotheses IH3: Interoperability Assessment Effort
Control Group (13) 165 min 131 0.017
(t = 2.57) Treatment Group (13) 70 min 28
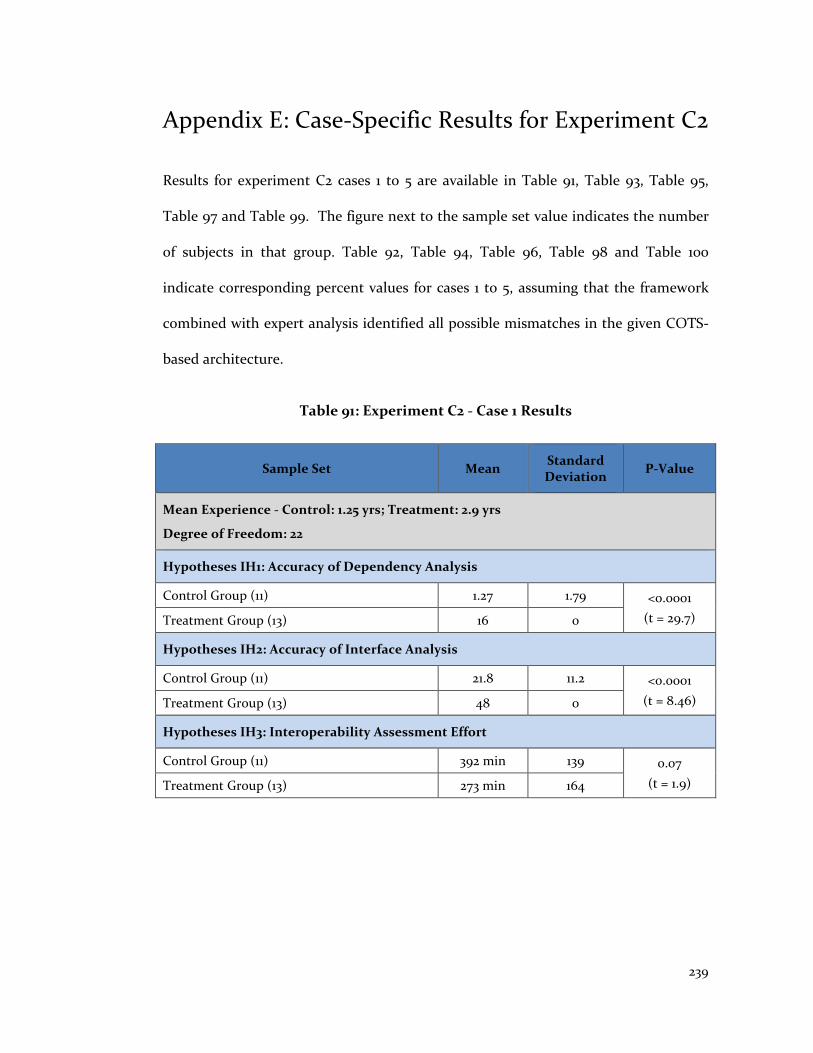
239
Appendix E: Case-Specific Results for Experiment C2
Results for experiment C2 cases 1 to 5 are available in Table 91, Table 93, Table 95,
Table 97 and Table 99. The figure next to the sample set value indicates the number
of subjects in that group. Table 92, Table 94, Table 96, Table 98 and Table 100
indicate corresponding percent values for cases 1 to 5, assuming that the framework
combined with expert analysis identified all possible mismatches in the given COTS-
based architecture.
Table 91: Experiment C2 - Case 1 Results
Sample Set Mean Standard Deviation
P-Value
Mean Experience - Control: 1.25 yrs; Treatment: 2.9 yrs
Degree of Freedom: 22
Hypotheses IH1: Accuracy of Dependency Analysis
Control Group (11) 1.27 1.79 <0.0001
(t = 29.7) Treatment Group (13) 16 0
Hypotheses IH2: Accuracy of Interface Analysis
Control Group (11) 21.8 11.2 <0.0001
(t = 8.46) Treatment Group (13) 48 0
Hypotheses IH3: Interoperability Assessment Effort
Control Group (11) 392 min 139 0.07
(t = 1.9) Treatment Group (13) 273 min 164

240
Table 92: Experiment C2 - Case 1 Percentage Results
Sample Set Mean Standard Deviation
P-Value
Mean Experience - Control: 1.25 yrs; Treatment: 2.9 yrs
Degree of Freedom: 22
Hypotheses IH1: Accuracy of Dependency Analysis
Control Group (11) 7.95% 11.2 <0.0001
(t = 29.7) Treatment Group (13) 100% 0
Hypotheses IH2: Accuracy of Interface Analysis
Control Group (11) 43.6% 22.4 <0.0001
(t = 8.46) Treatment Group (13) 96% 0
Hypotheses IH3: Interoperability Assessment Effort
Control Group (11) 392 min 139 0.07
(t = 1.9) Treatment Group (13) 273 min 164
Table 93: Experiment C2 - Case 2 Results
Sample Set Mean Standard Deviation
P-Value
Mean Experience - Control: 1.4 yrs; Treatment: 4.4 yrs
Degree of Freedom: 22
Hypotheses IH1: Accuracy of Dependency Analysis
Control Group (11) 2.27 3.13 <0.0001
(t = 18.2) Treatment Group (13) 18 0
Hypotheses IH2: Accuracy of Interface Analysis
Control Group (11) 18.1 27 0.0044
(t = 3.18) Treatment Group (13) 27 0
Hypotheses IH3: Interoperability Assessment Effort
Control Group (11) 430 min 224 0.054
(t = 2.03) Treatment Group (13) 255min 150

241
Table 94: Experiment C2 - Case 2 Percentage Results
Sample Set Mean Standard Deviation
P-Value
Mean Experience - Control: 1.4 yrs; Treatment: 4.4 yrs
Degree of Freedom: 22
Hypotheses IH1: Accuracy of Dependency Analysis
Control Group (11) 12.6% 17.4 <0.0001
(t = 18.2) Treatment Group (13) 100% 0
Hypotheses IH2: Accuracy of Interface Analysis
Control Group (11) 60.3% 33.8 0.0044
(t = 3.18) Treatment Group (13) 90% 0
Hypotheses IH3: Interoperability Assessment Effort
Control Group (11) 430 min 224 0.054
(t = 2.03) Treatment Group (13) 255min 150
Table 95: Experiment C2 - Case 3 Results
Sample Set Mean Standard Deviation
P-Value
Mean Experience - Control: 2.2 yrs; Treatment: 1.6 yrs
Degree of Freedom: 18
Hypotheses IH1: Accuracy of Dependency Analysis
Control Group (12) 2 2.49 <0.0001
(t = 18) Treatment Group (8) 18 0
Hypotheses IH2: Accuracy of Interface Analysis
Control Group (12) 14.9 7.83 <0.0001
(t = 5.04) Treatment Group (8) 29 0
Hypotheses IH3: Interoperability Assessment Effort
Control Group (12) 475 min 247 0.0028
(t = 3.45) Treatment Group (8) 158 min 91.1

242
Table 96: Experiment C2 - Case 3 Percentage Results
Sample Set Mean Standard Deviation
P-Value
Mean Experience - Control: 2.2 yrs; Treatment: 1.6 yrs
Degree of Freedom: 18
Hypotheses IH1: Accuracy of Dependency Analysis
Control Group (12) 11.1% 13.8 <0.0001
(t = 18) Treatment Group (8) 100% 0
Hypotheses IH2: Accuracy of Interface Analysis
Control Group (12) 51.4% 27 <0.0001
(t = 5.04) Treatment Group (8) 100% 0
Hypotheses IH3: Interoperability Assessment Effort
Control Group (12) 475 min 247 0.0028
(t = 3.45) Treatment Group (8) 158 min 91.1
Table 97: Experiment C2 - Case 4 Results
Sample Set Mean Standard Deviation
P-Value
Mean Experience - Control: 2.3 yrs; Treatment: 1.7 yrs
Degree of Freedom: 23
Hypotheses IH1: Accuracy of Dependency Analysis
Control Group (13) 0.769 1.36 <0.0001
(t = 41.2) Treatment Group (12) 17 0
Hypotheses IH2: Accuracy of Interface Analysis
Control Group (13) 13.4 10.7 <0.0001
(t = 10.3) Treatment Group (12) 45 0
Hypotheses IH3: Interoperability Assessment Effort
Control Group (13) 440 min 184 0.0006
(t = 4.0) Treatment Group (12) 192 min 192

243
Table 98: Experiment C2 - Case 4 Percentage Results
Sample Set Mean Standard Deviation
P-Value
Mean Experience - Control: 2.3 yrs; Treatment: 1.7 yrs
Degree of Freedom: 23
Hypotheses IH1: Accuracy of Dependency Analysis
Control Group (13) 4.52% 8.02 <0.0001
(t = 41.2) Treatment Group (12) 100% 0
Hypotheses IH2: Accuracy of Interface Analysis
Control Group (13) 29.7% 23.7% <0.0001
(t = 10.3) Treatment Group (12) 100% 0
Hypotheses IH3: Interoperability Assessment Effort
Control Group (13) 440 min 184 0.0006
(t = 4.0) Treatment Group (12) 192 min 192
Table 99: Experiment C2 - Case 5 Results
Sample Set Mean Standard Deviation
P-Value
Mean Experience - Control: 1.5 yrs; Treatment: 2.1 yrs
Degree of Freedom: 20
Hypotheses IH1: Accuracy of Dependency Analysis
Control Group (10) 2.9 3.38 <0.0001
(t = 14.5) Treatment Group (12) 17 0
Hypotheses IH2: Accuracy of Interface Analysis
Control Group (10) 10.9 13.3 <0.0001
(t = 7.85) Treatment Group (12) 41 0
Hypotheses IH3: Interoperability Assessment Effort
Control Group (10) 320 min 197 0.87
(t = 0.166) Treatment Group (12) 308 min 116
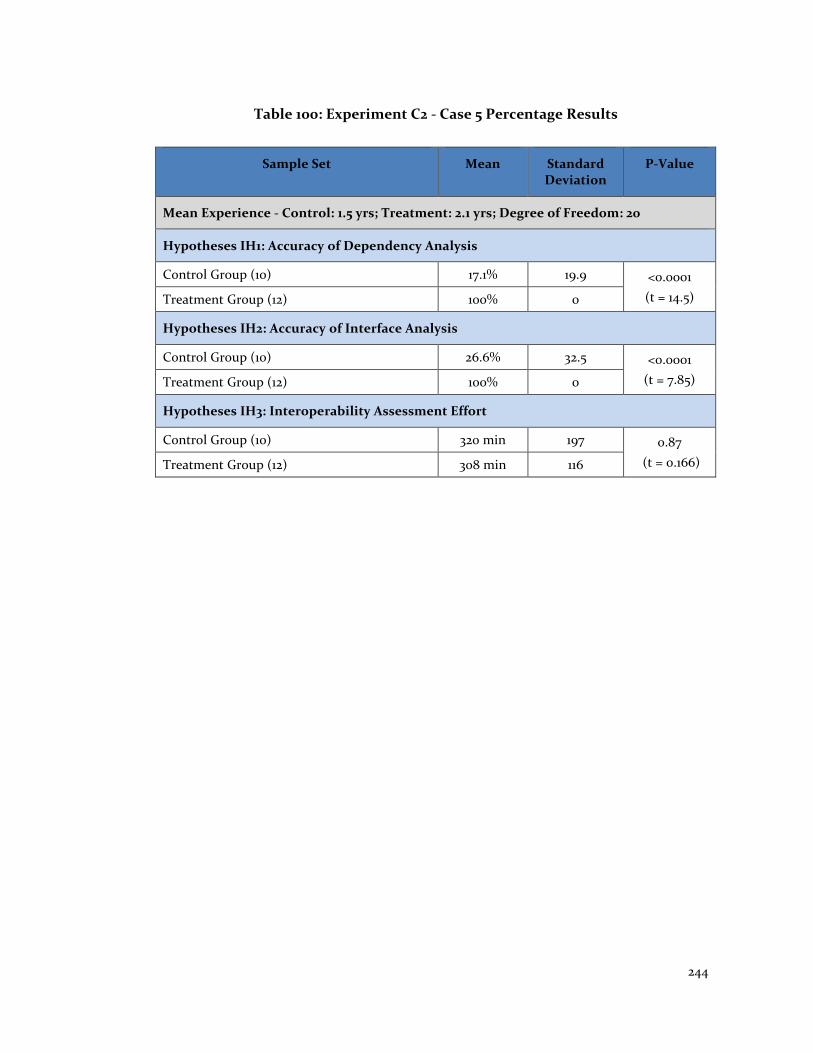
244
Table 100: Experiment C2 - Case 5 Percentage Results
Sample Set Mean Standard Deviation
P-Value
Mean Experience - Control: 1.5 yrs; Treatment: 2.1 yrs; Degree of Freedom: 20
Hypotheses IH1: Accuracy of Dependency Analysis
Control Group (10) 17.1% 19.9 <0.0001
(t = 14.5) Treatment Group (12) 100% 0
Hypotheses IH2: Accuracy of Interface Analysis
Control Group (10) 26.6% 32.5 <0.0001
(t = 7.85) Treatment Group (12) 100% 0
Hypotheses IH3: Interoperability Assessment Effort
Control Group (10) 320 min 197 0.87
(t = 0.166) Treatment Group (12) 308 min 116