a fair ride - an investigation into the fare anomalies of
TRANSCRIPT


1
Acknowledgments I wish to acknowledge the traditional custodians of the land, the Brayakaulung people of the Gunai nation and their Elders past and present. I acknowledge and respect their continuing culture and the contribution they make to the life of the Latrobe region. The author would like to thank all of the people that assisted in the production of this report. In particular, I would like to thank Russell Northe and his Parliamentary Advisor Helen O’Brien for their constant support and encouragement throughout the duration of the investigation. I would also like to thank Paul Strangio, Nick Economou, Zareh Ghazarian and Lea Campbell for their guidance and effort in coordinating the Victorian Parliamentary Internship throughout the COVID-19 pandemic.
Jack Hunt
Monash University
Russell Northe MP
Electorate of Morwell
June 2020
Disclaimer: This report is not an official report of the Parliament of Victoria. Parliamentary Intern Reports are prepared by political science students as part of the requirements for the Victorian Parliamentary Internship Program. The Program is jointly coordinated by the Department of Parliamentary Services through the Parliamentary Library & Information Service, the People Operations Unit and participating Victorian universities. The views expressed in this report are those of the author.
© 2020 Jack Hunt
Victorian Parliamentary Intern Reports are released under a Creative Commons 3.0 Attribution-NonCommercial-NoDerivs licence. By using this Creative Commons licence, you are free to share - to copy, distribute and transmit the work under the following conditions:
§ Attribution - You must attribute the work in the manner specified by the author or licensor (but not in any way that suggests that they endorse you or your use of the work).
§ Non-Commercial - You may not use this work for commercial purposes without the author's permission.
§ No Derivative Works - You may not alter, transform, or build upon this work without the author's permission.

2
Executive Summary
Equal access to affordable public transport is an important indicator of an equitable society. The
fare structure that a public transport network utilises can have a significant impact on the
amount commuters are paying to access their public transport network. Moreover, fare
structures can create inequitable outcomes for commuters.
This report examines the case of the Latrobe City Local Government Area (LGA) and its
residents’ access to the myki public transport system. Fare anomalies in Latrobe’s myki ticketing
system have been reported, with the result being that local commuters are paying more to
utilise their public transport network. This report uses publicly available data to analyse the
extent to which these anomalies exist and to assess the impact that these anomalies are having
on local commuters.
Based on the findings of this report, it is clear that there are some fare anomalies in Latrobe that
are the result of the zone-based fare structure of the myki ticketing system. To assist Latrobe
commuters in getting more equitable public transport outcomes, this report recommends the
following:
1. The Department of Transport conduct an inquiry into fare anomalies in the myki
ticketing system. This inquiry would provide a comprehensive analysis of the extent to
which fare anomalies exist across the entire myki public transport system, while also
providing costed recommendations about how to alleviate these anomalies.
2. Public Transport Victoria (PTV) conduct cost analyses of implementing changes to the
myki ticketing system in Latrobe. These changes would include student access to the
Regional Student Pass and free weekend travel for eligible commuters across the entire
myki network.
Implementation of both of these recommendations would assist in alleviating poor public
transport outcomes in Latrobe while addressing wider fare anomalies across the myki ticketing
system.

3
Table of Contents
Glossary................................................................................................................................... 5 1. Introduction ........................................................................................................................ 6
1.1 Aim of Report ........................................................................................................ 6 1.2 Method and Structure ........................................................................................... 6 1.3 Limitations ............................................................................................................. 7
2. Latrobe Community Profile ................................................................................................. 8
2.1 Levels of Disadvantage in Latrobe ......................................................................... 8 2.2 Access to and Use of Public Transport in Latrobe ................................................. 9
3. The Benefits of Affordable Public Transport ..................................................................... 13
3.1 The Benefits of Public Transport on Regional Development ............................... 13 3.2 The Benefits of Public Transport on Health and Well-Being ............................... 14
4. The Cost Structure of the myki Public Transport System .................................................. 17
4.1 The Origin of the myki Ticketing System ............................................................. 17 4.2 The Cost Structure of the myki Ticketing System ................................................ 18
4.2.1 Zone-Based Fare Structures .................................................................. 18 4.2.2 myki Money .......................................................................................... 21 4.2.3 myki Pass .............................................................................................. 22 4.2.4 Bus Fares ............................................................................................... 23 4.2.5 Concessions and Entitlements .............................................................. 24
5. The Cost Structure of myki in the Latrobe City LGA .......................................................... 26
5.1 The Gippsland Line .............................................................................................. 26 5.2 Anomalies of myki’s Zone-Based Fare Structure in Latrobe ............................... 27 5.3 Anomalies in Free Weekend Travel Entitlements in Latrobe .............................. 29

4
5.4 Anomalies in Access to Regional Student Passes in Latrobe ............................... 31 5.5 Impact of These Anomalies on Latrobe Commuters ........................................... 33
6. Recommendations and Conclusion ................................................................................... 36
6.1 Exploring Alternative Fare Structures for the myki Ticketing System ................. 36 6.2 Inquiry into Fare Anomalies in the myki Ticketing System .................................. 38 6.3 Reforms to the myki Ticketing System in Latrobe ............................................... 40 6.4 Conclusion ........................................................................................................... 41
References ............................................................................................................................. 42

5
Glossary
Local Government Area (LGA) - Defined by the Victorian Electoral Commission and refers
to the boundaries of the 79 local councils in Victoria.1 Each LGA is governed by a local
council which provides administrative functions to the local population. The LGA that
represents residents of the Latrobe region is the Latrobe City LGA.2
Department of Transport - Created on July 1 2019 under relevant statutory instruments
under the Transport Integration Act 2010 and the Public Administration Act 2004.3 The
ticketing and fare conditions of Victoria’s public transport system are set by the Department
of Transport under the brand name of Public Transport Victoria.4
Public Transport Victoria (PTV) - Public Transport Victoria is the brand name for public
transport operated in Victoria. It was previously a statutory authority that was responsible
for providing, coordinating and promoting public transport across the state. However, as of
July 1 2019, the statutory functions of PTV were transferred to the Department of
Transport.5
myki - The ticketing system that PTV utilises to collect fares across Victoria’s public
transport network. myki also refers to the smart-card that allows users to access this
network by paying a monetary amount that has been loaded onto their smart-card.6
1 “Local Council Profiles,” Victorian Electoral Commission, 2019, https://www.vec.vic.gov.au/ElectoralBoundaries/CouncilProfiles.html. 2 “Latrobe Profile,” Victorian Electoral Commission, 2014, https://www.vec.vic.gov.au/ElectoralBoundaries/LatrobeProfile.html. 3 “Governance,” Department of Transport, 2020, https://transport.vic.gov.au/about/governance. 4 “Fees, Fines and Charges,” Department of Transport, 2020, https://transport.vic.gov.au/about/fees-fines-and-charges. 5 “Our Role,” Public Transport Victoria, 2020, https://www.ptv.vic.gov.au/footer/about-ptv/our-role-and-governance/. 6 “myki,” Public Transport Victoria, 2020, https://www.ptv.vic.gov.au/tickets/myki/.

6
1. Introduction
Affordable public transport provides economic and social benefits to society.7 These
benefits include: access to employment and services, increased social cohesion and
improved health outcomes.8 However, access to affordable public transport is not
distributed evenly across Victoria.
This is particularly the case in Latrobe, where a number of fare anomalies result in local
commuters paying more than their regional and metropolitan counterparts to travel similar
or higher distances. These inequitable outcomes are a result of the zone-based fare
structure of PTV network.
1.1 Aim of Report
This report will provide an overview of the fare anomalies in the cost structure of the myki
ticketing system in Latrobe. In outlining these anomalies, this report will evaluate:
§ The benefits of access to affordable public transport.
§ The zone-based fare structure of the myki ticketing system.
§ How fares are calculated in the myki ticketing system.
§ The cost of utilising the myki public transport system in Latrobe.
§ The impact of this system on Latrobe commuters.
1.2 Method and Structure
This report primarily utilises publicly available data from PTV to outline how the myki
ticketing system operates. In particular, this report utilises PTV’s online fare calculator, fare
information from the PTV website and PTV’s Victorian Ticketing Conditions to compare fares
7 Tourism and Transport Forum, The Benefits of Public Transport (Sydney, Australia: Tourism and Transport Forum, 2010), 1, https://www.ttf.org.au/wp-content/uploads/2016/06/TTF-The-Benefits-Of-Public-Transport-2010.pdf. 8 Tourism and Transport Forum, The Benefits of Public Transport, 2-4.

7
across different localities in Victoria. Comparisons will primarily be made to the regional
LGAs of Ballarat City, Greater Bendigo and Greater Geelong. Public transport literature is
also examined to provide background context to and analysis of the issues raised in this
report.
Various sets of data have been utilised to construct a community profile of Latrobe, with
levels of disadvantage and public transport outcomes being key indicators. Interviews have
also been conducted with Latrobe residents to provide a community perspective on the
issues outlined in this report.
1.3 Limitations
The primary limitation of this report was a lack of community awareness about the fare
anomalies in Latrobe. Therefore, assessing the impact of these anomalies on Latrobe
commuters was difficult.
There is also a gap in the available PTV data and public transport literature regarding how
fare anomalies in zone-based fare structures can create inequitable outcomes for
commuters. This is particularly the case where micro-data of specific localities is
unavailable.
COVID-19 restrictions on movement prevented this data from being collected via survey.
These restrictions also prevented a first-hand assessment of the myki public transport
system in Latrobe. Therefore, this report is based on publicly available data.

8
2. Latrobe Community Profile
Latrobe constitutes a regional hub made up of the population centres of Traralgon, Moe,
Morwell and several other towns. It is the principle service centre for the Gippsland region
and includes the regional headquarters for significant government and private
organisations, and educational and health services.9 Latrobe is the primary generator of
Victoria’s electricity, with other major industries being coal mining, timber processing, paper
manufacturing and the provision of services to the Gippsland region.
2.1 Level of Disadvantage in Latrobe
When compared to other regional hubs such as Ballarat, Bendigo and Geelong, economic
and social indicators are less consistent in Latrobe. In particular, Latrobe has relatively poor
economic and social outcomes compared to the Victorian average.10 For example, Latrobe is
the seventh most disadvantaged LGA in Victoria according to the SEIFA ISRAD indicator, with
high disadvantage being present at the SA1 level in Moe, Morwell and Traralgon.11 The
‘Dropping Off The Edge’ Index also considers these three towns as among the most
disadvantaged locations in Victoria, with Morwell being within the Band 1 of locations that
experience the most severe disadvantage.12 This level of disadvantage correlates with
Latrobe having poor youth engagement, population health and economic outcomes.13
The higher relative disadvantage in Latrobe is partly driven by longer term structural
adjustment associated with the decline of key industries in the region, including mining,
electricity and gas services.14 The structure of the economy in Latrobe and its reliance on
9 “Latrobe City,” Know Your Council, 2015, https://knowyourcouncil.vic.gov.au/councils/latrobe. 10 Aither, Gippsland Regional Profile : An Analysis of Regional Strengths and Challenges (Melbourne, Australia: Aither Pty Ltd., 2019), 16, https://www.infrastructurevictoria.com.au/wp-content/uploads/2019/04/Aither-Gippsland-Regional-Profile-March-2019.pdf. 11 Australian Bureau of Statistics, Census of Population and Housing: Socio-Economic Indexes for Areas (SEIFA), Australia, Cat. no. 2033.0.55.001 (Canberra, ACT, 2018), https://www.abs.gov.au/AUSSTATS/[email protected]/DetailsPage/2033.0.55.0012016?OpenDocument. 12 “Dropping off the Edge 2015,” Jesuit Social Services and Catholic Services Australia, 2015, https://dote.org.au/findings/victoria/. 13 Aither, Gippsland Regional Profile, 17. 14 Ibid, 56-57.

9
coal mining and electricity generation means it is exposed to drivers of change affecting
these key industries.15 There are a number of poor social outcomes in the region, such as
high levels of unemployment, which may worsen as a result of these structural changes.16
These drivers of change have also contributed to out-migration in and around Latrobe.17
Despite Victoria’s population set to increase by approximately 1.5% per annum until 2056,
Latrobe is only set to experience an average growth rate of 0.6% per annum.18 When
compared to other regional hubs such as Ballarat, Bendigo and Geelong, the rate of growth
in Latrobe is significantly less.19 These factors suggest that Latrobe is not experiencing the
economic development and population growth that other regional hubs are. Furthermore,
many residents of Latrobe are facing higher levels of disadvantage than their counterparts
in these regional hubs.
2.2 Access to and Use of Public Transport in Latrobe
Access to public transport across the Gippsland region is substantially lower than the State
average.20 When referring to access to public transport in Victoria, it is generally defined as
the percentage of the population that lives within 400 metres of a bus and/or tram stop
and/or 800 metres of a train station.21 While Latrobe has the highest levels of access across
the region, it is still below the Victorian average. Figure 1 highlights the relative lack of
15 ABC Gippsland, “Hazelwood closure: Morwell residents nervous about a future without power plant,” ABC News, November 3, 2016. https://www.abc.net.au/news/2016-11-03/hazelwood-closure-morwell-community-reaction/7942220. 16“Economy Profile,” Latrobe City Council, 2019, https://app.remplan.com.au/latrobe/economy/trends/unemployment. Unemployment in Latrobe has varied between 11.2% and 5.1% over the past four years. 17 Aither, Gippsland Regional Profile, 25. 18 The Department of Environment, Land, Water and Planning, Victoria in the Future 2019 : Population Projections 2016 to 2056 (Melbourne, Victoria, 2019), 13-14, https://www.planning.vic.gov.au/__data/assets/pdf_file/0032/332996/Victoria_in_Future_2019.pdf. 19 Victoria in the Future 2019, 13-14. Ballarat is set to experience 1.7% growth per annum, Bendigo 1.6% per annum and Geelong 2% per annum. 20 Department of Health and Human Services, Geographical Profiles and Planning Products (Melbourne, Victoria, 2015) https://www2.health.vic.gov.au/about/reporting-planning-data/gis-and-planning-products/geographical-profiles. 21 Infrastructure Australia, Urban Transport Strategy: December 2013 (Canberra, ACT, 2013), 29, https://www.infrastructureaustralia.gov.au/sites/default/files/2019-06/infrastructureaus_rep_urbanstrategy.pdf.

10
access to public transport that Latrobe residents have when compared to other regional
LGAs and Victoria at large.
Figure 1: Access to Public Transport Across Regional LGAs22
Rates of use of public transport are also lower in Latrobe and other regional LGAs than
across Victoria at large. Figure 2 highlights the lower relative use of public transport to
travel to work in Latrobe.
22 Geographical Profiles and Planning Products. Compiled by author.

11
Figure 2: Percentage of People Who Travel to Work by Public Transport Across Regional LGAs23
These figures demonstrate that Latrobe has low rates of access to and usage of public
transport when compared to similar regional centres and the Victorian average. However,
these figures also suggest that these indicators are generally lower across regional Victoria.
Despite these relatively low rates of public transport access and usage across regional
Victoria, V/line patronage has more than doubled in the last decade.24 However, according
to the most recent V/Line Annual Report, significant patronage was recorded across all
major regional lines except for the Gippsland line, which recorded a significant decrease in
23 Australian Bureau of Statistics, 2016 Census Quickstats (Canberra, ACT, 2019), https://www.abs.gov.au/websitedbs/D3310114.nsf/Home/2016%20QuickStats. Compiled by author. 24 Rail Futures Institute, Introducing InterCity: How Regional Rail Can Re-Balance Population Growth and Create a "State of Cities" in Victoria (Melbourne, Victoria, 2016), 6, https://cur.org.au/cms/wp-content/uploads/2016/08/160804-regional-rail-paper-v14-1-11-final-for-printing-1.pdf.

12
patronage.25 Figure 3 outlines the percentage increase of patronage across the Geelong,
Ballarat, Bendigo and Seymour lines, and the decrease in patronage on the Gippsland line -
referred to here as Traralgon.
Figure 3: Change in Patronage Across V/Line Train Passenger Trips 2014-15 to 2018-1926
When considered alongside Figures 1 and 2, Figure 3 suggests that not only are rates of
access to and use of public transport lower in Latrobe, but that V/Line use is decreasing in
Latrobe.27 The combination of these statistics outline how Latrobe has poorer public
transport outcomes than other regional hubs and Victoria at large. This can contribute to
the existing levels of disadvantage in areas like Latrobe that have poor social and economic
indicators.
25 V/Line Corporation, Annual Report 2018-2019 (Melbourne, Victoria, 2019), 12, https://corporate.vline.com.au/getattachment/78d7f8ef-8892-4a48-93ef-df296f7c749a/Annual-Report-2018-19. 26 V/Line Corporation, Annual Report 2018-2019, 12. 27 Ibid, 13.

13
3. The Benefits of Affordable Public Transport
Modern economic and social life is dependent upon the availability of reliable, accessible
and affordable forms of transport.28 This availability extends to public transport, with access
to affordable public transport having economic and health benefits for regional centres such
as Latrobe.
3.1 The Benefits of Public Transport on Regional Development
Infrastructure Victoria describes the transport system as being about connectivity, with
education, health and essential services being reliant on Victoria’s transport network.29 The
connectivity that transport networks foster has a limited but important role in alleviating
regional disadvantage by improving access to economic resources and services, to education
and health resources, and to social capital building resources.30
Geographic disadvantage is particularly pronounced in regional centres such as Latrobe,
with many in regional Victoria lacking access to services and resources because of
distance.31 This geographic disadvantage compounds poor outcomes for those already living
in poverty, and some regional areas may remain disadvantaged because of their lack of
access to resources and increasing rates of out-migration.32
Access to affordable public transport can help to alleviate this by offering access to services
and resources that would otherwise be inaccessible.33 Rail in particular provides an effective
28 Centre for Primary Health Care and Equity, A Review of the Evidence of the Impact of Public Transport on Population Health in Australia (Sydney, New South Wales, 2009), 4, http://hiaconnect.edu.au/old/files/Impact_of_Public_Transport_on%20Health_in_Australia.pdf. 29 Infrastructure Australia, Victoria’s 30-Year Infrastructure Strategy (Victoria, Melbourne, 2016), 42, https://www.infrastructurevictoria.com.au/wp-content/uploads/2019/03/IV_30_Year_Strategy_WEB_V2.pdf. 30 Freelance Strategy, The Role of Infrastructure in Addressing Regional Disadvantage (Victoria, Melbourne, 2019), 4-5, https://www.infrastructurevictoria.com.au/wp-content/uploads/2019/11/Background-paper_The-role-of-infrastructure-in-addressing-regional-disadvantage.pdf. 31 Freelance Strategy, The Role of Infrastructure, 9. 32 Ibid, 14. 33 Christoffel Venter, "Transport Expenditure and Affordability: The Cost of Being Mobile," Development Southern Africa 28, no. 1 (2011): 5, https://www.tandfonline.com/doi/abs/10.1080/0376835X.2011.545174.

14
tool for redirecting population growth and services to regional centres.34 Access to a
regional rail network that is affordable and reliable can provide access to affordable housing
and jobs and help to distribute economic and social benefits across regional Victoria.35
The role of public transport becomes very important for regional centres experiencing
economic transition such as Latrobe, with people moving to jobs that may be in different
locations.36 As jobs in the energy sector decline in Latrobe, employees may need to secure
jobs in other industries in the broader Gippsland region or in metropolitan Melbourne. To
gain access to these jobs, an affordable and reliable public transport service is essential.37
3.2 The Benefits of Public Transport on Health and Well-Being
Access to affordable public transport is also vital in enabling people and communities to
build and maintain social networks, with this being especially important in regional centres
such as Latrobe.38 The potential health benefits of public transport are created through the
access it provides to the resources and services needed for good health.39 Public transport is
also a key factor in social inclusion, with this being defined as the ability of an individual to
access economic and employment opportunities; education and healthcare services; and
leisure, sporting and social activities.40
Most public transport is provided in central business district areas and generally benefits
higher income earners more than lower income earners.41 In contrast, low-income earners,
the unemployed, the elderly and people with a disability are particularly at risk of social
34 Rail Futures Institute, Introducing InterCity, 6. 35 Ibid, 6. 36 Committee for Gippsland, Our Region Our Future : Securing an Economic Future for Gippsland and Latrobe Valley, (Warragul, Victoria, 2016), 82, https://www.committeeforgippsland.com.au/policy-and-research/. 37 Ibid. 38 Centre for Primary Health Care and Equity, A Review of the Evidence of the Impact of Public Transport, 4. 39 Ibid, 11. 40 Tourism and Transport Forum, The Benefits of Public Transport, 3. 41 John B. Cox, “Public Transport Trends - Efficiency and Equity Considerations,” Road and Transport Research 16, no.3 (2007): 41-55.

15
isolation as a result of poor transport options.42 Because they are more likely to live in
regional areas, many of these groups have limited access to affordable public transport.43
Unequal access to public transport services thus exacerbates social exclusion.44 Improving
access to affordable public transport is necessary to achieve social equality, as this access
ultimately leads to increased access to employment, education, health and community
services.45
These sentiments were reflected in an interview conducted with the Latrobe City Health
Advocate, Jane Anderson.46 Regarding how public transport and determinants of health are
related, Ms Anderson suggested that there is a very strong link between accessing
affordable public transport and health and well-being outcomes.47 According to Ms
Anderson, access to affordable public transport is ‘vitally important for people to be active
participants in society’ and that this is especially the case in a disadvantaged area such as
Latrobe.48
‘Public transport gives people the
opportunity to be involved in society.’
Jane Anderson.49
42 Tourism and Transport Forum, The Benefits of Public Transport, 3. 43 James S. Corcoran, E.L. James and J.M. Ellis, "Do Elderly Victorians in Rural Areas Have Access to Public Transport?" Road and Transport Research 14, no. 1 (2005): 38-43. 44 Tourism and Transport Forum, The Benefits of Public Transport, 4. 45 Christoffel Venter, "Transport Expenditure and Affordability: The Cost of Being Mobile," Development Southern Africa 28, no. 1 (2011): 2, https://www.tandfonline.com/doi/abs/10.1080/0376835X.2011.545174. 46 Jane Anderson, interviewed by Jack Hunt (Melbourne, Victoria, 01 May, 2020). Ms Anderson’s role is to act as an advocate to the Victorian Government for the health and well-being of Latrobe residents. She conducts various meetings with community members and has produced a variety of reports about the determinants of health in Latrobe. 47 Anderson, Interview. 48 Ibid. 49 Ibid.

16
Therefore, economic and health determinants are both dependent on public transport
networks in regional Victoria. When considering that Latrobe is a regional area with lower
social and economic indicators, it is clear that any discrepancies in the cost of public
transport will generally disadvantage Latrobe commuters more than commuters in other
parts of the State.

17
4. The Cost Structure of the myki Public Transport System
An explanation of the general myki ticketing system will be provided before discussing the
cost structure of the myki public transport system in Latrobe.
4.1 Origin of the myki Ticketing System
In 2005, the Victorian Government entered into a contract to develop a smartcard public
transport ticketing system to replace the Metcard system. This resulted in the creation of
the myki ticketing system.50 Figure 4 shows the myki smart card that is used when accessing
the public transport network.
Figure 4: myki Smart Card51
The myki ticketing system uses smart-card technology for network access. These myki cards
are used to pay for travel on public transport, with the smart-card technology enabling a
money value to be stored on the card. Public transport users ‘top up’ with myki money, with
50 Victorian Auditor General, Operational Effectiveness of the myki Ticketing System (Melbourne, Victoria, 2015), 2, https://www.audit.vic.gov.au/sites/default/files/20150610-myki.pdf. 51 “myki,” Metro Trains Melbourne, 2020, https://www.metrotrains.com.au/tickets-2/.

18
a topped-up myki providing users with a valid ticket that allows them to travel around the
network.52
After a user has ‘touched on’ and ‘touched off’ at the beginning and end of their journey,
the myki system automatically calculates the cost of the user’s trip and deducts the lowest
fare for the travel taken.53 This fare validation is done by a device at a station, stop or
onboard a bus or tram. These devices read and translate information stored on smart cards
and transmit information to and from the myki office.54
4.2 The Cost Structure of the myki Ticketing System
To calculate the cost of a myki fare, the myki ticketing system calculates both the number of
zones travelled through by the user and the time taken to complete the journey. The
amount a customer will be charged also depends on the type of myki used and whether any
concessions or entitlements have been applied.55
4.2.1 Zone-Based Fare Structures
The global trend for fare structures is toward simplification, with an increasing number of
public transport networks moving towards zone-based structures, flat fare structures and
free fare structures.56 Victoria is no exception to this trend, with the myki ticketing system
utilising a zone-based fare structure, while incorporating some flat fares and free fares.57
52 Public Transport Victoria, Annual Report 2018-2019 (Melbourne, Victoria, 2019), 22, https://www.ptv.vic.gov.au/assets/default-site/footer/data-and-reporting/annual-report/6b8c2cff5a/PTVH4043-Annual_Report_2019-A4-v1_ONLINE.pdf. 53 Ibid, 22. 54 Victorian Auditor General, Operational Effectiveness of the myki Ticketing System, 2. 55 Public Transport Victoria, Victorian Fares and Ticketing Conditions 2020 (Melbourne, Victoria, 2020), https://www.ptv.vic.gov.au/footer/legal-and-policies/victorian-fares-and-ticketing-manual/. 56 Tourism and Transport Forum, Ticket to Ride: Reforming Fares and Ticketing for Sustainable Public Transport (Sydney, Australia: Tourism and Transport Forum, 2016), 16, https://www.ttf.org.au/wp-content/uploads/2017/01/TTF-Ticket-to-Ride-Fare-and-ticketing-Paper.pdf. 57 Tourism and Transport Forum, Ticket to Ride, 58.

19
Zone-based ticketing systems charge commuters based on the number of geographical
zones traversed.58 These structures impose a progressively stronger relationship between
distance travelled and fare levels, with travel across a larger number of zones resulting in a
higher fare.59 Each train station, bus stop and tram stop exist within a particular zone.
There are 13 zones throughout the myki network. Metropolitan train, bus and tram services
all run within Zones 1 and 2, with PTV defining the metropolitan area as Melbourne and its
suburbs.60 The radius of Zone 1 covers approximately 10-15km, while the radius of Zone 2 is
approximately 50km.61 Within these metropolitan zones, there are three fare groups: Free
Tram Zone, Zone 1+2 and Zone 2 only.62
Regional train and bus services run between Zones 3 and 13, with each subsequent zone
between Zones 3 and 13 being approximately 10km apart.63 Figure 5 shows the regional
train network and the corresponding zones of each train station.
58 “Zones,” Public Transport Victoria, 2020, https://www.ptv.vic.gov.au/tickets/fares/zones/. 59 Tourism and Transport Forum, Ticket to Ride, 13. 60 “Zones.” 61 Metrolinx, Approach to Fares Around the World (Toronto, Ontario, 2015), 15, http://www.metrolinx.com/en/regionalplanning/fareintegration/20150302_Approach_to_Fares_EN.pdf. 62 “Metropolitan Fares,” Public Transport Victoria, 2020, https://www.ptv.vic.gov.au/tickets/fares/metropolitan-fares/. 63 “Regional Fares,” Public Transport Victoria, 2020, https://www.ptv.vic.gov.au/tickets/fares/regional-fares/.

20
Figure 5: Regional Train Network – myki Zones64
Zone-based structures are often chosen for their simplicity, with commuters being able to
easily understand exactly how much their commute is going to cost them.65 Confusion
around fare structure can be a barrier to public transport use, and a simplified zone-based
fare structure can create a greater willingness to travel and thus increase public transport
patronage.66
However, zone-based fare structures can create anomalies that result in higher fares
depending on the geographical area in which a commuter completes their journey.67 For
64 “Regional Myki Zones,” Public Transport Victoria, 2020, https://www.ptv.vic.gov.au/tickets/fares/zones/regional-myki-zones/. 65 “Policies: Fare Reform,” Public Transport Users Association, 2017, https://www.ptua.org.au/policy/fares/. 66 Tourism and Transport Forum, Ticket to Ride, 17. 67 Infrastructure Australia, Five-Year Focus : Immediate Actions to Tackle Congestion (Victoria, Melbourne, 2018), 44, https://www.infrastructurevictoria.com.au/wp-content/uploads/2019/04/Five-year-focus-Immediate-actions-to-tackle-congestion-April-2018.pdf.

21
example, within the current zone-based fare structure, regional commuters pay for more
per kilometre than metropolitan commuters.68
This trend is exacerbated in LGAs such as Latrobe which cover a large geographical distance
and are subject to multiple zoning boundaries. Zone-based structures can also create
anomalies where travelling a set distance through some zones is cheaper or more expensive
than travelling the same distance through other zones.69 The result is a system that is user
friendly, but that can create inequitable outcomes depending on where the commuter
begins and ends their journey.
4.2.2 myki Money
In addition to the zones travelled through, the type of myki ticket used by a commuter will
affect the cost of their fare. There are two fare types that determine the amount a user will
be charged: a single trip and a daily fare cap. The maximum fare for a single trip is the
default 2-hour fare for the zones that have been travelled in. When a user has made
multiple trips in one day, a daily fare cap is introduced at a fixed price.70
Both of these costs have been predetermined by PTV and are automatically applied when
touching off at the user’s destination. Figure 6 provides an example of the costs for a single
trip and a daily fare cap on V/Line services during peak travel times.
68 “Policies: Fare Reform.”; Public Transport Users Association, email correspondence with author, 22 May, 2020. 69 Infrastructure Victoria, Good Move : Fixing Transport Congestion (Melbourne, Victoria, 2020), 20, https://www.infrastructurevictoria.com.au/wp-content/uploads/2020/03/Good-Move-fixing-transport-congestion-Infrastructure-Victoria.pdf. 70 “Metropolitan Fares.”

22
Figure 6: V/Line Commuter Train Fares for Travel To/From Zone 1 (Peak Fare)71
4.2.3 myki Pass
For commuters who travel regularly, a myki Pass can be purchased. While myki Money will
automatically be deducted based on the user’s journey, a myki Pass is preloaded with a set
number of days’ worth of travel within a specified set of zones. Figure 7 provides an
example of the myki Pass cost options for commuters using a V/Line service.
71 “Regional Fares.”

23
Figure 7: myki Pass V/Line Fares for Travel To/From Zone 172
4.2.4 Bus Fares
The above calculations also extend to the metropolitan and regional bus networks.
However, bus fares are generally cheaper than equivalent train services in metropolitan
Melbourne and regional Victoria. Figure 8 shows the default 2-hour fare and daily pass fare
for regional buses travelling across within or across two zones.
72 Ibid.

24
Figure 8: myki Pass Regional Bus Fares for Travel Within 1 or 2 Zones73
4.2.5 Concessions and Entitlements
There are also a variety of concessions available which allow eligible customers to travel on
public transport in Victoria at a decreased fare. Categories relevant to this report include
students, seniors and people on a disability pension. While the above calculations still apply,
concession myki holders pay only 50 per cent of the full fare.74
There are also other benefits available to some commuters. PTV provides free weekend
travel entitlements for Victorian Seniors Card holders, Disability Support Pensioners, Carer
Payment recipients and Victorian Carer Card holders.75 No fares are charged for journeys
made by eligible customers travelling in one or two consecutive zones. However, if a
commuter is entitled to free weekend travel in two consecutive zones and travels in more
than two zones, the fare for the entire journey will be charged.76
A Victorian Student Pass and Regional Student Pass is also available for primary and
secondary school students who use the myki network to get to and from school. These
student passes provide unlimited travel for eligible students on all public transport services
within the zones of validity until the expiry of the pass.77 Figure 9 outlines the student
73 Ibid. 74 Public Transport Victoria, Victorian Fares and Ticketing Conditions, 15. 75 Ibid, 27-28. 76 Ibid, 28. 77 Ibid, 46-47.

25
passes that are available to metropolitan students and students from certain regional
centres.
Figure 9: Victorian and Regional Student Pass Prices and Zones78
78 Ibid, 106.

26
5. The Cost Structure of myki in the Latrobe City LGA
The fare structure described in the above section applies throughout Latrobe. However,
there are some anomalies in the zone-based structure of this system that results in Latrobe
commuters paying more per kilometre travelled than their regional counterparts in Ballarat,
Bendigo and Geelong. Latrobe commuters also face some exemptions of benefits that are
otherwise available to commuters from these regional centres.
5.1 The Gippsland Line
Latrobe is serviced by the Gippsland train line. The Gippsland train line is a regional
passenger service operated by V/Line which connects the wider Gippsland region with
metropolitan Melbourne. Figure 10 shows the regional stations on the Gippsland train line
in relation to Melbourne.
Figure 10: Regional Stations on the Gippsland Line79
Of the 12 regional train stations on the Gippsland line, three are located within Latrobe:
Traralgon station in Zone 12, Morwell station in Zone 11 and Moe station in Zones 9 and 10.
Figure 6 shows the costs for travelling to and from these stations and their respective zones
79 “Gippsland V/Line Rail Service,” Wikipedia, 2019, https://en.wikipedia.org/wiki/Gippsland_V/Line_rail_service.

27
during peak times, while Figure 11 shows the costs for travelling to and from these stations
and their respective zones during off-peak times.
Figure 11: V/Line Commuter Train Fares for Travel To/From Zone 1 (Off-Peak Fare)80
5.2 Anomalies of myki’s Zone-Based Fare Structure in Latrobe
While the fare structure of the myki ticketing system in Latrobe appears consistent with
other regional centres in Victoria, there are anomalies in how much Latrobe commuters are
being charged compared to commuters in other regional centres. These anomalies relate to
the distance travelled compared to the cost of the journey. There are instances of Gippsland
line commuters from Latrobe travelling a similar or lesser distance than their counterparts
on the Ballarat, Bendigo, Geelong and Seymour lines, but being charged a higher fare.
80 “Regional Fares.”

28
Table 1 outlines various journeys on the aforementioned services, with the distance
travelled and the cost of the journey compared across each service. These calculations are
based on the daily rate of a commuter using a full fare myki Pass.
Table 1: Journey Distance and Accompanying Fares on Gippsland, Ballarat, Bendigo, Seymour and Geelong
V/Line Train Services.81
Journey From Journey To Km’s Cost
Traralgon (Zone 12) Moe (Zone 10) 27.8 $5.30 per day
Ballan (Zone 4) Sunshine (Zone 2) 67.2 $5.30 per day
Kangaroo Flat (Zone
12)
Castlemaine (Zone
10)
31.9 $5.30 per day
Seymour (Zone 6) Kilmore East (Zone
4)
35.3 $5.30 per day
Waurn Ponds (Zone
4)
Lara (Zone 4) 27.4 $3.12 per day
These comparisons outline how the current zone-based ticketing system is disadvantaging
Latrobe commuters. As demonstrated above, travel between Traralgon and Moe costs the
same as travel between Ballan and Sunshine, Kangaroo Flat and Castlemaine, and Seymour
and Kilmore East. When travelling between these respective stations, a commuter will travel
across three zones and be subject to a fare. However, the distance between these stations is
not consistent, and it is clear that Latrobe commuters travel a shorter distance while paying
the same fare.
These discrepancies range from minimal to extreme. When compared to the
aforementioned journeys on the Bendigo and Seymour lines, Latrobe commuters travel only
81 “Regional Fares.”; “Line Guides,” VICSIG, 2020, https://vicsig.net/index.php?page=infrastructure§ion=lineguide; Table 1 compiled by author using PTV’s fare calculator and detailed Line Guide information.

29
marginally less distance and pay the same fare. Zone-based ticketing systems are imperfect
in their zoning structure.82 This means that there will inevitably be some variation between
journey distance across the same number of zones, as stations will not be the same distance
between each other.
However, the fact that commuters on the Ballarat line can travel more than double the
distance as commuters on the Gippsland line, yet pay the same fare, demonstrates how
Latrobe commuters are being disadvantaged by the zone-based ticketing system that myki
utilises.
Table 1 also demonstrates how Latrobe commuters pay more to travel almost the same
distance as commuters in Geelong. This is evident as commuters on the Geelong line can
travel approximately 27 kilometres within only one zone between Waurn Ponds and Lara,
while commuters on the Gippsland line must travel across three zones to travel a similar
distance between Traralgon and Moe. In both of these instances, commuters are travelling
within a single LGA. This results in Latrobe commuters paying approximately $2.18 more
than Geelong commuters when travelling a similar distance of approximately 27 kilometres.
5.3 Anomalies in Free Weekend Travel Entitlements in Latrobe
These anomalies also apply to Latrobe commuters who utilise the free weekend travel
entitlement.83 The distance Latrobe commuters can travel for free is less than those in other
regional LGAs and metropolitan Melbourne. Table 2 and 3 outline how far a commuter
eligible for free weekend travel can travel for free compared to equivalent commuters from
Ballarat, Bendigo, Geelong and metropolitan Melbourne. Table 2 refers to journeys made by
train, while Table 3 refers to journeys made by bus.
82 Metrolinx, Approach to Fares Around the World, 15. 83 Public Transport Victoria, Victorian Fares and Ticketing Conditions, 27-28.

30
Table 2: Free Weekend Travel Entitlements for Single Train Trip84
Journey From Journey To Km’s Weekend Rate
Traralgon (Zone 12) Morwell (Zone 11) 13.7 Free
Traralgon (Zone 12) Moe (Zone 10) 27.8 $1.89
Stony Point (Zone 2) Bell (Zone 1) 85.8 Free
Waurn Ponds (Zone
4)
Lara (Zone 4) 27.4 Free
Table 3: Free Weekend Travel Entitlements for Single Bus Trip in LGA85
Journey From Journey To Km’s Weekend Rate
Traralgon (Zone 12) Morwell (Zone 11) 14 Free
Traralgon (Zone 12) Moe (Zone 11 28 $1.89
Buningyong (Zone 8) Creswick (Zone
(Zone 9)
35 Free
Kangaroo Flat (Zone
12)
Huntly (Zone 13) 20 Free
Lara (Zone 4) Torquay (Zone 5) 49 Free
Table 2 and 3 highlight the disparity between the distance eligible commuters from Latrobe
can travel for free compared to commuters in other regional LGAs and metropolitan
Melbourne. For example, Table 2 demonstrates that it is possible for an eligible commuter
to travel over 85km for free on the metropolitan train network, while equivalent commuters
in Latrobe can only travel approximately 14km for free before being charged for travelling
over two consecutive zones.
84 “Regional Fares.”; “Line Guides.”; Table 2 compiled by author using PTV’s fare calculator and detailed Line Guide information. 85 Public Transport Victoria, Victorian Regional Bus Fares Supplement (Melbourne, Victoria, 2020), https://www.ptv.vic.gov.au/assets/default-site/footer/legal-and-policies/victorian-fares-and-ticketing-manual/cacf598a94/2020-Regional_Bus_Fares_Supplement-A4-v02_FA_WEB.pdf; Table 3 compiled by author using the Regional Bus Fare Supplement and approximate route distance.

31
Table 2 also demonstrates how, despite travelling an almost identical distance as their
Geelong counterparts, eligible Latrobe commuters cannot access the free travel entitlement
as the distance they travel is across three consecutive zones. In contrast, the distance
eligible commuters from Geelong travel is only across one zone. Table 3 also demonstrates
how an eligible commuter in Geelong is able to travel over three times further than an
equivalent commuter in Latrobe on their inter-town bus network before being charged for
travelling over two consecutive zones.
These examples underscore the disparity between eligible commuters in Latrobe compared
to commuters in Geelong and metropolitan Melbourne. While less pronounced, eligible
commuters in Latrobe also travel a lesser distance before being charged for travelling over
two consecutive zones compared to commuters in Bendigo and Ballarat.
These disparities result from the zone-based ticketing system that myki utilises. While this
system is intended to benefit all Victorian commuters, there are anomalies in Latrobe that
are resulting in commuters from this region paying more to travel a lesser distance. These
anomalies are also preventing eligible Latrobe commuters from receiving entitlements for
as much of their journey as equivalent commuters from other regional LGAs and
metropolitan Melbourne.
5.4 Anomalies in Access to Regional Student Passes in Latrobe
Latrobe students are also impacted by the zone-based fare structure of the myki network.
This disadvantage stems from a lack of access to the Regional Student Pass that primary and
secondary school students can access in Ballarat, Bendigo, Geelong and some Southwestern
regions. The regional student pass is only available in LGAs that encompass one or two
consecutive zones. Given that Latrobe covers four zones, Latrobe students do not have the
same access to the Regional Student Pass and must purchase a Victorian Student Pass.86
86 “School Students,” Public Transport Victoria, 2020, https://www.ptv.vic.gov.au/tickets/myki/concessions-and-free-travel/children-and-students/school-students/.
32
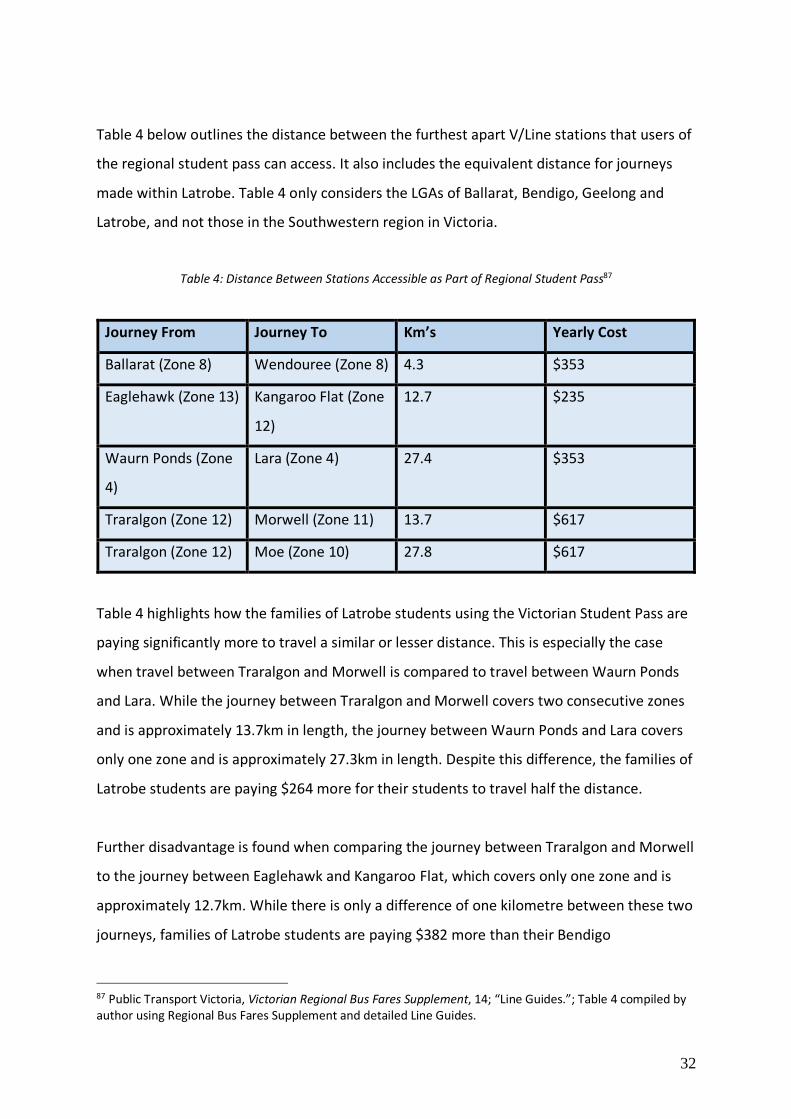
Table 4 below outlines the distance between the furthest apart V/Line stations that users of
the regional student pass can access. It also includes the equivalent distance for journeys
made within Latrobe. Table 4 only considers the LGAs of Ballarat, Bendigo, Geelong and
Latrobe, and not those in the Southwestern region in Victoria.
Table 4: Distance Between Stations Accessible as Part of Regional Student Pass87
Journey From Journey To Km’s Yearly Cost
Ballarat (Zone 8) Wendouree (Zone 8) 4.3 $353
Eaglehawk (Zone 13) Kangaroo Flat (Zone
12)
12.7 $235
Waurn Ponds (Zone
4)
Lara (Zone 4) 27.4 $353
Traralgon (Zone 12) Morwell (Zone 11) 13.7 $617
Traralgon (Zone 12) Moe (Zone 10) 27.8 $617
Table 4 highlights how the families of Latrobe students using the Victorian Student Pass are
paying significantly more to travel a similar or lesser distance. This is especially the case
when travel between Traralgon and Morwell is compared to travel between Waurn Ponds
and Lara. While the journey between Traralgon and Morwell covers two consecutive zones
and is approximately 13.7km in length, the journey between Waurn Ponds and Lara covers
only one zone and is approximately 27.3km in length. Despite this difference, the families of
Latrobe students are paying $264 more for their students to travel half the distance.
Further disadvantage is found when comparing the journey between Traralgon and Morwell
to the journey between Eaglehawk and Kangaroo Flat, which covers only one zone and is
approximately 12.7km. While there is only a difference of one kilometre between these two
journeys, families of Latrobe students are paying $382 more than their Bendigo
87 Public Transport Victoria, Victorian Regional Bus Fares Supplement, 14; “Line Guides.”; Table 4 compiled by author using Regional Bus Fares Supplement and detailed Line Guides.

33
counterparts to allow their children to access the public transport network. The only
exception to this trend is when journeys made by students in Latrobe are compared to
journeys made by students in Ballarat.
These disparities demonstrate that Latrobe students and their families are paying more as a
result of the zone-based fare structure of the myki ticketing system. This reflects the
aforementioned fare anomalies that have been identified throughout the Latrobe public
transport network. The combination of these disparities suggest that fare anomalies are
affecting Latrobe commuters of every demographic, with the myki ticketing system
producing inequitable outcomes across the entire LGA.
5.5 Impact of These Anomalies on Latrobe Commuters
Several interviews were conducted with various local stakeholders and commuters to hear
their perspective on the cost of the myki public transport system in Latrobe.
However, when asked about the described fare anomalies, several Latrobe commuters
expressed that they were not aware that these discrepancies existed. Alan McFarlane, a
local councillor for the Latrobe City Council representing the City’s Central Ward, explained
that he had received few complaints about the cost of the myki public transport services in
his electorate.88 A similar sentiment was expressed by local commuter Jack Huxtable, who
believed the service was ‘reasonably priced’ and was unaware of the price differentials
outlined above.89
Jon Dalton, a local commuter, argued that public transport in Latrobe is generally a ‘cost
effective service’, but that they had a well-paying job and could afford a yearly myki Pass to
and from metropolitan Melbourne.90 According to Mr Dalton, the current cost
88 Alan McFarlane, interviewed by Jack Hunt (Melbourne, Victoria, 01 May, 2020). 89 Jack Huxtable, interviewed by Jack Hunt (Melbourne, Victoria, 03 June, 2020). 90 Jon Dalton, interviewed by Jack Hunt (Melbourne, Victoria, 27 May, 2020).

34
arrangements may be more unfair for economically disadvantaged users of the network,
who may find the cost of commuting to and from metropolitan Melbourne ‘a big issue’.91
While interviews conducted for this report indicated that the cost of the myki ticketing
system was not a primary issue for Latrobe commuters, constituent emails addressed to
Russell Northe MP, the Member of Parliament for Morwell, expressed frustration with being
unable to access the Regional Student Pass.92 Two anonymous constituents expressed
dissatisfaction with the lack of access to this pass, describing the current system as ‘not
fair’.93 While acknowledging it was their choice to send their children to school via public
transport, these constituents felt that Latrobe families were being disadvantaged compared
to other regional centres. These emails reflected broader community sentiment on this
issue.94
Despite a lack of awareness about fare anomalies in Latrobe, almost all of those interviewed
expressed significant dissatisfaction with Latrobe’s public transport network. Issues
identified included:
§ The poor performance of the Gippsland V/Line service.95
§ Lack of a direct line to and from the Melbourne CBD.96
§ Overcrowding on peak-hour services.97
§ Frequent disruptions due to shared tracks, signal problems and congestion.98
91 Dalton, Interview. 92 Anonymous, email correspondence with Russell Northe MP, 2019. 93 Ibid. 94 Bryce Eishold, “Unfair Student Fare,” Latrobe Valley Express, April 29, 2019. https://www.latrobevalleyexpress.com.au/story/6095921/unfair-student-fare/. 95 Dalton, Interview; Rob Mariano, interviewed by Jack Hunt (Melbourne, Victoria, 25 May, 2020); Public Transport Victoria, Regional Train Operational Performance (May 2020) https://app.powerbi.com/view?r=eyJrIjoiMzE2ZDIyN2YtODY1Yy00ZGY0LWE4YTktNDcxOTcwYWQyMjM5IiwidCI6IjcyMmVhMGJlLTNlMWMtNGIxMS1hZDZmLTk0MDFkNjg1NmUyNCJ9). PTV’s performance statistics outline that the Gippsland Line frequently underperforms compared to other regional V/Line services, with the percentage of on time services on the Gippsland Line averaging at only 80.6% so far this year, compared to between 88.5% and 93.1% across the Ballarat, Bendigo and Geelong Lines. 96 Sharon Gibson, interviewed by Jack Hunt (Melbourne, Victoria, 30 April, 2020); The Gippsland Line shares a significant portion of its line with the Pakenham and Cranbourne Lines. This contrasts with the Ballarat, Bendigo and Geelong lines, which all have dedicated V/Line services that do not overlap with the metropolitan train network to the same extent as the Gippsland line. 97 Huxtable, Interview; Dalton, Interview. 98 Ibid.

35
§ Timetabling issues for students attending university in the Melbourne CBD.99
§ Limited car park spaces at Moe, Morwell and Traralgon train stations.100
§ Difficulties accessing services such as the Latrobe Regional Hospital.101
Sharon Gibson, a local councillor for the Latrobe City Council representing the City’s West
Ward, cited the aforementioned issues when explaining that Latrobe experiences significant
disadvantage in its public transport network, especially when compared to other regional
centres in Victoria.102 According to Ms Gibson, many residents in the region feel that
Latrobe is ‘treated as the poor relation’ when it comes to public transport services.103 For
Ms Gibson, these issues act as a disincentive for local residents to utilise the public transport
network.104
‘We want to have a really good service.
Other places have this – why can’t we?’
Sharon Gibson.105
Therefore, it is apparent that many Latrobe commuters have issues with their local myki
public transport network that extend beyond fare anomalies. It is unclear whether the lack
of community feedback about fare anomalies resulted from a lack of knowledge about them
or contentment with the current myki ticketing system.
99 Mariano, Interview. According to this anonymous resident, his son has often arrived late for university classes in the city despite arriving at his local train station early, with the biggest issue with the myki public transport system “being able to get there on time”. 100 Gibson, Interview. 101 Anderson, Interview. 102 Gibson, Interview. 103 Ibid. 104 Ibid. 105 Ibid.

36
6. Recommendations and Conclusion
This report’s evaluation of fare anomalies in Latrobe demonstrate that while fares across
the myki network are generally considered to be affordable by international standards, they
are not always equitable.106 Despite the lack of knowledge about these cost discrepancies, it
is clear that the zone-based fare structure of the myki ticketing system is creating
inequitable outcomes for Latrobe residents. There are two possible routes the Victorian
Government can take to address these anomalies that will be discussed below.
6.1 Exploring Alternative Fare Structures for the myki Ticketing System
The first is a restructure of the myki ticketing system. As has been established throughout
this report, zone-based structures can create anomalies that disadvantage certain
commuters. This is a fundamental flaw of zone-based pricing schemes and a means of
addressing these inequitable outcomes is to utilise a different fare structure throughout the
myki system. The following fare structures are commonly used across Australia and
internationally:
§ Flat Fare Structure – passengers are charged identical fares regardless of route,
distance travelled, or type of passenger. This system works well in situations where a
majority of passengers travel a similar distance.107 However, flat fares have been
found to most negatively impact passengers who make short commutes, as they are
paying more per kilometre than passengers travelling a longer distance.108 Given that
the myki ticketing system encompasses both metropolitan Melbourne and regional
Victoria, it is unlikely that a flat fare system would create equitable outcomes for all
commuters.
106 Nine-Squared, 2015 Fare Benchmarking Report (Brisbane, Queensland, 2015), https://ninesquared.com.au/wp-content/uploads/2015/10/2015-Fare-Benchmarking-Final-Report.pdf. 107 Mohamed Mezghani, "Study on Electronic Ticketing in Public Transport,” European Metropolitan Transport Authorities (EMTA) 56 (2008): 5, https://emta.com/IMG/pdf/EMTA-Ticketing.pdf. 108 Steven Farber, Keith Bartholomew, Xiao Li, Antonio Páez, and Khandker M. Nurul Habib, "Assessing Social Equity in Distance Based Transit Fares Using a Model of Travel Behavior," Transportation Research Part A: Policy and Practice 67 (2014): 293.

37
§ Distance Based Fare Structure – passengers are charged depending on the amount
of kilometres they have travelled. In some respects, distance-based fares are the
most equitable fare structure as they provide the most accurate fare based on how
far a commuter has travelled.109 Distance based fare structures also have the
capacity to address some of the anomalies between fare and distance identified in
this report, as commuters will be charged for the amount of kilometres they have
travelled rather than the number of zones they have travelled through.
However, distance-based fare structures also have the capacity to create inequitable
outcomes and tend to be more complex than zone-based structures.110 The PTUA
has expressed concerns that commuters would be unable to know how much their
journey is going to cost prior to their commute, with this potentially acting as a
disincentive to use public transport use.111 A distance based fare structure would
also create inequitable outcomes for passengers who do not have a direct route to
their destination.112 Commuters who have a direct route to their destination would
effectively pay less than commuters who have to transfer across multiple modes of
transport. In this respect, distance-based fare structures can increase fares for
commuters who regularly make long-distance trips.113
§ Free Fare Structure – free fare structures also have the capacity to create equitable
outcomes for commuters by reducing cost barriers to travel.114 Free fare structures
can result in a simplification of ticketing systems by removing commuters’ need to
comprehend fare rules. Some studies have also found evidence that free fare
structures can improve mobility and accessibility for low income users.115
109 Infrastructure Victoria, Good Move, 23. 110 Tourism and Transport Forum, Ticket to Ride, 16. 111 “Myth: Multimodal Zone-Based Fares are Unfair; We Should be Charged by Distance ,” Public Transport Users Association, 2020, https://www.ptua.org.au/myths/zones/. 112 Ibid. 113 Farber, “Assessing Social Equity in Distance Based Transit Fares,” 293. 114 Tourism and Transport Forum, Ticket to Ride, 21. 115 Oded Cats, Yusak O. Susilo, and Triin Reimal, "The Prospects of Fare-Free Public Transport: Evidence from Tallinn," Transportation 44, no. 5 (2017): 1102, https://link.springer.com/content/pdf/10.1007/s11116-016-9695-5.pdf.

38
However, the potential disadvantage of free fare structures is the negative effect it
can have on revenue and thus on the amount of money that can be invested into
improving public transport networks.116 As has been demonstrated in this report, the
primary issue that commuters have with the myki ticketing system is not the fares,
but rather the service quality.117 There is evidence that suggests that free fare
structures can ultimately make a public transport system’s existing problems worse
by starving it of revenue.118 There are also arguments that the elimination of fares
actually results in a more expensive service due to higher tax revenues needing to be
raised to accommodate a free fare public transport network.119
Ultimately, when compared to other fare structures across Australia and internationally,
zone-based fare structures occupy a middle-ground that keeps the fare system simple while
offering fares that have a general relationship between distance travelled and fare price.120
Furthermore, while cost calculations for the implementation of a new ticketing system is
outside the scope of this report, it is possible that the cost of any significant transformation
of the network’s fare structure would outweigh the potential economic benefits for Latrobe
commuters. Therefore, this report does not recommend that the Department of Transport
restructure the fare structure of the myki ticketing system.
6.2 Inquiry into Fare Anomalies in the myki Ticketing System
While a restructure of the myki ticketing system is not recommended, this report does
recommend that the Department of Transport conduct an inquiry into fare anomalies in the
zone-based fare structure of the myki ticketing system. Pricing anomalies based on distance
have been reported throughout the myki network for years and it is outside the scope of
116 Tourism and Transport Forum, Ticket to Ride, 21. 117 Daniel Bowen, “We need better public transport, not free public transport,” Daniel Bowen (blog), June 14, 2018, https://www.danielbowen.com/2018/06/14/pt-better-not-free/. 118 Constance Carr, “Luxembourg’s Free Public Transport Sounds Great. It Isn’t,” City Metric, March 1, 2019. https://www.citymetric.com/transport/luxembourg-s-free-public-transport-sounds-great-it-isn-t-4458. 119 “Myth: Making Public Transport Free Will Encourage Use and Political Support,” Public Transport Users Association, 2020, https://www.ptua.org.au/myths/free/. 120 Ibid.

39
this report to account for all of them.121 However, it is clear that these anomalies exist and
are creating inequitable outcomes for residents in Latrobe that are already facing higher
levels of disadvantage.
This inquiry would present the Victorian Government with a comprehensive list of pricing
anomalies throughout the myki network, and provide recommendations about how to
address these anomalies to maximise equitable pricing outcomes within the system’s zone-
based fare structure. The report recommends that this inquiry address the following specific
issues:
§ Anomalies in distance travelled versus the number of zones travelled through versus
fare price.
§ Identification of where these anomalies are located across the myki network, with
an emphasis on metropolitan versus regional areas.
§ The extent to which these discrepancies are charging affected commuters higher
fares per kilometre travelled.
§ A comprehensive list of cost analyses and recommendations to address these
discrepancies across the myki network.
§ The provision of long-term strategies to prevent the creation of new pricing
anomalies within the myki ticketing system.
Social equity is an integral goal of public transport systems and a system’s aim should be to
share benefits equally across all income levels and communities.122 To uphold this equity in
the myki ticketing system, it is imperative that commuters feel that their public transport
network is not only affordable, but fair. Conducting an inquiry into the system’s pricing
anomalies would not only improve outcomes for commuters in Latrobe but would help to
address inequitable outcomes across the myki public transport system.
121 Infrastructure Australia, Five-Year Focus, 44. 122 Thomas Sanchez, The Right to Transportation: Moving to Equity (Routledge, 2018), 8.

40
6.3 Reforms to the myki Ticketing System in Latrobe
In addition to the commission of an inquiry, this report also recommends the following
immediate initiatives that would address some of the specific inequities found in Latrobe:
§ Provide access to the Regional Student Pass for Latrobe students across two
consecutive zones.
o The Victorian Government should provide a Regional Student Pass across two
zones for students in Traralgon and Morwell, and Morwell and Moe. This
Pass would be costed at the $353 fare that equivalent two zone Passes cost
in Ballarat and Geelong. As discussed throughout this report, the distance
travelled across the two zones between Traralgon and Morwell, and Morwell
and Moe, are of a similar or lesser distance than the equivalent journeys
available in Bendigo and Geelong. These passes would not add additional
complexity to the current ticketing system and would assist in addressing the
inequitable outcomes that Latrobe students are facing.
§ Conduct a cost analysis of providing access to the Regional Student Pass across the
entire Latrobe LGA.
o The Victorian Government should also conduct a cost analysis of providing
access to a Regional Student Pass that would cover the entire Latrobe LGA.
While Latrobe covers up to four zones, it has been established that the
distance across these zones is comparable to the Geelong LGA. While a cost
analysis is outside the scope of this report, it is clear that the cost per
kilometre of providing this pass would be similar to the current cost per
kilometre of providing the pass in Geelong. Should access to the Regional
Student Pass across the entire LGA prove to be cost effective, it should be
implemented as soon as possible.

41
§ Conduct a cost analysis of making public transport free across all zones for
commuters entitled to free weekend travel.
o The Victorian Government should also conduct a cost analysis of providing
free travel across all zones of the myki network for commuters entitled to
free weekend travel. This would provide more equitable outcomes for
seniors and other equivalent commuters who travel predominantly on
regional lines that have a higher number of zones than metropolitan lines.
This initiative would also avoid adding complexity into the myki ticketing
system that may result from the implementation of LGA-based free weekend
travel zones. Providing free weekend travel across all zones for eligible
commuters would assist in providing equitable outcomes for commuters who
are most likely to have difficulty paying fares.
6.4 Conclusion
The combination of this inquiry and these initiatives would help to alleviate some of the
inequitable public transport outcomes that Latrobe commuters face. These changes would
also help to foster good will with the Latrobe community, who have often felt that they are
experiencing worse public transport outcomes compared to the rest of Victoria.123 Access to
affordable public transport is a key indicator of an equitable society. As such, the Victorian
Government should seek to maximise equitable public transport outcomes across the State
and implement the findings of this report.
123 Bryce Eishold, “More Transport Anger,” Latrobe Valley Express, July 14, 2017. https://www.latrobevalleyexpress.com.au/story/4790203/moe-transport-anger/.

42
References
Academic Journal Articles
Cats, Oded, Yusak O. Susilo, and Triin Reimal. "The Prospects of Fare-Free Public Transport:
Evidence from Tallinn." Transportation 44, no. 5 (2017): 1083-1104.
https://link.springer.com/content/pdf/10.1007/s11116-016-9695-5.pdf
Corcoran, James S., E.L. James and J.M. Ellis. "Do Elderly Victorians in Rural Areas Have
Access to Public Transport?" Road and Transport Research 14, no. 1 (2005): 38-43.
Cox, John B. "Public Transport Trends - Efficiency and Equity Considerations." Road and
Transport Research 16, no.3 (2007): 41-55.
Farber, Steven, Keith Bartholomew, Xiao Li, Antonio Páez, and Khandker M. Nurul Habib.
"Assessing Social Equity in Distance Based Transit Fares Using a Model of Travel
Behavior." Transportation Research Part A: Policy and Practice 67 (2014): 291-303.
Venter, Christoffel. "Transport expenditure and affordability: The cost of being
mobile." Development Southern Africa 28, no. 1 (2011): 121-140.
https://www.tandfonline.com/doi/abs/10.1080/0376835X.2011.545174
Books
Sanchez, Thomas. The Right to Transportation: Moving to Equity. Routledge, 2018.
Government Documents
Department of Environment, Land, Water and Planning. Victoria in the Future 2019 :
Population Projections 2016 to 2056. Melbourne, Victoria, 2019.
43
https://www.planning.vic.gov.au/__data/assets/pdf_file/0032/332996/Victoria_in_Future_
2019.pdf
Department of Health and Human Services. Geographical Profiles and Planning Products.
Melbourne, Victoria, 2015. https://www2.health.vic.gov.au/about/reporting-planning-
data/gis-and-planning-products/geographical-profiles
Public Transport Victoria. Annual Report 2018-2019. Melbourne, Victoria, 2019.
https://www.ptv.vic.gov.au/assets/default-site/footer/data-and-reporting/annual-
report/6b8c2cff5a/PTVH4043-Annual_Report_2019-A4-v1_ONLINE.pdf
Public Transport Victoria. Victorian Fares and Ticketing Conditions 2020. Melbourne,
Victoria, 2020. https://www.ptv.vic.gov.au/footer/legal-and-policies/victorian-fares-and-
ticketing-manual/
Public Transport Victoria. Victorian Regional Bus Fares Supplement. Melbourne, Victoria,
2020. https://www.ptv.vic.gov.au/assets/default-site/footer/legal-and-policies/victorian-
fares-and-ticketing-manual/cacf598a94/2020-Regional_Bus_Fares_Supplement-A4-
v02_FA_WEB.pdf
Victorian Auditor General. Operational Effectiveness of the myki Ticketing System.
Melbourne, Victoria, 2015. https://www.audit.vic.gov.au/sites/default/files/20150610-
myki.pdf
V/Line Corporation. Annual Report 2018-2019. Melbourne, Victoria, 2019.
https://corporate.vline.com.au/getattachment/78d7f8ef-8892-4a48-93ef-
df296f7c749a/Annual-Report-2018-19
Interviews and Emails
Anderson, Jane, interviewed by Jack Hunt. Melbourne, Victoria, 01 May, 2020

44
Dalton, Jon, interviewed by Jack Hunt. Melbourne, Victoria, 27 May, 2020.
Gibson, Sharon, interviewed by Jack Hunt. Melbourne, Victoria, 30 April, 2020.
Huxtable, Jack, interviewed by Jack Hunt. Melbourne, Victoria, 03 June, 2020.
Mariano, Rob, interviewed by Jack Hunt. Melbourne, Victoria, 25 May, 2020.
McFarlane, Alan, interviewed by Jack Hunt. Melbourne, Victoria, 01 May, 2020.
Anonymous 1, email correspondence with Russell Northe MP, 2019.
Anonymous 2, email correspondence with Russell Northe MP, 2019.
Public Transport Users Association, email correspondence with author, 22 May, 2020.
News and Media Articles
ABC Gippsland. “Hazelwood closure: Morwell residents nervous about a future without
power plant.” ABC News, November 3, 2016. https://www.abc.net.au/news/2016-11-
03/hazelwood-closure-morwell-community-reaction/7942220.
Carr, Constance. “Luxembourg’s Free Public Transport Sounds Great. It Isn’t.” City Metric,
March 1, 2019. https://www.citymetric.com/transport/luxembourg-s-free-public-transport-
sounds-great-it-isn-t-4458.
Eishold, Bryce. “Moe Transport Anger.” Latrobe Valley Express, July 14, 2017.
https://www.latrobevalleyexpress.com.au/story/4790203/moe-transport-anger/.

45
Eishold, Bryce. “Unfair Student Fare.” Latrobe Valley Express, April 29, 2019.
https://www.latrobevalleyexpress.com.au/story/6095921/unfair-student-fare/.
Reports
Aither. Gippsland Regional Profile : An Analysis of Regional Strengths and Challenges.
Melbourne, Australia: Aither Pty Ltd., 2019. https://www.infrastructurevictoria.com.au/wp-
content/uploads/2019/04/Aither-Gippsland-Regional-Profile-March-2019.pdf.
Centre for Primary Health Care and Equity. A Review of the Evidence of the Impact of Public
Transport on Population Health in Australia. Sydney, New South Wales, 2009.
http://hiaconnect.edu.au/old/files/Impact_of_Public_Transport_on%20Health_in_Australia.
Committee for Gippsland. Our Region Our Future : Securing an Economic Future for
Gippsland and Latrobe Valley. Warragul, Victoria, 2016.
https://www.committeeforgippsland.com.au/policy-and-research/
Freelance Strategy. The Role of Infrastructure in Addressing Regional Disadvantage. Victoria,
Melbourne, 2019. https://www.infrastructurevictoria.com.au/wp-
content/uploads/2019/11/Background-paper_The-role-of-infrastructure-in-addressing-
regional-disadvantage.pdf
Infrastructure Australia. Five-Year Focus : Immediate Actions to Tackle Congestion. Victoria,
Melbourne, 2018. https://www.infrastructurevictoria.com.au/wp-
content/uploads/2019/04/Five-year-focus-Immediate-actions-to-tackle-congestion-April-
2018.pdf
Infrastructure Victoria. Good Move : Fixing Transport Congestion. Melbourne, Victoria, 2020.
https://www.infrastructurevictoria.com.au/wp-content/uploads/2020/03/Good-Move-
fixing-transport-congestion-Infrastructure-Victoria.pdf

46
Infrastructure Australia. Urban Transport Strategy: December 2013. Canberra, ACT, 2013.
https://www.infrastructureaustralia.gov.au/sites/default/files/2019-
06/infrastructureaus_rep_urbanstrategy.pdf
Infrastructure Australia. Victoria’s 30-Year Infrastructure Strategy. Victoria, Melbourne,
2016. https://www.infrastructurevictoria.com.au/wp-
content/uploads/2019/03/IV_30_Year_Strategy_WEB_V2.pdf
Metrolinx. Approach to Fares Around the World. Toronto, Ontario, 2015.
http://www.metrolinx.com/en/regionalplanning/fareintegration/20150302_Approach_to_F
ares_EN.pdf
Mezghani, Mohamed. "Study on Electronic Ticketing in Public Transport." European
Metropolitan Transport Authorities (EMTA) 56 (2008): 1-56.
https://emta.com/IMG/pdf/EMTA-Ticketing.pdf
Nine-Squared. 2015 Fare Benchmarking Report. Brisbane, Queensland, 2015.
https://ninesquared.com.au/wp-content/uploads/2015/10/2015-Fare-Benchmarking-Final-
Report.pdf
Rail Futures Institute. Introducing InterCity: How Regional Rail Can Re-Balance Population
Growth and Create a "State of Cities" in Victoria. Melbourne, Victoria, 2016.
https://cur.org.au/cms/wp-content/uploads/2016/08/160804-regional-rail-paper-v14-1-11-
final-for-printing-1.pdf
Tourism and Transport Forum. The Benefits of Public Transport. Sydney, Australia: Tourism
and Transport Forum, 2010. https://www.ttf.org.au/wp-content/uploads/2016/06/TTF-The-
Benefits-Of-Public-Transport-2010.pdf.
Tourism and Transport Forum. Ticket to Ride: Reforming Fares and Ticketing for Sustainable
Public Transport. Sydney, Australia: Tourism and Transport Forum, 2016.

47
https://www.ttf.org.au/wp-content/uploads/2017/01/TTF-Ticket-to-Ride-Fare-and-
ticketing-Paper.pdf
Websites
Australian Bureau of Statistics. 2016 Census Quickstats. Canberra, ACT, 2019.
https://www.abs.gov.au/websitedbs/D3310114.nsf/Home/2016%20QuickStats
Australian Bureau of Statistics. Census of Population and Housing: Socio-Economic Indexes
for Areas (SEIFA), Australia. Cat. no. 2033.0.55.001. Canberra, ACT, 2018.
https://www.abs.gov.au/AUSSTATS/[email protected]/DetailsPage/2033.0.55.0012016?OpenDocum
ent
Bowen, Daniel. “We need better public transport, not free public transport.” Daniel Bowen
(blog), June 14, 2010. https://www.danielbowen.com/2018/06/14/pt-better-not-free/.
Department of Transport. “Fees, Fines and Charges.” Transport.vic.gov.au 2020.
https://transport.vic.gov.au/about/fees-fines-and-charges.
Department of Transport. “Governance.” Transport.vic.gov.au. 2020.
https://transport.vic.gov.au/about/governance.
Jesuit Social Services and Catholic Services Australia. “Dropping off the Edge 2015.”
dote.org.au. 2015. https://dote.org.au/findings/victoria/
Know Your Council. “Latrobe City.” Knowyourcouncil.vic.gov.au. 2015.
https://knowyourcouncil.vic.gov.au/councils/latrobe.
Latrobe City Council. “Economy Profile.” app.remplan.com.au. 2019.
https://app.remplan.com.au/latrobe/economy/trends/unemployment

48
Metro Trains Melbourne. “myki.” Metrotrains.com.au. 2020.
https://www.metrotrains.com.au/tickets-2/.
Public Transport Users Association. “Myth: Making Public Transport Free Will Encourage Use
and Political Support” Ptua.org.au. 2020. https://www.ptua.org.au/myths/free/.
Public Transport Users Association. “Myth: Multimodal Zone-Based Fares are Unfair; We
Should be Charged by Distance.” Ptua.org.au. 2020.
https://www.ptua.org.au/myths/zones/.
Public Transport Users Association. “Policies: Fare Reform.” Ptua.org.au. 2017.
https://www.ptua.org.au/policy/fares/.
Public Transport Victoria. “Metropolitan Fares.” Ptv.vic.gov.au. 2020.
https://www.ptv.vic.gov.au/tickets/fares/metropolitan-fares/.
Public Transport Victoria. “myki.” Ptv.vic.gov.au. 2020.
https://www.ptv.vic.gov.au/tickets/myki/.
Public Transport Victoria. “Our Role.” Ptv.vic.gov.au. 2020.
https://www.ptv.vic.gov.au/footer/about-ptv/our-role-and-governance/.
Public Transport Victoria. “Regional Fares.” Ptv.vic.gov.au. 2020.
https://www.ptv.vic.gov.au/tickets/fares/regional-fares/.
Public Transport Victoria. “Regional Myki Zones.” Ptv.vic.gov.au. 2020.
https://www.ptv.vic.gov.au/tickets/fares/zones/regional-myki-zones/.
Public Transport Victoria. Regional Train Operational Performance. May 2020.
https://app.powerbi.com/view?r=eyJrIjoiMzE2ZDIyN2YtODY1Yy00ZGY0LWE4YTktNDcxOTcw
YWQyMjM5IiwidCI6IjcyMmVhMGJlLTNlMWMtNGIxMS1hZDZmLTk0MDFkNjg1NmUyNCJ9)

49
Public Transport Victoria. “School Students.” Ptv.vic.gov.au. 2020.
https://www.ptv.vic.gov.au/tickets/myki/concessions-and-free-travel/children-and-
students/school-students/.
Public Transport Victoria. “Zones.” Ptv.vic.gov.au. 2020.
https://www.ptv.vic.gov.au/tickets/fares/zones/.
VICSIG. “Line Guides.” Vicsig.net. 2020.
https://vicsig.net/index.php?page=infrastructure§ion=lineguide.
Victorian Electoral Commission. “Latrobe Profile.” Vec.vic.gov.au. 2014.
https://www.vec.vic.gov.au/ElectoralBoundaries/LatrobeProfile.html.
Victorian Electoral Commission. “Local Council Profiles.” Vec.vic.gov.au. 2019.
https://www.vec.vic.gov.au/ElectoralBoundaries/CouncilProfiles.html.
Wikipedia. “Gippsland V/Line Rail Service.” Wikipedia.org. 2019.
https://en.wikipedia.org/wiki/Gippsland_V/Line_rail_service.