a disease modelling approach for angelman syndrome based ...€¦ · generation of patient-specific...
TRANSCRIPT

1
A disease modelling approach for Angelman syndrome based on neuronal
differentiation of patient-derived iPSCs
Ana Isabel da Silva Guerreiro
Instituto Superior Técnico, Lisboa, Portugal
October, 2018
Abstract: Angelman syndrome (AS) is a neurodevelopmental disorder caused by deficiency of maternally
inherited UBE3A gene, which displays paternal imprinting. Regarding the promising features of human induced
pluripotent stem cells (hiPSCs), a robust disease modelling system was created, mimicking the neurogenesis
process in vitro. For that, control and patient-derived iPSCs were differentiated using the dual-SMAD inhibition
protocol. Characterization of the iPSCs population confirmed a pluripotent state of these cells before the neural
commitment protocol. Neural commitment of both control and AS patient derived iPSCs was monitored by
immunofluorescence (IF) and RT-qPCR for several differentiation markers from day 12 to day 80. Successful
neural induction was achieved for both control and AS-derived iPSCs. During this neuronal protocol, the
methylation status of the PWS-IC which controls imprinting regulation of the Angelman locus was shown to be
correctly maintained, which assures the feasibility of this protocol to model AS. Finally, UBE3A expression was
also monitored and shown to increase during differentiation of the control iPSC-derived neurons and to be always
higher than in AS iPSC-derived neurons, where a gradual decay of UBE3A expression is noticed. However, at the
last timepoint studied (day 80), UBE3A expression is not entirely switch off in AS iPSC-derived neurons,
suggesting that a longer differentiation period might be necessary for the paternal UBE3A to be completely
silenced. Taken together, the results suggest that dual-SMAD inhibition protocol for neuronal differentiation
provide a good system to model AS syndrome which is able to discern phenotypes between control and AS iPSC-
derived neurons.
Keywords: Angelman Syndrome, UBE3A, Genomic imprinting, Human induced pluripotent stem cells (hiPSCs), Neuronal differentiation
Introduction
Angelman syndrome (AS) is a severe
neurodevelopmental disorder characterized by intellectual
disability, developmental delay, speech impairment,
seizures and ataxia that does not enable the patients to
live in an independent manner 1,2
. AS is a rare disease,
being present in one in 12,000 - 20,000 of the population 1,2,3
. AS is caused by loss of function of the maternally
inherited copy of the UBE3A imprinted gene 4. Phenotype
severity is connected with the type of mutation, with the
full deletion of chromosome 15q11-13 the most severe,
while point mutations in UBE3A are less severe 5. In most
tissues, UBE3A is biallelically expressed, but in the brain
and particularly in neurons, the paternally derived UBE3A
gene is silenced, and only the maternally inherited copy
remains active 6.
Despite a clear understanding of the disease-causing
events in AS, there are currently no AS-specific systematic
treatments for patients 1,7
.
Nevertheless, since the paternal allele of UBE3A is intact
but epigenetically silenced in neurons, the prospect that
AS could be treated by activating this silenced allele to
restore functional UBE3A protein has been raised 8.Regarding this possibility, several groups have
attempted to restore UBE3A expression by direct gene
therapy or by un-silencing the paternal allele 9. Meng et al
discovered that the use of modified ASOs against Ube3a-
ats was a promising therapeutic approach for AS 1.
However this study was conducted in a mouse model for
AS and whether UBE3A-ATS downregulation is
achievable using this approach in humans needs to be
tested in tractable and appropriated human cellular
system, such as, for example, iPSCs.
Regarding their unique features, induced pluripotent stem
cells (iPSCs) brought high prospects into the biomedical
field due to their potential applications in disease
modelling, drug and toxicity screening, patient-tailored
therapies and engineered tissues, making possible the
investigation of disease mechanisms, as well as to test for
potential therapeutics 10,11,12,13
.
In particular, the advent of iPSC technology allows for the
generation of patient-specific nervous tissue, which can be
used to model a variety of neurological disorders 14
.
In 2010, Chamberlain and his collaborators were able to
create iPSCs models for AS and Prader–Willi Syndrome
(PWS). Nevertheless, these studies did not show very
detailed analysis of the imprinting status. Thus, imprinting
of UBE3A during neuronal differentiation from iPSCs
remains unknown 15
. In 2017, Fink and his collaborators
were able to generate iPSC-derived neurons from AS
patients and healthy control subjects to examine the
maturation of neuronal and synaptic activity in these cells.
However, the authors did not address when and in which
cells UBE3A silencing occurred and how this correlates
with the timing of the defects they report 16
. It will be
important to attempt different neuronal differentiation
protocols to explore the full capacity of iPSC technology to
study Angelman syndrome. Based on this previous
reported data, the first goal of this work was providing a
robust disease modelling system of Angelman Syndrome,
through iPSCs neural differentiation with subsequent
phenotypic characterization of the defects in AS hiPSC-

2
derived neurons based on neuronal identity. The second
goal was the determination of the time and cell specificity
for paternal UBE3A silencing during dual SMAD inhibition
neurogenesis of hiPSCs.
Materials and Methods
Cell line
The iPSCs cell lines used in this project, WT-E and AS-D were
reprogrammed from skin fibroblasts obtained either from a
healthy individual or from an Angelman Syndrome patient,
respectively. AS patient-derived iPSCs and WT patient-derived
iPSCs were generated using lentiviral vectors encoding the
reprogramming factors, Oct4, Sox2,Klf4 and Myc 17
.
Cell culture
Human iPSCs were thawed and cultured in mTeSR™1
(STEMCELLTM
Technologies), on Matrigel® (Corning®) coated
plates. Medium was changed daily and cells were passaged
when they were near 60 to 75% confluency, using EDTA
(InvitrogenTM
) dissociation buffer 0.5mM (diluted in PBS).
Neural induction of human iPSCs
When hiPSCs cultures were nearly the 90-100% of confluence
neural induction was performed by using N2B27 medium. The
culture medium is composed by 50% (v/v) of N2 medium and
50% v/v of B27 medium. N2 medium consists in
DMEM/F1(1:1)+Glutamax (Gibco®) supplemented with 1% (v/v)
N-2 Supplement (Gibco®), 1.6 g/L of glucose (Sigma), 1% v/v
PenStrep and 20 μg/mL Insulin (Sigma). B27 medium was
formulated with Neurobasal® Medium (Gibco®) supplemented
with 2% of B-27® Supplement (Gibco®), 2 mM of L-glutamine
(Gibco®) and 0.5% of PenStrep. From day 0 to day 12 N2B27
medium was supplemented with 10 μM of SB-431542
(Stemgent™) and 100 nM of LDN-193189 (StemMACSTM
).
Neuronal differentiation of human iPSCs
At day 12, human neural progenitors were passaged using EDTA
(0.5 mM) and were re-plated in a split ratio of 1:3 into poly-L-
ornithine (15 μg/mL; Sigma)-treated and Laminin (20 μg/mL,
Sigma) coated plates. Between days 14 to 16, N2B27 medium
was supplemented with bFGF-Basic fibroblast growth factor (10
ng/mL, Peprotech). At day 19, cells were again passaged by
using EDTA, into new laminin-coated wells, in a split ration of 1:3.
The medium was changed every two days, without the addiction
of any small molecule or any factor. At day 27, cells were split
with accutase and plated into laminin-coated wells at a density of
100.000 cells/cm2 (300.000 cells per 12-well plate). The N2B27
medium was replaced every two days until day 70. At day 35 the
medium was replaced by the Maturation N2B27 that contains
some important neurotrophic factors that are essential for the
neuronal maturation process. Maturation N2B27 was formulated
with N2B27 that was supplemented with cAMP (0.5 mM, Sigma),
Ascorbic Acid (0.2 mM, Sigma) and BDNF+GDNF (20 ng/mL,
Peprotech). Until day 80, 50 % of the medium was changed every
two days and cells were also supplement with laminin during this
stage of the neuronal differentiation.
Flow cytometry
The first step of this procedure was the removal of the
exhausted medium from each well and then the cells were
washed with 1 mL of PBS (Corning®). Afterwards, each well was
incubated with 800 µL of accutase for 7 minutes at 37 ºC. The
inactivation of accutase was performed by the addition of washing
medium, being all the cells collected in a Falcon tube. The
samples were then centrifuge for 4 min at 1500 xg, the
supernatant was discarded and the pellet was resuspended with
2% PFA in PBS. The samples were stored at 4ºC.
Intracellular Staining: The samples previously stored in 2%
(w/v) PFA were centrifuged (HERMEL Z 300 K) during 3 min at
1500xg and then washed twice with 1% (v/v) normal goat serum
(NGS, Sigma). Eppendorf tubes were initially coated with 1% (v/v)
of BSA (InvitrogenTM
) in PBS for at least 15 min. Afterwards, the
cells were re-suspended in 3% (v/v) NGS and at least 5 x 10⁵
cells per condition were transferred for pre-coated Eppendorf
tubes (BSA was first removed). After transferring the same
number of cells per condition, Eppendorf tubes were centrifuged
at 1,500xg during 3 min. Then the incubation with 1:1 of 3% (v/v)
NGS and 1% (w/v) saponin (Sigma) were performed during 15
min at room temperature, for cell membrane permeabilization.
Next, cells were washed with 3% NGS and the pellets of negative
controls were re-suspended in 3% (v/v) NGS only while the others
were re-suspended with the primary antibody (in 3% NGS), during
1h at room temperature. Cells were then washed twice with 1%
(v/v) NGS and incubated in the dark, during 30 min, with the
secondary antibody. After incubation, the last washing procedure
was performed, and the cells were re-suspended in PBS and
transferred for FACS tubes. Afterwards the samples were
analyzed in FACSCaliburTM
flow cytometer (BD Biosciences®)
and the results obtained were analyzed using Flowing Software 2.
The following antibodies were used for flow cytometry: Oct4
(Milipore; 1:150), Sox2 (Sigma; 1200) and Goat anti-rabbit IgG
Alexa Fluor – 488 (Life technologies; 1:500)
Surface marker Staining: The samples previously stored in 2%
(w/v) PFA were centrifuge during 3 min at 1500xg and then
washed with 2 mL of FACS buffer (4% (v/v) FBS (ThermoFisher)
in PBS). Then, approximately 5 x 10⁵ cells per condition were re-
suspended in 100 µL of FACS Buffer, including the negative
controls. The primary antibodies were added in the recommended
concentration in all of the samples with the exception of the
negative controls and incubated for 15 min at room temperature,
in the dark. Afterwards, the cells were washed twice with PBS
and then re-suspended in FACS buffer. Then, the incubation with
the secondary antibodies was performed, for 15 minutes, in the
dark. Finally, the cells were washed twice with PBS, re-
suspended in 300 µL of FACS Buffer and transferred for FACS
tubes. Afterwards the samples were analyzed in FACSCaliburTM
flow cytometer (BD Biosciences®) and the results obtained were
analyzed using Flowing Software 2. The following antibodies
were used for flow cytometry: Tra-1-60 (PE-conjugated,
Miltenyi Biotec; 1:10), SSEA-4 (PE-conjugated, Miltenyi Biotec;
1:10), and Goat anti-rabbit IgG Alexa Fluor – 488 (Life
technologies; 1:500)
Immunocytochemistry after intracellular staining
The culture wells were washed with PBS and then the cells were
fixed with 4% (v/v) PFA during 20 minutes. Afterwards, the cells
were washed twice with 1 mL/well of PBS and then incubated
with blocking solution (10% (v/v) FBS and 1% (v/v) Triton, in PBS)
overnight or in alternative left for 60 minutes at room temperature.
Primary antibodies were diluted in staining solution (5% (v/v) NGS
and 0.1% (v/v) Triton, in PBS), added to the culture wells and left
to incubate at 4ºC for 120 minutes. Afterwards, the cells were
washed twice with 1 mL/well of PBS and then the secondary
antibodies were also diluted in staining solution and incubated
with cells during 60 minutes in the dark, at room temperature. The
cells were washed 3 times with 1 mL of PBS/ well with the
purpose of removing the excess of secondary antibody and were
left to incubate with 400 µL/well of 4’,6-diamidino-2-phenylindole
(DAPI), a fluorescent stain that binds to DNA, (diluted 1:10000 in
NaHCO3; Sigma-Aldrich) during 4 minutes in the dark, at room
temperature. Finally, cells were washed with PBS to remove any
DAPI crystals and left with PBS for further observation under
fluorescence optical microscope (Leica Microsystems CMS
GmbH, model DMI3000 B) or confocal microscopy (Leica TCS

3
SP5 laser scanning microscope). For confocal observation, the
coverslips were taken and by using Moviol, a mounting medium,
they were assembled on blades. The images were treated using
the Fiji-ImageJ software. The following antibodies were used
for intracellular immunocytochemistry: Primary antibodies:
Pax6 (Covance, 1:400); Nestin (R&D, 1:400); Sox2 (Sigma,
1:200); β-III-tubulin (Tuj1, Covance, 1:4000); Glial Fibrillary Acidic
Protein (GFAP, abcam, 1:100); NeuN (Cell Signaling
Technology®, 1:200), UBE3A (Novus Biologicals 1:100); GAD65
(milipore, 1:100);VGAT (Santa Cruz, 1:100). Secondary
antibodies: Goat anti-mouse IgG Alexa Fluor – 488/546 (1:500);
Goat anti-rabbit IgG Alexa Fluor – 488/546 (1:500).
Quantitative real-time PCR (RT-qPCR)
Total RNA was isolated from cells at different stages of neural
commitment (day 0, 17,28,37,64 and 80). cDNA was subjected to
qPCR with iTaqTM SYBR® Green Supermix (Bio-Rad) in a ViiA7
Applied Biosystems machine according to the manufacturer’s
instructions for PAX6, NANOG, Oct4, NESTIN, β-III-tubulin
(TUJ1), MAP2, UBE3A, SNORD115, GAD65, GAD67, VGLUT1
and GAPDH). PCR reactions were run in duplicate, normalized to
the housekeeping gene GAPDH and results analyzed in
QuantStudioTM
Real-Time PCR Software.
RNA isolation from Adherent cells (TRIzol Reagent): To start
this procedure it was necessary to remove the N2B27 medium
from the cultured cells and then was added 1 mL of TRIzol
Reagent (NZYtech) directly to the cells and finally the
homogenized sample was incubated for 5 minutes at room
temperature to allow complete dissociation of the nucleoprotein
complex. Afterwards, the cell suspension was transferred to an
Eppendorf tube, after pipetting up and down to destroy cell
aggregates. If it was not intended to proceed with the procedure
at the moment, the sample should be stored at – 80ºC until further
use and thawed immediately before to proceed with the protocol.
Then 0.2 mL of Chloroform per mL of TRIzol Reagent was added
and after the addition the Eppendorf tube was shacked vigorously
for 15 seconds. Afterwards, each sample was incubated for 2-3
minutes at room temperature and then centrifuged at 12000xg for
15 minutes at 4 ºC. Next, the aqueous phase that was formed
was removed carefully avoiding the drawing of any of the
interphase of the organic layer into the pipette and placed into a
new Eppendorf tube. After that, 1 µL of Glycogen Blue (15 µg/ µL,
InvitrogenTM
) was added, functioning as carrier to the aqueous
phase. Next, 0.5 mL of 100 % Isopropanol was added to the
aqueous phase and the samples were incubated for 10 minutes
at room temperature and then centrifuged at 12000 xg for 10
minutes at 4 ºC. Afterwards, the supernatant was discarded and
washed with 1 mL of cold 75 % (v/v) Ethanol. The samples were
vortex briefly and then centrifuged at 7500 xg for 5 minutes at 4
ºC. Then the supernatant was discarded and the RNA pellet was
kept to air dry for 10 minutes and re-suspended in 30 µL of
RNase-free water by pipetting the solution up and down in order
to homogenize the cell suspension. Finally, the samples were
quantified in Nanodrop 2000 (Thermo Scientific) and stored at -80
ºC until be used for the intended downstream application.
DNase Treatment of RNA samples: The first step of this
procedure was the addition of RNase-free water to a final volume
of 25 µL and 5 µg of RNA, to each Eppendorf tube. Then was
also added to each Eppendorf tube, 25 µL of DNase I mix2x,
according to the manufacturer’s instructions. Afterwards, the
samples were incubated for 30 minutes at 37 ºC (Sanyo
UNCUBATOR). Next, were added to each tube 5 µL (0.1x
volume) of 3M Sodium Acetate (pH: 5.5) and 1 µL of Glycogen
Blue. Then the precipitation occurred by adding to each sample
150 µL (3x volume) of 100 % Ethanol and next each tube was
incubated at -80 ºC for at least 30 minutes. Afterwards, all the
samples were centrifuged for 30 minutes at 13000 xg at 4 ºC, the
supernatant discarded and the pellet washed with 1 mL of cold 70
% Ethanol. Then, a spin was made to each tube for 5 minutes at
4 ºC , the supernatant discarded and pellet was kept to air dry for
15 minutes and re-suspended in 10 µL of RNase-free water by
pipetting the solution up and down in order to homogenize the cell
suspension. Finally, the samples were quantified in Nanodrop
and stored at -80 ºC until use.
cDNA synthesis: cDNA synthesis was performed by using
Transcriptor High Fidelity cDNA synthesis Kit (Roche) according
to manufacturer’s instructions. This procedure started with the
addition at each 0.2 mL tube (frilabo) 500 ng RNA and RNase-
free water up to 9.4 µL. Then was added to each tube, 2 µL of
random primers (vial 6) and the tubes were left to incubate at 65
ºC on thermocycler (Applied Biosystems, Veriti 96 well Thermal
Cycler) and cooled on ice for at least 5 minutes. Next was added
to each Eppendorf tube 8.6 µL of RT mixture. Afterwards all the
tubes were placed on thermocycler and incubated at 29 ºC for 10
minutes, then at 48 ºC for 60 minutes and finally at 58 ºC for 5
minutes. Then, all the tubes were stored at -20 ºC. Afterwards all
the tubes were placed on thermocycler and incubated at 29 ºC for
10 minutes, then at 48 ºC for 60 minutes and finally at 58 ºC for 5
minutes. Then, all the tubes were stored at -20 ºC.
Combined Bisulfite Restriction Analysis (COBRA)
DNA samples (500 ng) were bisulfite converted using the EZ DNA
Methylation Gold Kit (Zymo Research) following manufacturer’s
guidelines. Afterwards, bisulfite treated DNA was amplified by
nested PCR. The first amplification cycle conditions were 94ºC for
5min, then 35 cycles: 94ºC for 50sec, 51ºC for 60sec, 68ºC for
60sec, then 68ºC for 10min. Afterwards, 2 μL were then diluted
into a fresh 50 µl reaction for the second amplification cycle which
conditions were 94ºC for 5min, then 25 cycles: 94ºC for 50sec,
51ºC for 60sec, 68ºC for 60sec, then 68ºC for 10min. For
COBRA, PCR products were purified from enzymatic reactions
using the NZYGelpure kit (NZYTech) and then submitted to a
restriction enzyme digestion using the FastDigest Bsh1236I
restriction enzyme (ThermoScientific), to distinguish methylated
from unmethylated alleles based on the original status of the
CGCG sequence, according to the manufacturer’s instructions,
but increasing the digestion time to 1 hour. Digestion products
were separated on a 2% (w/v) agarose gel in 1X TAE in the
presence of the 1Kb Plus DNA ladder during approximately 20
minutes at 70 v. Digital images were obtained using the
Chemidoc XRS+ system (BioRad) and analyzed using the Image
Lab 5.2 software (BioRad).
Statistical analysis
Results are present as standard error of the mean (SEM) and the
statistical analysis was performed using two-tailed nonparametric
tests, as t-test for independent samples. When statistical analysis
was applied, at least two independent samples were evaluated. A
p-value less than 0.05 were considered statistically significant.

4
Results and Discussion Characterization of Angelman-derived and control
iPSCs
To demonstrate the pluripotency state of both control and
Angelman-derived iPSC lines, a flow cytometry analysis
was performed for the main pluripotency markers (SSEA4
and TRA-1-60 - surface markers and OCT4 and SOX2 -
intracellular markers). As expected, both control and
Angelman-derived iPSCs expressed these four markers in
the majority of the cells (always over 80% or more) as
determined by flow cytometry-quantitative analysis (figure
1). Taken together, these results indicate a pluripotent
state of these iPSC populations before initiation of the
neural commitment protocol.
Neuronal Differentiation
The neuronal differentiation procedure was performed
using the dual-SMAD inhibition protocol, combining both
inhibiting small molecules, SB-431542 and LDN-193189,
with N2B27 medium, which has been proven to be an
efficient protocol for inducing hiPSCs into PAX6+ neural
progenitors generating cells characteristic of central
nervous system (CNS) 10,18,19
. To start this procedure cells
need to be maintained in a pluripotent state until they
reached near 100 % of confluence. At day 0, N2B27
medium was added in combination with the two small
molecules, LDN and SB until day 12. Between days 13 to
16, N2B27 medium complemented with bFGF was used
(figure 2I). bFGF is a growth factor with the ability of
promoting proliferation of neural progenitors and thus
allowing the formation of neuroepithelial rosettes that
mimic the process of neural tube formation in vivo and
appear after replating in laminin coated surfaces 20
.
Generation of patient-specific neural progenitors
In this section, the aim was to confirm the expression of
the neuroectoderm and specific differentiation markers by
RT-qPCR and immunofluorescence (IF) staining from day
0 to day 37. In order to verify qualitatively the formation of
neural progenitors along the neural induction, IF was
performed for different markers (figure 2II (A-H)). Figure
2II (A, B) showed that iPSCs were able to differentiate
towards neuroectoderm as it was confirmed by the
expression of PAX6 and NESTIN, which are markers
mainly expressed in the early stages of neural induction.
Around day 17, it was possible to identify neural rosettes
staining for SOX2, which is a neural progenitor (NPs)
marker (figure 2II (C, D)). In addition, TUJ1 was expressed
since day 28 together with a visible reduction of PAX6, at
this stage (figure 2II (E- H)).
Likewise, after peaking during the initial stage of
commitment, expression of typical neural markers (PAX6
and NESTIN) declined during further differentiation and a
progressive appearance of the neuronal marker TUJ1
starts to occur. It was also possible to see that comparing
both control and Angelman-derived cell lines, that this one
presents significantly more cell density along all the
differentiation process with more proliferative capacity in
comparison with control. The figure 2III illustrates the gene
expression profile of some markers namely OCT4, a
marker of pluripotency, the typical progenitor markers
PAX6 and NESTIN and the neuronal marker TUJ1. RT-
qPCR analysis revealed expression of OCT4 mainly at
day 0, as expected since during the neural commitment
protocol cells start to acquire a more committed
phenotype, losing the pluripotent capacity and
consequently, the expression of pluripotency genes 21
.
RT-qPCR results also showed that both cell-lines WT-E
and AS-D expressed neural markers, such as PAX6 and
NESTIN and the neuronal marker for newborn immature
neurons TUJ1, which starts to arise at day 17 and more
pronouncedly around day 28 to 37.
Taking together, the results obtained for these markers by
IF (figure 2II) and the expression profiles acquired by RT-
qPCR (figure 2III) proved that the neural induction was
well succeeded, since results for both cell lines were very
similar and coherent with previously obtained results.
Figure 1: Expression of the pluripotency intracellular and extracellular markers: SSEA-4, TRA-1-60, OCT4 and SOX2 in I- control iPSCs (WT-E) and II- Angelman-derived iPSCs (AS-D). The quantitative results represent the positively stained percentage of cells analysed by flow cytometry (FC). The red area in each FC graph represents the negative control and the blue area represents the stained cells.

5
Neuronal maturation of control and Angelman-derived
neurons
Neuronal maturation begun at day 35 and finished at day
80 with the replacement of N2B27 medium by the
Maturation N2B27, that contains some important
neurotrophic factors (BDNF, GDNF, cAMP and ascorbic
acid) that are essential for the neuronal maturation
process. The purpose of this stage was to confirm if
neuronal maturation was occurring in an efficient manner
and if there were significant differences in morphology,
proliferation and expression of markers characteristic of
maturing neurons, either for control and Angelman-derived
neurons. For this purpose, several IF staining analysis and
expression analysis by RT-qPCR were performed from
day 0 to day 80. RT-qPCR analysis revealed an increase
in expression of MAP2, along the neuronal differentiation
process, which started to appear at day 17, but raised
from day 28, with a more pronounced, but not statistically
significant, increase in control in comparison with
Angelman-derived neurons. RT-qPCR results suggested a
majority of Glutamatergic neurons for Angelman-derived
neurons, since expression of VGLUT1 is strongly
upregulated only for AS-D at day 64 and day 80. Instead,
the control WT-E cell line showed an increase of GAD65
and GAD67 expression compared to the AS-D neurons,
consistent with the presence of a majority of GABAergic
neurons in the WT-E line (figure 3II). Consistent with RT-
qPCR expression, it was possible to see that on day 64,
the neuronal cells were prevalently GAD65 positive in
control in comparison with Angelman-derived neurons in
which the expression is absent for this marker (figure 3I
(A, B)). The same behavior can be observed for the VGAT
staining at days 64 and 80, in which a substantial fraction
of neurons were positive for VGAT at day 64 in control
comparatively to a decreased and more heterogeneous
expression of this marker in Angelman-derived neurons
(figure 3I (C, D)). In addition, there was a significant
increase in expression of this marker at day 80 that was
only detectable in control-derived neurons (figure 3I (E,
F)). In contrast, previous studies by Fink et al did not
showed significant differences in terms of glutamatergic or
GABAergic neuron proportions, between control and AS
cultures 16
. Previous studies showed that GABAergic
inhibitory neurons appear to be more sensitive to
pathological factors (e.g. ischemia, epilepsy and
schizophrenia) in comparison with glutamatergic neurons 22
. Regarding that, down-regulation of GABAergic neurons
in the Angelman differentiation could be due to an
unknown brain dysfunction triggered by this disease which
might result in the functional impairment of these
GABAergic neurons. Future work must also be focused in
the performance of several tests to confirm this
hypothesis.
Figure 2: I- Schematic view of neural and neuronal commitment steps: dual-SMAD inhibition by adding to the N2B27 medium SB – SB431542 and LDN – LDN193189 that inhibits Activin and Nodal and BMP pathways, respectively. II - Confocal microscopy images of immunofluorescence staining for control (WT-E) and Angelman (AS-D) derived from human iPSCs at different stages of the neural commitment protocol using N2B27 medium and laminin-coated surfaces. A, B - At day 12 of differentiation, immunostaining analysis was performed for the typical neural progenitor markers Pax6 and Nestin either in control and Angelman-derived cells (scale bars: 50 µm). C, D- At day 17 cells were marked for Sox2 to identify neural rosettes either in control and Angelman-derived cells (scale bars: 50 µm). E, F, G, H - At days 28 and 37 cells were marked also with neural marker Pax6 and the neuronal marker Tuj1 with evident Tuj1- positive neuronal projections either in control and Angelman-derived cells (scale bars: 50 µm). Total cells were stained with DAPI and the images obtained with immuno- and DAPI staining were merged together (Scale bars – 50 μm). III- Expression of pluripotency marker OCT4, typical neural markers (NESTIN and PAX6) and of neuronal marker TUJ1, accessed by quantitative real-time PCR (q-RT PCR) at different stages of neural differentiation. Results are presented in this figure as standard error of the mean (SEM) and were all normalized for GAPDH housekeeping gene. * indicate statistical significance (P-value < 0.05)
Rosettes NSC

6
UBE3A expression during neuronal differentiation
It is widely known that the paternal UBE3A allele will
eventually become silenced in neurons. However, it is not
known when this event occurs during development. For
our neuronal differentiation to be a good model for AS, the
paternal UBE3A allele should gradually be repressed
along the process. The rationale of this section was to
understand whether within the time-frame of our study,
paternal UBE3A will become silenced in neurons. To
further demonstrate the robustness of this system as a
model for Angelman syndrome, neuronal identity and
imprinted expression of the Angelman locus in the
generated cells were explored. Also, further analyses
regarding the evaluation of the methylation status of PWS-
IC region and expression profiles of UBE3A and
SNORD115 during neuronal differentiation were executed.
Evaluation of methylation status of PWS-IC region by
COBRA
The methylation pattern of the PWS-IC region of
chromosome 15q11-q13 (figure 4I) was studied in Control
and Angelman-derived cells at several timepoints (days 0,
37 and 80) by COBRA. Angelman-derived cells (AS-D)
only displayed a band correspondent to the unmethylated
paternal allele throughout neuronal differentiation. In
contrast, for control cells (WT-E) from the healthy donor at
any of the stages analyzed we could detect several bands
that correspond to fully methylated (~100 bp), a weak
partially methylated (~210 bp) and unmethylated (~340
bp) alleles (figure 4II). The unmethylated band might
correspond to the paternal allele, while both fully and
partially methylated bands could correspond to the
maternal allele. A second biological replicate for both iPSC
lines gave the same result (data not shown). The results
obtained were in accordance with the ones obtained by
Pólvora et al, in control and Angelman-derived iPSCs 17
.This analysis revealed that the imprinting status was
maintained during the neuronal differentiation in both iPSC
lines, which suggests that this could be a robust disease
modelling platform to study Angelman syndrome.
Figure 4: I - Genomic imprinting of chromosome 15q11-q13 and epigenetic silencing of UBE3A in neurons. In neurons, the paternal long noncoding RNA extends to and overlaps UBE3A as an antisense (UBE3A-
ATS) with correlated silencing of the paternal UBE3A allele. In neurons from AS 15q11-q13 deletion patients, there is no active copy of UBE3A due loss of the maternal allele. Blue rectangles represent imprinted transcripts that are paternally expressed, red rectangles represent imprinted transcripts that are maternally expressed and black rectangles represent the repressed alleles of imprinted genes. White circles– unmethylated PWS-IC; black circles –methylated PWS-IC. Adapted from
23 II -
Characterization of the imprinting status of the chromosome 15q11-q13 region PWS-IC COBRA for WT-E (control) and AS-D in days 0, 37 and 80. White circles– unmethylated band; half black circles – partially
methylated band; black circles – fully methylated band.
Paternal UBE3A is partially repressed during in vitro
neurogenesis of Angelman-derived iPSCs
To check when the paternal UBE3A allele becomes
silenced during the differentiation protocol and in which
cells this occurs, we perform IF and RT-qPCR analysis
from day 0 to day 80, to study UBE3A expression in both
normal and AS. RT-qPCR analysis for SNORD115 was
also performed since this gene is supposed to be
expressed only in neurons and to match the expression of
the UBE3A-ATS, which is involved in the silencing of the
paternal UBE3A gene.
Figure 3: I - Confocal microscopy images of immunofluorescence staining for control (WT-E) and Angelman (AS-D) derived from human iPSCs at different stages of the neural commitment protocol using N2B27 medium and laminin-coated surfaces. A, B - At day 64, immunostaining analysis was performed for the detection of GABAergic interneurons (evident GAD65-positive neuronal population) and DAPI either in control and Angelman-derived cells (scale bars: 50 µm and 100 µm, respectively). C, D, E, F - At days 64 and 80 cells were marked with DAPI and the GABAergic marker, VGAT either in control and Angelman-derived cells (scale bars: 50 µm). Total cells were stained with DAPI and the images obtained with immuno- and DAPI staining were merged together (Scale bars – 50 μm and 100 µm). II - Expression of maturation markers (MAP2, VGLUT1, GAD65 and GAD67) accessed by quantitative real-time PCR (q-RT PCR) at different stages of neural differentiation. Results are presented in this figure as standard error of the mean (SEM) and were all
normalized for GAPDH housekeeping gene. * indicate statistical significance (P-value < 0.05)

7
RT-qPCR analysis revealed an increase in UBE3A
expression along the neuronal differentiation process, with
a more pronounced increase in control in comparison with
Angelman-derived neurons, as expected since control has
two UBE3A copies, while AS only have one. As for AS-D,
the same expression profile was maintained low along the
differentiation. At day 80, UBE3A was not totally
repressed, suggesting that UBE3A silencing did not yet
occur at the last stage of neuronal differentiation used in
our study (figure 5II).
RT-qPCR results also showed that on day 0, there was no
expression of SNORD115 gene for both cell lines, as
expected since SNORD115 expression is restricted to
iPSC-derived neurons (figure 5II) 15
. SNORD115
expression started to increase around day 28 of the
neuronal differentiation reached its peak at day 37, for the
control. Unexpectedly, the expression of SNORD115 was
found markedly reduced in AS-D from day 37 of
differentiation when compared to control. After day 37,
SNORD115 expression undergoes a gradual decrease
that is maintained until day 80, for the control. Indeed, the
expression profiles obtained in later stages of neuronal
differentiation were not in accordance with previous
studies that showed an up-regulation of this gene upon 70
days of differentiation 15
. The reasons behind such a
difference are difficult to explain. One hypothesis behind
such a difference might be that SNORD115 levels of
expression are higher in GABAergic than glutamatergic
neurons. Indeed, glutamatergic neurons are less frequent
in AS-D neuronal cultures (figure 3II). We then analyzed
UBE3A expression during neuronal differentiation by IF.
Expression was found to be low at day 17, a phase where
most cells express high levels of PAX6 (figure 5I (A, B).
Interestingly, some UBE3A positive neural progenitors
could be seen in control, which corroborates the
expression by RT-qPCR for UBE3A at this stage, in which
it was starting to rise and was more evident in control than
Angelman-derived neural progenitors (figure 5II).
From day 37, UBE3A expression starts showing significant
differences in the pattern of expression between the two
cell lines (figure 5I (C, D)). In WT-E, there were a higher
number of positive neurons for UBE3A compared to the
AS-D line in which the expression of UBE3A increased
slightly at this stage (figure 5I (E, F)). At day 64, is
possible to see a significant increase of UBE3A
expression in control cells. UBE3A marked cells always
co-localized NeuN expression, indicating these cells are
neurons. A homogeneous positive neuronal population for
UBE3A was seen for control neurons. In Angelman-
derived neurons, UBE3A staining was much fainter than
control neurons, although it is still present to some extent
meaning that UBE3A repression might start to occur, but
is not complete at this stage (figure 5I (G, H)).
Another aspect that can be dissected to demonstrate the
differences between AS and Control differentiation
protocols would be the presence of glia cells, namely
astrocytes, that were also detected by staining with glial
fibrillary acidic protein (GFAP). Regarding that, there is an
evident difference in control and Angelman-derived cells
since in control the majority of the population presents no
GFAP-positive cells, while in AS-D GFAP-positive
astrocytes are visible particularly in certain regions of the
culture. In addition, there is no co-localization between
UBE3A and GFAP staining (figure 6 (A, B)). On day 80,
we were able to see a significant increase in UBE3A
expression in the control cell line compared to day 37,
which is coherent with RT-qPCR results at this stage
(figure 5II). In the case of the AS-D cell line, the population
of UBE3A negative neurons was even more noticeable
since the majority of neurons present in AS-D at this stage
are NeuN positive and UBE3A negative, meaning that
imprinting that result in the inactivation of UBE3A might
have occurred in most of the neurons. However, some
Figure 5: I- Confocal microscopy images of immunofluorescence staining for control (WT-E) and Angelman (AS-D) derived from human iPSCs at different stages of the neural commitment protocol using N2B27 medium and laminin-coated surfaces. A, B, C, D - At days 17 and 37 of differentiation, immunostaining analysis was performed for the typical neural progenitor marker Pax6 and for UBE3A either in control and Angelman-derived cells (scale bars: 50 µm). E, F, G, H - At days 37 and 63 cells were marked with mature neuron marker NeuN and UBE3A either in control and Angelman-derived cells (scale bars: 50 µm). Total cells were stained with DAPI and the images obtained with immuno- and DAPI staining were merged together (Scale bars – 50 μm). II- Expression of UBE3A and SNORD115 accessed by quantitative real-time PCR (q-RT PCR) at different stages of neural differentiation. Results are presented in this figure as standard error of the mean (SEM) and were all normalized for GAPDH housekeeping gene. * indicate statistical significance (P-value < 0.05)
8
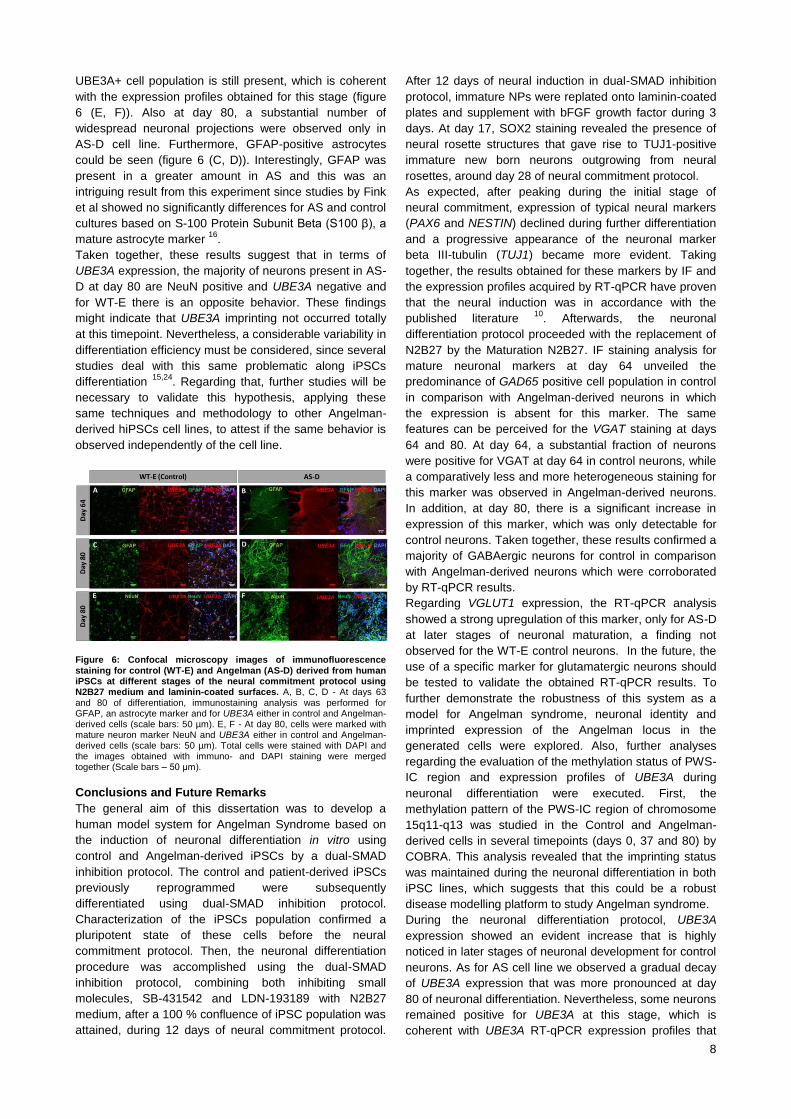
UBE3A+ cell population is still present, which is coherent
with the expression profiles obtained for this stage (figure
6 (E, F)). Also at day 80, a substantial number of
widespread neuronal projections were observed only in
AS-D cell line. Furthermore, GFAP-positive astrocytes
could be seen (figure 6 (C, D)). Interestingly, GFAP was
present in a greater amount in AS and this was an
intriguing result from this experiment since studies by Fink
et al showed no significantly differences for AS and control
cultures based on S-100 Protein Subunit Beta (S100 β), a
mature astrocyte marker 16
.
Taken together, these results suggest that in terms of
UBE3A expression, the majority of neurons present in AS-
D at day 80 are NeuN positive and UBE3A negative and
for WT-E there is an opposite behavior. These findings
might indicate that UBE3A imprinting not occurred totally
at this timepoint. Nevertheless, a considerable variability in
differentiation efficiency must be considered, since several
studies deal with this same problematic along iPSCs
differentiation 15,24
. Regarding that, further studies will be
necessary to validate this hypothesis, applying these
same techniques and methodology to other Angelman-
derived hiPSCs cell lines, to attest if the same behavior is
observed independently of the cell line.
Figure 6: Confocal microscopy images of immunofluorescence staining for control (WT-E) and Angelman (AS-D) derived from human iPSCs at different stages of the neural commitment protocol using N2B27 medium and laminin-coated surfaces. A, B, C, D - At days 63 and 80 of differentiation, immunostaining analysis was performed for GFAP, an astrocyte marker and for UBE3A either in control and Angelman-derived cells (scale bars: 50 µm). E, F - At day 80, cells were marked with mature neuron marker NeuN and UBE3A either in control and Angelman-derived cells (scale bars: 50 µm). Total cells were stained with DAPI and the images obtained with immuno- and DAPI staining were merged together (Scale bars – 50 μm).
Conclusions and Future Remarks
The general aim of this dissertation was to develop a
human model system for Angelman Syndrome based on
the induction of neuronal differentiation in vitro using
control and Angelman-derived iPSCs by a dual-SMAD
inhibition protocol. The control and patient-derived iPSCs
previously reprogrammed were subsequently
differentiated using dual-SMAD inhibition protocol.
Characterization of the iPSCs population confirmed a
pluripotent state of these cells before the neural
commitment protocol. Then, the neuronal differentiation
procedure was accomplished using the dual-SMAD
inhibition protocol, combining both inhibiting small
molecules, SB-431542 and LDN-193189 with N2B27
medium, after a 100 % confluence of iPSC population was
attained, during 12 days of neural commitment protocol.
After 12 days of neural induction in dual-SMAD inhibition
protocol, immature NPs were replated onto laminin-coated
plates and supplement with bFGF growth factor during 3
days. At day 17, SOX2 staining revealed the presence of
neural rosette structures that gave rise to TUJ1-positive
immature new born neurons outgrowing from neural
rosettes, around day 28 of neural commitment protocol.
As expected, after peaking during the initial stage of
neural commitment, expression of typical neural markers
(PAX6 and NESTIN) declined during further differentiation
and a progressive appearance of the neuronal marker
beta III-tubulin (TUJ1) became more evident. Taking
together, the results obtained for these markers by IF and
the expression profiles acquired by RT-qPCR have proven
that the neural induction was in accordance with the
published literature 10
. Afterwards, the neuronal
differentiation protocol proceeded with the replacement of
N2B27 by the Maturation N2B27. IF staining analysis for
mature neuronal markers at day 64 unveiled the
predominance of GAD65 positive cell population in control
in comparison with Angelman-derived neurons in which
the expression is absent for this marker. The same
features can be perceived for the VGAT staining at days
64 and 80. At day 64, a substantial fraction of neurons
were positive for VGAT at day 64 in control neurons, while
a comparatively less and more heterogeneous staining for
this marker was observed in Angelman-derived neurons.
In addition, at day 80, there is a significant increase in
expression of this marker, which was only detectable for
control neurons. Taken together, these results confirmed a
majority of GABAergic neurons for control in comparison
with Angelman-derived neurons which were corroborated
by RT-qPCR results.
Regarding VGLUT1 expression, the RT-qPCR analysis
showed a strong upregulation of this marker, only for AS-D
at later stages of neuronal maturation, a finding not
observed for the WT-E control neurons. In the future, the
use of a specific marker for glutamatergic neurons should
be tested to validate the obtained RT-qPCR results. To
further demonstrate the robustness of this system as a
model for Angelman syndrome, neuronal identity and
imprinted expression of the Angelman locus in the
generated cells were explored. Also, further analyses
regarding the evaluation of the methylation status of PWS-
IC region and expression profiles of UBE3A during
neuronal differentiation were executed. First, the
methylation pattern of the PWS-IC region of chromosome
15q11-q13 was studied in the Control and Angelman-
derived cells in several timepoints (days 0, 37 and 80) by
COBRA. This analysis revealed that the imprinting status
was maintained during the neuronal differentiation in both
iPSC lines, which suggests that this could be a robust
disease modelling platform to study Angelman syndrome.
During the neuronal differentiation protocol, UBE3A
expression showed an evident increase that is highly
noticed in later stages of neuronal development for control
neurons. As for AS cell line we observed a gradual decay
of UBE3A expression that was more pronounced at day
80 of neuronal differentiation. Nevertheless, some neurons
remained positive for UBE3A at this stage, which is
coherent with UBE3A RT-qPCR expression profiles that

9
showed a basal expression of this gene. In conclusion,
UBE3A is not totally repressed and UBE3A imprinting
might have started but was not completed by day 80 of
this neuronal differentiation protocol. To validate this
hypothesis, one approach would be the extension of this
neuronal differentiation until later stages of maturation to
discover if UBE3A decay was more evident. This
approach might be promising since this protocol can be
further extended, similar to what was done in the past by
Fernandes et al 10
, ensuring even more maturation of the
neurons. Moreover, we should also re-try nascent
transcript RNA FISH, an experiment that will be the
ultimate test to reveal whether UBE3A imprinting had or
not occurred.
Concerning SNORD115 expression, the expression
profiles obtained in later stages of neuronal differentiation
were not in accordance with previous studies that showed
an up-regulation of this gene upon 70 days of
differentiation 15
. Unexpectedly, the expression of
SNORD115 was found markedly reduced in AS-D from
day 37 of differentiation when compared to control. The
reasons behind such a difference are difficult to explain.
One hypothesis behind such a difference might be that
SNORD115 levels of expression are higher in GABAergic
than glutamatergic neurons which are strongly reduced in
AS-D neurons. Nevertheless, in the future, these analyses
must be repeated to acquire a more conclusive result, and
the expression profiles of UBE3A-ATS must also be tested
using a specific primer for this long non-coding RNA
transcribed in the antisense orientation and overlapping
with the UBE3A gene.
Another aspect that can be dissected to demonstrate the
differences between AS and Control differentiation
protocols would be the presence of glia cells, namely
astrocytes, that were also detected by staining with glial
fibrillary acidic protein (GFAP).
Angelman-derived cells revealed a considerable
population that presented GFAP-positive staining, which
was particularly high at later stages of the neuronal
differentiation protocol. As for the control, the majority of
cells presented GFAP- negative staining. In addition, there
is no co-localized staining for UBE3A either in control or
Angelman-derived cultures.
Since this behavior is noticed only in AS-D but not in
control cell line, this might be a specific feature of
Angelman syndrome. To confirm this hypothesis, could be
advantageous the implementation of this protocol using
other Angelman-derived iPSCs cell lines, and compare
again with the control to attest the authenticity of these
previously obtained results to better understand whether
these phenotypes are replicated.
Taken together, these results suggest that in terms of
UBE3A expression, the majority of neurons present in AS-
D at day 80 are NeuN positive and UBE3A negative and
for WT-E there is an opposite behavior. These findings
might indicate that UBE3A imprinting not occurred totally
at this timepoint since there is still some UBE3A
expression but a high amount of NeuN+ cells have already
inactivate UBE3A. Nevertheless, a considerable variability
in differentiation efficiency must be considered, since
several studies deal with this same problematic along
iPSCs differentiation 15,24
.Regarding that, further studies
will be necessary to validate this hypothesis, applying
these same techniques and methodology to other
Angelman-derived hiPSCs cell lines, to attest if the same
behavior is observed independently of the cell line.
Future work must also be focused on the functionality of
the generated neurons, since maturity of neural population
seems to be heterogeneous given the specific
arrangement and heterogeneity displayed in Angelman-
derived neurons during the neuronal differentiation
protocol. For that, electrophysiology analysis must be
performed to attest the synaptic activity pattern in both
cultures, particularly in the AS culture system.
Thus, this successfully human cell culture model for AS
could be used also to better understand the mechanisms
of the disease and develop distinctive tools for drug
discovery. More specifically, we can assess the treatment
of AS-neurons with modified antisense oligonucleotide
(ASOs) against UBE3A-ATS transcript and test for UBE3A
activation and phenotypic improvement. Such a strategy
might be useful to find suitable conditions to activate the
normally silent paternal allele of the UBE3A gene in order
to advance towards a future treatment for AS patients.
References
1. Meng, L. et al. Towards a therapy for Angelman syndrome by targeting a long non-coding RNA. Nature (2015). doi:10.1038/nature13975
2. Tan, W.-H. & Bird, L. M. Pharmacological therapies for Angelman syndrome. Wiener Medizinische Wochenschrift (2016). doi:10.1007/s10354-015-0408-z
3. Williams, C. a, Driscoll, D. J. & Dagli, A. I. Clinical and genetic aspects of Angelman syndrome. Genet. Med. (2010). doi:10.1097/GIM.0b013e3181def138
4. Margolis, S. S., Sell, G. L., Zbinden, M. A. & Bird, L. M. Angelman Syndrome. Neurotherapeutics (2015). doi:10.1007/s13311-015-0361-y
5. Sell, G. L. & Margolis, S. S. From UBE3A to Angelman syndrome: A substrate perspective. Frontiers in Neuroscience (2015). doi:10.3389/fnins.2015.00322
6. Bird, L. M. Angelman syndrome: Review of clinical and molecular aspects. Application of Clinical Genetics (2014). doi:10.2147/TACG.S57386
7. Wheeler, A. C., Sacco, P. & Cabo, R. Unmet clinical needs and burden in Angelman syndrome: A review of the literature. Orphanet Journal of Rare Diseases (2017). doi:10.1186/s13023-017-0716-z
8. Huang, H. S. et al. Topoisomerase inhibitors unsilence the dormant allele of Ube3a in neurons. Nature (2012). doi:10.1038/nature10726
9. Bi, X., Sun, J., Ji, A. X. & Baudry, M. Potential therapeutic approaches for Angelman syndrome. Expert Opin Ther Targets (2016). doi:10.1517/14728222.2016.1115837
10. Fernandes, T. G. et al. Neural commitment of human pluripotent stem cells under defined conditions recapitulates neural development and generates patient-specific neural cells. Biotechnol. J. (2015). doi:10.1002/biot.201400751
11. Fernandes, T. G., Rodrigues, C. A. V., Diogo, M. M. & Cabral, J. M. S. Stem cell bioprocessing for regenerative medicine. Journal of Chemical Technology and Biotechnology (2014). doi:10.1002/jctb.4189
12. Martin, P. E., Shaughnessy, E. M. O., Wright, C. S. & Graham, A. The potential of human induced pluripotent stem cells for modelling diabetic wound healing in vitro. 1629–1643 (2018).
13. Yamanaka, S. A Fresh Look at iPS Cells. Cell (2009). doi:10.1016/j.cell.2009.03.034
14. Onder, T. T. & Daley, G. Q. New lessons learned from disease modeling with induced pluripotent stem cells. Current Opinion in Genetics and Development (2012). doi:10.1016/j.gde.2012.05.005
15. Chamberlain, S. J. et al. Induced pluripotent stem cell models of the genomic imprinting disorders Angelman and Prader–Willi syndromes. Proc. Natl. Acad. Sci. (2010). doi:10.1073/pnas.1004487107
16. Fink, J. J. et al. Disrupted neuronal maturation in Angelman syndrome-derived induced pluripotent stem cells. Nat. Commun. (2017). doi:10.1038/ncomms15038

10
17. Pólvora-brandão, A. D., Joaquim, M. & Godinho, I. Loss of hierarchical imprinting regulation at the Prader-Willi/Angelman syndrome locus in human iPSCs. 1–41 (2018). doi:10.1093/hmg/ddy274/5068136
18. Pera, M. F. & Tam, P. P. L. Extrinsic regulation of pluripotent stem cells. Nature (2010). doi:10.1038/nature09228
19. Chambers, S. M. et al. Highly efficient neural conversion of human ES and iPS cells by dual inhibition of SMAD signaling. Nat. Biotechnol. (2009). doi:10.1038/nbt.1529
20. Zhang, S. C., Wernig, M., Duncan, I. D., Brüstle, O. & Thomson, J. A. In vitro differentiation of transplantable neural precursors from human embryonic stem cells. Nat. Biotechnol. (2001). doi:10.1038/nbt1201-1129
21. Shi, Y., Kirwan, P. & Livesey, F. J. Directed differentiation of human pluripotent stem cells to cerebral cortex neurons and neural networks. Nat. Protoc. (2012). doi:10.1038/nprot.2012.116
22. Liu, H., Li, F., Wang, C. & Su, Z. More sensitivity of cortical GABAergic neurons than glutamatergic neurons in response to acidosis. Neuroreport 27, 610–616 (2016).
23. Chamberlain, S. J. & Lalande, M. Angelman Syndrome, a Genomic Imprinting Disorder of the Brain. J. Neurosci. (2010). doi:10.1523/JNEUROSCI.1728-10.2010
24. Hu, B.-Y. et al. Neural differentiation of human induced pluripotent stem cells follows developmental principles but with variable potency. Proc. Natl. Acad. Sci. (2010).
doi:10.1073/pnas.0910012107