a desalination database for texas - home | texas water ... · a desalination database for texas ......
TRANSCRIPT

A Desalination Database for Texas
Prepared for Texas Water Development Board
Bureau of Economic Geology
Scott W. Tinker, Director John A. and Katherine G. Jackson School of Geosciences
The University of Texas at Austin Austin, Texas 78713-8924


A Desalination Database for Texas
Prepared for Texas Water Development Board
under
Contract No. 2004-483-021
Jean-Philippe Nicot, Steven Walden1, Lauren Greenlee2, and John Els
Initial Issue: October 2005 Revised: October 2006
(see Attachment I)
Bureau of Economic Geology Scott W. Tinker Director
John A. and Katherine G. Jackson School of Geosciences The University of Texas at Austin
Austin, Texas 78713-8924
1Steve Walden Consulting, Austin, TX 2Graduate student, Department of Civil Engineering, The University of Texas at Austin


iii
Table of Contents Table of Contents............................................................................................................... iii List of Figures ......................................................................................................................v List of Tables ..................................................................................................................... vi Glossary and Abbreviations.............................................................................................. vii Acknowledgments.............................................................................................................. ix 1 Executive Summary ..........................................................................................................1 2 Introduction.......................................................................................................................5
2.1 Overview of Other Recent Efforts .............................................................................5 2.2 Desalination Primer ...................................................................................................6
3 Methods.............................................................................................................................9
3.1 Sources of Information ..............................................................................................9 3.2 Methodology..............................................................................................................9
4 Results.............................................................................................................................11
4.1 Public Water System Facilities ................................................................................11 4.2 Future Plants ............................................................................................................26 4.3 Roadmap for Industrial Facilities.............................................................................28
5 Database Updates and Future Work ...............................................................................31
5.1 Update to Texas PWS Desalination Database .........................................................31 5.2 Exhaustive List of Industrial Desalination Operators..............................................32
6 References.......................................................................................................................33 7 Attachment List...............................................................................................................35 Attachment A: Database Description..................................................................................... Attachment B: Survey Form .................................................................................................. Attachment C: Overview of Recent Surveys .........................................................................
C.1 Review of Previous Studies...............................................................................C-1 C.2 Other Current U.S. Efforts at the State Level ...................................................C-2
Attachment D: Detailed Survey Results ................................................................................
D.1 Description of the Data Collection Process ......................................................... D-1 D.2 Revisiting Earlier Datasets................................................................................. D-15
Attachment E: Road Map for Survey of Industrial Facilities ................................................
E.1 Desalination in Industrial and Other Facilities......................................................E-2 E.1.1 Steam Generation ...........................................................................................E-2

iv
E.1.2 Beverage and Food Industry...........................................................................E-4 E.1.3 Ultrapure Water Needs ...................................................................................E-4
E.2 Semiquantitative Estimation of Desalination Output in Industrial Facilities........E-5 E.2.1 Steam Generation ...........................................................................................E-5 E.2.2 Beverage and Food Industry...........................................................................E-6 E.2.3 Ultrapure Water Needs of the Semiconductor and Pharmaceutical
Industries........................................................................................................E-7 E.2.4 Water Needs from Other Industries................................................................E-8
Attachment F: List of files on CD.......................................................................................... Attachment G: Useful Website Addresses............................................................................. Attachment H: Answers to Review Comments ..................................................................... Attachment I: List of Changes in Revision 1.........................................................................

v
List of Figures Figure 1-1. Design capacity and average production of the desalination units of the
19 facilities with the highest design capacity sorted by decreasing size..........2 Figure 1-2. Time-cumulative desalination design capacity and average production of
Texas PWS facilities ........................................................................................2 Figure 4-1. Design capacity and average production of desalination facilities above a
cutoff value of ~0.5 MGD sorted by decreasing size.....................................16 Figure 4-2. Design capacity and average production of desalination facilities below a
cutoff value of ~0.5 MGD sorted by decreasing size.....................................16 Figure 4-3. Total design capacity with and without blending of facilities above a
cutoff value of ~0.5 MGD sorted by decreasing size.....................................17 Figure 4-4. Total design capacity with and without blending of facilities below a
cutoff value of ~0.5 MGD sorted by decreasing size.....................................17 Figure 4-5. Map of desalination facilities showing design capacity..................................18 Figure 4-6. Time-cumulative desalination design capacity and average production of
Texas PWS facilities ......................................................................................19 Figure 4-7. Design capacity and average production of desalination facilities sorted
by startup year (log scale; 1981 through 1998) ..............................................19 Figure 4-8. Design capacity and average production of desalination facilities sorted
by startup year (log scale; 1998 through 2005) ..............................................20 Figure 4-9. Map of desalination facilities showing startup year........................................20 Figure 4-10. Map of desalination facilities showing desalination technique.....................21 Figure 4-11. Map of desalination facilities showing TDS of feedwater............................22 Figure 4-12. Feedwater TDS distribution ..........................................................................23 Figure 4-13. Map of desalination facilities showing feedwater origin ..............................23 Figure 4-14. Map of desalination facilities showing concentrate disposal method...........24 Figure 4-15. Capital costs of a few desalination facilities (not corrected for inflation) ....25 Figure 4-16. Comparison of capital costs and total design capacity..................................26 Figure 5-1. Simplified approach to a living desalination database....................................31 Figure A1. Screen captures of fields of database in Microsoft Access format............... A-2 Figure D1. Comparison of desalination design capacity compiled during this study
(y-axis) and Mickley’s study (2001) (x-axis)............................................ D-16 Figure E1. Regression plot showing relationship between power and desalination
capacity of selected power facilities.............................................................E-9 Figure E2. Crossplot of water use and power capacity for electrical utilities .................E-9

vi
List of Tables Table 1-1. Summary of results.............................................................................................1 Table 2-1. Summary of characteristics of major desalination technologies ....................... 7 Table 4-1. Characteristic summary of Texas desalination facilities with capacity
≥0.025 MGD................................................................................................... 11 Table 4-2. Desalination Public Water System facilities ≥0.025-MGD sorted by
desalination design capacity ........................................................................... 13 Table 4-3. Concentrate disposal method statistics............................................................ 24 Table 4-4. Facility capital cost statistics (total design capacity includes blending) ......... 25 Table 4-5. Future facilities................................................................................................ 27 Table D1. Initial working list for municipal facilities (Public Water Supply
Desalination Facilities provided by TCEQ). Facilities contacted but not on TCEQ list are added at the end of the table. ................................................. D-3
Table D2. Small desalination facilities from TCEQ list ................................................. D-8 Table D3. IDA inventory of Texas desalination facilities sorted by decreasing
capacity (from Wangnick, 2002). Municipal facilities have an orange (dark) background; power facilities have a yellow (light) background. Key is at bottom of table....................................................................................... D-9
Table D4. Summary of survey results........................................................................... D-14 Table D5. Comparison of results with those of Mickley’s study (2001)...................... D-15 Table E1. Electricity generation summary statistics......................................................E-10 Table E2. Inventory of electric utility power plants in Texas in 2000 using steam
process as primary mover. Utilities are sorted by company.. ......................E-10 Table E3. Inventory of nonutility electric power plants in Texas in 2000 using steam
process as primary mover. Utilities sorted by company. Key is below.......E-13 Table E4. Facilities described in both IDA and DOE/EIA inventories .........................E-15 Table E5. Texas refineries showing distillation capacity ..............................................E-16 Table E6. Bottling companies monitored by Texas Department of State Health
Services. List also includes ice packaging companies (about ¼ of all facilities) ......................................................................................................E-17
Table E7. Soft drink companies monitored by Texas Department of State Health Services ........................................................................................................E-20
Table E8. Breweries monitored by Texas Department of State Health Services ..........E-20 Table E9. Drug manufacturing companies monitored by Texas Department of State
Health Services ............................................................................................E-21 Table E10. Microelectronics facilities in Texas from IDA inventory ...........................E-25 Table E11. Selected semiconductor and electronics manufacturing companies in
Texas ............................................................................................................E-25
vii
Glossary and Abbreviations AFY: Acre-feet per year bbl: Barrel ED: Electrodialysis EDR: Electrodialysis reversal GCD: Groundwater conservation district GW: Groundwater iWUD: TCEQ water utility database search engine MGD: Million gallons per day MUD: Municipal utility district MW Megawatt NF: Nanofiltration PWS Public water system RFQ: Request for qualifications RO: Reverse osmosis RRC: Railroad Commission of Texas RWPG: Regional water planning group SW: Surface water TCEQ: Texas Commission for Environmental Quality TDHS: Texas Department of Health Services TDS: Total dissolved solids TWDB: Texas Water Development Board UF: Ultrafiltration UIC: Underground injection control WSC: Water Supply Corporation WUD: Water utility database WWTP: Wastewater treatment plant


ix
Acknowledgments The authors would like to thank all individuals and organizations that helped
make this work and this survey successful. The TCEQ staff, and, in particular, Tony
Bennett at the Water Supply Division, were instrumental in getting the study started by
providing us an initial list of desalination facilities. We also benefited from frequent
discussions with Jorge Arroyo, Team Leader at the Texas Water Development Board
(TWDB), and Hari Krishna, Contract Manager, also at the TWDB. We also gained from
useful discussions with Kevan Dekker, in charge of the desalination units of the chilling
station at The University of Texas at Austin. We are grateful as well to Lana Dieterich for
her thorough editing of this report.
The following operators and managers of desalination and water treatment
facilities in Texas participated in the study: Dave Everett, Roy Davis, Gene Thompson,
Sr., Greg Hobbs, Mac Greening, Ronnie Humphreys, Earl Whitworth, Don Pylant, Larry
Johnson, Mona Roundtree, Don Wirtanen, Eugene Cmerek, Gary Love, Benny Solano,
Jim Wade, Russell Etzenhauser, Bruce Cutting, Bill Whitley, Freddy Cleare, Jim
Guenther, Robert Soto, Bryan Jones, Fore Brown, Scott Nichols, Jan Horbaczewski, Phil
Hazen, Buddy Baird, David Yohe, Betty Singletary, Brady Goen, Tom Meyers, Duane
Christiansen, Ken Mayville, Millard Smith, Alva Cox, Daniel Diaz, Phillip Smith, Jim
Sommer, Melva Davis, Phyllis Watters, Stephen Giesbrecht, Cynthia Williams-
Hollander, Carrie Matthews, Pablo Salazar, Tony Elmer, Joy Cole, Fernando Sanchez,
Tim Seargent, Gene Mothershed, Raoul Cantu, Jose Garza, Delton Mills, Mr. Alaniz,
David Cole, Randy Kelley, Linsey Alvarez, Cathleen Vrana, Elane Simpson, Ben
Sanders, Tricia Heupel, Stanley Cole, Mike Michaud, Jack McCutcheon, Ernie Carrizal,
Art Carpenter, Gary Earnest, Merle Taylor, Bill Altman, Robert Burkhart, Robert Bryant,
David Gattis, Terry Shanks, Shelly Hubbard, Becky Moore, Elmo Tillis, Tony Moreno,
Antonio Mora III, Pete Quattrocchi, Joe Kelly, John Rodriguez, Gary Wegner, Fred
McVay, John Castillo, Wade Rhodes, and Sam Deletski. All interviewees were very
helpful and showed a high professional standard.
We would also like to thank Wade Miller, Sherman May, Chuck Keene, Fawzi
Karajeh, Manish Kumar, and Steve Duranceau for providing us information on the
surveys and studies currently done in California and Florida. We are grateful as well to

x
Doug Kelly for providing us needed insight on desalination needs in the petrochemical
industry.
1
1 Executive Summary The State of Texas has a renewed interest in desalination. However, no accurate
central database on desalination of Texas facilities existed before this work. Sponsored
by the TWDB, The University of Texas at Austin, Bureau of Economic Geology,
undertook an exhaustive study of public water systems (PWS) engaged in desalination. A
rough estimate of industrial and non-PWS desalination capacity is also given in the
report.
California, Florida, and Texas host most of the U.S. desalination capacity, and
their respective state agencies currently possess databases of those PWS desalination
facilities. However, information publicly available from them is generally basic and falls
short of the level of detail sought in this study. Worldwide surveys, generally done by
private groups, also generate databases providing a similar level of information. More
targeted studies present in-depth information, but they include a limited number of
facilities and are generally biased toward larger facilities. This study is thought to be the
first at the state level to include all PWS facilities with a design capacity approximately
≥0.025 million gallons per day (MGD).
In the course of the study, more than 100 PWS were contacted, along with a few
non-PWS facilities. It appears that the State of Texas currently contains about 38 PWS
facilities with a desalination design capacity ≥0.025 MGD (Table 1-1 and Figure 1-1), a
cumulative desalination design capacity of ~52 MGD, and another approximately 50
facilities with smaller desalination design capacity, for a cumulative desalination design
capacity of <0.5 MGD. Industrial capacity amounts to roughly 60 to 100 MGD in
hundreds of units, mainly in the power and semiconductor industries. These industries
typically require water of better quality than that of typical municipal water. The food
and beverage industry also make use of desalination units. Their quality requirements are
closer to those of municipal water treatment plants.
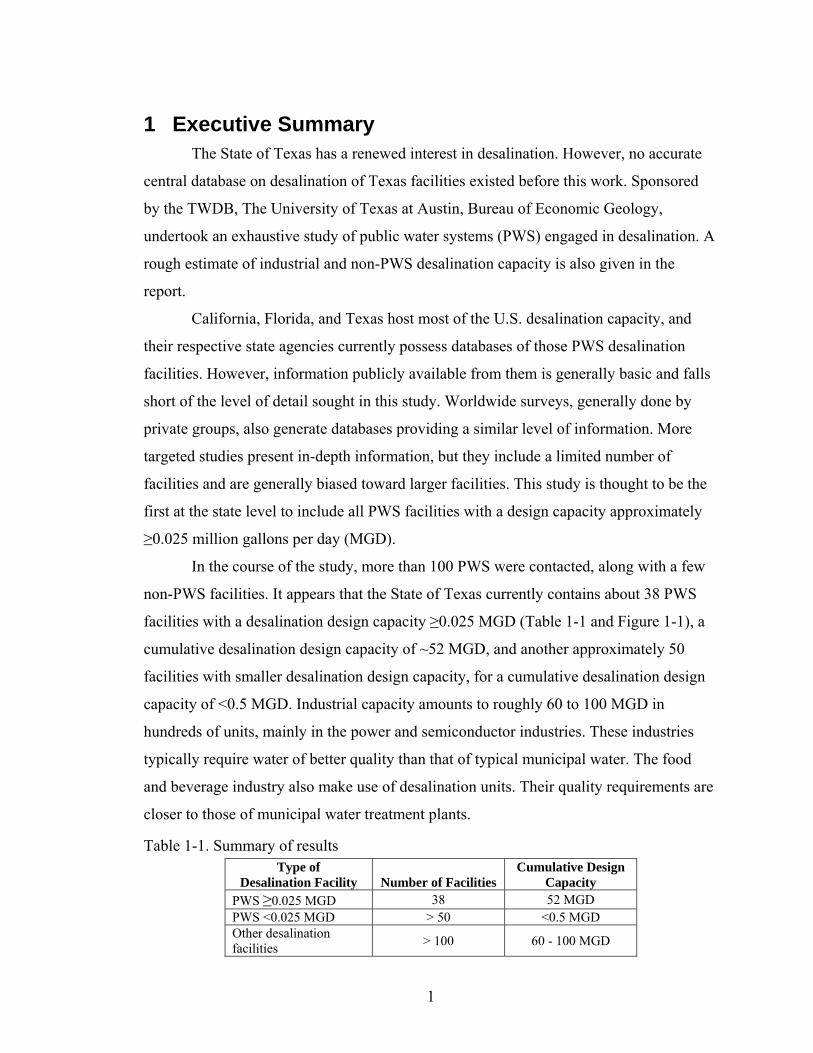
Table 1-1. Summary of results Type of
Desalination Facility Number of Facilities Cumulative Design
Capacity PWS ≥0.025 MGD 38 52 MGD PWS <0.025 MGD > 50 <0.5 MGD Other desalination facilities > 100 60 - 100 MGD

2
0
2
4
6
8
10
City of
Abil
ene
City of
She
rman
Southm
ost R
egion
al W
ater A
uthori
ty
City of
Fort Stoc
kton
Lake
Gran
bury S
WATS
Horizon
Reg
ional
M.U.D
.
*Wate
r Run
ner, In
c.
City of
Prim
era
City of
Rob
inson
City of
Brad
y
Wind
ermere
Water
Sys
tem
City of
Ray
mondv
ille
North C
amero
n/Hida
lgo W
A
Oak Trai
l Sho
res
City of
Ken
edy
City of
Sea
drift
City of
Elec
tra
City of
Sey
mour
Valley
MUD #2
Des
ign
Cap
acity
and
Ave
rage
Pro
duct
ion
(MG
D)
Design Capacity (MGD) Average Production (MGD)
*: Dual-use facility Figure 1-1. Design capacity and average production of the desalination units of the 19
facilities with the highest design capacity sorted by decreasing size
We collected information on design capacity and average production, as well as
on permeate blending. The vast majority of facilities use reverse osmosis, although a few
use the electrodialysis reversal process. Both surface water and groundwater are used as
feedwater, whose average TDS is ~1,800 ppm. Concentrate disposal methods vary:
evaporation pond, municipal sewer, surface water, and land application. The past few
years have seen an explosion of desalination capacity in the state as a whole (Figure 1-2).
0
10
20
30
40
50
60
1980 1985 1990 1995 2000 2005
Calendar Year
Des
alin
atio
n D
esig
n C
apac
ity a
nd A
vera
ge P
rodu
ctio
n(M
GD
)
Design Capacity (MGD)Average Production (MGD)
Figure 1-2. Time-cumulative desalination design capacity and average production of
Texas PWS facilities

3
Details of the survey are contained in a database available in both
Microsoft Access and SQL format. A discussion of potential database updates is
also included.

5
2 Introduction The present report documents results for the four tasks described in the scope of
work of Contract # 2004-483-021 “Development of a Database for Desalination Facilities
in Texas.” Task 1 consisted of surveying similar efforts currently in development in other
states (Attachment C: Overview of Recent Surveys—delivered to the TWDB as a letter-
report on December 15, 2004), submitting a list of facilities to be surveyed (Attachment
D: Detailed Survey Results), proposing a recommendation regarding the cutoff for
facilities to be included in the database (0.025 MGD), submitting a recommendation
regarding survey of industrial desalination facilities (Attachment E: Road Map for Survey
of Industrial Facilities), and working closely with TWDB on the survey form and
surveying protocol (Attachment B: Survey Form). Task 2 consisted of contacting
facilities identified in Task 1 by mail, fax, or phone and compiling the survey results
(main body of report and Attachment D: Detailed Survey Results). Task 3 consisted of
designing the database in SQL format (Attachment F: List of files on CD) and suggesting
maintenance and update procedures (Section 5). Task 4 lists the final deliverables
consisting of the database itself and a report documenting how data were collected, how
the database was built, and how to operate it. The draft report and associated deliverables
were delivered to the TWDB on June 23, 2005.
2.1 Overview of Other Recent Efforts A report to the U.S. Bureau of Reclamation (Mickley, 2001), focusing on
municipal utilities across the U.S, surveyed 12 facilities in operation in Texas in 1999, for
a total of ~22 MGD. Another report (Wangnick, 2002), compiled arguably all existing
desalination facilities across the world with a capacity >1 MGD. It suggests that at least
14 utility and 104 nonutility desalination facilities existed in Texas in 2001, totaling ~30
MGD and ~71 MGD, respectively. The survey included nonutility facilities using
wastewater as feedwater. Clearly, such nationwide surveys focus on larger facilities, and
most smaller facilities are left out. The goal of this study was thus to be as exhaustive as
possible and to include all facilities with a design capacity of at least 0.025 MGD.
Although some thermal-based facilities exist in the state, particularly in industrial
facilities, the focus of this study is on reverse osmosis (RO) and electrodialysis /

6
electrodialysis reversal (ED/EDR) facilities. Facilities using only ultrafiltration (UF) and
nanofiltration (NF) are not included in the study. Attachment C details efforts by other
states to develop similar comprehensive databases.
We tried to gather information on the whole desalination sequence from
feedwater source to pretreatment to membrane and permeate treatments to concentrate
disposal method. We also included a section on cost in the survey. Although it is
notoriously difficult to compare costs between facilities because cost breakdown is likely
facility-specific, such information was nevertheless useful because no such data had ever
been collected in Texas.
As a help to the reader, Website addresses are provided in Attachment G, and the
“**” string after a name means that an address is given. Names of those files provided in
the companion CD are in Courier print.
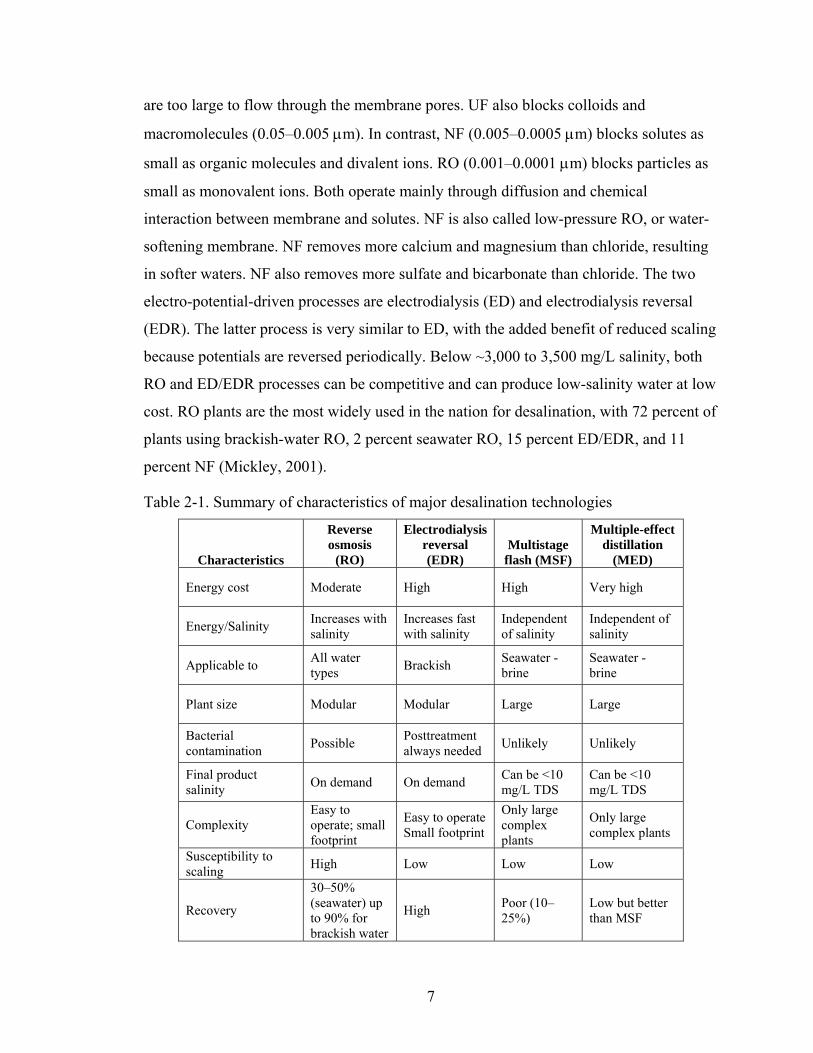
2.2 Desalination Primer This section briefly defines terminology used in the report and provides other
essential definitions. Two main types of technology are available for desalinating water:
membrane based and evaporation based. As described in Table 2-1, evaporation-based
technologies such as multistage flash or multiple-effect distillation are more suited to
high-salinity waters and/or larger plants because energy requirements are high and almost
independent of source water salinity. They also have a small recovery, translating into a
large waste stream, which may be hard to dispose of other than sending it to a large body
of water. Seawater desalination plants have historically been using such technologies.
However, recently constructed seawater desalination facilities rely almost exclusively on
membrane technologies. Membrane-based technologies are also widely used in smaller
plants and/or for the treatment of brackish water. In this study we focus on membrane-
based technologies because they form the overwhelming majority of plants in the
continental U.S. and in Texas.
There are two kinds of membrane processes: pressure driven and electro-potential
driven. Pressure-driven membrane processes are further described as microfiltration
(MF), ultrafiltration (UF), nanofiltration (NF), and reverse osmosis (RO). MF and UF act
only mechanically, blocking bacteria and suspended particles (10–0.05 μm) because they
7
are too large to flow through the membrane pores. UF also blocks colloids and
macromolecules (0.05–0.005 μm). In contrast, NF (0.005–0.0005 μm) blocks solutes as
small as organic molecules and divalent ions. RO (0.001–0.0001 μm) blocks particles as
small as monovalent ions. Both operate mainly through diffusion and chemical
interaction between membrane and solutes. NF is also called low-pressure RO, or water-
softening membrane. NF removes more calcium and magnesium than chloride, resulting
in softer waters. NF also removes more sulfate and bicarbonate than chloride. The two
electro-potential-driven processes are electrodialysis (ED) and electrodialysis reversal
(EDR). The latter process is very similar to ED, with the added benefit of reduced scaling
because potentials are reversed periodically. Below ~3,000 to 3,500 mg/L salinity, both
RO and ED/EDR processes can be competitive and can produce low-salinity water at low
cost. RO plants are the most widely used in the nation for desalination, with 72 percent of
plants using brackish-water RO, 2 percent seawater RO, 15 percent ED/EDR, and 11
percent NF (Mickley, 2001).
Table 2-1. Summary of characteristics of major desalination technologies
Characteristics
Reverse osmosis
(RO)
Electrodialysis reversal (EDR)
Multistage flash (MSF)
Multiple-effect distillation
(MED)
Energy cost Moderate High High Very high
Energy/Salinity Increases with salinity
Increases fast with salinity
Independent of salinity
Independent of salinity
Applicable to All water types Brackish Seawater -
brine Seawater - brine
Plant size Modular Modular Large Large
Bacterial contamination Possible Posttreatment
always needed Unlikely Unlikely
Final product salinity On demand On demand Can be <10
mg/L TDS Can be <10 mg/L TDS
Complexity Easy to operate; small footprint
Easy to operate Small footprint
Only large complex plants
Only large complex plants
Susceptibility to scaling High Low Low Low
Recovery
30–50% (seawater) up to 90% for brackish water
High Poor (10–25%)
Low but better than MSF

8
As discussed earlier, desalination concentrates are produced during removal of
salts from low-quality water in RO and ED/EDR plants. The amount of concentrate as a
percentage of feedwater varies according to desalination method, percent recovery, and
chemical additives. In RO systems that produce drinking water, a typical pretreatment
consists of acidification and addition of antiscalant chemicals. Disposal of the concentrate
could be a major issue in siting of a new facility. Disposal methods include land
application and discharge to a surface water body, municipal sewer, or evaporation pond.
Another option is deep-well injection.

9
3 Methods The primary method of collecting information on Texas facilities was to interview
facility operators and/or ask them to fill out a survey form (Attachment B; also in file
Survey form Mun3.doc). Another method, not pursued in this work, would be to
gather data indirectly by contacting membrane manufacturers, chemical providers, and
other industry suppliers.
3.1 Sources of Information The first step in data collection was a query of the TCEQ PWS database (the so-
called TCEQ list) for words related to desalination. The TCEQ PWS database is only
updated by TCEQ field inspections. Thus, more recent facilities not yet inspected are not
included in the database. Locations of these additional facilities were obtained by
1) consulting TWDB** drinking water “State Revolving Loan Program Projects”
priority list (loans from 2001 through 2004 are on the TWDB Website),
2) consulting Regional Water Planning Group reports,
3) executing a customized query of the TCEQ Water Supply Plan Review log
(only those entries in which the title is clear on desalination potential), and
4) using personal professional contacts.
Otherwise the survey procedure that is the same as that used by TCEQ-listed facilities
was followed.
New facilities are designed and built every year, and the database presented in this
work is reasonably accurate as of March 2005. A list of potential desalination facilities at
diverse stages of completion (from discussion in City Council to feasibility studies to
actual construction) is presented in Section 4.2.
3.2 Methodology The first step of the survey was to send out letters to all facilities from the initial
TCEQ list announcing the survey and explaining its purpose. The second step involved
calling the facility and reaching the technical staff. This step proved to be time
consuming in most cases. The competent person was given the choice of immediately
completing the survey verbally over the phone or of sending in the information by mail or

10
fax. The full interview lasted 20 to 30 minutes. The next step, after receipt of the initial
response, consisted of mailing the completed survey back to the operators to check for
accuracy and completeness and to ask for more information if needed. The new
information was then entered into a Microsoft Access database. At the end of the survey
phase, only PWS facilities ≥0.025MGD were retained in the database (TWDB-BEG
Water Survey06-13-05_GT0.025MGD.mdb), then, translated, and imported into
a SQL server database (DesalPlantSql2kBackup). A tentative methodology for
industrial facilities is described in Section 5.
We contacted all facilities with a capacity ≥0.025 MGD on the initial TCEQ list,
as well as those facilities revealed through other channels. The final list was split into
several categories, including operating desalination facilities with a capacity ≥0.025MGD
and future desalination facilities, described in the Results section (Section 4). Other
facilities—operating desalination facilities with a capacity <0.025MGD, closed
desalination facilities, and contacted facilities with no desalination treatment—are not the
focus of this work and are described only in Attachment D.

11
4 Results
4.1 Public Water System Facilities A total of 105 public water system facilities were contacted, 38 of which were
eventually retained in the final list (Table 4-1 and Table 4-2). An additional 47 facilities
also had desalination capabilities but a capacity below the threshold of 0.025 MGD.
Attachment D gives a detailed overview of the data collection history.
Table 4-1. Characteristic summary of Texas desalination facilities with capacity ≥0.025 MGD
Plant Name County
Design Capacity (MGD) Use Source
Startup Year Process
Blending?
Disposal Method
City of Abilene Taylor 8 DW SW 2004 RO No EP
City of Sherman Grayson 7.5 DW SW 1993 EDR Yes Sewer
SWRA Cameron 6.75 DW GW 2004 RO Yes SW Lake Granbury SWATS
Hood 6 DW SW 2003 RO Yes SW
City of Fort Stockton Pecos 6 DW GW 1996 RO Yes Sewer
Horizon Regional M.U.D.
El Paso 2.2 DW GW 2001 RO Yes LA/IRR/EP
City of Primera Cameron 2 DW GW 2005 RO Yes SW
City of Robinson McLennan 1.8 DW SW 1994 RO Yes SW
City of Brady McCulloch 1.5 DW GW 2005 RO Yes EP City of Raymondville Hidalgo 1 DW GW 2004 RO No SW
Windermere Water System Travis 1 DW GW 2003 RO Yes Sewer
Oak Trail Shores Hood 0.79 DW SW 1990 EDR Yes SW
City of Kenedy Karnes 0.72 DW GW 1995 RO Yes SW
City of Seadrift Calhoun 0.52 DW GW 1998 RO Yes SW
City of Seymour Baylor 0.5 DW GW 2000 RO Yes SW
Valley MUD #2 Cameron 0.5 DW GW 2000 RO Yes SW/LA
City of Electra Wichita 0.5 DW GW 1999 RO No LA/IRR
City of Tatum Rusk 0.29 DW GW 1999 RO Yes Sewer The Cliffs Palo Pinto 0.2 DW SW RO No SW Holiday Aransas 0.15 DW GW 1998 RO Yes SW

12
Plant Name County
Design Capacity (MGD) Use Source
Startup Year Process
Blending?
Disposal Method
Beach WSC Study Butte Terlingua Water System
Brewster 0.14 DW GW 2000 RO No SW
River Oaks Ranch Hays 0.14 DW GW 1987 RO No EP
City of Beckville Panola 0.14 DW GW 2004 RO Yes Sewer
City of Granbury Hood 0.11 DW SW 1985 EDR Yes Sewer
Midland Country Club - fairways & greensA
Midland 0.11 DW/ IRR GW 2004 RO No EP
City of Laredo Santa Isabel R.O.
Webb 0.10 DW GW 1998 RO No Sewer
Dell City Hudspeth 0.1 DW GW 1996 EDR No LA/IRR DS Waters of America, LP Waller 0.09 DW GW 1997 RO No Sewer
Sportsmans World MUD Palo Pinto 0.083 DW SW 1984 RO No SW
Big Bend Motor Inn Brewster 0.072 DW GW 1992 RO No EP
Haciendas Del Norte Water Improvement District
El Paso 0.05 DW GW 1981 RO Yes LA/IRR/EP
City of Bardwell Ellis 0.036 DW GW 1990 RO Yes Sewer
City of Bayside Refugio 0.029 DW GW 1990 RO No EP
Water Runner, Inc.B Midland 0.028/
2.16 DW/ IND GW 2001 RO No LA/IRR
Longhorn Ranch MotelA Brewster 0.023 DW/
IRR GW 1990 RO No LA/IRR
Esperanza Fresh Water Supply
Hudspeth 0.023 DW GW 1990 RO Yes
City of Los Ybanez Dawson DW GW 1991 RO Yes
North Cameron /Hidalgo WA
Hidalgo DW GW 2005 RO Yes SW
SUM 52.3 NOTE: DW=drinking water; IND=industrial; GW=groundwater; SW=surface water; RO=reverse osmosis;
EDR=electrodialysis reversal; EP=evaporation pond; IRR=irrigation; LA=land application; SW=discharge to surface water body A: dual use facility: public water supply and irrigation B: dual use facility: public water supply and industrial (bottling company), drinking water
capacity from TCEQ list.
13
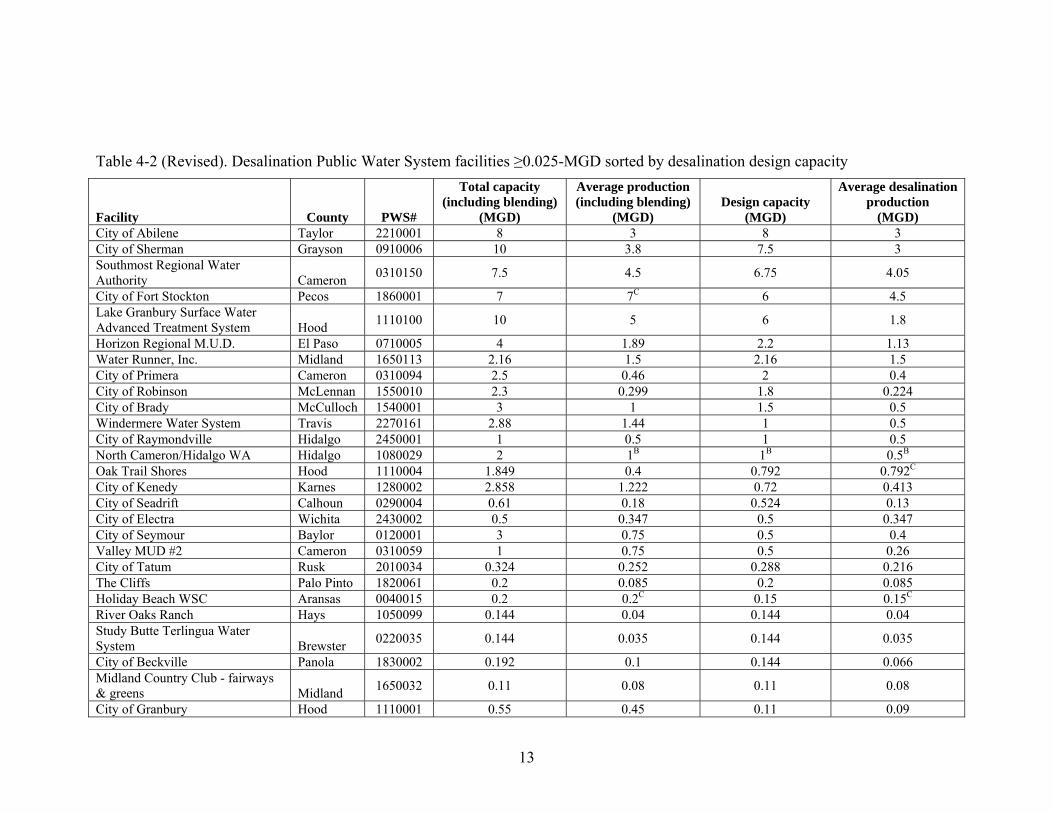
Table 4-2 (Revised). Desalination Public Water System facilities ≥0.025-MGD sorted by desalination design capacity
Facility County PWS#
Total capacity (including blending)
(MGD)
Average production (including blending)
(MGD) Design capacity
(MGD)
Average desalination production
(MGD) City of Abilene Taylor 2210001 8 3 8 3 City of Sherman Grayson 0910006 10 3.8 7.5 3 Southmost Regional Water Authority Cameron 0310150 7.5 4.5 6.75 4.05
City of Fort Stockton Pecos 1860001 7 7C 6 4.5 Lake Granbury Surface Water Advanced Treatment System Hood 1110100 10 5 6 1.8
Horizon Regional M.U.D. El Paso 0710005 4 1.89 2.2 1.13 Water Runner, Inc. Midland 1650113 2.16 1.5 2.16 1.5 City of Primera Cameron 0310094 2.5 0.46 2 0.4 City of Robinson McLennan 1550010 2.3 0.299 1.8 0.224 City of Brady McCulloch 1540001 3 1 1.5 0.5 Windermere Water System Travis 2270161 2.88 1.44 1 0.5 City of Raymondville Hidalgo 2450001 1 0.5 1 0.5 North Cameron/Hidalgo WA Hidalgo 1080029 2 1B 1B 0.5B Oak Trail Shores Hood 1110004 1.849 0.4 0.792 0.792C City of Kenedy Karnes 1280002 2.858 1.222 0.72 0.413 City of Seadrift Calhoun 0290004 0.61 0.18 0.524 0.13 City of Electra Wichita 2430002 0.5 0.347 0.5 0.347 City of Seymour Baylor 0120001 3 0.75 0.5 0.4 Valley MUD #2 Cameron 0310059 1 0.75 0.5 0.26 City of Tatum Rusk 2010034 0.324 0.252 0.288 0.216 The Cliffs Palo Pinto 1820061 0.2 0.085 0.2 0.085 Holiday Beach WSC Aransas 0040015 0.2 0.2C 0.15 0.15C River Oaks Ranch Hays 1050099 0.144 0.04 0.144 0.04 Study Butte Terlingua Water System Brewster 0220035 0.144 0.035 0.144 0.035
City of Beckville Panola 1830002 0.192 0.1 0.144 0.066 Midland Country Club - fairways & greens Midland 1650032 0.11 0.08 0.11 0.08
City of Granbury Hood 1110001 0.55 0.45 0.11 0.09

14
Facility County PWS#
Total capacity (including blending)
(MGD)
Average production (including blending)
(MGD) Design capacity
(MGD)
Average desalination production
(MGD) City of Laredo Webb 2400027 0.1008 0.0271 0.1008 0.0271 Dell City Hudspeth 1150001 0.1 0.05 0.1 0.05 DS Waters of America, LP Waller 2370070 0.09 0.09 0.09A 0.09 Sportsmans World MUD Palo Pinto 1820050 0.083 0.05 0.083 0.05 Big Bend Motor Inn Brewster 0220027 0.05 0.041 0.072 0.041 Haciendas Del Norte El Paso 0710091 0.23 0.11 0.05 0.04 City of Bardwell Ellis 0700020 0.252 0.063 0.036 0.036 City of Bayside Refugio 1960007 0.029A 0.029 0.029A 0.029 City of Los Ybanez Dawson 0580018 0.025B 0.025B 0.025B 0.025B Longhorn Ranch Motel Brewster 0220032 0.023 0.023 0.023 0.023C Esperanza Fresh Water Supply Hudspeth 1150010 0.056A 0.056 0.023A 0.023 SUM 75.1 36.8 52.3 25.1 NOTE: Owing to the few instances with partial information, the following estimates were made:
A total set to average B estimation C average set to total

15
Total design desalination capacity of the 38 desalination facilities above the
threshold of 0.025 MGD is 52.3 MGD. Additional capacity of the other 47 facilities
contacted with a desalination capacity below the threshold does not change this number
(it would be ~53 MGD). A total of 5 facilities with a design capacity of ~34 MGD
accounts for most than half (65 percent) of the cumulative design capacity of the state.
Most plants ≥0.025 MGD currently produce below their design capacity, with a
cumulative production of ~25.1 MGD. Approximately half of the 38 retained facilities
blend desalination permeate with untreated feedwater. In this case, total design capacity
of the 38 facilities has an additional water production of 22.8 MGD, bringing total
capacity of these facilities, including blending, to 75.1 MGD. Similarly, additional
average capacity due to blending is ~11.7 MGD, bringing average production with
blending to 36.8 MGD.
Figure 4-1 and Figure 4-2 display desalination design capacity and average
desalination production for all 38 facilities and are sorted according to desalination
design capacity. Figure 4-3 and Figure 4-4 illustrate total desalination design capacity
(values are the same if there is no blending). Blending is widespread but not a significant
component in most plants. The City of Seymour and the Lake Granbury Surface Water
Advanced Treatment System plant have the largest bypass in percentage. Figure 4-5
shows that the spatial distribution of design capacity is not biased toward a particular
sector of the state. A total of 12 facilities with a cumulative desalination design capacity
of 19.9 MGD report large seasonal variations in production (>25 percent), the largest of
which is the City of Sherman, followed by the City of Primera.

16
0
2
4
6
8
10
City of
Abil
ene
City of
She
rman
Southm
ost R
egion
al W
ater A
uthori
ty
City of
Fort Stoc
kton
Lake
Gran
bury S
WATS
Horizon
Reg
ional
M.U.D
.
*Wate
r Run
ner, In
c.
City of
Prim
era
City of
Rob
inson
City of
Brad
y
Wind
ermere
Water
Sys
tem
City of
Ray
mondv
ille
North C
amero
n/Hida
lgo W
A
Oak Trai
l Sho
res
City of
Ken
edy
City of
Sea
drift
City of
Elec
tra
City of
Sey
mour
Valley
MUD #2
Des
ign
Cap
acity
and
Ave
rage
Pro
duct
ion
(MG
D)
Design Capacity (MGD) Average Production (MGD)
*: Dual-use facility Figure 4-1. Design capacity and average production of desalination facilities above a
cutoff value of ~0.5 MGD sorted by decreasing size
0
0.1
0.2
0.3
0.4
0.5
Valley
MUD #2
City of
Tatum
The C
liffs
Holida
y Bea
ch W
SC
River O
aks R
anch
Study B
utte T
erling
ua W
ater S
ystem
City of
Bec
kville
*Midl
and C
ountr
y Club
City of
Gran
bury
City of
Lared
o San
ta Isa
bel R
.O.
Dell C
ity
DS Wate
rs of
America
, LP
Sports
mans W
orld M
UD
Big Ben
d Moto
r Inn
Hacien
das D
el Nort
e Wate
r
City of
Bardwell
City of
Bay
side
City of
Los Y
bane
z
*Lon
ghorn
Ran
ch M
otel
Espera
nza F
resh W
S
Des
ign
Cap
acity
and
Ave
rage
Pro
duct
ion
(MG
D)
Design Capacity (MGD) Average Production (MGD)
*: Dual-use facility Figure 4-2. Design capacity and average production of desalination facilities below a
cutoff value of ~0.5 MGD sorted by decreasing size

17
0
3
6
9
12
City of
Abil
ene
City of
She
rman
Southm
ost R
egion
al W
ater A
uthori
ty
City of
Fort Stoc
kton
Lake
Gran
bury S
WATS
Horizon
Reg
ional
M.U.D
.
*Wate
r Run
ner, In
c.
City of
Prim
era
City of
Rob
inson
City of
Brad
y
Wind
ermere
Water
Sys
tem
City of
Ray
mondv
ille
North C
amero
n/Hida
lgo W
A
Oak Trai
l Sho
res
City of
Ken
edy
City of
Sea
drift
City of
Elec
tra
City of
Sey
mour
Valley
MUD #2
Des
ign
Tota
l and
Des
alin
atio
n C
apac
ity (M
GD
)Blending (MGD)Design Capacity (MGD)
*: Dual-use facility
Figure 4-3. Total design capacity with and without blending of facilities above a cutoff value of ~0.5 MGD sorted by decreasing size
0.0
0.2
0.4
0.6
0.8
1.0
Valley
MUD #2
City of
Tatum
The C
liffs
Holiday
Bea
ch W
SC
River O
aks R
anch
Study B
utte T
erling
ua W
ater S
ystem
City of
Beckv
ille
*Midl
and C
ountr
y Club
City of
Gran
bury
City of
Lared
o Santa Is
abel
R.O.
Dell City
DS Wate
rs of
America
, LP
Sports
mans W
orld M
UD
Big Ben
d Motor
Inn
Haciend
as Del
Norte W
ater
City of
Bardwell
City of
Bay
side
City of
Los Y
banez
*Lon
ghorn
Ranch M
otel
Esperan
za Fres
h WS
Des
ign
Tota
l and
Des
alin
atio
n C
apac
ity (M
GD
)
Blending (MGD)Design Capacity (MGD)
*: Dual-use facility Figure 4-4. Total design capacity with and without blending of facilities below a cutoff
value of ~0.5 MGD sorted by decreasing size

18
SWRA
Brady
Sherman
Abilene
Primera
Robinson
Lake Granbury
Fort Stockton
Horizon Regional M.U.D.
Desalination Design Capacity (MGD)
0.023 - 0.05
0.05 - 0.5
0.5 - 1
1 - 3
3 - 5
5 - 8
Dual-Use Facility
¹0 100 200 300 40050
Miles
NOTE: Location of some facilities is only approximate; Texas Statewide Mapping System projection Facilities with a desalination design capacity ≥1.5 MGD are named
Figure 4-5. Map of desalination facilities showing design capacity
The first facility still in operation was started in 1981 (Haciendas Del Norte, El
Paso County). Desalination capacity increase has been accelerating ever since (Figure
4-6). Figure 4-7 and Figure 4-8 display desalination design capacity and average
production of Texas facilities according to the order in which they opened. Figure 4-9
shows that there is no real spatial trend in the distribution of older or newer facilities.
Facilities of different startup years are well distributed across the state.

19
0
10
20
30
40
50
60
1980 1985 1990 1995 2000 2005
Calendar Year
Des
alin
atio
n D
esig
n C
apac
ity a
nd A
vera
ge P
rodu
ctio
n(M
GD
)Design Capacity (MGD)Average Production (MGD)
Figure 4-6. Time-cumulative desalination design capacity and average production of
Texas PWS facilities
0.01
0.1
1
10
Haciend
as Del
Norte W
ater Im
pro...
Big Ben
d Motor
Inn
City of
Gran
bury
River O
aks R
anch
Long
horn R
anch
Mote
l
City of
Bay
side
Oak Trai
l Sho
res
Esperan
za Fres
h Wate
r Sup
ply
City of
Bard
well
City of
Los Y
banez
Sports
mans W
orld M
UD
City of
She
rman
City of
Rob
inson
City of
Ken
edy
City of
Fort Stoc
kton O
smos
is/Des
a...
Dell City
DS Wate
rs of
America
, LP
Holiday
Bea
ch W
SC
City of
Sea
drift
Des
ign
Cap
acity
and
Ave
rage
Pro
duct
ion
(MG
D)
Design Capacity (MGD) Average Production (MGD)
NOTE: Chronological order is only approximate. All facilities opened the same year are listed
alphabetically.
Figure 4-7. Design capacity and average production of desalination facilities sorted by startup year (log scale; 1981 through 1998)

20
0.01
0.1
1
10
City of
Sea
drift
City of
Lared
o Santa Is
abel
R.O.
City of
Elec
tra
City of
Tatum
Study B
utte T
erling
ua W
ater S
ystem
City of
Sey
mour
Valley
MUD #2
Wate
r Runn
er, In
c.
Horizon
Reg
ional
M.U.D
.
Wind
ermere
Water
Sys
tem
Lake
Gran
bury S
urfac
e Wate
r Adv
...
Midlan
d Cou
ntry C
lub - f
airways
& gree
City of
Bec
kville
City of
Ray
mondv
ille
Southm
ost R
egion
al W
ater A
uthori
ty
City of
Abil
ene
North C
amero
n/Hida
lgo W
A
City of
Prim
era
City of
Brad
y
Des
ign
Cap
acity
and
Ave
rage
Pro
duct
ion
(MG
D)
Design Capacity (MGD) Average Production (MGD)
NOTE: Chronological order is only approximate. All facilities opened the same year are listed
alphabetically. Startup year for “The Cliffs” facility is missing from the database.
Figure 4-8. Design capacity and average production of desalination facilities sorted by startup year (log scale; 1998 through 2005)
#*
Startup Year2001 - 2005
1996 - 2000
1991 - 1995
1986 - 1990
1981 - 1985
#* Unknown
¹0 100 200 300 40050
Miles NOTE: Location of some facilities is only approximate; Texas Statewide Mapping System projection
Figure 4-9. Map of desalination facilities showing startup year

21
The vast majority of Texas PWS desalination facilities have adopted RO (Figure
4-10). Only four of them currently use EDR (8.5 MGD out of a total of 53.7 MGD, that
is, ~18 percent of total design capacity). They are the City of Granbury (0.11 MGD
design capacity), Dell City (0.1 MGD), City of Sherman (7.5 MGD), and Oak Trail
Shores (0.792 MGD). Some of these facilities plan to upgrade and switch to RO in the
near future (Oak Trail Shores and City of Granbury). Some industrial facilities also use
ED (e.g., DEFS Fullerton Gas Plant). Most of these facilities are connected to the power
grid. Only one plant with production ≥0.025MGD (DS Waters of America, LP) had
power generated on site. Site-generated power is more common for industrial facilities.
Plant TypeEDR
RO
Unknown¹
0 100 200 300 40050Miles
NOTE: Location of some facilities is only approximate; Texas Statewide Mapping System projection
Figure 4-10. Map of desalination facilities showing desalination technique
Feedwater TDS varies from 470 to 3,840 ppm (Figure 4-11). An arithmetic
average weighted by desalination design capacity yields a value of ~1,760 ppm, whereas

22
an average by facility gives a similar value of ~1,870 ppm. Mode of distribution is in the
range of 1,000 to 1,500 ppm (Figure 4-12). The primary reason for building the facilities
is often a high TDS (high chloride, sulfate, sodium, hardness, or alkalinity), but there are
regulatory reasons as well. The City of Electra and the City of Seymour want to eliminate
nitrate. The City of Kenedy is concerned about arsenic. The City of Bardwell, the Big
Bend Motor Inn, and Windermere Water System facilities are concerned about high
fluoride. Radionuclides are an issue for the Study Butte Terlingua Water System and the
City of Brady. Perchlorate is of concern to the Gaines County Golf Course (facility
<0.025 MGD).
Total Dissolved Solids (ppm)Unknown
<500
500 - 1000
1000 - 2000
2000 - 3000
3000 - 4000
¹0 100 200 300 40050
Miles NOTE: When a TDS range was given during the survey, arithmetic average of range bounds was chosen as
the representative value. Location of some facilities is only approximate; Texas Statewide Mapping System projection
Figure 4-11 (Revised). Map of desalination facilities showing TDS of feedwater

23
Feedwater Total Dissolved Solids Distribution
0
2
4
6
8
10
0-500 500-1000 1000-1500 1500-2000 2000-2500 2500-3000 3000-3500 3500-4000
TDS Range (ppm)
Num
ber o
f Fac
ilitie
s
Figure 4-12. Feedwater TDS distribution
Source water is either a surface water body or, more commonly, groundwater
(Figure 4-13). No PWS seawater desalination facility currently exists in Texas. Of 38
facilities, 8, including the large facilities of Abilene, Sherman, and Lake Granbury
SWATS, use surface water. They total 24.5 MGD of the state desalination design
capacity (that is, ~45 percent of 52.3 MGD). They are located mainly where surface
water is abundant, mainly in the northeastern corner of the state. Concentrate disposal
methods are displayed in Figure 4-14. There is no obvious trend in the spatial distribution
of the different methods. Table 4-3 presents disposal method statistics.
Water SourceGW
SW¹
0 100 200 300 40050Miles
NOTE: Location of some facilities is only approximate; Texas Statewide Mapping System projection
Figure 4-13. Map of desalination facilities showing feedwater origin

24
#*
#*
")
XW
#*
")
")
XW
XW
#*
XW
#*#*#*
#*
#*
")
#*
")
#*
XW
#*#*
XW
XW
XW
#*
XW
Disposal MethodEvaporation Pond
") Land Application
#* Surface Water Body
XW Municipal Sewer
Unknown
¹0 100 200 300 40050
Miles
NOTE: Location of some facilities is only approximate; Texas Statewide Mapping System projection
Figure 4-14. Map of desalination facilities showing concentrate disposal method
Table 4-3. Concentrate disposal method statistics
Method Number of
facilities Cumulative design
capacity (MGD) Evaporation pond 8 12.1 Land application 5 3.3 Municipal sewer 9 15.3 Surface water body 14 20.7 Unknown 2 0.02 Total 38 52.3A
NOTE: A Sum of individual rows may differ from “Total” row owing to rounding
We were able to collect information from more than half of the facilities (25) on
capital costs (Table 4-4 and Figure 4-15). Computed over a period of 20 years, neglecting
inflation, most capital costs to 1,000 gal are below $1/1,000 gal (Figure 4-16). Data on
operating costs are too disparate for a statistical study to be undertaken.

25
Table 4-4. Facility capital cost statistics (total design capacity includes blending)
Facility County Cost
(million $$)A Total design
capacity (MGD) Capital cost /1,000 galB
City of Sherman Grayson 20 10 0.27 Lake Granbury SWATS Hood 30 10 0.41 City of Abilene Taylor 60 8 1.03 Southmost Regional Wat. Auth. Cameron 27 7.5 0.49 City of Fort Stockton Pecos 6 7 0.12 Horizon Regional M.U.D. El Paso 6.8 4 0.23 City of Seymour Baylor 2 3 0.09 City of Brady McCulloch 9.4 3 0.43 Windermere Water System Travis 1.5 2.88 0.07 City of Primera Cameron 9 2.5 0.49 City of Robinson McLennan 6 2.3 0.36 Valley MUD #2 Cameron 0.8 1 0.11 City of Seadrift Calhoun 1.2 0.61 0.27 City of Granbury Hood 0.6 0.55 0.15 City of Electra Wichita 1.7 0.5 0.47 City of Bardwell Ellis 0.1 0.252 0.05 Haciendas Del Norte El Paso 2 0.23 1.19 Holiday Beach WSC Aransas 0.385 0.2 0.26 City of Beckville Panola 0.4 0.192 0.29 Study Butte Terlingua Wat. Syst. Brewster 1.348 0.144 1.28 Midland Country Club Midland 0.09 0.11 0.11 Sportsmans World MUD Palo Pinto 3.5 0.083 5.77 Big Bend Motor Inn Brewster 0.02 0.05 0.05 City of Los Ybanez Dawson 0.3 0.025 1.64 Longhorn Ranch Motel Brewster 0.034 0.023 0.2
NOTE: ANot corrected for inflation; Bassuming a life of 20 years
0
25
50
75
Big Ben
d Moto
r Inn
Long
horn
Ranch
Mote
l
Midlan
d Cou
ntry C
lub
City of
Bardwell
City of
Los Y
bane
z
Holida
y Bea
ch W
SC
City of
Beckv
ille
City of
Gran
bury
Vally M
UD #2
City of
Seadri
ft
Study B
utte T
erling
ua W
at. Sys
t.
Winderm
ere W
ater S
ystem
City of
Electra
Hacien
das D
el Nort
e
City of
Seymou
r
Sports
mans W
orld M
UD
City of
Rob
inson
City of
Fort Stoc
kton
Horizo
n Reg
ional
M.U.D
.
City of
Primera
City of
Brady
City of
Sherm
an
Southm
ost R
egion
al Wat.
Auth.
Lake
Gran
bury
SWATS
City of
Abilen
eCap
ital C
osts
(mill
ion
dolla
rs)
Figure 4-15. Capital costs of a few desalination facilities (not corrected for inflation)

26
0.01
0.1
1
10
100
0.01 0.1 1 10
Capital Costs (million dollars)
Des
ign
Cap
acity
(MG
D)
Total Design CapacityDesalination Design Capacity
$1 / 1,000 gal
$0.01 / 1,000 gal
$0.1 / 1,000 gal
NOTE: Cost per 1,000 gal assumes a plant life of 20 years. If plant has no blending, total design and
desalination design capacity are superimposed. If there is blending, each plant is represented by two points, representing capital cost divided by either total or desalination design capacity over 20 years.
Figure 4-16. Comparison of capital costs and total design capacity
4.2 Future Plants In the course of this study we informally collected information about future
desalination facilities. A nonexhaustive list of future facilities is provided in Table 4-5. It
includes potential facilities for Millersview-Doole, Fort Hancock, Central Texas WSC in
Bell County, Sylvester-McCaulley WSC in Fisher County, Wichita Falls, and the large
joint facility El Paso/Ft. Bliss (27.5 MGD). The City of Granbury will switch from EDR
to RO and increase its desalination capacity from <1 MGD to 6 MGD. The probability of
completion of these facilities is rated high. Other cities, such as San Angelo, San
Antonio, and Karnes City, have also demonstrated some interest in desalination.
However, at this time no feasibility studies have been undertaken. The three Gulf
seawater desalination facilities whose feasibility studies are funded by the TWDB are
included in the table with no details. As the Regional Water Planning Group 2005 reports
become available later this year, the ability to discern the demand for desalination
facilities will develop.

27
Table 4-5. Future facilities
City/Facility (county)
Information Source
Estimated design
capacity (MGD)
On the horizon Comments
High certainty of completion
Joint facility El Paso / Ft. Bliss (El Paso)
RWPG Report Region E 27.5 2006
Cost: $35,000,000; groundwater; injection wells for concentrate disposal, blending
Wichita Falls (Wichita)
Website1; RWPG Report
Region B 12 Feedwater from Lake Kemp
Central Texas WSC (Bell)
Survey Interview 6-10 2010 Lake water
City of Granbury (Hood)
Survey Interview 6 2008-
2009 Lake Granbury
Dupont Textiles&Interiors
(Victoria) Website2 4.3 Industrial facility in Victoria, TX
Millersview Doole WSC (Concho)
Survey Interview 2 2005-
2006
Ivie Reservoir will be feedwater and also used for concentrate disposal; Cost: $5,000,000; average production at 0.875 MGD; 2 MGD with blending; total design capacity at 3.5 MGD
Sylvester-McCaulley WSC (Fisher)
Survey Interview 0.2 2006-
2007 Cost: $350,000; groundwater
Fort Hancock WCID (Hudspeth)
Survey Interview 2006-
2007
Cost: $2,000,000; arsenic is a concern, along with TDS; groundwater; concentrate disposal through evaporation ponds
Possibly on the horizon TWDB-funded
feasibilities studies for 3 gulf sites
TWDB Website 75 Seawater desalination plants
San Antonio (Bexar)
Recent posting of an RFQ 20
Corpus Christi on Padre Island 3.5
Brazos River Authority (Stephens)
TWDB 1-3
Karnes City (Karnes)
RWPG Report Region L 0.5
San Angelo (Tom Green)
Pers. Com.
Highly speculative On Lake Texoma
(Cooke) RWPG Report
Region C
Wilcox and Gulf Coast aquifers
RWPG Report Region L 2035
NOTE: Website1: http://cwftx.net/pubworks/Default.htm; last accessed 06/2005 Website2: http://www.waterdesalreport.com/horizon.htm; last accessed 12/2004

28
4.3 Roadmap for Industrial Facilities There is much less easily retrievable information about industrial facilities than
there is about municipal facilities. However, it is likely that industrial facilities currently
comprise the bulk of desalination facilities in numbers, if not in production, as can be
inferred from a previous and more thorough survey of industrial installations conducted
by IDA. The IDA inventory for the state of Texas (Wangnick, 2002) suggests that out of
a total desalination design capacity of ~100 MGD in Texas as of December 31, 2001 (109
facilities described), only ⅓ (30 MGD) are for municipal use (14 facilities described).
Industrial facilities most likely to include desalination units are from power,
electronics, chemical and petrochemical, pharmaceutical, beverage and food, textile, and
paper industries. RO membranes have been used since the 1960’s in most of those
applications. Baker (2004, p. 221) stated that worldwide,~50 percent of all RO
membranes are for desalination of brackish and seawater, and 40 percent are for ultrapure
water used in the electronics, pharmaceutical, and power industries, whereas the
remaining 10 percent are for niche application, such as food processing. A quick reading
of the IDA inventory presented in Attachment E shows that power facilities are the most
numerous (see Desalting Plants Inventory_JP0.xls). The inventory also
shows that evaporation-based methods are in use in Texas, particularly in older units and
when wastewater or seawater is used as a feed. The largest of these is at the Union
Carbide plant in Texas City, with a total capacity >2 MGD. It is also one of the oldest, in
operation since 1968. Most recent evaporation-based facilities (the latest started up in
2001) are integrated within power plants. They use wastewater as feedwater and follow a
vapor compression process.
Attachment E presents a rough approximation for quantitative description of
desalination capacity of industrial facilities. The uncertainty of the following numbers is
large, possibly as high as 100 percent, but they show that desalination units in the
industry make up more than half of the total number of units in the state. Probably
between 30- and 45-MGD desalination capacity exists for steam generation, and an
additional and growing capacity of 10 MGD in the food and beverage industry. Ultrapure
water needs of the semiconductor industry were estimated in the 15- to 30-MGD range.
When other usages, also discussed in Attachment E, are added in, total industrial capacity

29
for desalination of the state of Texas is in the 60- to 100-MGD range. This figure is
consistent with the Wangnick (2002) study relative to ratio of industrial capacity to total
capacity.
Data collection for industrial facilities cannot follow a procedure similar to that of
public water supply because there is no centralized database. Desalination is part of many
diverse industrial processes. Desalting typically occurs both at the beginning and the final
stages of an industrial process. In the latter case, economy created by recycling and
legislation regulating effluent disposal directly suggest that some treatment of wastewater
is beneficial. The former case is the most relevant to the problem at hand, however.
Although the main sources in Wangnick (2002) are plant operators, sources also include
membrane suppliers, suppliers of chemical additives, and national and international
organizations—hence the occasional lack of exact location of a plant or nonmention of
the customer in Table D3. Also, Wangnick (2002) stated that data reliability of RO plants
is lower than that of thermal and ED plants because of the large number of suppliers and
facilities.


31
5 Database Updates and Future Work In addition to the initial data gathering phase still needed for industrial facilities,
regular updates to the PWS database must also be undertaken. An overview of the work
is presented in Figure 5-1.
Texas Desalination
Universe
Municipal Industrial
TCEQ PWS Inventory (IWUD)
TCEQ Plan Review Log query
TCEQ industrial waste water permits
Municipal waste water pretreatment coordinators
TDHS (Health Services)
Regular updates are straightforward in principle
TCEQ waste injection permits
Regular updates are complex a priori
Figure 5-1. Simplified approach to a living desalination database
5.1 Update to Texas PWS Desalination Database As of 2005, there is no easy mechanism or procedure to update the Texas PWS
desalination database, short of undertaking similar surveys occasionally. The easiest
approach would be to periodically have Public Water System officials report treatment
and production updates in the PWS IWUD inventory (online TCEQ Water Utility
Database**). Redesign and changes to the database would be technically straightforward
to implement but would possibly involve TCEQ rulemaking to bring it about. Periodic
queries of the WUD inventory will show capacity, production, and process changes.
Because TCEQ reviews of PWS (material feeding IWUD) focus on those older facilities,

32
initial data entry of most recent facilities (built 2004–2006) would have to be researched
individually outside of IWUD. TCEQ field staff inspect treatment facilities every 3 years
on average.
To build a more complete database, it is also possible to mine TCEQ files to
populate the database with inactive and closed facilities (list given within Table D1).
5.2 Exhaustive List of Industrial Desalination Operators To build the industrial database, we propose to initially spot candidates using
regulatory linkages to collect information on industrial desalination operators and then to
contact them individually. This approach may be the only way to collect accurate
information. Those desalination facilities having a drinking-water component are already
captured with other PWS facilities. They are, however, a small fraction of the industrial
desalination universe. For all other facilities, researching industrial permits is the most
sensitive option (Figure 5-1). If a facility discharges mainly desalination waste, the
permit will specify origin of waste. Unfortunately, in most cases, discharge waste is a
mixture originating from different processes, only one of which could be RO. A
systematic review of these permits may be the fastest way to generate a complete list.
Another related approach could involve contacting individual cities. Most facilities must
have a pretreatment permit from the municipal owner of the wastewater system because
they discharge their waste to municipal wastewater collection systems. An estimated 50
to 100 such pretreatment coordinators exist in the state. Additionally, the Waste Permit
Division at TCEQ has 200 to 300 waste discharge permits that would be worth reviewing
individually, including UIC Class I and Class V injection wells. The Railroad
Commission of Texas (RRC) could also have data on Class II injection wells used to
dispose of desalination concentrate. The food, beverage, and pharmaceutical industries
are subject to supplementary regulatory oversight through the Texas Department of State
Health Services, where additional information can be collected. Attachment E presents a
long list of industrial facilities. A more systematic approach would involve contacting all
of them. Once initial construction of the database is completed, periodic updates could be
harder to complete than that of the PWS database.
33
6 References Baker, R.W., 2004. Membrane technology and applications. 2nd edition, Wiley, 538p. Christopher, J.E., J.M. Hudkins, S.G. Polk, and J.K. Kinslow, 2004. Establishing a Database of Membrane Treatment Plant Operations: A Survey of Membrane Operational Practices by Geographic Region. Poster presented at the 2004 American Membrane Technology Association (AMTA) Biennial Conference and Exposition, San Antonio, TX. Cuperus, F.P., and H.H. Nijhuis, 1993. Applications of membrane technology to food processing. Trends in Food Science and Technology, 4, p. 277-282. DOE/EIA (Department of Energy/Energy Information Administration), 2002. Inventory of Electric Utility Power Plants in the United States 2000. DOE/EIA-00095(2000). Energy Information Administration, March, 339p. DOE/EIA (Department of Energy/Energy Information Administration), 2003. Inventory of Nonutility Electric Power Plants in the United States 2000. DOE/EIA-00095(2000)/2. Energy Information Administration, January, 258p. DOE/OIT (Department of Energy/Office of Industrial Technologies), 2004. Improving Steam System Performance: A Sourcebook for Industry, DOE/GO-102004-1868, October, 102p. Filteau, G., C. Whitley, and I.C. Watson, 1995. Water reclamation fuels economic growth in Harlingen, Texas. Reclamation of municipal wastewater for industrial process use. Desalination, 105, p.31-37. Furukawa, D.H., 1994. National Facilities Survey by Separation Consultants, Inc.; Poway CA; September. Published as Report No 12 of the U.S. Bureau of Reclamation Water Desalination Research & Development Program. Hudkins, J.M., J.E. Christopher, M.D. Moretta, 2004. Preparing the Inevitable: A Survey of Membrane Cleaning Practices in the State of Florida. White paper. Mickley, M.C., 2001. Membrane Concentrate Disposal: Practices and Regulations, Desalination and Water Purification Research and Development Program Report No. 69, U.S. Department of the Interior, Bureau of Reclamation, Technical Service Center, 2001. Pepper, D., 1990. RO for improved products in the food and chemical industries and water treatment. Desalination, 77, p.55-71. Scott, K., 1995. Handbook of Industrial Membranes, 1st Edition, Elsevier Advance Technology, 912p. Texas Water Development Board (TWDB), 2002. Water for Texas. 156p.

34
Wangnick, K., 2002. 2002 IDA Worldwide Desalination Plants Inventory, Report No. 17. published by Wangnick Consulting GMBH in cooperation with IDA International Desalination Association (USA).

35
7 Attachment List Attachment A: Database Description Attachment B: Survey Form Attachment C: Overview of Recent Surveys Attachment D: Detailed Survey Results Attachment E: Road Map for Survey of Industrial Facilities Attachment F: List of Files on CD Attachment G: Useful Website Addresses Attachment H: Responses to Review Comments


Attachment A: Database Description


A-1
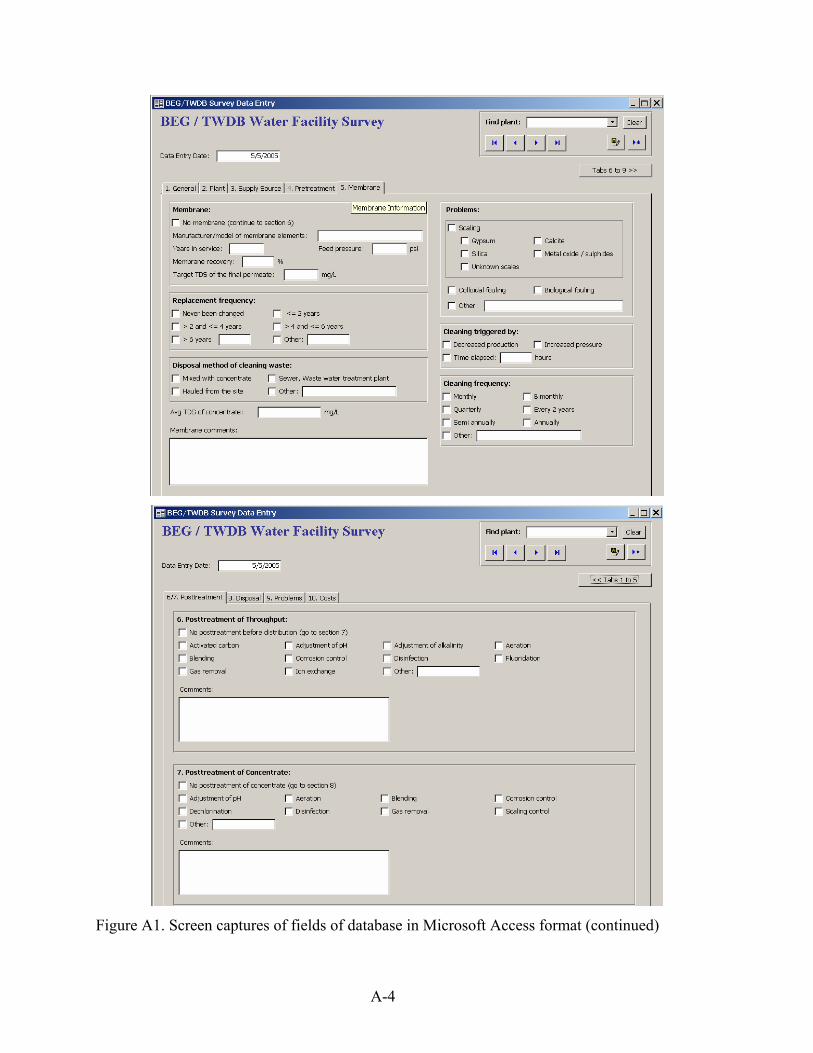
The survey form presented in Attachment B was initially translated into a
Microsoft Access electronic format (Figure A1). It consists of 10 fields chronologically
following, more or less, the water treatment process. The first field, “General
Information,” contains administrative and contact information. The second field, “Plant
Information,” includes total and desalination capacity, as well as average and permitted
production. The reasons for building the plant also belong in this field. The third and
fourth fields, “Raw Water Supply Source” and “Pretreatment of Desalination Unit Feed,”
deal with the raw water supply and its pretreatment. Pretreatment requested information
is somewhat detailed. The fifth field, “Membrane Information,” asks for specifics on the
membrane operation, including replacement and cleaning frequency. Sixth and seventh
fields, “Posttreatment of Throughput” and “Posttreatment of Concentrate,” are short and
self descriptive. The eighth field, “Concentrate Disposal,” details concentrate disposal
issues. Ninth and tenth fields, “Problems” and “Costs Issues,” complete the survey.
Comment boxes are also provided in each field to add complementary information not
fitting into the regular set of questions.
It is proposed that a user interface be built, allowing simple or multiple queries for
- Location: county
- Year facility built
- Water use: drinking water and/or other usages
- Water source: surface water, groundwater
- Plant type: reverse osmosis, electrodialysis reversal
- Desalination capacity, total capacity
- Blending or no blending
- Feed TDS
- Discharge type: evaporation pond, surface water, land application, WWTP,
(injection well)
- Pre- and posttreatments
- Reason for plant: TDS, contaminants
- Capital cost of plant

A-2
Figure A1. Screen captures of fields of database in Microsoft Access format

A-3
Figure A1. Screen captures of fields of database in Microsoft Access format (continued)
A-4
Figure A1. Screen captures of fields of database in Microsoft Access format (continued)

A-5
Figure A1. Screen captures of fields of database in Microsoft Access format (continued)

A-6
Figure A1. Screen captures of fields of database in Microsoft Access format (continued)

Attachment B: Survey Form


B-1
QUESTIONNAIRE FOR MUNICIPAL FACILITIES Data entered on: ________________ 1- GENERAL INFORMATION: BEG/TWDB Number: ___________________________________________________________ Plant Name and address: Official Name:_________________________________________________________________ Address: ______________________________________________________________________ ____________________________________________________________________________________________________________________________________________________________ County:_______________________________________________________________________ Water/Ground Water Conservation District (if applicable): ______________________________ Public Water System No (if applicable): _____________________________________________ Contact Name: _________________________________________________________________ Contact Title: __________________________________________________________________ Phone: _______________________________________________________________________ Fax: ________________________________________________________________________ Email: ________________________________________________________________________ Website: _____________________________________________________________________ Plant Designer: _________________________________________________________________ ______________________________________________________________________________ Contact_______________________________________________________________________ Plant Owner: __________________________________________________________________ ______________________________________________________________________________

B-2
Plant Operator: _________________________________________________________________ ______________________________________________________________________________ 2- PLANT INFORMATION: Plant status in the past few months: Operating; Idle since ______; Closed since _______ Year of plant start-up:__________________ Is desalination unit start-up year different? No Yes :______________ Cost of desalination plant when it was built:________________ Plant Category (check all that apply):
Drinking water production; Wastewater treatment; Landfill leachate treatment
Industrial: Power; Electronics; Beverage; Pharma.; Chemical; Other:______ Other:___________________________________________________________
______ Process Type (check all that apply):
RO (Reverse Osmosis) EDR (Electrodialysis Reversal) ED (Electrodialysis)
NF (Nanofiltration) ME (Multieffect Evaporation) MSF (Multistage Flash) VC (Vapor Compression)
Other:_________________ Plant Capacity
Design plant capacity including bypass (MGD): _________________________________
Permitted plant production including bypass (MGD): _____________________________
Average plant production including bypass (MGD): ______________________________
Strong seasonal variation in production (>25%)?: No Yes Desalination Unit Capacity
Same as plant capacity; there is no blending Blend water source: same as membrane feedwater; other:________________ Design production (MGD): _________________________________________ Permitted production (MGD): _______________________________________ Average production (MGD): ____________________________________ Average concentrate production (MGD):
______________________________________ Power Source: Grid; Collocation; Generated on site; Other:________________________ Reasons for building desalination plant (check all that apply):
High TDS High hardness High alkalinity High chloride
High sodium High sulfate High nitrate High arsenic

B-3
High radionuclides High fluoride High Fe/Mn Other:__________ Is an expansion of the plant being considered? No Yes 3- RAW WATER SUPPLY SOURCE: Groundwater; Surface water; Reclaimed water; Seawater; Other:__________ Average/Range of TDS of the membrane feedwater:_____________ Is turbidity an operational problem? No Yes: ___NTU;____SDI Are the following operational problems present? Fe/Mn H2S Organic matter/TOC Variability in raw water composition Distance from supply source to plant:_______________________________________________ If groundwater:
Well field location:_____________ Withdrawal zone:______________________ Screened interval: ________ ft to ________ft below land surface
If surface/seawater, intake location: ___________ If reclaimed water, water source___________ 4- PRETREATMENT OF DESALINATION UNIT FEED Filtration (check all that apply):
Gravity filter Media filter Bag filter Cartridge filter. Manufacturer if
applicable:___________________________________ Membrane (MF/UF). Manufacturer if
applicable:_______________________________ Other___________
Coagulation/flocculation: No Yes Alum Ferric chloride Ferric sulfate Polymer Other:_____________
Clarification: No Yes Oxidation: No Yes Why?______________________________________________________
Aeration; K permanganate; Green sand; same as disinfection; Other__________ Softening: No Yes
Lime addition Membrane (NF) Ion exchange Disinfection: No Yes
Chlorination/chloramination Ozonation UV Other Dechlorination: No Yes Activated carbon: No Yes: to remove______________ pH adjustment: No Yes Acidification: what pH?:__Addition of caustic?: what pH?:___ Scaling Control: No Yes. 5- MEMBRANE INFORMATION: No membrane, go to Section 6

B-4
Manufacturer/Model of membrane elements:__________________________________________ Years in service: _____________years Feed pressure: _________________psi Membrane recovery: _____________% What is the target TDS of the final permeate?:___________________mg/L Problems encountered:
Scaling: calcite; gypsum; silica; Metal oxide/sulphides;
other:_________________ don’t know nature of scales colloidal fouling: biological fouling
Membrane replacement frequency: never been changed ≤ 2 years > 2 and ≤ 4 years > 4 and ≤ 6 years > 6 years:____________ Other (irregular,..??):___________
Current membrane cleaning frequency: monthly; bimonthly; quarterly; semiannually; annually every 2 years; other:______________
Membrane cleaning triggered by: Decreased production; Increased pressure; Time elapsed: _________hours
Disposal method of cleaning waste: Mixed with concentrate Sewer, Wastewater treatment plant Hauled from the site other:______________
Average TDS of the concentrate:________________ 6- POSTTREATMENT OF THROUGHPUT No posttreatment before distribution, go to Section 7 Activated carbon Adjustment of pH Adjustment of alkalinity Aeration Blending Corrosion control Disinfection Fluoridation Gas removal Ion exchange Other:___________________ 7- POSTTREATMENT OF CONCENTRATE No posttreatment of concentrate, go to Section 8 Adjustment of pH Aeration Blending Corrosion control Dechlorination Disinfection Gas removal Scaling Control Other:_________________ 8- CONCENTRATE DISPOSAL Co-disposal with neighboring facility? No Yes Disposal well: Distance to well:____________________________
Permit type: Class I Class II Class V

B-5
Surface water body:_____________ Distance to water body_______________________
Permit type: TPDES Other: ___________ Land application: on-site wastewater (i.e., septic) irrigation water Sanitary sewer, wastewater treatment plant name:____________________________________ Evaporation pond. Ultimate fate of dry residue:______________________________________ Zero-discharge 9- PROBLEMS Chemicals: ___________________________________________________________________ ______________________________________________________________________________ Disposal of concentrate: ________________________________________________________ ______________________________________________________________________________ Electronics: __________________________________________________________________ ______________________________________________________________________________ Feedwater: __________________________________________________________________ ______________________________________________________________________________ Membrane: __________________________________________________________________ ______________________________________________________________________________ Operating costs: ______________________________________________________________ ______________________________________________________________________________ Permitting: ___________________________________________________________________ ______________________________________________________________________________ Posttreatment of concentrate: ____________________________________________________ ______________________________________________________________________________ Posttreatment of permeate: ______________________________________________________ ______________________________________________________________________________

B-6
Pretreatment: _________________________________________________________________ ______________________________________________________________________________ Pump/Valves: ________________________________________________________________ ______________________________________________________________________________ Well/Intake: __________________________________________________________________ ______________________________________________________________________________ 10- COST ISSUES Average rate/cost of power as of 2004 if applicable:
Not available <1¢ /kWh >1¢ and ≤3¢ /kWh >3¢ and ≤5¢ /kWh >5¢ and ≤10¢ /kWh >10¢ /kWh
Average cost of water production:__________________________________________________ Average cost of desalinated water production:_________________________________________ Operation and Maintenance costs:
Not available Feedwater cost
__________________________________________________________ Labor cost
_______________________________________________________________ Membrane replacement cost
________________________________________________ Chemical cost
____________________________________________________________ Energy cost
______________________________________________________________ Concentrate disposal cost
___________________________________________________

Attachment C: Overview of Recent Surveys


C-1
Until now, an accurate database containing information on desalination facilities
did not exist for Texas. Although there have been several compilation studies of
desalination facilities across the world and the United States, none tried to collect an
exhaustive list of these facilities. This attachment not only focuses on Public Water
Supply systems (PWS) but also discusses other facilities making use of desalination. The
symbol ** indicates that a full Web address is given at the end of the document in
Attachment G.
C.1 Review of Previous Studies Several market research firms keep tabs on developments in desalination fields at
the world scale (e.g., McIlvaine Company**; Global Water Intelligence**; Water
Desalination Report**; Business Communications Company**; The McGraw-Hill
Companies**) and are a good source of information. The information, proprietary and
only accessible for a fee, is regularly updated. The firm’s goal of including desalination
facilities across the world does not mean that only large facilities are surveyed. In
addition, they often provide information about future desalination facilities. However,
level of technical detail provided is often limited, and databases are not always updated
when a facility is decommissioned.
In alternate years, the International Desalination Association** (IDA), in
association with Wangnick GMBH**, a German consulting firm, publishes an inventory
of desalting facilities (Wangnick, 2002; also available on the Web for a fee at
http://pam.wangnick.com/). A total of 123 desalination facilities in Texas, including
industrial facilities, are listed (Table D3). The company tries to gather data about
facilities whose production is >100 m3/day (0.026 MGD), but the actual cutoff value for
reporting an individual unit is 600 m3/day (0.156 MGD).
In the United States, the most recent national survey is by Mickley (2001), who
surveyed 149 facilities across the country. The cutoff rate was 0.025 MGD, and the
survey included UF and MF. Texas was represented by 11 RO/EDR facilities. The focus
of the study was the fate of the membrane concentrate, but the survey provided other
detailed technical information about these facilities. An updated survey is in the works
(Scott Irvine, U.S. Bureau of Reclamation, personal communication). Tetratech
(Christopher et al., 2004; Hudkins et al., 2004) did a publicly unavailable study of a few

C-2
desalination facilities across the nation, and two Texas facilities were contacted. The
focus of the work was mainly membrane cleaning practices. Furukawa (1994) did a now-
obsolete survey of research facilities.
The WateReuse Foundation**, in association with the California Department of
Water Resources (CDWR**), is in the process of gathering data on desalination facilities
in California, as well as nationwide (Wade Miller, Executive Director at the WateReuse
Foundation, personal communication).
To gather up-to-date information, American Water Works Association**
(AWWA) through Mr. Sherman May, Chair of the California/Nevada chapter, and
AWWA Research Foundation** (AWWARF) were contacted. AWWARF has launched a
worldwide survey of MF/UF facilities with a capacity >1 MGD (AWWARF-Membrane
Knowledge Base Project 2763 SCOPE.pdf).
C.2 Other Current U.S. Efforts at the State Level In addition to regularly updated international surveys that often use indirect
information (chemical additive or membrane suppliers, newspapers, and journals), there
are also locally initiated efforts to consolidate current information. States with the most
desalination facilities are Florida, California, and Texas (Mickley, 2001). Illinois, Iowa,
Nevada, and North and South Carolina also have more than five desalination facilities,
according to Mickley (2001).
California
California is home to several water-resources-related organizations and agencies
active in gathering data about desalination. The California/Nevada chapter of AWWA is
also active in helping diverse organizations gather data.
The California Department of Water Resources** Desalination Task Force,
headed by Mr. Keene, has been responsive to our inquiries. A preliminary and partial
database is available in the companion CD in the file Desalting Plants -
Master 11x17.xls, courtesy of Dr. Fawzi Karajeh, Chief of the Water Recycling
and Desalination Branch at the CDWR. The database provides data for about 95 facilities
using seawater, brackish water, surface water, and wastewater as feedwater. It includes
several industrial facilities, particularly power plants.

C-3
As mentioned earlier, the WateReuse Foundation, in association with the
California Department of Water Resources, is also currently building a desalination
database. In addition, the study collects information on water reuse and conservation.
Desalination Research and Innovation Partnership** (DRIP) is currently doing a
worldwide survey (http://www.dripronfsurvey.com/) with the collaboration of
Montgomery-Watson Harza** (MWH). DRIP is a coalition of California public utilities
formed for the purpose of improving current knowledge on desalination (DRIP
Program.pdf). The goal of this project is to compile a comprehensive database of
existing RO/NF facilities worldwide, including California. The study is focused on
facilities with capacities ≥1 MGD.
The California Energy Commission**, under the direction of Mr. Cesar Lopez, is
sponsoring the development of a Knowledge Base for Desalination Technology for
MF/UF facilities with the San Diego Water Authority** on seawater desalination
facilities. The study involves mainly an evaluation of pretreatment options.
The California Coastal Commission** presents a list of seawater facilities with
minimal information in CA Coastal Act 14a-3-2004-desalination.pdf.
Florida
The State of Florida is currently engaged in no specific effort to gather data on
state desalination facilities. Mr. Steve Duranceau from Boyle Engineering** provided us
with an inventory of facilities in Florida (FDEP Listing of RO and NF
WTPs.doc), which originated at the Florida Department of Environmental Protection,
Drinking Water Section**. The database contains information on 134 facilities, all for
public water systems.


Attachment D: Detailed Survey Results


D-1
D.1 Description of the Data Collection Process The first step in data collection was a query of the TCEQ PWS database (file
DESAL TCEQ.xls, communicated by Mr. Anthony Bennett from TCEQ, Water
Supply Division), hereafter referred to as the “TCEQ list.” An inventory of the TCEQ list
(Table D1) shows a total of 99 entries, but only 70 entries with a water production of
0.025 MGD or larger. Please note that the total production given in the table may include
blending of desalination unit permeate and separate water treatment units, including those
with no desalination capabilities. One of the goals of the study was to determine the
extent of blending. The 29 facilities presented in Table D2 with a capacity <0.025 MGD
represent stores, gas stations, schools, etc., that are likely to subcontract maintenance. It
was decided that the time spent contacting those facilities would be better spent
investigating industrial facilities. During the actual study it was realized that several
facilities with a listed nominal capacity ≥0.025 MGD actually have a smaller production.
These facilities are not listed in the final database. They are, however, provided as a
complement to this study in a Microsoft Access database (BEG TWDB Water
Survey06-13-05_ALL.mdb). In addition, a few of these facilities are no longer
active. Because the TCEQ database is only periodically updated, more recent facilities
are not yet included in the TCEQ public water supply database. The bottom section of
Table D1 presents a list, thought to be reasonably exhaustive, of those facilities. Table D3
displays results from the IDA inventory (Wangnick, 2002) for the state of Texas. It
includes both industrial and PWS desalination facilities.
At the end of the survey, a total of 105 public water system facilities were called,
38 of which were eventually retained in the final list (Table D4). Part of the remainder
consists of 19 facilities whose desalination capacity is below the threshold of 0.025 MGD
(although total capacity can be ≥0.025 MGD in a few cases). Other facilities (a total of
18) had become inactive since they were last visited by the TCEQ staff. We were unable
to gather much information on those facilities. Among these, some had dropped the
RO/EDR process for a classical treatment because the source-water quality had
improved. Another 12 facilities never had desalination treatments. A total of four
contacted facilities have not built their plants yet (more on future plants in Section 4.2).
Another five facilities, all in the West Texas oil and gas province of the Permian Basin,

D-2
use the RO permeate chiefly for industrial purposes (above-ground treatment of gas and
fresh-water injection for waterflooding reservoirs). A tiny fraction of the desalination
production is used for drinking water. We were unable to gather data on nine, mostly
small, facilities. The decision was made to focus time and resources on larger facilities.
An additional 29 facilities, having already a total capacity <0.025 MGD on the
TCEQ list, were not contacted (Table D2). It should be noted that, per our experience
with the 18 smaller facilities that we called, total capacity numbers for small facilities
(<0.025MGD) as provided by the TCEQ overestimates desalination capacity by a large
amount. Those small facilities typically use small RO units for drinking water, but not for
other domestic uses that utilize a far greater fraction of the total consumption.
Inactive/dismantled facilities and dissolved water supply entities (Table D4) fall
into two categories: large industrial facilities and small PWS facilities. One of the largest
industrial facilities, the City of Harlingen Waste Water Treatment plant, had a design
capacity of 5 MGD. This facility was recently decommissioned and is not included in this
study. The desalination units of the Freeport McMoran sulphur plant in Culberson
County of West Texas have also been deactivated (capacity of ~4 MGD). Other industrial
facilities are related mostly to oil and gas production in West Texas. The Duke Energy
Field Services (DEFS) Spraberry plant uses ~1 percent of its RO production for drinking
water. On the other hand, the DEFS Pegasus plant currently uses all of its production for
industrial purposes. All these facilities are included in the TCEQ list because, at some
point in time, they have provided or provide drinking water for the personnel working in
the plants. Most small plants or installations had been shut down because needs are now
filled by the local drinking-water distribution network. These industrial facilities also
include the TMPA Gibbons Creek power plant near Bryan, Texas. However, Midland
Country Club, which uses desalinated water for irrigation (0.11 MGD + 0.001 MGD
drinking water), has been retained in the final list.

D-3
Table D1. Initial working list for municipal facilities (Public Water Supply Desalination Facilities provided by TCEQ). Facilities contacted but not on TCEQ list are added at the end of the table.
System/City/Facility name County PWS ID Survey status
Total production as provided by TCEQ
(MGD) Harlingen Waterworks System Cameron 0310002 Inactive/Dissolved 31.393 City of Sherman Grayson 0910006 Final List 25.840 Lake Granbury Surface Water Advanced Treatment System Hood 1110100 Final List 14.200
City of Fort Stockton Pecos 1860001 Final List 14.147 DEFS Goldsmith East Plant Ector 0680205 Inactive/Dissolved 11.729 DEFS Goldsmith Plant Ector 0680068 Industrial 11.729 Horizon Regional Municipal Utility District El Paso 0710005 Final List 8.481
Freeport McMoran Sulphur Inc Culberson 0550024 Inactive/Dissolved 3.960 City of Granbury Hood 1110001 Final List 3.520 City of Robinson McLennan 1550010 Final List 2.380 City of Electra Wichita 2430002 Final List 2.228 City of Kenedy Karnes 1280002 Final List 1.921 City of Seadrift Calhoun 0290004 Final List 1.540 City of Tatum Rusk 2010034 Final List 1.136 Oak Trail Shores Hood 1110004 Final List 1.130 Pan Energy Coyanosa Gas Plant Pecos 1860022 Inactive/Dissolved 0.864 Power Resources Inc C R Wing Plant Howard 1140027 Inactive/Dissolved 0.800 DEFS Fullerton Plant Andrews 0020004 Industrial 0.757 Altura Energy Ltd Midland Farms Andrews 0020007 Inactive/Dissolved 0.475 DEFS Pegasus Plant Midland 1650049 Industrial 0.067 DEFS Spraberry Plant Midland 1650026 Industrial 0.432
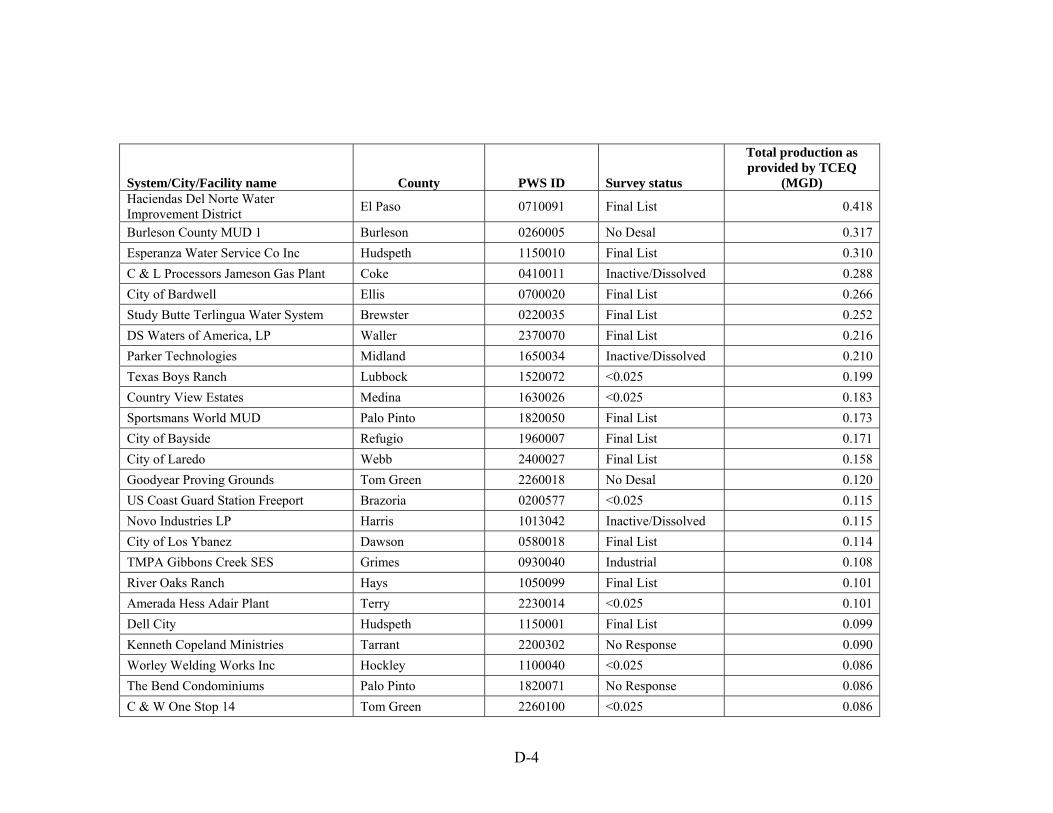
D-4
System/City/Facility name County PWS ID Survey status
Total production as provided by TCEQ
(MGD) Haciendas Del Norte Water Improvement District El Paso 0710091 Final List 0.418
Burleson County MUD 1 Burleson 0260005 No Desal 0.317 Esperanza Water Service Co Inc Hudspeth 1150010 Final List 0.310 C & L Processors Jameson Gas Plant Coke 0410011 Inactive/Dissolved 0.288 City of Bardwell Ellis 0700020 Final List 0.266 Study Butte Terlingua Water System Brewster 0220035 Final List 0.252 DS Waters of America, LP Waller 2370070 Final List 0.216 Parker Technologies Midland 1650034 Inactive/Dissolved 0.210 Texas Boys Ranch Lubbock 1520072 <0.025 0.199 Country View Estates Medina 1630026 <0.025 0.183 Sportsmans World MUD Palo Pinto 1820050 Final List 0.173 City of Bayside Refugio 1960007 Final List 0.171 City of Laredo Webb 2400027 Final List 0.158 Goodyear Proving Grounds Tom Green 2260018 No Desal 0.120 US Coast Guard Station Freeport Brazoria 0200577 <0.025 0.115 Novo Industries LP Harris 1013042 Inactive/Dissolved 0.115 City of Los Ybanez Dawson 0580018 Final List 0.114 TMPA Gibbons Creek SES Grimes 0930040 Industrial 0.108 River Oaks Ranch Hays 1050099 Final List 0.101 Amerada Hess Adair Plant Terry 2230014 <0.025 0.101 Dell City Hudspeth 1150001 Final List 0.099 Kenneth Copeland Ministries Tarrant 2200302 No Response 0.090 Worley Welding Works Inc Hockley 1100040 <0.025 0.086 The Bend Condominiums Palo Pinto 1820071 No Response 0.086 C & W One Stop 14 Tom Green 2260100 <0.025 0.086

D-5
System/City/Facility name County PWS ID Survey status
Total production as provided by TCEQ
(MGD) Gaines County Golf Course Gaines 0830019 No Desal 0.072 Gaines County Park Gaines 0830018 <0.025 0.072 Midland Country Club Midland 1650032 Final List 0.070 Eisenhower Park Bexar 0150499 <0.025 0.065 Big Bend Motor Inn Brewster 0220027 Final List 0.060 EBAA Iron Inc Water System Eastland 0670035 Inactive/Dissolved 0.060 Reinforced Earth Co McLennan 1550135 Inactive/Dissolved 0.060 Occidental Permian Ltd N Cowden Ector 0680151 No Desal 0.059 Kent Kwik Convenience Store 312 Midland 1650086 No Response 0.057 Kent Kwik Convenience Store 315 Midland 1650096 No Response 0.057 Regency Gas Service Pecos 1860020 <0.025 0.057 Villa Condominiums Assn Palo Pinto 1820029 Inactive/Dissolved 0.050 Conoco Forsan Field Office Glasscock 0870010 Inactive/Dissolved 0.047 Phillips 66 Clemens Terminal Brazoria 0200551 Inactive/Dissolved 0.043 Longhorn Ranch Motel Brewster 0220032 Final List 0.043 Occidental Permian Ltd S Cowden Ector 0680175 <0.025 0.043 ConocoPhillips Mertzon Plant Irion 1180005 <0.025 0.043 Texas Water Station Martin 1590011 <0.025 0.043 Camp Constantin Palo Pinto 1820036 Inactive/Dissolved 0.041 Wades General Store Tom Green 2260059 <0.025 0.036 International Garment Processors El Paso 0710166 No Response 0.033 Diamond W Longhorn Ranch Bexar 0150504 No Response 0.029 Onyx Environmental Services Jefferson 1230082 <0.025 0.029 Depot Water Store Ector 0680198 <0.025 0.028 Goulds Pumps Inc Lubbock 1520235 <0.025 0.028

D-6
System/City/Facility name County PWS ID Survey status
Total production as provided by TCEQ
(MGD) Water Runners Inc Midland 1650113 Final List 0.028 Bedl Inc Ole Gin Steak House Tom Green 2260103 <0.025 0.028 Willow Condominiums Palo Pinto 1820049 Inactive/Dissolved 0.027
Additional Facilities Contacted
Holiday Beach Aransas 0040015 Final List City of Seymour Baylor 0120001 Final List Chaplines Mobile Home Development Brazoria 0200181 No Desal Valley MUD #2 Cameron 0310059 Final List Southmost Regional Water Authority Cameron 0310150 Final List City of Primera Cameron 0310094 Final List Millersview Doole WSC Concho 0480015 Future RO Lower Valley Water District El Paso 0710154 No Desal Loop WSC Gaines 0830011 <0.025 North Cameron/Hidalgo WA Hidalgo 1080029 Final List City of Mount Calm Hill 1090005 No Desal City of Brady McCulloch 1540001 Final List City of Miles Runnels 2000002 No Desal City of Breckenridge Stephens 2150001 No Desal City of Abilene Taylor 2210001 Final List City of Wichita Falls Wichita 2430001 No Desal City of Raymondville Willacy 2450001 Final List Medina WSC Bandera 0100013 No Desal Key Largo Utilities Brazoria 0200401 No Response Hop & Shop 25 Brooks 0240012 <0.025

D-7
System/City/Facility name County PWS ID Survey status
Total production as provided by TCEQ
(MGD) Craft Turney WSC Cherokee 0370016 No Response East Montana Water System Butterfield El Paso 0710118 Inactive/Dissolved Mountain Shadow Water El Paso 6001122 No Response Fort Hancock WCID Hudspeth 1150005 Future RO The Cliffs Palo Pinto 1820061 Final List City of Beckville Panola 1830002 Final List Windermere Water System Travis 2270161 Final List City of Granger Williamson 2460002 No Desal Twin Cove Resort Zapata 2530024 Inactive/Dissolved Central Texas WSC Bell 0140161 Future RO Sylvester-McCaulley WSC Fisher 0760012 Future RO

D-8
Table D2. Small desalination facilities from TCEQ list
Public water system name County PWS ID Survey status
Total Production as Provided by TCEQ (MGD)
Saint Albans Episcopal Church Travis 2270281 <0.025 0.024 Back To Basic Christian Day Care Brazoria 0200509 <0.025 0.022 Blue Nile Water Co Midland 1650114 <0.025 0.022 Speedy Stop 46 Victoria 2350044 <0.025 0.018 Mullin ISD Mills 1670013 <0.025 0.017 BP America Production Company Crane Gas Plant Upton 2310029 <0.025 0.016 Old Ocean Federal Credit Union Brazoria 0200507 <0.025 0.014 Circle K 2157 Live Oak 1490028 <0.025 0.014 Midland Coating Plant B Midland 1650109 <0.025 0.014 Water Wagon Water Hauling Service Tom Green 2260091 <0.025 0.014 Austin Waldorf School Inc Travis 2270254 <0.025 0.014 Cummins Southwest Inc El Paso 0710164 <0.025 0.006 International Family Missions El Paso 0710161 <0.025 0.002 TPWD Parrie Haynes Youth Ranch Bell 0140159 <0.025 0.000 Genes Country Store Brazoria 0200559 <0.025 0.000 Plateau Truck & Auto Center Culberson 0550016 <0.025 0.000 Collier Water Store Ector 0680206 <0.025 0.000 Vista Montana Court El Paso 0710086 <0.025 0.000 Jackies Exxon Gaines 0830021 <0.025 0.000 American Spring Wire Corp Harris 1013137 <0.025 0.000 City of Hubbard Hill 1090002 <0.025 0.000 Windmill Farms Kaufman 1290043 <0.025 0.000 Acuff Steak House Lubbock 1520120 <0.025 0.000 Pinkies Mini Mart 53 Lubbock 1520135 <0.025 0.000 Bunny Ranch Lubbock 1520138 <0.025 0.000 Petes Drive In 4 Lubbock 1520184 <0.025 0.000 Pinkies Mini Mart 51 Lubbock 1520204 <0.025 0.000 Water Tech Inc Midland 1650105 <0.025 0.000 Ranger Station Midland 1650112 <0.025 0.000
NOTE: Facilities on this table were not contacted

D-9
Table D3. IDA inventory of Texas desalination facilities sorted by decreasing capacity (from Wangnick, 2002). Municipal facilities have an orange (dark) background; power facilities have a yellow (light) background. Key is at bottom of table.
Location County
Total capacity (MGD) Units Process Customer
Water quality User
Brazos River 5.749 3 RO City RIVER MUNI Harlingen 4.927 4 RO Fruit of the Loom WASTE INDU Denison Grayson 4.500 3 ED Texoma Utility RIVER MUNI Unknown Facility 4.079 4 ED PURE INDU Eugene 3.910 1 RO WASTE INDU Unknown Facility 3.500 3 ED RIVER MUNI Brazos River 3.500 4 ED River Authority RIVER MUNI Seymour Baylor 3.012 2 RO City BRACK MUNI Ft. Stockton Pecos 3.000 2 RO Pecos Country BRACK MUNI Unknown Facility 2.457 9 RO PURE INDU Texas City Galveston 2.160 2 MSF Union Carbide BRACK INDU Freeport Brazoria 2.016 3 RO RIVER INDU Robinson McLennan 2.000 1 RO City of Robinson BRACK MUNI Harlingen 2.000 2 RO Waterworks RIVER MUNI Dallas Dallas/Collin/Denton 1.876 1 RO Texas Instruments BRACK INDU Unknown Facility 1.836 3 RO PURE INDU Unknown Facility 1.685 5 RO PURE INDU Choco Bayou 1.584 1 RO Oxichem RIVER INDU Unknown Facility 1.501 1 ED BRACK Unknown Facility 1.500 5 RO PURE DEMO Unknown Facility 1.500 5 RO PURE INDU Unknown Facility 1.500 1 ED RIVER MUNI Freeport Brazoria 1.400 1 RO Dow RIVER INDU Dallas Dallas/Collin/Denton 1.189 1 RO WASTE INDU Corpus Chris Live Oak 1.152 2 RO BRACK INDU

D-10
Location County
Total capacity (MGD) Units Process Customer
Water quality User
Texas City Galveston 1.152 1 RO RIVER INDU Unknown Facility 1.152 4 EDI INDU Austin Travis/Williamson 1.112 3 RO PURE INDU Austin Travis/Williamson 0.976 3 RO PURE INDU Freeport Brazoria 0.925 1 ME US DOI SEA MUNI EI Paso El Paso 0.872 2 RO Chevron RIVER INDU Unknown Facility 0.864 3 HYBRID PURE INDU Unknown Facility 0.864 2 RO RIVER INDU Big Spring Howard 0.864 1 RO WASTE INDU Texarkana Bowie 0.864 1 VC International Paper WASTE INDU Martin Lake 0.864 1 VC Utilities WASTE POWER Lubbock Lubbock 0.860 2 RO BRACK INDU Austin Travis/Williamson 0.824 4 RO PURE INDU Texarkana Bowie 0.806 1 VC International Paper WASTE INDU Gregory San Patricio 0.792 1 RO Ferguson BRACK INDU Austin Travis/Williamson 0.756 1 RO IBM BRACK INDU Martin Lake 0.721 1 RO Utilities WASTE POWER Monticello 0.721 1 RO Texas Utilities WASTE POWER Dallas Dallas/Collin/Denton 0.720 1 RO Texas Instruments BRACK INDU Totum 0.700 3 RO Texas Utility BRACK POWER Dallas Dallas/Collin/Denton 0.608 1 RO WASTE INDU Guadalupe 0.581 1 VC TIE WASTE POWER Texas City Galveston 0.576 1 RO BRACK INDU Choco Bayou 0.576 1 RO RIVER INDU Deer Park 0.576 1 RO RIVER INDU Three Rivers Live Oak 0.576 2 RO WASTE INDU Unknown Facility 0.549 2 EDI PURE INDU Stafford Fort Bend/Harris 0.546 2 RO Texas Instruments BRACK INDU

D-11
Location County
Total capacity (MGD) Units Process Customer
Water quality User
Unknown Facility 0.528 1 RO PURE INDU San Marcos Comal/Bexar 0.528 2 VC ANP WASTE POWER Dallas Dallas/Collin/Denton 0.527 2 RO Mostek BRACK INDU Unknown Facility 0.518 1 ED Semiconductor PURE INDU Corpus Christi Live Oak 0.505 1 RO Oxichang RIVER INDU Texas City Galveston 0.504 1 RO BRACK INDU Carrollton Denton/Dallas/Collin 0.480 1 RO BRACK INDU Bremond Robertson 0.464 2 VC Zachry BRINE INDU Kenedy Bee/Karnes 0.461 1 RO City BRACK MUNI Kenedy Bee/Karnes 0.461 1 RO City RIVER INDU Irving Dallas 0.460 1 RO BRACK INDU Unknown Facility 0.432 1 EDI PURE INDU Glenrose Somervell 0.432 2 RO BRACK POWER Unknown Facility 0.432 1 ED BRACK Conroe Montgomery 0.432 1 RO BRACK INDU Comanche Peak Comanche 0.432 1 RO Texas Utility RIVER POWER EI Paso El Paso 0.432 1 RO Power RIVER POWER Carrollton Denton/Dallas/Collin 0.431 2 RO BRACK INDU Odessa Midland/Ector 0.400 1 ME Tire & Rubber WASTE INDU EI Paso El Paso 0.400 1 RO El Paso Electricity BRACK POWER Unknown Facility 0.383 1 RO BRACK INDU Unknown Facility 0.374 1 ED RIVER MUNI Irving Dallas 0.367 1 RO BRACK INDU Round Rock Travis/Williamson 0.360 1 RO BRACK INDU Monticello 0.360 1 VC Utilities WASTE POWER Deer Park Harris 0.360 1 RO BRACK INDU Jacksonville Cherokee 0.360 1 RO Electric Auth. BRACK POWER Houston Harris 0.359 2 RO Houston Lighting BRACK POWER

D-12
Location County
Total capacity (MGD) Units Process Customer
Water quality User
Morgan Creek 0.338 1 RO Tugco BRACK INDU Mt. Pleasant Titus 0.335 1 RO BRACK INDU Lubbock Lubbock 0.325 1 RO BRACK INDU Unknown Facility 0.317 1 ED BRACK INDU Sherman Grayson 0.317 2 RO Texas Instrument RIVER INDU Matagorda Matagorda 0.317 2 RO Light & Power BRACK POWER Unknown Facility 0.309 1 ED WASTE IRR Dallas Dallas/Collin/Denton 0.305 1 RO Mostek BRACK INDU Kenedy Bee/Karnes 0.300 1 RO City BRACK MUNI Brownsville Cameron 0.291 1 MSF Union Carbide SEA INDU Unknown Facility 0.288 1 ED BRACK INDU Unknown Facility 0.288 1 ED BRACK INDU Unknown Facility 0.288 1 ED BRACK INDU Unknown Facility 0.288 1 ED BRACK INDU Unknown Facility 0.288 1 RO BRACK INDU Austin Travis/Williamson 0.288 1 RO BRACK INDU Dallas Dallas/Collin/Denton 0.288 1 RO Texas Instruments BRACK INDU Sherman Grayson 0.288 1 RO Folgers Coffee BRACK INDU EI Paso El Paso 0.288 1 RO Electric Co BRACK POWER Unknown Facility 0.250 1 ED BRACK MUNI Irving Dallas 0.230 1 RO BRACK INDU Irving Dallas 0.230 1 RO BRACK INDU Irving Dallas 0.230 1 RO BRACK INDU Dallas Dallas/Collin/Denton 0.217 1 RO TW-Electric BRACK INDU EI Paso El Paso 0.217 1 VC Asarco WASTE INDU Dallas Dallas/Collin/Denton 0.217 1 RO TW-Electric BRACK POWER Carrollton Denton/Dallas/Collin 0.216 1 RO Mostek BRACK INDU Bruni Webb 0.216 1 RO WASTE INDU

D-13
Location County
Total capacity (MGD) Units Process Customer
Water quality User
Gary Panola 0.216 1 RO Municipality BRACK POWER Austin Travis/Williamson 0.202 1 RO Motorola BRACK INDU Unknown Facility 0.202 1 RO Sid Richardson RIVER INDU Unknown Facility 0.200 1 ED BRACK INDU Austin Travis/Williamson 0.200 1 RO Motorola BRACK INDU Waco McLennan 0.185 1 RO TU Electric RIVER INDU Irving Dallas 0.184 1 RO BRACK INDU Irving Dallas 0.184 1 RO BRACK INDU Irving Dallas 0.184 1 RO BRACK INDU Dayton Liberty 0.173 1 RO Power & Light BRACK POWER Round Rock Travis/Williamson 0.173 1 RO BRACK INDU San Antonio Comal/Bexar 0.173 1 RO BRACK INDU Grand Prairie Dallas/Ellis/Tarrant 0.160 1 ME SEA INDU
Key to table:
Process Equipment Feature Quality
ED Electrodialysis FLASH Flash evaporator EDR ED Reversal BRACK 3,000<TDS<20,000
EDI Electroionization FM Flat membrane ER Energy recovery in RO plants BRINE TDS>50,000
HYBRID Hybrid process HFM Hollow fiber membrane MVC Mechanical vapor compression PURE TDS<500
ME Multieffect evaporation MTU Membrane type unknown RIVER TDS<3,000 MSF Multistage flash OTHER All other equipment SEA 20,000<TDS<50,000 RO Reverse osmosis ST Submerged tube evaporator WASTE VC Vapor compression SWM Spiral wound membrane
VTE Vertical tube falling film evaporator

D-14
Table D4. Summary of survey results Facility category Number Comments
Total number of PWS facilities contacted 105 Description of subsets of facilities contacted
Accepted in final list (≥0.025 MGD) 38 Total desalination design capacity for Texas PWS is 52.3 MGD (see Table 2-1)
Future RO 4 Those contacted facilities have been added to Table 4-5
Inactive/Dissolved 18
The capacity of those inactive/dissolved facilities we contacted amount to ~0.15 MGD. However, summing up total production of currently inactive/dissolved facilities from TCEQ list yields 50 MGD of mostly industrial facilities, including 31.4 MGD for the Harlingen Waterworks System, 11.7 MGD for the DEFS Goldsmith East Plant, and 4 MGD for the Freeport McMoran Sulphur Inc. plant.
Industrial 5
The capacity of those mostly industrial facilities we contacted amount to <1. Summing up total production from TCEQ list yields 13 MGD, most of it due to a single plant (11.7 MGD for the DEFS Goldsmith Plant). Compared with that of other similar installations, this number is extremely high.
No desalination 12 We contacted those facilities because we had reasons to believe that they have had desalination at some point in time.
No response 9
We were unable to gather data from those, mostly small, facilities. Six out of the nine facilities have a cumulative total capacity of 0.35 MGD (from TCEQ list). We estimate ther cumulative capacity to be >0.35 and <0.5c
<0.025MGD 19
We called those facilities because the TCEQ list suggested they all were above the threshold of 0.025 MGD. Summing up total production from the TCEQ list yields 1.5 MGD, a large overestimation of the numbers gathered by the survey (~0.14 MGD).
SUM 105
Facilities <0.025MGD and not contacted 29
They amount to <0.2 MGD. This number, computed from the initial TCEQ list, represents a very conservative upper bound as suggested by the small facilities we did call and because it is not clear how much blending is done.

D-15
D.2 Revisiting Earlier Datasets A comparison with data from Mickley (2001), displayed in Table D5, will give a
time dimension to this study because the Mickley (2001) survey was performed in 1999.
Figure 4-6 confirms that desalination design capacity has more than doubled since that
time. In addition, cumulative design capacity of these 11 plants increased from 17.8
MGD to >20 MGD. These results are also graphically displayed in Figure D1. This figure
shows that, although some plants havre increased their production or are unchanged, a
few have possibly decreased theirs.
Table D5. Comparison of results with those of Mickley’s study (2001)
Mickley (2001) study This study
Plant name (county)
Design desalination
capacity Average
Production With
bypass
Design desalination
capacity Average
production Total
production City of Sherman (Grayson) 6. 5.5 10 7.5 3. 10.
Lake Granbury (Hood) 7.5 5 7.5 6. 1.8 10.
Harlingen Waterworks System (Cameron) 4. 3 4 N/A N/A N/A
City of Fort Stockton (Pecos) 3. 2 6.5 6. 4.5 7.
City of Granbury (Hood) 0.62 0.278 0.343 0.11 0.09 0.55
Sportsmans World (Palo Pinto) 0.144 0.04A 0.144A 0.083 0.05 0.083
Oak Trail Shores (Hood) 0.14 0.144 0.25 0.792 0.4 1.849
Dell City (Hudspeth) 0.10 0.10 0.10 0.10 0.05 0.10
Haciendas Del Norte (El Paso) 0.08 0.08 0.16 0.05 0.04 0.23
River Oaks Ranch (Hays) 0.076 0.069 0.076 0.144 0.04 0.144
Esperanza (Hudspeth) 0.058 0.059 0.086 0.023 0.023 0.056
Big Bend Motor Inn (Brewster) 0.05 0.03 0.3 0.072 0.041 0.072
NOTE: All capacity and production values in MGD AMickley (2001) gave 0.04 MGD total capacity with bypass and 0.144 MGD for average production. Values were switched in agreement with our own results.

D-16
0.01
0.1
1
10
0.01 0.1 1 10
Desalination Design Capacity (MGD) (Mickley, 2001)
Des
alin
atio
n D
esig
n C
apac
ity (M
GD
)
Oak Trail Shores
Fort Stockton
Lake GranburySherman
Granbury
Sportsmans WorldHaciendas Del Norte
Esperanza
River Oaks Ranch
Big Bend Motor Inn
Figure D1. Comparison of desalination design capacity compiled during this study (y-
axis) and Mickley’s study (2001) (x-axis)
Attachment E: Road Map for Survey of Industrial Facilities


E-1
Industrial processes are extremely diverse and varied. They relate to
brackish/seawater desalinations in several ways: membranes are used throughout most
industrial processes that deal with fluids (liquids and gas). Membranes can treat a
multitude of industrial fluids (milk, wastewaters, gases). Membrane material and
structure are much more diverse than the ones typically used for public water supplies.
Brackish/seawater is used as input for some industries, but wastewater is a more common
occurrence.
Desalination needs for industrial facilities fall into three broad categories: steam
generation for power, heating and other related needs, feedwater for the beverage and
food industry, and demineralized, ultrapure water needs for the microelectronics industry.
Of the three categories, feedwater for the beverage and food industry is the closest to that
of municipal facilities because it is also generated for human consumption. Ultrapure
water generation is the most remote to municipal needs because the process often starts
with municipal tap water.
The procedure to collect data about industrial desalination facilities can follow
two paths: a systematic regulatory approach as described in Section 5.2 or a more
opportunistic methodology as detailed below. Because it was not feasible to contact all
industrial desalination facilities in the course of this study, we established the following
approach:
1) learning about relevant industrial processes (through literature search and
personal contacts in the industries) and making a judgment call on whether the
water treatment component was similar to that of public water supply
desalination units,
2) contacting trade groups and associations to find out how many units might
exist in Texas, and
3) surveying larger units or contacting the corporate office of important players in
relevant industries.
For example, the soft drink industry clearly needs water as a raw product. Water
is often desalted and altered by ion exchange or membrane processes during production,
as a function of feedwater quality. With information about the industrial process and
knowledge of the number and size of bottling plants, size and number of desalination

E-2
units can be estimated. Beer and food industries could follow a similar process.
Surveying the power industry requires, again, a basic understanding of where and why
desalination/desalting units are needed and knowledge of number and size of facilities.
E.1 Desalination in Industrial and Other Facilities
E.1.1 Steam Generation Makeup water for boilers represents one of the most widespread uses of steam in
Texas. The power industry generates a large amount of pressurized steam to feed
electricity-generating turbines for general distribution to the public. In addition, many
large industrial sites do not rely on the power grid to meet their energy requirements, but
instead generate electricity on site, thus requiring boilers and desalination units in most
instances. Besides, many types of industrial facilities such as chemical plants, oil
refineries, paper-production plants, or food-processing plants, often produce steam for
heating or for mechanical drive. Other large entities, such as university campuses, also
use steam for heating. Many facilities produce steam for both uses. Steam is generated
through the use of hydrocarbon or nuclear fuel. Ideally, the same water would be
constantly recycled after being initially vaporized and then condensed after use; however,
periodic blowdowns and purges require that new water be added to the cycle at a rate
between 4 and 8 percent, or sometimes higher, of the boiler feedwater.
In general quality of the water that must be maintained is a function of operating
pressure (Scott, 1995, p. 541). The higher the operating pressure, such as in turbines, the
more stringent the requirements. High-pressure boilers also have lower blowdown ratio
requirements, as low as 1 percent, because the makeup water is of better quality to start
with. Boiler makeup water is traditionally either softened by ion exchange or
demineralized by both cation and anion exchange. In the latter case, depending on the
initial TDS of the feedwater, an initial NF/RO treatment is also often done. For example,
The University of Texas at Austin power station produces ~360,000 pounds of steam per
hour, has a combined capacity ~100 MW, and also generates steam for heating. Boilers
require a total of ~0.06 MGD on annual average. City of Austin Utilities tap water (TDS
of 250–300 ppm) provides the raw water. It goes through a sponge filter, is dechlorinated,
and then is acidified to a pH of 5.5. A reverse osmosis membrane then brings the

E-3
permeate conductivity to 10 μScm-1 (equivalent to a TDS of 1–5 ppm). The treatment
finishes with gas removal, followed by cation and anion exchange (resins exchanging
cations for H+ and anions for OH-). The conductivity of the final boiler makeup water is
~0.1 μScm-1 (~0.05 ppm). Gas removal, especially for O2, is an important part of the
process. This procedure is fairly typical (Scott, 1995). Other facilities use fresh or
brackish surface or groundwater, seawater, or wastewater as raw water. The general trend
of the industry is to improve water quality to minimize blowdowns.
Throughout the course of this study another power facility operator was
interviewed. The TMPA Gibbons Creek power plant has a nominal power of 420 MW. It
consumes ~0.1 MGD (including ~0.003 MGD for drinking water). The water TDS after
desalination unit is 5 ppm. Feedwater at ~250 ppm is drawn from a dedicated surface
water body. Feedwater follows a conventional but intensive pretreatment with filtration,
coagulation-flocculation-clarification, and chlorination.
Most electricity in the U.S. and Texas is produced by steam turbines, in which the
heat released by burning fuel (coal, natural gas, oil, waste products) or nuclear fission
reactions produces steam in a boiler. The steam is then directed to turbines for electricity
to be produced. Steam turbines constitute the bulk of the base loads of electric utilities.
Approximately 75 percent (60 and 15 percent for organic and nuclear fuel, respectively),
of the generating capacity currently needed by the country is provided. In generally
smaller gas/combustion turbines, combustion products contact turbine blades directly,
with no need for steam generation. It covers 8 percent of the country’s needs, and most of
the remainder is covered by hydraulic turbines.
The Department of Energy/Energy Information Agency** (DOE/EIA) compiles
data for energy sources and use across the country. DOE/EIA (2002 and 2003) provided
an exhaustive list of utility and nonutility power plants as of December 31, 2000.
Installed power-generation capabilities for utilities (nonutilities) in the U.S. and in Texas
are ~600,000 MW (210,000 MW) and 65,000 MW (19,000 MW), respectively (Table 17
of DOE/EIA, 2002, and Tables 1 and 8 of DOE/EIA, 2003). Approximately 43 (26) and
30 (2) percent is coal-based, respectively. In Texas, almost 60 (90) percent of facilities
are natural-gas capable. An additional 38,000 MW was scheduled at the time to be
operational by 2005. Few facilities use oil as a primary energy source.

E-4
The petroleum refining and chemical manufacturing industry also consumes a lot
of steam, in addition to its power and heating requirements (DOE/OIT, 2004). These are
used in distillation or fractionating towers, where different components of crude oil or
other feedstock are separated. For example, chemical sites that have ethylene (olefins)
plants generate a lot of steam but are also huge consumers (usually net importers of
steam) owing to their refrigeration requirements for high purity separation of ethylene
and propylene (Doug Kelly, personal communication). As indicated by the numerous
small units present in West Texas, field-water needs during oil and gas production may
also require desalination units. The pulp and paper industry makes use of steam as well,
particularly to dry paper products. Specialty paper plants use makeup water at a
particularly high rate.
E.1.2 Beverage and Food Industry The beverage and food industry makes extensive use of membranes in its
processes (Pepper, 1990; Cuperus and Nijhuis, 1993). Most processes involve separating
particles in suspension from the carrying fluid. The beverage industry comprises mainly
carbonated and noncarbonated soft-drink facilities, carbonated and noncarbonated
bottled-water facilities, and breweries. The soft drink and bottled water industry
traditionally processes feedwater by deionization and ion exchange, and in some cases by
distillation (evaporative process). However, bottlers are under increasing pressure to
maintain quality standards, and there is a push in the industry to use more membrane
treatment such as UF and RO. Given the diversity of the industry and of the processes
involved, it is difficult to estimate the fraction of state beverage production that has
undergone desalination.
E.1.3 Ultrapure Water Needs The microelectronics industry typically uses ultrapure water to rinse off chemical
substances between multiple etching steps of integrated circuit manufacturing. The
Samsung Austin Semiconductor L.P. plant in Austin, Texas, has several RO systems that
produce water of variable quality, but with a conductivity of 0.1 μScm-1 or less. The
standard for the industry is a conductivity of 0.055 μScm-1 (Scott, 1995, p.540),
equivalent to ~0.025 ppm. It is also equivalent to a resistivity of 18 Mohm.cm. The

E-5
electrically neutral chemical species of oxygen and silica must also be removed at the ppb
level, as well as contaminants. The general desalination unit flow chart is similar to that
described in Section E.1.1. After passing through multimedia and cartridge filters, tap
water is pushed through cellulose acetate RO membranes (thus, no need for
dechlorination), and gas removal and cation and anion exchange follow. Desalination unit
average production is ~1 MGD. Another contacted microelectronics facility, Cypress
Semiconductor Corp. in Georgetown, Texas, follows the same flow chart.
The pharmaceutical industry also requires large amounts of ultrapure water for the
manufacture of drugs and for preparation of injected treatments. The industry generally
accepts water with a conductivity of 3 μScm-1 (~1 ppm).
E.2 Semiquantitative Estimation of Desalination Output in Industrial Facilities
E.2.1 Steam Generation There is no easy way, short of calling the facility, to determine beforehand
whether an industrial facility uses a membrane-based or thermal-process desalination in
addition to ion exchange. In this section, we try to relate power capacity to desalination
capacity with a few benchmark facilities. Although the facilities listed in Table D3 that
are from the IDA inventory (Wangnick, 2002) undoubtedly overlap many facilities listed
in Table E1 and Table E3 (from DOE/EIA, 2002), only 13 facilities can be clearly
attributed to both. They are summarized in Table E4, and they are also displayed in
Figure E1, where three other facilities that we contacted and interviewed (The University
of Texas at Austin, Austin, TX; Samsung Austin Semiconductor L.P., Austin, TX; TMPA
Gibbons Creek plant in Grimes County, TX) are added.
In Figure E1, four facilities outside the general trend (top line) with high
desalination capacity and low power capacity are, from the top down, the Union Carbide
Texas City plant, International Paper Texarkana mill, Solutia/Monsanto Chocolate Bayou
plant, and Fina Big Spring Refinery. The straight line is described by the equation
Desal(MGD)=4.6×10⁻⁴ × Power(MW) + 0.32. The two utilities known to produce steam
mainly for electricity production yield the following equation (bottom straight line in
Figure E2): Desal(MGD)=1.9×10⁻⁴ × Power(MW).

E-6
Extrapolation from the two utility data points (Comanche Peak nuclear power
plant in Somervell County and TMPA Gibbons Creek facility) yields a desalination
capacity for power generation of ~1.9×10-4 × 60,000(MW) = 12 MGD for 94 utilities. A
major assumption is that all facilities practice some kind of desalination. However,
preliminary research shows that an unknown fraction of these facilities do only water
softening and/or ion exchange. The 68 nonutility facilities add another 15 to 30 MGD
through nonpower generation. Extrapolating from the straight line derived in the previous
paragraph yields 4.6×10-4 × 19,000(MW) + 0.32 = 9 MGD, which clearly underestimates
desalination capacity because steam is used for more than electricity production in
nonutility facilities. These applications may, however, not need water quality as high as
required for the turbines. It should also be noted that facilities do not work at 100 percent
of their capacity all the time. This fact adds another layer of uncertainty to the
calculation.
A similar conclusion can be reached by comparing results from water-use surveys
and power-utility capacities in each county, as presented in Figure E2. It shows that an
approximation of desalination needs is 61,800 MW × 0.0048 × 5% = 15 MGD.
Another approach to derive these approximations is to assume a blowdown ratio
of 5 percent over all facilities. Total steam-electric water demand for the state in 2000
was 607,000 AFY (TWDB, 2002), that is, ~540 MGD, which translates to 540 × 0.05=
27 MGD. This number may also include some cooling water. In some states, steam
condensing is done with a secondary closed loop that includes cooling towers. Heat is
rejected by allowing some cooling water to evaporate in the cooling towers. However, in
Texas, when large bodies of water are available, water is circulated against the stream
flux in a once-through system, is returned to the source, and is thus not consumed. This
water is separate from the steam cycle and typically does not go through a desalination
process, but a simpler treatment instead.
E.2.2 Beverage and Food Industry Beverage and food industry water requirements are process-dependent. The
Folgers coffee plant in Grayson County is cited in Wangnick (2002) with an RO capacity
of 0.288 MGD and with brackish water as feed. The Austin, Texas, Coca Cola plant
operator interviewed does not use desalination, but, as already mentioned, the responsible

E-7
engineer noted that there is a move in the industry toward RO. Table E6, Table E7, and
Table E8 list more than 500 companies representing several thousands of facilities.
Desalination requirements can be separated into two categories: pure water needed
strictly for the process and pure water needed as raw material. In the latter case, the
following assumptions are made:
- Only 20 percent of the beverage industry uses feedwater desalination. Intermediate
membrane and other manufacturing separation processes are not included.
- All desalinated water ends up on a store shelf, albeit with further processing, such
as addition of juice concentrate.
- There is no net export or import of beverages.
- The population of Texas is ~20 million people.
- Each Texan consumes ¼ gallon a day of processed beverages.
Therefore, a very approximate value of desalination production for raw material
of 1 MGD may be computed. Actually, given that a single plant needs >25 percent of this
amount for purely manufacturing processes, the total desalination capacity of the
beverage and food industry is most likely dominated by manufacturing needs, not raw
material demand.
E.2.3 Ultrapure Water Needs of the Semiconductor and Pharmaceutical Industries
Although ultrapure water requirements are more uniform in this section than in
previous sections, there is no easy way to correlate plant size and/or manufacturing
numbers to desalination production. Collecting disparate information compiled from a
few microelectronics plants yields ~1 MGD for the Austin Samsung plant (interview) and
the following values for those facilities listed in Wangnick (2002) in Table E10: a total of
~3.75 MGD for five Texas Instrument plants in Dallas, Houston, and Sherman; 0.76
MGD for the now-closed Austin IBM manufacturing unit; a total of ~1 MGD for three
Dallas Mostek facilities; and 0.4 MGD for two Austin Motorola facilities. These total ~6
MGD for 5 of the 27 microelectronics companies listed in Table E11. It is then
reasonable to assume that ultrapure water needs for the electronics industry in Texas are
bracketed by 15 and 30 MGD.

E-8
The pharmaceutical industry also requires ultrapure water in some of its
manufacturing processes. These plants are more numerous, smaller, and more likely to be
less demanding in desalted water than those of the microelectronics industry. It is
difficult to estimate their water needs other than by interviewing representatives of a
selection of the facilities listed in Table E9, but most likely they are <10 MGD.
E.2.4 Water Needs from Other Industries Wangnick (2002) also listed a few other industries with RO units. The textile
industry is, for example, a consumer of desalinated water. A garment plant in Harlingen,
Texas (see Filteau et al., 1995) is listed as having one of the largest desalination facilities
in the state at ~ 5 MGD, with wastewater as feedwater (this plant was decommissioned in
2004), and, therefore, desalination of wastewater is a common occurrence. Evaporation-
based processes become competitive relative to RO when water TDS increases. The
paper industry is a voracious consumer of steam (two International Paper mills desalinate
~0.8 and ~0.85 MGD of wastewater through a vapor compression process). It is unclear
whether these numbers are already included in the steam generator data described in an
earlier section.

E-9
0.0
0.5
1.0
1.5
2.0
2.5
0 500 1,000 1,500 2,000 2,500
Power Plant Total Capacity (MW)
Des
alin
atio
n C
apac
ity (M
GD
)
TDS<3,000TDS 3,000<-<20,000Waste Water
Source: DOE/EIA (2002 and 2003); Wangnick (2002); this work NOTE: Larger symbols represent utilities; smaller symbols represent nonutilities. Top straight line
represents linear fit to all points except the anomalous four with the highest desalination capacity. The line does not go through the origin because not all steam production is used for generating electricity. Bottom straight line represents linear fit through the two facilities known to use most, if not all, desalinated water for electricity production (Comanche Peak and Gibbons Creek plants).
Figure E1. Regression plot showing relationship between power and desalination capacity of selected power facilities
y = 0.0048xR2 = 0.6123
0
5
10
15
20
25
30
0 1,000 2,000 3,000 4,000 5,000
Capacity (MW)
2001
TW
DB
Wat
er U
se S
urve
y fo
r Ste
am
Elec
tric
(MG
D)
Source: TWDB 2001 Water Use Survey Summary for Counties; DOE/EIA (2002) NOTE: Brazos, Matagorda, and Somervell Counties were not included in the regression
Figure E2. Crossplot of water use and power capacity for electrical utilities

E-10
Table E1. Electricity generation summary statistics Number of plants Nameplate capacity (MW) Utilities Fossil steam 93 58,495 Nuclear 2 5,139 Gas turbine 22 3,481 Hydroelectric 26 659 Other 18 142 Nonutilities Fossil steam Gas turbine Source: Table E2 from DOE/EIA (2002) NOTE: Sum of plants is larger than total number of sites because each type of primary mover at a site is
counted as a separate plant
Table E2. Inventory of electric utility power plants in Texas in 2000 using steam process as primary mover. Utilities are sorted by company. Key is below.
Energy source Primary mover type BIT Bituminous coal ST Steam turbine DFO Distillate fuel oil LIG Lignite NG Natural gas NUC Nuclear SUB Subbituminous coal
Comb Combined cycles. They include (from source nomenclature): CA=Combined Cycle Steam Part; CS=Combined Cycle Single Shaft (combustion turbine and steam turbine share a single generator); and CT=Combined Cycle Combustion Turbine Part (type of coal must be reported as energy source for integrated coal);
Company Plant (county) Energy source
Net summer capacity
(MW)
Primary mover type
Texas total 65,383 Steam primary mover subtotal 61,835 Austin Energy Decker Creek (Travis) NG 764 ST Austin Energy Holly Street (Travis) NG 569 ST Brazos Electric Power Coop Inc North Texas (Parker) NG 76 ST Brazos Electric Power Coop Inc R W Miller (Palo Pinto) NG 403 ST Brownsville Public Utils Board Si Ray (Cameron) NG 38 ST Bryan City of Bryan (Brazos) NG 109 ST Bryan City of Dansby (Brazos) NG 110 ST Central Power & Light Co Barney M Davis (Nueces) NG 697 ST Central Power & Light Co Coleto Creek (Goliad) BIT 632 ST Central Power & Light Co E S Joslin (Calhoun) NG 249 ST Central Power & Light Co J L Bates (Hidalgo) NG 182 ST Central Power & Light Co La Palma (Cameron) NG 206 ST Central Power & Light Co Laredo (Webb) NG 174 ST Central Power & Light Co Lon C Hill (Nueces) NG 545 ST Central Power & Light Co Nueces Bay (Nueces) NG 559 ST Central Power & Light Co Victoria (Victoria) NG 482 ST Denton City of Spencer (Denton) NG 179 ST

E-11
Company Plant (county) Energy source
Net summer capacity
(MW)
Primary mover type
El Paso Electric Co Newman (El Paso) NG 266 ST El Paso Electric Co 232 Comb Entergy Gulf States Inc Lewis Creek (Montgomery) NG 520 ST Entergy Gulf States Inc Neches (Jefferson) NG 265 ST Entergy Gulf States Inc Sabine (Orange) NG 1,824 ST Garland City of C E Newman (Dallas) NG 92 ST Garland City of Ray Olinger (Collin) NG 335 ST Greenville Electric Util Sys Powerlane Plant (Hunt) NG 89 ST Lower Colorado River Authority Fayette Power PRJ (Fayette) SUB 1,605 ST Lower Colorado River Authority Sim Gideon (Bastrop) NG 1,040 ST
Lubbock City of J Robert Massengale (Lubbock) NG 23 ST
Lubbock City of 84 Comb Lubbock City of Ty Cooke (Lubbock) NG 104 ST Medina Electric Coop Inc Pearsall (Frio) NG 75 ST Reliant Energy HL&P Cedar Bayou (Chambers) NG 2,260 ST Reliant Energy HL&P Deepwater (Harris) NG 178 ST Reliant Energy HL&P Greens Bayou (Harris) NG 406 ST Reliant Energy HL&P Limestone (Limestone) LIG 1,532 ST Reliant Energy HL&P P H Robinson (Galveston) NG 2,213 ST Reliant Energy HL&P Sam Bertron (Harris) NG 808 ST Reliant Energy HL&P South Texas (Matagorda) NUC 2,500 ST Reliant Energy HL&P T H Wharton (Harris) NG 229 ST Reliant Energy HL&P 664 Comb Reliant Energy HL&P W A Parish (Fort Bend) SUB/NG 3,641 ST Reliant Energy HL&P Webster (Harris) NG 374 ST San Antonio Public Service Bd A Von Rosenberg (Bexar) NG 482 Comb San Antonio Public Service Bd J K Spruce (Bexar) SUB 555 ST San Antonio Public Service Bd J T Deely (Bexar) SUB 830 ST San Antonio Public Service Bd Leon Creek (Bexar) NG 160 ST San Antonio Public Service Bd Mission Road (Bexar) NG 100 ST San Antonio Public Service Bd O W Sommers (Bexar) NG 880 ST San Antonio Public Service Bd V H Braunig (Bexar) NG 865 ST San Antonio Public Service Bd W B Tuttle (Bexar) NG 420 ST San Miguel Electric Coop Inc San Miguel (Atascosa) NG 391 ST South Texas Electric Coop Inc Sam Rayburn (Victoria) NG/DFO 25 ST Southwestern Electric Power Co Knox Lee (Gregg) NG 479 ST Southwestern Electric Power Co Lone Star (Morris) NG 50 ST Southwestern Electric Power Co Pirkey (Harrison) LIG 580 ST Southwestern Electric Power Co Welsh (Titus) LIG 1,584 ST Southwestern Electric Power Co Wilkes (Marion) NG 882 ST Southwestern Public Service Co Celanese (Gray) SUB 26 ST Southwestern Public Service Co Harrington (Potter) SUB 1,066 ST Southwestern Public Service Co Jones (Lubbock) NG 486 ST

E-12
Company Plant (county) Energy source
Net summer capacity
(MW)
Primary mover type
Southwestern Public Service Co Moore County (Moore) NG 48 ST Southwestern Public Service Co Nichols (Potter) NG 457 ST Southwestern Public Service Co Plant X (Lamb) NG 444 ST Southwestern Public Service Co Tolk (Lamb) SUB 1,080 ST Texas Municipal Power Agency Gibbons Creek (Grimes) SUB 420 ST Texas-New Mexico Power Co TNP ONE (Robertson) LIG 298 ST TXU Electric Co Big Brown (Freestone) LIG 1,150 ST TXU Electric Co Collin (Collin) NG 153 ST TXU Electric Co Comanche Peak (Somervell) NUC 2,300 ST TXU Electric Co DeCordova (Hood) NG 818 ST TXU Electric Co Eagle Mountain (Tarrant) NG 674 ST TXU Electric Co Graham (Young) NG 645 ST TXU Electric Co Handley (Tarrant) NG 1,441 ST TXU Electric Co Lake Creek (McLennan) NG 326 ST TXU Electric Co Lake Hubbard (Dallas) NG 921 ST TXU Electric Co Martin Lake (Rusk) LIG 2,250 ST TXU Electric Co Monticello (Titus) LIG 1,885 ST TXU Electric Co Morgan Creek (Mitchell) NG 844 ST TXU Electric Co Mountain Creek (Dallas) NG 902 ST TXU Electric Co North Lake (Dallas) NG 723 ST TXU Electric Co North Main (Tarrant) NG 80 ST TXU Electric Co Parkdale (Dallas) NG 330 ST TXU Electric Co Permian Basin (Ward) NG 731 ST TXU Electric Co River Crest (Red River) NG 110 ST TXU Electric Co Sandow (Milam) LIG 444 ST TXU Electric Co Stryker Creek (Cherokee) NG 693 ST TXU Electric Co Tradinghouse (McLennan) NG 1,393 ST TXU Electric Co Trinidad (Henderson) NG 244 ST TXU Electric Co Valley (Fannin) NG 1,134 ST West Texas Utilities Co Abilene (Taylor) NG 18 ST West Texas Utilities Co Fort Phantom (Jones) NG 362 ST West Texas Utilities Co Lake Pauline (Hardeman) NG 45 ST West Texas Utilities Co Oak Creek (Coke) NG 85 ST West Texas Utilities Co Oklaunion (Wilbarger) SUB 690 ST West Texas Utilities Co Paint Creek (Haskell) NG 238 ST West Texas Utilities Co Rio Pecos (Crockett) NG 98 ST West Texas Utilities Co 43 Comb West Texas Utilities Co San Angelo (Tom Green) NG 124 Comb
Source: DOE/EIA (2002) NOTE: This is not the full inventory of electric utility power plants in Texas. Only facilities using steam
process as primary mover included.

E-13
Table E3. Inventory of nonutility electric power plants in Texas in 2000 using steam process as primary mover. Utilities sorted by company. Key is below.
Energy source Primary mover type AB Agriculture byproducts ST Steam turbine BL Black liquor DFO Distillate fuel oil LIG Lignite NG Natural gas OG Other gases OTH Other PC Petroleum coke WDS Wood/wood waste solids
Comb Combined cycles. They include (from source nomenclature): CA=Combined cycle steam part; CS=Combined cycle single shaft (combustion turbine and steam turbine share a single generator); and CT=Combined cycle combustion turbine part (type of coal must be reported as energy source for integrated coal)
Company Plant Energy source
Net summer capacity
(MW) Energy
type Texas total 16,512 Steam primary mover subtotal 14,276 Abitibi Consolidated Sheldon Texas NG 76.1 ST AES Corp AES Deepwater Inc PC 171.1 ST Air Products & Chemicals Inc Port Arthur NG 34.9 Comb Alcoa Inc Sandow LIG 336.6 ST Alcoa World Alumina LLC Pt Comfort Operations NG 60.7 ST BASF Corp Freeport NG 79.8 Comb BP Amoco PLC Power Station 3 NG 99.1 Comb BP Amoco PLC Power Station 4 NG 164.4 Comb BP Chemicals-Green Lake BP Chemicals Green Lake Plant OG 36.1 ST CalEnergy Co Inc C R Wing Cogeneration Plant NG 197.9 Comb Calpine Corp Pasadena Cogeneration LP NG 654.4 Comb Calpine Corp-Texas City Texas City Cogeneration LP NG 387.1 Comb Carbide/Graphite Group Inc Seadrift Coke LP OG 7.1 ST Celanese Engineering Resin Inc Celanese Engineering Resin Inc NG 37.7 Comb
Clear Lake Cogeneration LP Clear Lake Cogeneration Ltd NG 324.4 Comb CoGen Funding LP CoGen Lyondell Inc NG 484.8 Comb Denver City Energy Assoc LP Mustang Station NG 448.1 Comb Donohue Inc Lufkin Texas NG 79.3 ST
Dow Chemical Co The Dow Chemical Co Texas Operations NG 1281.1 Comb
E I DuPont De Nemours & Co Sabine River Works NG 90.5 Comb Encogen One Partner Ltd Encogen One NG 228.8 Comb
Engineered Carbons Inc Engineered Carbons Borger Cogeneration OG 27.9 ST
Fina Oil & Chemical Co Big Spring Texas Refinery NG 1.4 ST Formosa Plastics Corp Formosa Utility Venture Ltd NG 528.8 Comb Frontier Generation LP Frontera Generation Facility NG 439.4 Comb Goodyear Tire & Rubber Co The Goodyear Tire Rubber Co NG 30 Comb Gregory Power Partners LP Gregory Power Facility NG 399 Comb

E-14
Company Plant Energy source
Net summer capacity
(MW) Energy
type Grupo Mexico ASARCO Inc El Paso TX NG 4.7 ST Guadalupe Power Partners LP Guadalupe Generating Station NG 982.4 Comb Hidalgo Energy Center LP Hidalgo Energy Center NG 430 Comb Imperial Sugar Co Fort Bend Utilities Co NG 5.8 ST Ingleside Cogeneration LP Ingleside Cogeneration NG/OTH 454.1 Comb
Inland Container Corp Inland Paperboard and Packaging BL 46.1 ST
International Paper Co Texarkana Mill WDS/BL 108.6 ST Lone Star Steel Co Lone Star Steel Co NG 31.8 ST Midlothian Energy LP Midlothian Energy Facility NG 994 Comb Minnesota Mining & Mfg Co Central Utility Plant DFO/NG 2 ST
Mirant Corp Mirant Texas LP Bosque County Plant NG 292.4 Comb
Mobil Oil Corp Beaumont Refinery NG 158.4 ST Morton International Inc Morton Salt Co Grand Saline NG 1.4 ST Motiva Enterprises LLC Port Arthur Refinery NG 24 ST Motiva Enterprises LLC 85.1 Comb Newgulf Power Venture Inc Newgulf NG 78.5 Comb
Norit Americas Inc Norit Americas Inc Marshall Plant LIG 1.8 ST
Owl Energy Resources Inc Houston Chemical Complex Battleground Site NG 171.9 Comb
Oxy Vinyls LP Deer Park Plant NG 94.9 Comb Oyster Creek Ltd Oyster Creek Unit VIII NG 428.4 Comb Panda Energy International Inc Lamar Power Project NG 938.2 Comb Premcor Refining Group Inc Port Arthur Refinery NG 72.3 Comb
Reynolds Metals Co Reynolds Metals Co Sherwin Plant NG 33.5 Comb
Rhone-Poulenc Inc Rhodia Inc Houston Plant OTH 6.2 ST
Rio Grande Sugar Growers Inc Rio Grande Valley Sugar Growers Inc AB 7.1 ST
Rock-Tenn Rock Tenn Dallas Mill NG 6 ST Sabine Cogen LP Sabine Cogen LP NG 87.3 Comb Shell Oil Co-Deer Park Shell Deer Park NG 101 ST Sid Richardson Carbon Ltd Borger Plant OG 34.9 ST Simpson Paper Co Pasadena Paper Company NG 13.4 ST Snider Industries Inc Snider Industries Inc WDS 4.7 ST Solutia Inc-Chocolate Chocolate Bayou Plant NG 51.5 ST
Southern Energy Wichita Falls Southern Energy Wichita Falls LP NG 68.8 Comb
Tenaska Frontier Partners Ltd Tenaska Frontier Generation Station DFO/NG 821.1 Comb
Tenaska III Inc Tenaska III Texas Partners NG 215 Comb
Tenaska IV Texas Partners Ltd Tenaska IV Texas Partners Ltd Cleburne Cogen NG 243.1 Comb
Texas Petrochemicals Corp Texas Petrochemicals Corp NG 33.6 ST

E-15
Company Plant Energy source
Net summer capacity
(MW) Energy
type
Union Carbide Corp-Seadrift Seadrift Plant Union Carbide Corp NG 144 Comb
Union Carbide Corp-Texas City
Texas City Plant Union Carbide Corp NG 82.6 Comb
University of Texas at Austin University of Texas at Austin NG 5.5 ST University of Texas at Austin 87.8 Comb Valero Refining Co Valero Refinery OG/NG 60.2 ST Westvaco Corp Westvaco Evadale BL 55 ST Source: DOE/EIA (2003) NOTE: This is not the full inventory of electric utility power plants in Texas. Only facilities using steam
process as primary mover included
Table E4. Facilities described in both IDA and DOE/EIA inventories
Type
C
Plan
t
Ener
gy s
ourc
e B
Net
sum
mer
ca
paci
ty (M
W) B
Prim
ary
mov
er
type
B
Cap
acity
(MG
D)A
Des
alin
atio
n pr
oces
s A
Feed
wat
er A
U Comanche Peak (Somervell) NUC 2,300 ST 0.432 RO River
U Martin Lake (Rusk) LIG 2,250 ST 1.585 VC/RO Waste U Monticello (Titus) LIG 1,885 ST 1.081 RO/VC Waste U Stryker Creek (Cherokee) NG 693 ST 0.36 RO Brack.
N The Dow Chemical Co Texas Operations NG 1,281 Comb 1.4 RO River
N Big Spring Texas Refinery NG 1.4 ST 0.864 RO Waste
N The Goodyear Tire Rubber Co NG 30 Comb 0.4 ME Waste
N Texarkana Mill WDS/BL 109 ST 1.67 VC Waste N Deer Park Plant NG 95 Comb 0.576 RO River N Shell Deer Park NG 101 ST 0.36 RO Brack. N Borger Plant OG 35 ST 0.202 RO River N Chocolate Bayou Plant NG 51 ST 1.584 RO River
N Texas City Plant Union Carbide Corp NG 83 Comb 2.16 MSF Brack.
Subtotal 4,639 7.074 Nonwaste Total 8,914 12.674 All types
Source: A=Wangnick (2002); B=DOE/EIA (2002 and 2003) NOTE: See Table D3, Table E2, and Table E3 for keys; C: U=utility, N=nonutility

E-16
Table E5. Texas refineries showing distillation capacity
Company Location Capacity (bbl/day)
Age Refining Inc San Antonio 9,112 Alon USA LP Big Spring 61,000 Atofina Petrochemicals Inc Port Arthur 175,068 BP Products North America Inc Texas City 437,000 Citgo Refining & Chemical Inc Corpus Christi 156,000 ConocoPhillips Borger 145,800 ConocoPhillips Sweeny 217,000 Crown Central Petroleum Corp Pasadena 100,000 Deer Park Refining LTD Ptnrshp Deer Park 333,700 ExxonMobil Refining & Supply Co Baytown 557,000 ExxonMobil Refining & Supply Co. Beaumont 348,500 Flint Hills Resources LP Corpus Christi 259,980 La Gloria Oil & Gas Co. Tyler 55,000 Lyondell Citgo Refining Co LTD Houston 270,200 Marathon Ashland Petro LLC Texas City 72,000 Motiva Enterprises LLC Port Arthur 250,000 Premcor Refining Group Inc Port Arthur 255,000 Valero Energy Corp Sunray 155,000 Valero Energy Corp Three Rivers 90,000 Valero Refining Co Texas Corpus Christi 134,000 Valero Refining Co Texas Houston 83,000 Valero Refining Co Texas Texas City 204,250 Western Refining Co LP El Paso 99,000 Source: Energy Information Administration http://tonto.eia.doe.gov/oog/info/state/tx.html

E-17
Table E6. Bottling companies monitored by Texas Department of State Health Services. List also includes ice packaging companies (about ¼ of all facilities)
Firm # of Fac. Firm
# of Fac.
3F Developers LLC 1 Accurate Water 1Advance Kar Wash 1 Agua Beverage Incorporated 1Agua Pura 2 Albertson's Packaged Ice Inc 136All About Water 1 All Day Food Store 1All-Pure Water Store 1 American Water Care Inc 1Annie's Country Store 2 AN's Water Inc 1Aqua Bella 1 Aqua Blue 1Aqua Clear 3 Aqua Express 1Aqua First 1 Aqua Fresh Water Store 1Aqua Purification Inc 1 Aquapure 4Aqua-Sure Water Store 1 Aqua-Tex 1AV Lopez Packaged Ice Inc 3 Avant Premium Water And Ice 33Avant Water Works 10 Best Water Store 1Beverlys 1 Big Spring Water & Ice 4Blue Sage Enterprises LLC 1 Brookshire's Packaged Ice Inc 14
BYOB Water Store 1 CAP-MOR Limited - Watermill Express 42
Castano's 1 Cedar Valley Grocery Inc 1Chas Super Market 1 Choice Wash Of Bellville Inc 1Choi's Water Inn 1 Classic Six Drive Thru 1Country Faucet LLC 1 Country Store 1Country Waterworks 1 Crystal Water 1Crystal's Convenience 1 Culligan Store Solution 133
Culligan Water Solutions 28 Dallas / Ft Worth Dr Pepper Bottling Co 1
Debbie's Best Water Store 1 Diamond G Store 1Diamond Water Tower 1 Don's Grocery & Deli Inc 1Drinking Water 1 DS Waters Of America LP 3Eco Smart Texas 1 Ecowater Systems 1El Centro Exxon 1 El Papalote Drinking Water 1El Paso Falls-Watermill Express 25 Entrepure Industries Inc 13Family Nutrition Center 1 Fast Water LLC 1Fiesta 46 Food City-Packaged Ice Inc 1Food N Go 1 Freer Water Factory 1Gardendale Grocery 1 Gerald Hall Enterprises 1
Glacier Water Services Inc 1787 Globe Supermarket-Packaged Ice Inc 1
Gourmet Donuts & Water Plaza 1 Green Jay Corp 1Gregory S Gayler 5 Guardian Storage & Carwash LLC 1Gw Services Inc 27 H20 Express 14Harmony Brook Inc 206 Harvest #21393-Packaged Ice Inc 1HEB-Packaged Ice Inc 160 Henrys Cash & Carry 1Honey's Drive In 1 Hunts-A-Plenty-Packaged Ice Inc 1

E-18
Firm # of Fac. Firm
# of Fac.
J & R's Convenience Store 1 Jimmy's Liquor 1John M Semple - U Bottle Water Service 16 Jovita's Convenience Store-
Packaged Ice Inc 1
Juniors Express 2 1 Karl's Water & Video 1Kims Water LLC 1 Kroger-Packaged Ice Inc 163Kwik Kar Wash 1 La Express Water Tower 2La Noria Water 1 La Pasada-Packaged Ice Inc 1Laughlin Shoppette 1 Lee Taylor - L & L Enterprises 6Leon Valley Water Co Llc - Leon Valley 4 Lone Star Pure Water 1
Martin's Water Jug 1 Maxor Express 1MCCM Ltd - Watermill Express 19 McPherson Produce 1Melin's Drive Inn 1 Mom & Pop 1Moreno's Kwik Stop 1 Move-N-Take Enterprises 1National Water Service Inc - Whole Foods Market 13 Natures Promise 1
Neighborhood Market - Culligan 2 New West Products Inc 1Nimbus Drinking Water Systems Ltd 4 Nullison C Store 1Oasis Auto Wash Inc 1 Oasis Carwash & Water 1O'Grady Drink Drinking Water 1 Olmos Mart 1Pacific Pure Water 1 Packaged Ice - Foys Supermarket 1Packaged ice - JE Merrit @ Exxon Refinery 1 Packaged Ice Inc - 107 Drive In 1
Packaged Ice Inc - Arlans #6 1 Packaged Ice Inc - Big 8 2Packaged Ice Inc - Diamond 4 Packaged Ice Inc - Entex 1 1Packaged Ice Inc - Exxon Bop 1 Packaged Ice Inc - Food City 2Packaged Ice Inc - Food King 7 1 Packaged Ice Inc - Gerlands 6Packaged Ice Inc - Gonzalez Mini Mart 1 Packaged Ice Inc - Handy Andy 5
Packaged Ice Inc - Harvest IGA 2 Packaged Ice Inc - Jerrys Grocery 5 1
Packaged Ice Inc - Juniors 5 4 Packaged Ice Inc - Kmart #3948 1Packaged Ice Inc - L & E Grocery 1 Packaged Ice Inc - La Fiesta 4
Packaged Ice Inc - Levels Food 1 Packaged Ice Inc - Lone Star Meats 1
Packaged Ice Inc - Lopez 8 Packaged Ice Inc - Lowes 9Packaged Ice Inc - M Rivas Food 1 Packaged Ice Inc - Malones 3
Packaged Ice Inc - McAllen Grocery 1 Packaged Ice Inc - Metro Food 2242 1
Packaged Ice Inc - Paleface Grocery 1 Packaged Ice Inc - Quick Stop 1Packaged Ice Inc - Rubens Grocery 1 Packaged Ice Inc - Save A Lot 7Packaged Ice Inc - Sterling Chemical 1 Packaged Ice Inc - Super Saver 8Packaged Ice Inc - Triple J 1 Packaged Ice Inc - Valley 66 #2 1Packaged Ice Inc - Veras King O Meats 1 Parks Convenience Center #2 1
Park's Water Inc 1 Paske Shell 1Perfect Water 3 Phoenix Drinking Water 1Pure H20 2 Pure Water 34
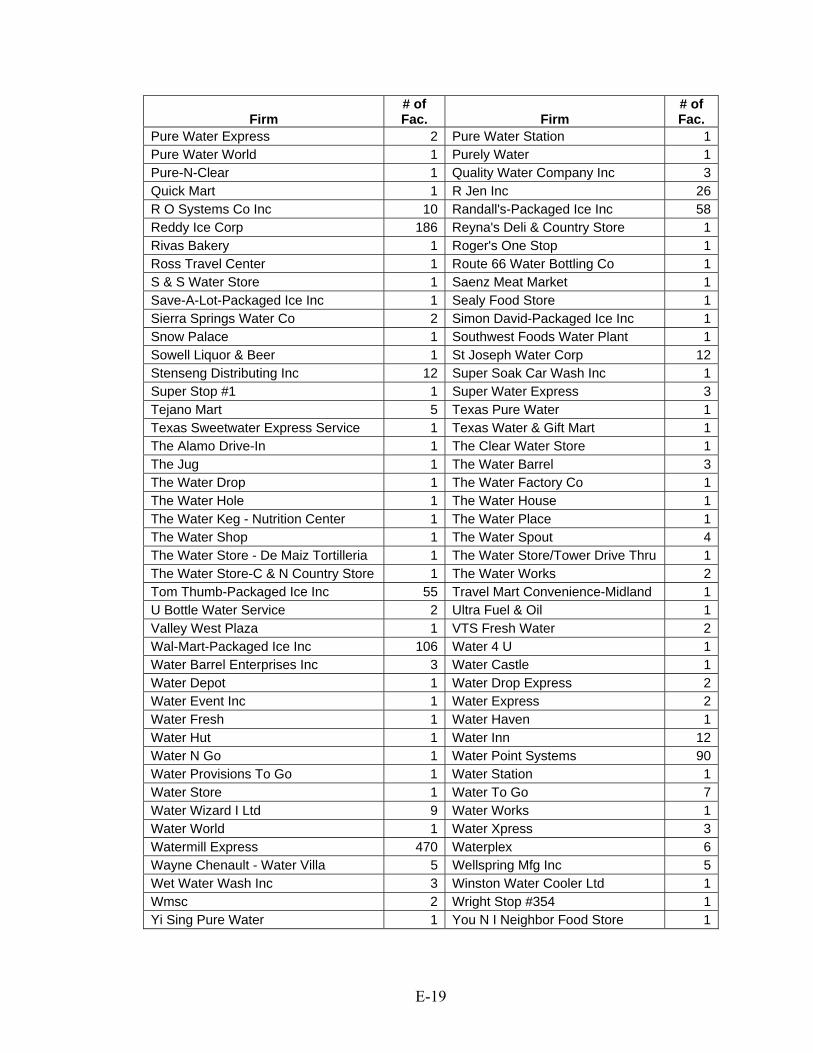
E-19
Firm # of Fac. Firm
# of Fac.
Pure Water Express 2 Pure Water Station 1Pure Water World 1 Purely Water 1Pure-N-Clear 1 Quality Water Company Inc 3Quick Mart 1 R Jen Inc 26R O Systems Co Inc 10 Randall's-Packaged Ice Inc 58Reddy Ice Corp 186 Reyna's Deli & Country Store 1Rivas Bakery 1 Roger's One Stop 1Ross Travel Center 1 Route 66 Water Bottling Co 1S & S Water Store 1 Saenz Meat Market 1Save-A-Lot-Packaged Ice Inc 1 Sealy Food Store 1Sierra Springs Water Co 2 Simon David-Packaged Ice Inc 1Snow Palace 1 Southwest Foods Water Plant 1Sowell Liquor & Beer 1 St Joseph Water Corp 12Stenseng Distributing Inc 12 Super Soak Car Wash Inc 1Super Stop #1 1 Super Water Express 3Tejano Mart 5 Texas Pure Water 1Texas Sweetwater Express Service 1 Texas Water & Gift Mart 1The Alamo Drive-In 1 The Clear Water Store 1The Jug 1 The Water Barrel 3The Water Drop 1 The Water Factory Co 1The Water Hole 1 The Water House 1The Water Keg - Nutrition Center 1 The Water Place 1The Water Shop 1 The Water Spout 4The Water Store - De Maiz Tortilleria 1 The Water Store/Tower Drive Thru 1The Water Store-C & N Country Store 1 The Water Works 2Tom Thumb-Packaged Ice Inc 55 Travel Mart Convenience-Midland 1U Bottle Water Service 2 Ultra Fuel & Oil 1Valley West Plaza 1 VTS Fresh Water 2Wal-Mart-Packaged Ice Inc 106 Water 4 U 1Water Barrel Enterprises Inc 3 Water Castle 1Water Depot 1 Water Drop Express 2Water Event Inc 1 Water Express 2Water Fresh 1 Water Haven 1Water Hut 1 Water Inn 12Water N Go 1 Water Point Systems 90Water Provisions To Go 1 Water Station 1Water Store 1 Water To Go 7Water Wizard I Ltd 9 Water Works 1Water World 1 Water Xpress 3Watermill Express 470 Waterplex 6Wayne Chenault - Water Villa 5 Wellspring Mfg Inc 5Wet Water Wash Inc 3 Winston Water Cooler Ltd 1Wmsc 2 Wright Stop #354 1Yi Sing Pure Water 1 You N I Neighbor Food Store 1

E-20
Table E7. Soft drink companies monitored by Texas Department of State Health Services
Firm # of Fac. Firm
# of Fac.
Ab-Tex Beverage Ltd 1 Aloe Commodities International Inc 1Aloe'ha Beverage Corporation 1 America's Beverage Company 1Austin Coca Cola Bottling Co 2 Better Beverages Ltd 1Big Bend Coca-Cola Bottling Co 1 Borden 1Bordens Dairy 1 Chosen Frozen Inc 1Coca Cola Bottling Co Of North Texas 1 Coca-Cola Bottling Co 1
Coca-Cola Enterprises Inc 1Coca-Cola Enterprises Inc-Southwest 1
Dr Pepper Bottlers Brownwood Inc 1 Dr Pepper Bottling Co of Dublin 1Dr Pepper Bottling Co Of Houston 1 Dr Pepper Bottling Co Of Texas Inc 1
Gandy's Dairies Inc 1HEB Grocery Co/Milk & Beverage Plant 1
Lilly Dairy Products Inc 1 Lone Star Beverage Company LLC 1Lufkin Coca-Cola Bottling Co 1 Magnolia Coca Cola Bottling Co 1Mariano's Specialty Products 1 Merrytime Products Co Inc 1
Pepsi Bottling Group 1Pepsi Cola Bottling Co Of Corpus Christi 1
Shasta Beverages Inc 1 Southwest Canners Inc 1Stokely Van Camp Manufacturing Inc 1 Temple Bottling Company Ltd 1The Pepsi Bottling Group 1 The Victoria Beverage Co Inc 1Truco Enterprises Inc 1 Valley Coca Cola Bottling Company 1
Table E8. Breweries monitored by Texas Department of State Health Services
Firm # of Fac. Firm
# of Fac.
Alamosa Wine Cellars 1 Anheuser-Busch Inc 1Becker Vineyards 1 Bell Mountain Vineyards Inc 1Comfort Cellars Winery 1 Delaney Vineyards Inc 2Dry Comal Creek Vineyards Inc 1 Fall Creek Vineyards 1Fifth Generation Inc 1 Glazer's Wholesale Drug Co Inc 1Grape Creek Vineyard Inc 1 Holloman Distributing Co 1Homebrew Headquarters Inc 1 Homestead Vineyards & Winery Inc 1Houston Distributing Co 2 La Buena Vida Vineyards 1Llano Estacado Winery Inc 1 Lone Star Beer Distributing Co 1Messina Hof Wine Cellars Inc 1 Miller Brewing Company 1Oley Distributing Co 1 Permian Distributing Inc 1Pheasant Ridge Winery 1 Piney Woods Country Wines 1Real Ale Brewing Co 1 Republic Beverage Co 1Saint Arnold Brewing Co 1 Sister Creek Vineyards 1Ste Genevieve Wines 1 Su Vino Winery 1Tower Beverage Of Nacogdoches 1 Val Verde Winery 1Wimberley Valley Winery 1

E-21
Table E9. Drug manufacturing companies monitored by Texas Department of State Health Services
Firm # of Fac. Firm
# of Fac.
21st Century Homeopathics Inc 1 A - Med Medical Inc 1 A M Home Medical 1 A-Plus Medical Equipment 1 AAA Medical & Oxygen Supply 1 AAA Medical Oxygen Supply 1 AGS Labs Inc 1 Abassi Wholesale & Distributing Co 1 Able Medical Products Inc 1 Acetylene Oxygen Co 2 Acetylene Oxygen Company 4 Activ Medical 1 Active Organics Inc 1 Adams Respiratory Therapeutics 1 Advanced Home Health Services 1 Advocare International LP 1 Aeriform Corporation 5 Air Liquide America LP 7 Air Products & Chemicals Inc 3 Air Sense Inc 1 Air Supply of North Texas 1 Airgas Gulf States 1 Airgas Mid South Inc 1 Airgas Puritan Medical 1 Airgas-Southwest Inc 24 Alamo Respiratory Services Inc 1 Alcon Manufacturing Ltd 1 Alk Abello Inc 1 Allergan Sales LLC 2 Alliance Medical Supply Inc 1 Alliance Pharmaceutical Inc 1 Allied Medical 1 Aloe Commodities International Inc 1 Aloe Dynamics Inc 1 Aloe Laboratories Inc 1 Aloe Vera Of America Inc 1 Alrick Enterprises LLC 1 Alt-Med Labs Inc 1 AmPharmCo Inc 1 Amarillo Medical Oxygen 1 American Animal Health Inc 1 American Homepatient 4 American Medical Equipment 1 Ameripac Inc 1 ApotheCure Inc 1 Apria Healthcare Inc 14 Argyle Welding Supply Co Inc 1 Aslung Pharmaceutical LP 2 Atlantis Laboratories Inc 1 Avail Medical Products Inc 1 B & J Welding Supply Ltd 1 BASF Corp 1 BOC Gases 1 Bailey Oxygen & Tool Co Inc 1 Ballay Pharmaceuticals Inc 1 Banyan International Corporation 1 Barker Healthcare Products Inc 1 Bayer Environmental Science 1 Beauticontrol Inc 1 Bio-Derm Laboratories Inc 1 Bio-Medical & Pharmaceutical Mfg Corp 1 Biotics Research Corporation 1
Body Chemistry Manufacturing Inc 1 Bolyard's Respiratory Svcs& Homecare Equipment 1
Bowie Home Medical Equipment 1 Brazos Valley Welding Supply Inc 1 Brenntag Southwest Inc 2 Britkare Home Medical Ltd 1 CPS Medical Inc 1 CRC-Cardio Respiratory Care Inc 1 Capellon Pharmaceuticals Ltd 1 Cardinal Health 2 Cardinal Health Medical Products & Services 1 Carrington Laboratories Inc 1
Carroll Company 1 Carter Bloodcare 1 Central Admixture Pharmacy Services Inc 2 Champs Medical 1

E-22
Firm # of Fac. Firm
# of Fac.
Champs Medical Ltd 1 Chemolee Lab Corp 1 Chest Diagnostic Therapeutic Services Inc 1 City Of Houston Fire Department 1
Clavel Corporation 1 Coastal Bend Rural Medical Equipment Inc 1
Coastal Welding Supply Inc 1 Coats Aloe International Inc 1
Colgate Oral Pharmaceuticals Inc 2 Community Action Inc Hays Caldwell & Blanco Cos 1
Community Council Of South Central Texas Inc 1 Community Medical Equipment 1
Conroe Welding Supply Inc 1 Consumers' Choice Products Inc / Sasco 1
Corsicana Welding Supply Inc 1 Creative Beauty Innovations Inc 1 Creative Fragrances Ltd 1 Custom Nutrition Laboratories Inc 1 Cut Heal Animal Care Products Inc 1 Cyclotope 1
DPT Laboratories Ltd 2 De La Rosa Pharmacy & Medical Equipment 1
Del Rio Welders Equipment Inc 1 Deltex Pharmaceuticals Inc 1 Denison Oxygen Supply 1 DuPuy Oxygen & Supply Co Inc 1 ETOX Inc 2 Eagle Home Medical Corp 1 Economy Medical Rental Inc 1 Elge Inc 1 FMC Corp 1 Falls Welding Supply Inc 1 Family Medical Equipment and Supply 1 Faspac Packaging LP 1
Ferguson Enterprises 1 Fire Protection Service Inc 1 First Fitness International Inc 1 Fisher County Dura-Med Equip 1 Fitch Industrial Welding Supply Inc 1 FluoroMed LP 1
Freedom 2 Go LLC 3 Fruit Of The Earth Research Laboratories Inc 1
GDMI Inc 1 GM Pharmaceuticals Inc 1 Garland Welding Supply Co Inc 1 Gentiva Health Services 1 Gold Cross Medical Supplies Inc 1 Goodier Cosmetics Inc 1 Goodlite Products Inc 1 Great Southern Laboratories 1 Hampshire Chemical Corporation 1 Hanna Isul Skin Therapy Inc 1 Health Care Labs Inc 1 Healthline Medical 1 Heartland Medical Supply Inc 1 Hill Country Medical Equipment 1 Home Care Supply 1 HomeCare Medical Equipment Inc 1 Homecare Dimensions Inc 1 Hometown Medical Equipment Inc 1 Horizon Industries 1 Horsemans Dream Inc 1 Hospice Of El Paso Inc 1 Hospira Inc 1 Houston Welding Supply Co Inc 1 Huish Detergents Inc 1 Humco Holding Group Inc 1 IV Flush LLC 1 Identipak Inc 1 Immudyne Inc 1 Inmon Respiratory Services Inc 1 Integra Spinal Specialties 1 Iso-Tex Diagnostics Inc 1 Ivedco LLC 1 JD Medical Supplies Inc 1 JP's Specialty Welding & Supply LLC 1 Jungle Laboratories Corporation 1 Kimberly-Clark Corp 1

E-23
Firm # of Fac. Firm
# of Fac.
L & L Home Care Services Inc 1 L & M Pharmaceuticals 1 LSI 1 Lakeland Respiratory & Medical 1 Land O'Lakes Purina Feed LLC 1 Larrison Medical Inc 1 Leddy Medical Services Inc 1 Lee Medical Supply Co 2 Lees Pharmacy & Medical Equipment Co 1 Life Support Systems Inc 1
Lifegas LLC 5 Lily Of The Desert 1 Lincare Inc 19 Longview Home Medical Equipment 1 Lubbock Oxygen & Medical Gases Inc 1 Lubbock Welding Supply Inc 1
Lyondell Chemical Company 1 MDM Home Medical Equipment LLC 1 MG Industries 1 MSC Development Inc 1 Major Medical Supply 1 Major Medical Supply Inc 1 Mary Kay Inc 1 Matheson Tri-Gas #810 17
McGinnis Welding Supply Co 1 McNeil Consumer & Specialty Pharmaceuticals 1
McDonald Welding Supply Inc 1 Med Care Medical Supply of North Tx Inc 1
Med-Air 1 Medi-Flex Inc 1 Medical Rentals & Sales 1 Mediceutical Laboratories Ltd 1 Merrick Medicine Co Inc 1 Messer GT & S LP 1 MetroPak Systems Inc 1 Midland Memorial Hospital 1 Mission Pharmacal Co 1 Monahans Pharmacy Inc 1 Morton Salt 1 Mylan Bertek Pharmaceuticals Inc 1 N B Wholesale 1 NCH Corp 1 NPTA - National Pharmacy Technician Association In 1 Naterra International Inc 1
National Alloy & Industrial Gases Inc 1 Natures Formula Partners LLP 1 New World Health Inc 1 North Texas CardioPulmonary Inc 1 Novum Solutions Inc 1 OMNII Oral Pharmaceuticals 1 Oiltanking Texas City LP 1 Onecare Respiratory 1 Oxy Healthcare Services Inc 1 Oxycare Plus Inc 1 Oxygen Resources Inc 1 PETNET Pharmaceuticals Inc 3 PHHS Medical Repackaging 1 PPG Industries Inc 1 PRN Medical Services Inc 1 Patient Care Systems Inc 1 Penreco 1 Perrone Pharmacy Inc 1 Petra Chemical Company 1 Pharma Fab 1 Plaza Home Care Inc 1 Praxair Inc 7 Preferred Medical Services Inc 1 Premier Products 1
Prescription Air 2 Primary Care Division/City of Austin HHS/Travis Co 1
Pro Medical 1 Professional Compounding Centers Of America 1
Professional Medical 1 Professional Welding Supply Inc 1 Proportional Technologies Inc 1 Protec Laboratory 1 Puritan Medical Products 2 Quest Chemical Corporation 1 Quest Separation Technologies Inc 1 R & A Labs Aloe Pro International 1

E-24
Firm # of Fac. Firm
# of Fac.
RCS Management Corporation 1 Refunds Etc 1 Regional Nuclear Pharmaceuticals of Dallas LLC 1 Reheis Inc A General Chemical Co 1
Reliant Processing Group LLC 1 Respicare 1 Respiratory & Medical Home Care Unlimited Inc 1 Revision Inc 1
Rhema Medical 6 Rite Weld Supply Inc 1 Rolling Plains Medical Supply 1 Royalty Welding Supply Inc 1 SSB Group Contract Filling LLC 1 Safe Solutions Inc 1
San Angelo Home Medical 1 San Antonio Extended Medical Care Inc 1
Sanh Hon Duong 1 Sarah Aloe Essence Cosmetics 1 Scott Medical Supply 1 Shell Chemical Company 1 Skinceuticals Enterprises 1 Skinceuticals Inc 1 South Plains Health Provider Organization Inc 1 South Texas Blood & Tissue Center 1
Southern Medical Inc 1 Southwest Research Institute 1
Sovereign Pharmaceuticals Ltd 1 Special Care Home Medical & Pharmacy 1
Spectra Pharm Inc 1 Stamford Medical Supply 1 Stanislaw R Burzynski MD PhD 1 Stat Medical 1 Summa RX Laboratories Inc 1 Sun City Medical Supply 1 Sun Country Medical Equipment Inc 1 Sure-Life Laboratories Corp 1 Swiss American Products Inc 1 TIGI Linea LP 1 Taylor Home Health 3 Taylor Medical Supply 1 Temple Welding Supply Co Inc 1 Tennis Elbow Corp 1 Texas Correctional Industries 2 Texas DME Inc 1 Texas Medical Inc 1 Texas Vet Lab Inc 1 Texoma Medical Center Inc 1 Texstar Medical Equipment 1
The Colgin Companies 1 The Corpus Christi Medical Center-Doctors Regional 1
The Dallas Group Of America Inc 1 The Dow Chemical Co 1 The Home Health Store of Tomball Inc 1 Third Coast Terminals 1
Trace Radiochemicals Inc 2 Tri-Vedco 1 Trinity Chemical Corp 1 Trinity Coatings Co Inc 1
USA Packaging A Div Of NCH Corp 1 UTHSCSA Research Ctr PET Pharmacy Services 1
Ultra Pure Solutions Inc 1 Union Carbide Corp 1 United Welding Specialties 1 Univar USA Inc 2 VacciCel Inc 1 Virbac AH Inc 1 Walgreens Home Care Inc 2 Walson Inc 1 Welder's Supply Co 1 Wellcare Respiratory & HME Inc 1 Westair Gas & Equipment LP Co 2 Wheelchair & Walker Rentals Inc 1 Wichita Medical Supply Company 1

E-25
Table E10. Microelectronics facilities in Texas from IDA inventory
Location County name
Total capacity [MGD] Process Customer
Water quality
Dallas Dallas/Collin/Denton 1.876 RO TEXAS INSTRUMENTS BRACK Austin Travis/Williamson 0.756 RO IBM BRACK Dallas Dallas/Collin/Denton 0.720 RO TEXAS INSTRUMENTS BRACK Stafford Fort Bend/Harris 0.546 RO TEXAS INSTRUMENT BRACK Dallas Dallas/Collin/Denton 0.527 RO MOSTEK BRACK TX 0.518 ED Semiconductor PURE Sherman Grayson 0.317 RO TEXAS INSTRUMENT RIVER Dallas Dallas/Collin/Denton 0.305 RO MOSTEK BRACK Dallas Dallas/Collin/Denton 0.288 RO TEXAS INSTRUMENTS BRACK Carrollton Delton/Dallas/Collin 0.216 RO MOSTEK BRACK Austin Travis/Williamson 0.202 RO MOTOROLA BRACK Austin Travis/Williamson 0.200 RO MOTOROLA BRACK Total 6.471
Source: Wangnick, 2002
Table E11. Selected semiconductor and electronics manufacturing companies in Texas
3M Advanced Micro Devices AMX Apple Computer Applied Materials Applied Micro Circuits Atrion Cirrus Logic Compaq Computer Cypress Semiconductor Dell Computer Emerson Process Managemt Freescale IBM Intel Minco Technology Labs Mostek Motorola National Semiconductor Optek Technology Samsung Semiconductor SigmaTel Silicon Laboratories Solectron Texas STMicroelectronics Texas Instruments Tokyo Electron Source: Wangnick (2002); search on Kompass.com for “semiconductor”; http:\\www.austinchamber.org


Attachment F: List of files on CD


F-1
MAIN DIRECTORY DesalPlantSql2kBackup Database in SQL format (38 facilities ≥0.025 MGD) File List.doc This attachment Final_Report.doc Final_Report.pdf Electronic version of this report. TWDB-BEG Water Survey06-13-05_GT0.025MGD.mdb Database in Microsoft Access format (38 facilities ≥0.025 MGD) TWDB-BEG Water Survey06-13-05__GT0.025MGD.xls Database in Microsoft Excelformat (38 facilities ≥0.025 MGD) Folder “APPENDIX B” Survey form Mun3.doc Electronic version of survey form Folder “APPENDIX C” AWWARF-Membrane Knowledge Base Project 2763 SCOPE.pdf Description of AWWARF project 2763 about the development of a database on low-pressure membrane facilities CA Coastal Act 14a-3-2004-desalination.pdf Copy of the Seawater Desalination and the California Coastal Act DRIP Program.pdf Information about the DRIP program in California FDEP Listing of RO and NF WTPs.doc Membrane treatment plants in Florida Folder “APPENDIX D” Desalting Plants Inventory_JP0.xls Wangnick (2002) dataset DESAL TCEQ.DBF: Original file obtained from the TCEQ. It contains 121 facilities, but some are duplicates. DESAL TCEQ.xls TCEQ-listed facilities with no duplicates. A total of 99 facilities are listed and sorted by total production.
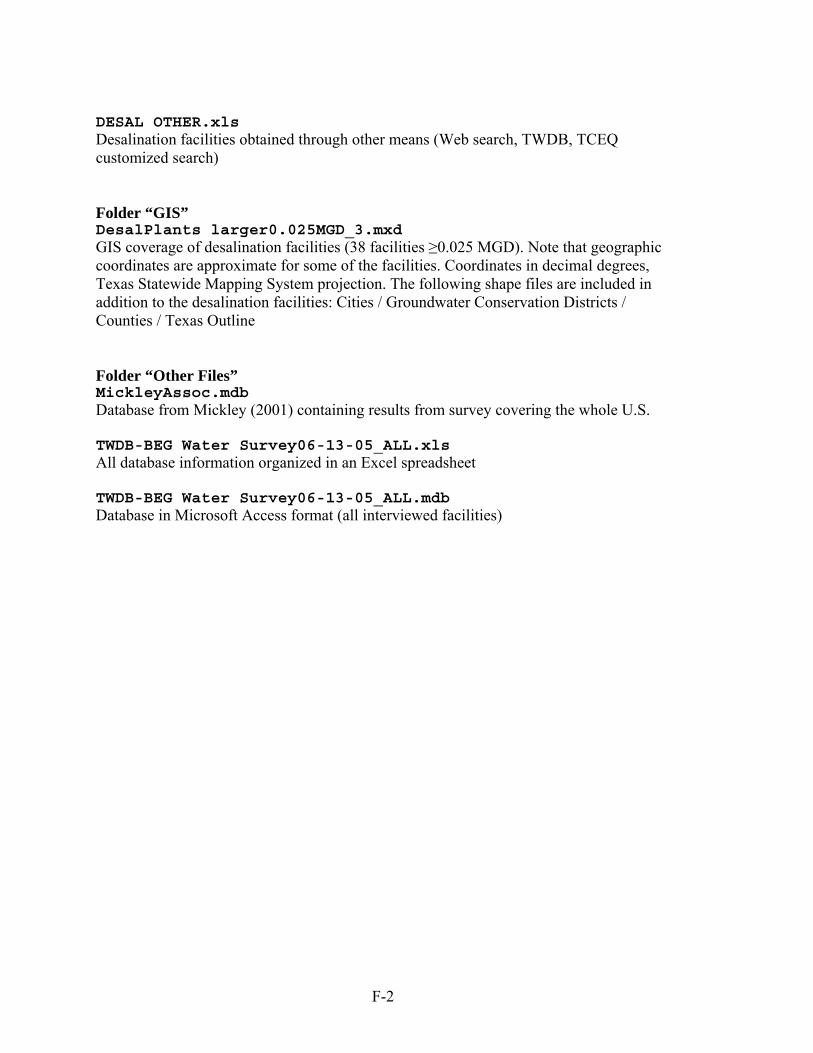
F-2
DESAL OTHER.xls Desalination facilities obtained through other means (Web search, TWDB, TCEQ customized search) Folder “GIS” DesalPlants larger0.025MGD_3.mxd GIS coverage of desalination facilities (38 facilities ≥0.025 MGD). Note that geographic coordinates are approximate for some of the facilities. Coordinates in decimal degrees, Texas Statewide Mapping System projection. The following shape files are included in addition to the desalination facilities: Cities / Groundwater Conservation Districts / Counties / Texas Outline Folder “Other Files” MickleyAssoc.mdb Database from Mickley (2001) containing results from survey covering the whole U.S. TWDB-BEG Water Survey06-13-05_ALL.xls All database information organized in an Excel spreadsheet TWDB-BEG Water Survey06-13-05_ALL.mdb Database in Microsoft Access format (all interviewed facilities)

Attachment G: Useful Website Addresses


G-1
Boyle Engineering: http://www.boyleengineering.com/index_ie.htm Business Communications Company: http://www.buscom.com/membrane/C201R.html California Coastal Commission: http://www.coastal.ca.gov California Department of Water Resources: http://www.owue.water.ca.gov/recycle/desal/desal.cfm California Energy Commission: http://www.energy.ca.gov/ Department of Energy/Energy Information Agency: http://www.eia.doe.gov/index.html Desalination Research and Innovation Partnership (DRIP): http://www.mmenvirosoft.com/drip_website Florida Department of Environmental Protection: http://www.dep.state.fl.us/water/drinkingwater/index.htm Global Water Intelligence: http://www.globalwaterintel.com/ International Desalination Association (IDA): http://www.idadesal.org IWUD: http://www.tceq.state.tx.us/permitting/water_supply/ud/iwud.html The McGraw-Hill Companies: http://www.mcgraw-hill.com/markets/info_media.html McIlvaine Company: http://www.mcilvainecompany.com Montgomery-Watson Harza (MWH): http://www.mw.com Public Utility Commission of Texas: http://www.puc.state.tx.us/electric/directories/index.cfm San Diego Water Authority: http://www.sdcwa.org/ TWDB project loan list: http://www.twdb.state.tx.us/data/projectstatus/projectstatus_toc.asp Wangnick GMBH: http://www.wangnick.com/home.htm Water Desalination Report: http://www.waterdesalreport.com Watereuse Foundation: http://www.watereuse.org/


Attachment H: Answers to Review Comments


H-1
TEXAS WATER DEVELOPMENT BOARD
Review Comments on the Draft Report “Development of a Database for Desalination Facilities in Texas”
Contract # 2004-483-021
1. On the cover, show only the Texas map, and remove the inserted graphs/tables, etc. (make the cover more presentable on glossy paper). Extraneous graphs have been deleted.
2. The ‘Table of Contents’ page and the pages following it need to be improved for
format. Denote attachments as A-xx rather than as IV.1.2.3… etc. (Simplify numbering). Attachments are now indicated by letters (A through H).
3. On page 1 (Executive Summary) the first figure is shown as Fig. 4.1. This
numbering is incorrect – refer to the figure as ES-1. Numbering has been corrected.
4. All figures in reports submitted to us need to be in color.
Report will be delivered in color. 5. Each figure needs to have a legend.
Legends have been added to all figures when missing. 6. Insert tables and figures where they are referred to in the text (NOT at the end of
the chapter) Tables and figures have been inserted in the text except in appendices where multiple long tables would interrupt the natural reading flow.
7. Page 4 – The statement that ‘MSF and MED are more suited to seawater
desalination’ seems inappropriate (and should be deleted), since the current trend is overwhelmingly toward the use of RO for seawater desalination. Statement has been rephrased. The purpose of the initial statement was to emphasize that most (if not all) MSF and MED facilities are seawater desalination facilities, not that all seawater desalination facilities are MSF and MED.
8. Page 4 – Explain the difference between ED and EDR.
Explanation added. 9. Page 5 – Please state if it has been verified from TCEQ that there is not a single
case of deep well injection being used in Texas for concentrate disposal. The statement has been deleted. Although this survey of PWS facilities suggests that there is none, it is possible that industrial facilities do use deep-well injection

H-2
as a mean to dispose of the concentrate. Applications for deep-well injection of concentrate may also have been submitted but not followed-through.
10. Page 7 – Does TCEQ list have 70 or 99 entries? – Unclear (2nd paragraph).
TCEQ list has 99 entries but only 70 with a water production ≥0.025 MGD. Sentence rephrased. Sentence is now part of Attachment D.
11. Page 9 – It is confusing from the text on lines 3 & 4, whether the 19 facilities are
above or below 0.025 MGD – Please write clearly. Confusion arises from the fact that blending can occur. Total design capacity (with blending) can be ≥0.025 MGD and desalination design capacity can be <0.025 MGD. Sentence rephrased. Sentence is now part of Attachment D.
12. Section 4 - The results section discusses too many different data sets that it is
confusing to the reader. Please present only one correct data set (yours) in the results section with all others in appendices if necessary. All the data not directly relevant to the final result section have been moved to a new attachment (Attachment D).
13. The terminology in table 4.2 is confusing – Please refer to desalination capacities
as design capacity and total capacity (including blending). The design capacity column should precede total capacity column. PWS # is not needed, but include the county name. County name is now provided in addition to PWS#. “Total design capacity” is now called “Total capacity (including blending)” and “Desalination design capacity” is now called “Design capacity.” Similarly, “Average production” is now called “Average production (including blending)” and “Average desalination production” is now called “Average production.”
14. A single table is needed in Section 4 that shows the 38(?) PWS desalination
facilities in a nutshell (need a reproducible table for presentations). The table should have facility name, county, desalination capacity, source water (groundwater, river, etc), desalination process (RO/ED etc). In the color map showing the 38 locations, please label (identify) the ten largest facilities in Texas. A summary table has been added (Table4-1 of final report).
15. Please send one final report (in color) for preliminary approval by October 20,
2005 before submitting all copies of the final report. Preliminary report have been delivered on as requested
The TWDB also provided marked-up copies with comments and notes. Non trivial comments are reproduced below with a description of their resolution. C1: Simplify the main body of the report Only results have been kept in the main body of the report. All other materials have been moved, mainly to (new) Attachment D.

H-3
C2. Report needs to include a description of the contracted tasks and how they were addressed. A description of the tasks has been added.
>=============================<
TCEQ Comments Database for desalination by J.P. Nicot, Steven Walden, and others
1. Page 5. The statement that deep-well injection is not practiced in Texas is incorrect. Several permits have been issued. The statement meant that no desalination concentrate is being injected in deep-well injection. The statement has been deleted. See answer to comment 5 of TWDB.
2. General comment - writing style is confusing, needs improvement.
Structure of the report has been modified. 3. Page 8 section 3.2 – the word ‘database’ needs to be added after SQL server
Word added. 4. Every figure should include a legend.
Legends have been added to all figures when missing. 5. Page 42 – 47 The notes (footnotes) are not capitalized. They refer to coordinates
in decimal degrees, but no coordinates are shown. Delete the second sentence about decimal degrees if it is not applicable. Sentence about decimal degrees in footnotes deleted. Actual projection used to developed the maps from coordinates in decimal degrees has been added (Texas Statewide Mapping System).
6. Page 49 – The figure is a comparison and shows ‘Mickley’s data’ for the x-axis.
What is the y-axis? Figures need more attention and labeling. The y-axis represents results from this survey. Caption to the figure has been updated. Figure is now in Attachment D.


Attachment I: List of Changes in Revision 1


I-1
Since the publication of the initial version of this report in October 2005, a few
minor errors have been found. It should be noted that no additional survey or update to
the initial survey has been performed in this Revision 1, only corrections to the initial
report:
Column “County” in Table 4-2 has been modified. The table in the initial report
had the county names shifted in a haphazard fashion. County names have been paired
with the correct facilities.
Map of Figure 4-11 has been corrected. It initially showed all facilities with no
TDS data as having a TDS<500ppm. A new “unknown” category has been added.