a deperturbation method to aid in the interpretation of infrared isotopic spectra g. garcia and c....
TRANSCRIPT

A Deperturbation Method to A Deperturbation Method to Aid in the Interpretation of Aid in the Interpretation of Infrared Isotopic SpectraInfrared Isotopic Spectra
G. Garcia and C. M. L. RittbyG. Garcia and C. M. L. RittbyTexas Christian UniversityTexas Christian University
Fort Worth, TX 76129Fort Worth, TX 76129
June 20, 2007June 20, 2007

2
IntroductionIntroduction
• Identification of new molecular species based Identification of new molecular species based on the comparison between observed and on the comparison between observed and predicted vibrational fundamentals and isotopic predicted vibrational fundamentals and isotopic shifts.shifts.
• Linear carbon chains represent one group of Linear carbon chains represent one group of molecules under study.molecules under study.

3
Isotopic SubstitutionIsotopic Substitution
• Experimentally, a Experimentally, a 1313C atom is systematically C atom is systematically substituted in place of a substituted in place of a 1212C atom in a C atom in a molecule.molecule.
12 12 12
13 12 12
12 13 12

4
Illustration of the comparison between observed Illustration of the comparison between observed and predicted isotopic spectra of the and predicted isotopic spectra of the νν33((σσuu)) mode of mode of
linear Clinear C5 5
c2
c1
c3
2130 2140 2150 2160
Frequency (cm-1)
Ab
sorb
ance
90% 12C / 10% 13C
12C12,v7
c1 c2 c3 c4 c5
Experiment
TheoryR. Cárdenasexperimental spectrum

5
90% 12C / 10% 13C
Frequency (cm-1)
C10,v6 ?A
bso
rban
ce
?
2045 2055 2065 2075
C8,v6
?
?
?
Illustration of the comparison between observed Illustration of the comparison between observed and predicted isotopic spectra of the and predicted isotopic spectra of the νν55((σσuu)) mode of mode of
linear Clinear C99C9,v5
R. Cárdenasexperimental spectrum

6
• The method of isotopic substitution introduces The method of isotopic substitution introduces interactions between vibrational modes.interactions between vibrational modes.
• Strength of the interactions increases as the Strength of the interactions increases as the separation between vibrational fundamentals separation between vibrational fundamentals decreases.decreases.

7
• Long carbon chains have Long carbon chains have a larger number of a larger number of stretching modes with stretching modes with near-lying fundamental near-lying fundamental frequencies.frequencies.
• Therefore, their vibrational Therefore, their vibrational modes experience modes experience stronger interactions stronger interactions upon isotopic substitution.upon isotopic substitution.
Carbon ChainsCarbon Chains

8
Frequency (cm-1)
Ab
sorb
ance
12C12,v7
2130 2140 2150 2160
90% 12C / 10% 13C
c2
c1
c3
10% 12C / 90% 13C
2080 2090 2100 2110 2120
c2
c1
c3
c1 c2 c3 c4 c5
Illustration of the complementary isotopic spectra of Illustration of the complementary isotopic spectra of the the νν33((σσuu)) mode of linear C mode of linear C55
90/10 spectrum10/90 spectrum

9
Deperturbation ModelDeperturbation Model
• Two-level systemTwo-level system• Energies described to 2Energies described to 2ndnd order in order in
perturbation theoryperturbation theory• System can be subjected to a positive or a System can be subjected to a positive or a
negative perturbation:negative perturbation:
12
21
D
D
W WW
W W
12
21
D
D
W WW
W W
Positiveperturbation
Negativeperturbation

10
W
unperturbedenergies
energiesto 1st order
energiesto 2nd order
2
12(0)1 (0) (0)
1 2D
WE W
E E
2
12(0)2 (0) (0)
1 2D
WE W
E E
(0)
2E
(0)1E
(0)1 DE W
(0)2 DE W
2
12(0)1 (0) (0)
1 2D
WE W
E E
2
12(0)2 (0) (0)
1 2D
WE W
E E
(0)
2E
(0)1E
(0)1 DE W
(0)2 DE W
W

11
13-13-13-13-13
Frequency
Application of deperturbation method to Application of deperturbation method to isotopic shifts of carbon clustersisotopic shifts of carbon clusters
12-13-13-13-13 13-12-12-12-12
12-12-12-12-12
10/90 Spectrum 90/10 Spectrum
10 / 90 90 /1013.00335
12.00000W W
10/90W 90/10W
1.0409
12
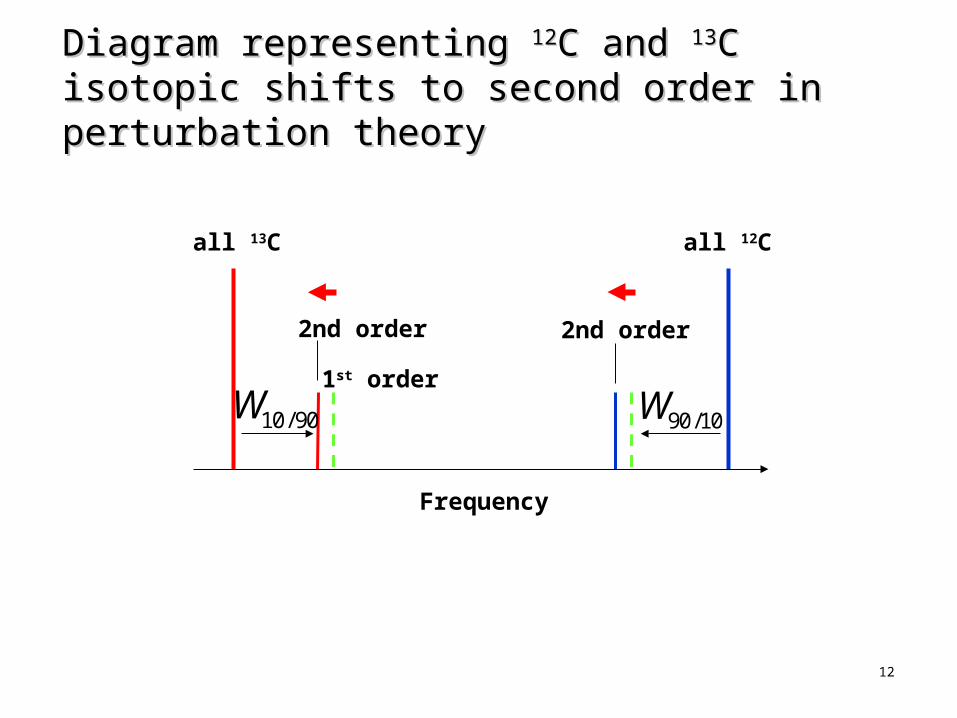
Diagram representing Diagram representing 1212C and C and 1313C isotopic shifts C isotopic shifts to second order in perturbation theoryto second order in perturbation theory
all 12Call 13C
90/10W10/90W1st order
2nd order
Frequency
2nd order
13
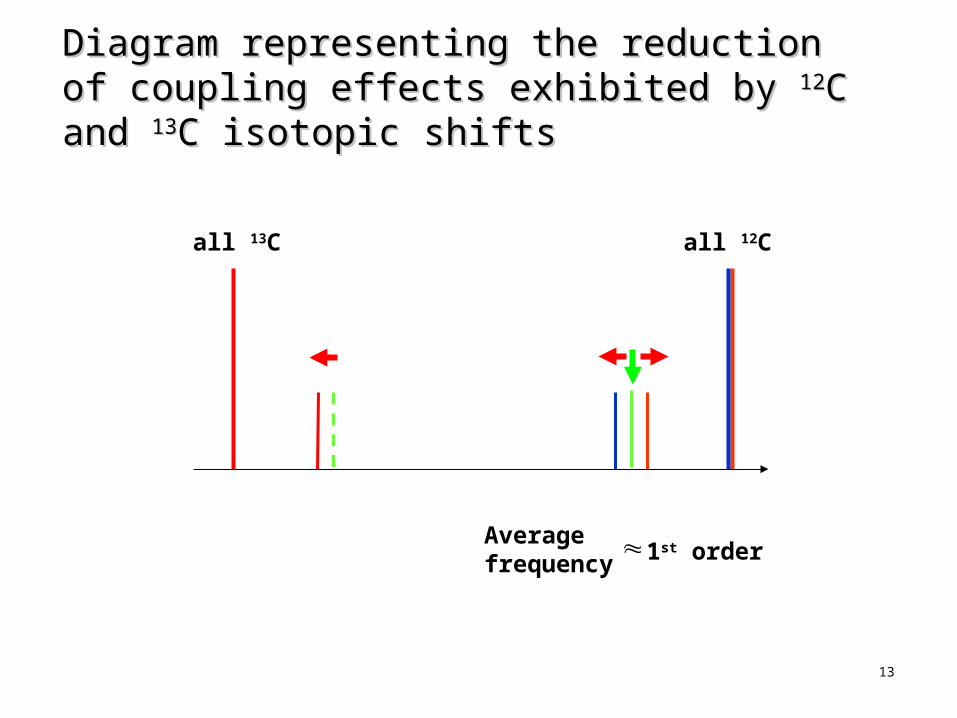
Diagram representing the reduction of coupling Diagram representing the reduction of coupling effects exhibited by effects exhibited by 1212C and C and 1313C isotopic shiftsC isotopic shifts
all 12Call 13C
Averagefrequency 1st order

14
Deperturbation MethodDeperturbation Method
• Using the previous example of theUsing the previous example of the νν33((σσuu))
mode of linear Cmode of linear C5 5 , the deperturbation method , the deperturbation method
consists of the following steps:consists of the following steps:

15
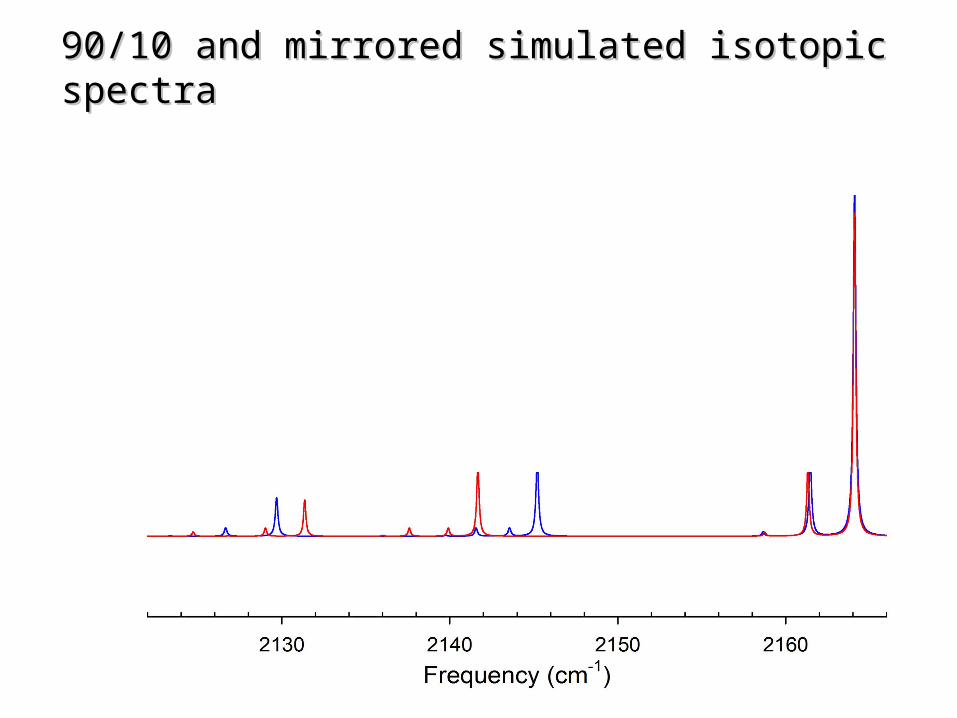
Application of a linear transformation that Application of a linear transformation that mirrorsmirrors the simulated 10/90 spectrumthe simulated 10/90 spectrum

16
to obtain a 10/90 mirrored simulated spectrum to obtain a 10/90 mirrored simulated spectrum
17
90/10 and mirrored simulated isotopic spectra90/10 and mirrored simulated isotopic spectra

18
Simulated isotopic spectra of theSimulated isotopic spectra of the νν33((σσuu)) mode of linear Cmode of linear C55
displayed for the application of the deperturbation methoddisplayed for the application of the deperturbation method

19Frequency (cm-1)
Abs
orba
nce
12C12,v7
2130 2140 2150 2160
90% 12C / 10% 13C
c2
c1
c3
10% 12C / 90% 13C
2080 2090 2100 2110 2120
c2
c1
c3
Application of the same linear transformation to Application of the same linear transformation to the isotopic shifts of the 10/90 experimental the isotopic shifts of the 10/90 experimental spectrumspectrum

20

21

22
c1 c2 c3 c4 c5

23
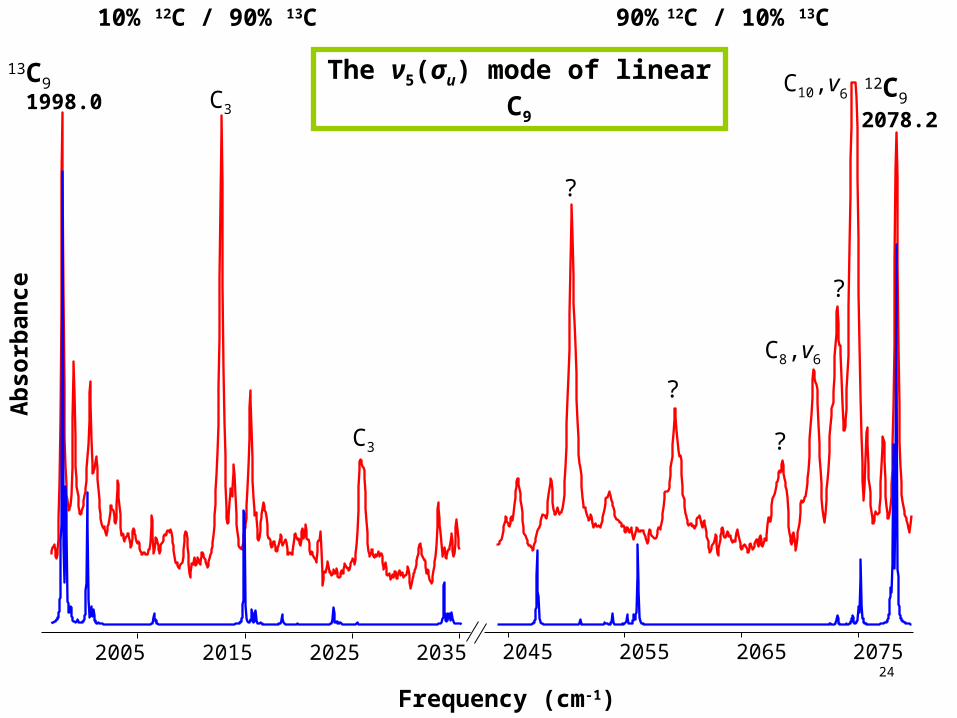
ResultsResults• The deperturbation method has been The deperturbation method has been
applied to the interpretation of the isotopic applied to the interpretation of the isotopic spectra of longer carbon chains like linear spectra of longer carbon chains like linear CC77 and linear C and linear C99..
24
Ab
sorb
ance
1998.0
2005 2015 2025 2035
C3
C3
?
2078.2
2045 2055 2065 2075
Frequency (cm-1)
C10,v6
C8,v6
?
?
?
10% 12C / 90% 13C 90% 12C / 10% 13C
13C9 12C9The ν5(σu) mode of linear C9

25
Ab
sorb
ance
1998.0
1999.1
2000.6 2015.6
2033.1
2005 2015 2025 2035
C3
C3
?
2045.9
2048.7
2053.7
2075
.720
77.1
2078.2
2045 2055 2065 2075
Frequency (cm-1)
C10,v6
C8,v6
?
?
?
?
10% 12C / 90% 13C 90% 12C / 10% 13C
13C9 12C9
c5
c1
c4
c5
c1
c3 c3c4
c2c2
The ν5(σu) mode of linear C9

26
ConclusionsConclusions• The deperturbation method can be applied The deperturbation method can be applied
to interpret isotopic spectra by comparing to interpret isotopic spectra by comparing the effects of the interactions between the effects of the interactions between vibrational modes exhibited by the vibrational modes exhibited by the experimental and predicted isotopic shifts.experimental and predicted isotopic shifts.