a concurrent dynamic analysis framework for multicore · pdf file · 2009-09-01a...
TRANSCRIPT

A Concurrent Dynamic Analysis Frameworkfor Multicore Hardware ∗
Jungwoo HaThe University of Texas at AustinUniversity of Southern California
Information Sciences Institute [email protected]
Matthew ArnoldIBM T.J. Watson [email protected]
Stephen M. BlackburnAustralian National University
Kathryn S. McKinleyThe University of Texas at Austin
AbstractSoftware has spent the bounty of Moore’s law by solvingharder problems and exploiting abstractions, such as high-level languages, virtual machine technology, binary rewrit-ing, and dynamic analysis. Abstractions make programmersmore productive and programs more portable, but usuallyslow them down. Since Moore’s law is now delivering mul-tiple cores instead of faster processors, future systems musteither bear a relatively higher cost for abstractions or usesome cores to help tolerate abstraction costs.
This paper presents the design, implementation, and eval-uation of a novel concurrent, configurable dynamic analy-sis framework that efficiently utilizes multicore cache archi-tectures. It introduces Cache-friendly Asymmetric Buffer-ing (CAB), a lock-free ring buffer that implements efficientcommunication between application and analysis threads.We guide the design and implementation of our frameworkwith a model of dynamic analysis overheads. The frameworkimplements exhaustive and sampling event processing and isanalysis-neutral. We evaluate the framework with five pop-ular and diverse analyses, and show performance improve-ments even for lightweight, low-overhead analyses.
Efficient inter-core communication is central to high per-formance parallel systems and we believe the CAB designgives insight into the subtleties and difficulties of attaining itfor dynamic analysis and other parallel software.
Categories and Subject Descriptors D.3.4 [Programming Lan-guages]: Processors—Run-time environmentsGeneral Terms Experimentation, Performance, Measurement
Keywords Dynamic Analysis, Profiling, Multicore, Instrumentation∗ This work is supported by ARC DP0666059, NSF CNS-0917191, NSFCCF-0811524, NSF CNS-0719966, NSF CCF-0429859, Intel, IBM, andGoogle. Any opinions, findings and conclusions expressed herein are theauthors’ and do not necessarily reflect those of the sponsors.
Permission to make digital or hard copies of all or part of this work for personal orclassroom use is granted without fee provided that copies are not made or distributedfor profit or commercial advantage and that copies bear this notice and the full citationon the first page. To copy otherwise, to republish, to post on servers or to redistributeto lists, requires prior specific permission and/or a fee.OOPSLA 2009, October 25–29, 2009, Orlando, Florida, USA.Copyright c© 2009 ACM 978-1-60558-734-9/09/10. . . $10.00
1. IntroductionDynamic analysis is a base technology for performance op-timization [1, 9, 25], debugging [15, 21, 24], software sup-port [13, 31], and security [18, 22]. Binary rewriting systemsand Just-In-Time (JIT) compilers in managed runtimes needdynamic information about the program to optimize it. Theyoften employ techniques for reducing the overhead, such assampling, that trade accuracy for performance. However, dy-namic analyses used for debugging, software support, andsecurity often require fully accurate analysis. The overheadof more expensive analyses limit their use.
Multicore architectures offer an opportunity to improvethe design and performance of dynamic analysis. As thenumber of cores on commodity hardware continues to in-crease and application developers are struggling to paral-lelize application tasks, exploiting unused processors to per-form dynamic analysis in parallel with the application be-comes an increasingly appealing option.
This paper explores the design and implementation ofa dynamic analysis framework that exploits under-utilizedcores by executing analysis concurrently with the applica-tion. In the framework, an application produces events, suchas paths executed or memory operations performed, and aseparate concurrent analysis thread consumes and analyzesthem. Figure 1 compares sequential and concurrent dynamicanalysis. Whereas traditional dynamic analysis is performedsequentially when the application produces one or a groupof events, in our framework, the application queues eventsin a buffer, and a concurrent analysis thread dequeues andanalyzes them.
The ability to communicate data efficiently from one coreto another is critical to the success of a concurrent dynamicanalysis implementation. Unfortunately, the complexity andvariety of multicore architectures and memory hierarchiespose substantial challenges to the design of an efficient com-munication mechanism. We found that a number of vari-ables influence performance, such as hardware variation,communication cost, bandwidth between cores, false shar-ing between caches, coherence traffic, and synchronizationbetween the producer and consumer threads.

Collect!Event!
Analyze!Event!
Sequential Dynamic Analysis! Concurrent Dynamic Analysis!
Application!
Application!
Collect!Event!
Enqueue!
Application!
Application!Analyze!Event!
Dequeue!
Application Thread! Application Thread! Analysis Thread!
Figure 1. Generic sequential dynamic analysis versus con-current dynamic analysis.
This paper’s main contribution is a new buffering designthat we call Cache-friendly Asymmetric Buffering (CAB),which provides an efficient mechanism for communicatingevent data from application threads to analyzer threads onmulticore hardware. CAB is asymmetric because we bias theimplementation to minimize impact on the application; theapplication rarely synchronizes with the analysis thread. Thedesign is cache friendly because it exploits shared caches,carefully limits synchronization, and avoids coherence traf-fic and contention on shared state between private caches.
We present the design and implementation of a concur-rent dynamic analysis framework that uses CAB as its com-munication mechanism between the application and analy-sis. We implement the framework in Jikes RVM [1], a highperformance research Java Virtual Machine and perform ex-periments on three Intel processors with very different cacheorganizations: Pentium 4, Core 2 Quad, and Core i7. Weshow that compared to two highly optimized state-of-the-artalternative buffering mechanisms: N-way buffering [32] andFastForward concurrent lock-free queues [12], that CAB re-duces overhead for path profiling on average by 8 and 41%respectively.
To evaluate the framework, we implement a variety ofpopular dynamic analyses: method counting, call graph pro-filing, call tree profiling, path profiling, and cache simula-tion. We build and compare sequential and concurrent ver-sions of these analyses.
We demonstrate the framework in an exhaustive mode,for analyses that require fully accurate event records, and in asampling mode for analyses that can trade accuracy for over-head via sampling. Experimental results for exhaustive modedemonstrate that this framework provides performance im-provements for dynamic analysis when the analysis work isgreater than the buffering overhead, such as for call graph,call tree, and path profiling. For example, compared to se-
quential profiling, we reduce the overhead of exhaustive calltree and path profiling between 10 to 70%, depending on thearchitecture. In sampling mode, the framework reduces over-head even further. For example, sampling achieves greaterthan 97% accuracy at a 5% sampling rate, while reducingthe overhead by more than half for call graph and path pro-filing with hsqldb.In summary, the contributions of this paper are as follows.• The design, implementation, and evaluation of CAB, a
novel efficient communication mechanism that is easilytuned for various multicore processors.
• The design, implementation, and evaluation of a novelframework for concurrent dynamic analysis using CABfor exhaustive and sampling analyses. The framework isanalysis-neutral and it is easy to add analyses.
• A demonstration of the framework with a range of anal-yses: method counting, call graph profiling, call tree pro-filing, path profiling, and cache simulation.
• A cost model that characterizes dynamic analyses amen-able to concurrent implementation and that guides theperformance analysis.
We believe that the design issues addressed here transcendthe framework as these same issues and solutions are appli-cable more generally to software design for multicore hard-ware. The CAB design, which carefully manages communi-cation, coherency traffic, false sharing, and cache residency,offers a building block to future software designers taskedwith parallelizing managed runtime services and applica-tions with modest to large communication requirements.
2. Related WorkSince there is a lot of research on dynamic analysis, we focuson differences with the most closely related research, whichexploits parallelism to reduce dynamic analysis overhead.
PiPA (Pipelined Profiling and Analysis) describes a tech-nique for parallelizing dynamic analysis on multicore sys-tems and uses multiple profiling threads per applicationthread [32]. PiPA is implemented in a dynamic binary trans-lator and collects execution profiles to drive a parallel cachesimulator. PiPA uses symmetric N-way buffering and locksto exchange buffers between producers and consumers.Their buffering overhead grows with respect to the size ofthe buffer, and a small buffer size, e.g., 16KB, achieves thelowest overhead. However, some of their profiling clientsrequire larger buffers for high frequency events. As we showin the results section, CAB is on average 8% faster and up to16% faster than this organization, and the overhead is con-sistently low with a large buffer. In our work, the analysisis concurrent (runs in parallel with the application) and par-allel (multiple analysis threads run at the same time), but isdifferent from PiPA in that we currently support at most oneanalysis thread per application thread. This configuration isjust for our current implementation, and is not a fundamental

limitation of CAB. This paper focuses on efficiently trans-ferring data between cores, and we believe that PiPA wouldbenefit from using CAB.
FastForward is a software-only concurrent lock-free que-ue implementation for multicore hardware [12]. It uses asentinel value (NULL) to avoid concurrent access of the queuehead and tail indices, and forces a delay between the con-sumer and producer to avoid cache line thrashing. Whiletheir design is reasonable for a general purpose queue, CABis more suitable for use in concurrent dynamic analysis fortwo reasons. First, CAB’s enqueueing code is more effi-cient for handling a large number of events, such as thoseproduced by dynamic instrumentation. Second, CAB’s de-queueing operation spins only at the beginning of eachchunk while FastForward dequeueing operates at a finergranularity, spinning on single events (i.e., one memory lo-cation). It thus synchronizes with the producer much morefrequently than is necessary with CAB. We compare CABto FastForward queueing and show that CAB improves per-formance by 41% on average, and up to 117%.
Shadow Profiling and SuperPin are profiling techniquesthat fork a shadow process, which runs concurrently withoriginal application process [23, 29]. The shadow processexecutes instrumented code, while the original applicationruns uninstrumented. Currently, these approaches are limitedto single-threaded applications, because implementations offork on most thread libraries only fork from the currentthread. Unlike our framework, the shadow processes cannotcover the whole program execution, because events aroundfork and unsafe operations may be lost.
Aftersight decouples profiling at the virtual machine layerusing record and replay technology [10]. During one execu-tion of the application, Aftersight uses VM recording to re-play execution and then performs profiling on subsequentreplayed executions. The profiling executions can be per-formed concurrently with the recording run, or offline at alater time. In our framework, the application and analysisare decoupled, but the application is executed only once anddynamic analysis is performed online.
Recent work suggests hardware support for low-overheaddynamic analysis. HeapMon uses an extra helper thread todecouple memory bug monitoring [27]. The idea of offload-ing the data to another thread is similar to our framework.However, HeapMon achieves low-overhead because of hard-ware buffering and instrumentation support. The hardwaresupport is specifically for heap memory bugs. We achieveperformance without any special support, and we assumeless about the class of analysis.
iWatcher leverages hardware assisted thread-level spec-ulation to reduce the overhead of monitoring program lo-cations [33]. The platform offers general debugging analy-sis, but low-overhead is only guaranteed with hardware sup-port. Current multicore processors do not support thread-level speculation.
Shared Cache
L1 L1
Core A Core B
App
licat
ion A
nalyzer
Inst
rum
ente
d to
pro
duce
eve
nts
Consum
es events
CA
B e
vent
enq
ueui
ng
CA
B event dequeing
...
...
Figure 2. Cache-friendly Asymmetric Buffering (CAB) ina concurrent dynamic analysis framework.
Our dynamic analysis framework supports both exhaus-tive and sampling analysis of events. Prior work presenteddesigns for low-overhead sampling of instrumentation [2, 3,7, 17], where sampling logic is executed in the applicationthread to determine when a sample should be taken. Theseapproaches are orthogonal and complimentary to our work;our framework could perform sampling in the applicationthread to reduce the amount of data sent to another core.However, our framework also enables a new methodologyfor sampling, where data is written into a buffer exhaustivelyand is then optionally consumed (sampled) by the analyzerthread(s). By enabling concurrent execution of the analyzerand the application thread, our technique is likely to out-perform traditional sampling techniques when a higher sam-ple rate is used and time in the analyzer increases. However,even with low sample rates this new approach can be bene-ficial because it moves the sampling logic off the fast path(out of the application thread) and into the analyzer thread.Thus, this new approach is likely to be beneficial if a pro-filer’s communication cost between cores is less than the costof the sampling logic. CAB reduces communication costs,making this form of sampling more viable.
3. Concurrent Dynamic Analysis FrameworkAs shown in Figure 1, dynamic analysis systems includean event producer (the instrumented application), an eventconsumer (an analyzer), and an event handling mechanism,which links the first two. The application and analyzer maybe folded together to execute within the same thread, or theymay be distinct, executing concurrently in separate threads.We focus on the design and implementation of a genericevent handling mechanism that supports concurrent dynamicanalysis on multicore platforms. The goal of this frameworkis to exploit underutilized computational resources and faston-chip communications to minimize the observed overheadof dynamic analysis.
Figure 2 presents the overview of our framework and theCAB event handling mechanism. An application thread anda dynamic analyzer thread execute on separate cores. The

application produces analysis events at injected instrumen-tation points, and CAB transfers the events to the analysisthread. Since CAB is generic and yet cache-friendly, theanalysis writer is: a) freed from low-level micro-architecturaloptimization concerns when offloading the event, and b) canimplement the analysis logic independently of the applica-tion instrumentation.
By constructing a framework, many analyses may reusethe highly tuned mechanisms. The framework is flexibleand general. It supports an exhaustive mode that collectsand analyzes all events, and a sampling mode, in which theanalysis samples a subset of the events.
3.1 CAB: Cache-friendly Asymmetric BufferingCAB provides a communication channel between applica-tion and analysis threads. Two objectives guide the design ofCAB: 1) minimizing application instrumentation overhead,and 2) minimizing producer-consumer communication over-head. We use three tactics to address these goals: a) we biasthe design toward very low overhead enqueueing, b) we uselock-free synchronization, and c) we partition access to thering buffer to avoid costly micro-architectural overheads dueto cache contention.
At the center of CAB is a single-producer, single-con-sumer lock-free ring buffer, in which an application threadproduces events and an analysis thread consumes them.Since each CAB has only one producer and consumer pair,we can optimize for fast, lock-free, access to this sharedbuffer. Our approach is asymmetric. The application viewsthe buffer as a continuous ring into which it enqueues indi-vidual events. By contrast, the analyzer views the buffer asa partitioned ring of fixed sized chunks, and each dequeueoperation yields an entire chunk.
3.1.1 Lock-free Synchronization
The special case where a communication buffer is shared byjust a single producer and a single consumer has the distinctadvantage of avoiding intra-producer and intra-consumer co-ordination, and is well-studied for general purpose concur-rent queue implementations [11, 12, 19]. Specifically, thecommon case enqueue and dequeue operations can be im-plemented without locks, as wait-free operations [16]. Ofcourse, the operations are not actually wait-free if the desiredsemantics require that the producer block on a full buffer andthat the consumer block on an empty buffer. However fordynamic analysis, the common case is high frequency en-queueing and dequeueing, so blocking is exceptional with areasonable sized buffer. Although requiring CAB to be sin-gle producer, single consumer is restrictive, the simplicityand performance of the lock-free implementation it yields isattractive given the importance of minimizing perturbationof the application. However, this does not preclude buildinga multiple producer or consumer system on top of the lock-free CAB, as discussed in Section 3.3.
1 while (*bufptr != CLEAR) {2 if (*bufptr == MAGIC)3 bufptr = &buffer; // wrap back to start4 if (*bufptr != CLEAR)5 block(); // busy, back off6 }7 *bufptr++ = data; // enqueue data
(a) Enqueueing events in application code
1 block() {2 spin_wait();3 pollptr = SKIP(bufptr, CHUNK_SIZE * 2);4 while (*pollptr != CLEAR) {5 if (isInvokedGC())6 thread_yield(); // must cooperate7 else8 sleep(n);9 }
10 }
(b) Blocking the application
1 while (isApplicationRunning()) {2 /* keep distance of 2 chunks from producer */3 index = ((chunk_num + 2) * chunk_size)4 % buffer_size;5 while (buffer[index] == CLEAR)6 spin_or_sleep();7 /* consume & clear entire chunk */8 consume_chunk(chunk_num);9 chunk_num = next(chunk_num)
10 }
(c) Dequeueing events in analysis code
Figure 3. Enqueueing and dequeueing pseudo-code.
3.1.2 Queue Operations
CAB can be used for both exhaustive and sampled event col-lection. We start by describing queuing operations for ex-haustive mode. In exhaustive mode, every event is enqueued,dequeued, and analyzed.
Enqueueing The detailed design of CAB’s enqueueingoperation is guided by three goals: 1) the design should min-imally perturb the application; 2) it needs to accommodatedynamically allocated and dynamically sized event buffers;and 3) if an enqueue operation causes an application threadto block, it must cooperate with the garbage collector andany other scheduling requirements to prevent deadlock.
To minimize perturbation of the application thread, thecommon case for enqueueing must be fast, and the injec-tion of enqueueing operations should minimally inflate thetotal code size. Figure 3(a) shows the pseudocode for the en-queueing operation. The common case for enqueueing con-sists of just two lines (1 and 7). When there is space in thebuffer, the test at line 1 evaluates to false and execution fallsdirectly through to line 7. The exceptional case may occureither because the end of the buffer has been reached or be-cause the buffer is full. These cases are dealt with by lines 3and 5 respectively. If the buffer is full, the blocking code inFigure 3(b) is executed via a call. Note that all of this code

is lock-free, and that in the common case, just a single con-ditional branch is executed (line 1 of Figure 3(a)). As shownlater in Figure 6(a) and Figure 6(b), the compiler or binarytranslator can push lines 2–6 out of the hot code block, keep-ing the code small and the length of the critical path short.
The control flow in the enqueueing operation dependsonly on *bufptr and two constants: CLEAR and MAGIC (lines1, 2 and 4 of Figure 3(a)). This design is very efficientwhile also supporting variable sized, dynamically allocatedbuffers. Dynamic allocation is essential since the numberof buffers is established at run-time, and dynamic sizingis valuable since the system may respond to the particularrequirements and resource constraints of a given application.
The idea is that the producer will only ever write intobuffer fields which have been cleared by the consumer: theproducer guards in line 1 of Figure 3(a), and the consumersets the sentinel CLEAR when it consumes the chunk in line 8of Figure 3(c). By using a special sentinel value (MAGIC) tomark the end of the ring buffer, a single test for CLEAR in line1 will guard against both the end of the buffer being reached(line 2) and a full buffer (line 4). When the end of the bufferis reached, bufptr is reset to point to the start of the buffer,&buffer (line 3). The buffer address is only required in line3, and is held in a variable. Furthermore, the code path has noexplicit test against the buffer size or end of buffer, which isimplicitly identified via the MAGIC marker. We can thereforedynamically allocate and size the buffer. This design requiresthat CLEAR and MAGIC are illegal values for analysis events.In practice, it is easy to choose CLEAR and MAGIC suitably toavoid imposing on the needs of the analyzer.
The exceptional case where the producer thread mustblock because the buffer is full (line 5) is handled out ofline (Figure 3(b)). In general, when the producer threadblocks, it must remain preemptible, otherwise it could leadto deadlock. Specifically, if the consumer invoked a garbagecollection while the producer thread was blocked, and theproducer thread were unpreemptible, deadlock would ensue.For this reason, the producer thread spins briefly (line 2 ofFigure 3(b)) before re-testing whether the buffer is full (line4) and yielding to GC (line 6) or sleeping (line 8). Note thatthe code checks the contents of pollptr, a point two chunksahead of bufptr (pollptr is set in line 2). By doing this, weeffectively back off the producer, giving the consumer timeto work and ensuring that upon return there will be at leasttwo chunks of free space available in the buffer.
Dequeueing The design of CAB’s dequeueing operationis guided by two goals: 1) the design should minimizeproducer-consumer communication overhead, and 2) sim-ilar to enqueueing, it needs to accommodate dynamicallyallocated and sized buffers. We address the second goal byavoiding any static reference to the buffer address or buffersize, as we described above for enqueueing. To meet the firstgoal, the analysis thread synchronizes at a coarse grain byconsuming a large number of events at once (i.e., a chunk).
Furthermore, the design does not induce unnecessary cachecoherence traffic on shared or private caches, because CABnever accesses the chunk into which the producer is writing.
CAB prevents the producer and consumer from access-ing the same cache lines at once by logically partitioningthe ring buffer into large fixed-size chunks, and then ensur-ing that the consumer remains at least one complete chunkbehind the producer (line 5 of Figure 3(c)). The size of achunk is a dynamically configurable option (chunk_size inFigure 3(c)). Recall that the producer is largely oblivious tothis partitioning of the ring buffer; it enqueues events regard-less of chunk boundaries. However, if the buffer becomesfull, the producer waits until there are at least two emptychunks available to it (lines 3 and 4 of Figure 3(b)).
In this design, the consumer minimizes overhead andsynchronization by dequeueing and processing one chunkat a time (line 8 of Figure 3(c)), reducing spinning andchecking without affecting the fine-grained producer activ-ity. The analysis happens in the call to consume_chunk() atline 8. If the analyzer itself is multi-threaded, it may dis-patch analysis events to multiple threads. The analyzer clearsthe buffer immediately after it processes each event as partof consume_chunk(). Clearing is essential, since it commu-nicates to the producer that the buffer is available (line 1of Figure 3(a)). Clearing immediately after processing eachevent maximizes temporal locality. In the special case whenthe producer terminates, it is usually desirable for the con-sumer to process the remaining entries. Since the consumernormally may not read from the same chunk as the producer,we include in our API the facility for the producer to explic-itly flush residual events to the consumer.
3.1.3 Optimizing CAB For Multicore Processors
We tune CAB’s chunk-based ring buffer design to reduce mi-croarchitectural side-effects due to producer-consumer con-tention. However, we make only minimal assumptions aboutthe multicore architecture. We assume that the hardware canexecute multiple software threads simultaneously on sepa-rate cores or on the same core. We do not require any spe-cific cache hierarchy. The design works for both private andshared cache designs, but benefits from shared lower levelcaches. For example, Figure 4 shows three Intel hardwaregenerations, which comprise our experimental platforms.(Section 6 has more details on each.) These designs are quitedifferent, yet CAB works well with all of them.
The CAB design ensures that 1) the producer and con-sumer never access the same cache line simultaneously, 2)the producer and consumer can exploit a shared cache, and3) the producer and consumer exhibit spatial locality that isamenable to hardware prefetching. The first two design goalsavoid cache thrashing, the second also minimizes memorylatency, and the third seeks to hide cache miss penalties.
To avoid cache thrashing when the producer and con-sumer do not share an L1 cache, the chunk size should be

L1
L2
applica
tion
analyzer
8KB
512KB (a) Pentium 4 with Hyper-threading
4MB 4MB
system bus
L1
L2
appl
icatio
n
anal
yzer
32KB 32KB
appl
icatio
n
anal
yzer
32KB 32KB
(b) Core 2 Quad
8MB
L1
L2
applica
tion
analyzer
32KB
256KB
applica
tion
analyzer
32KB
256KB
applica
tion
analyzer
32KB
256KB
applica
tion
analyzer
32KB
256KB
L3 (c) Core i7
Figure 4. Experimental processors data cache structure. Instruction or trace cache is omitted. Application and analyzer’smapping to the cores is idealized, and it is not a requirement.
large enough that by the time the producer is writing tochunk n + 2, chunk n has been fully evicted from the pro-ducer’s L1 cache. If we assume a strict LRU cache replace-ment policy, this criteria is satisfied with a chunk size that isgreater than or equal to the L1 cache size. In practice, cachereplacement policies are not always strict LRU. Thus a largerchunk size is better. Furthermore, since producer-consumersynchronization occur on chunk boundaries, smaller chunksare generally more expensive. Thus, when the producerand consumer share an L1 cache, the synchronization over-head of small chunks still outweighs any locality advantage,which is why large chunks are effective on shared L1 cachesas well. This design easily generalizes for more levels ofprivate cache. Our evaluation uses a chunk size of four timesthe L1 size.
If the runtime uses native threads, we control producer-consumer affinity via the POSIX sched_setaffinity()
API. On the other hand, if the runtime employs a user-levelscheduler, we may require modest changes to the scheduler(see Section 5.1). We do not require special operating systemsupport or modifications to the operating system’s scheduler.
By using a ring buffer, the producer and consumer’smemory operations are almost strictly sequential (exceptwhen the ring buffer infrequently wraps around). It is hardto test directly the hypothesis that CAB addresses our lo-cality objective, but we measured L1 and L2 miss rates andfound that they were not correlated with buffering overheadwhen we varied the buffer size on both shared and private L1cache architectures. We also experimented with special Intelnon-temporal memory operations but found they degradedperformance compared with our straightforward sequentialbaseline. Worse, the current Intel implementations of non-temporal store operations bypass the entire cache hierarchy,forcing the consumer to go to memory rather than the sharedlast level cache. CAB would benefit from previously pro-posed hardware instructions, such as the evict-me, or someother mechanisms that mark cache lines LRU [20, 30]. CABcould then reduce its cache footprint and thus its influenceon the application, while still benefiting from sharing.
3.2 SamplingIf the analysis thread is unable to keep up with the appli-cation, the buffer will eventually fill up and the applicationthread will block (line 5 of Figure 3(a)). Depending on theanalysis, this application slowdown may be unavoidable. Forexample, security analyses and cache simulation profilerstypically require fully accurate traces. Other analyses, suchas those designed for performance analysis, often tolerate re-duced accuracy to gain reduced overhead. In such cases, theprofilers in CAB may sample to prevent the application fromblocking.
In our sampling framework, the producer still enqueuesall the events and then the consumer samples the buffer, an-alyzing only a subset of the recorded data, skipping overthe rest. Other sampling designs, such as timer-based sam-pling [3], reduce the number of events. However, client anal-yses that are control-flow-sensitive (e.g., path profiling) andcontext-sensitive analyses (e.g., call trees), must still insertpervasive instrumentation and maintain their state even ifthe instrumentation does not store the events. In contrast, oursampling framework eases the burden of implementing thesemore advanced forms of sampling because the sample deci-sions are made in the analysis thread; the logic is off the fastpath of the application thread so it can be written in a high-level language (rather than inlined into compiled code) andwith less concern over efficiency.
Enqueueing In sampling mode, the producer never checkswhether the buffer is full. If the consumer cannot keep upwith the producer, the producer simply continues writing tothe buffer and data is lost. This design obviously trades ac-curacy for performance. Figure 5(a) shows pseudocode forthe application thread when in sampling mode, and shouldbe compared to Figure 3(a). The code consists of the min-imal instructions required to insert an element into a CABbuffer.
Dequeueing Figure 5(b) shows pseudocode for dequeue-ing in sampling mode. Compared to exhaustive mode de-queueing (Figure 3(c)), there are two differences. First, each
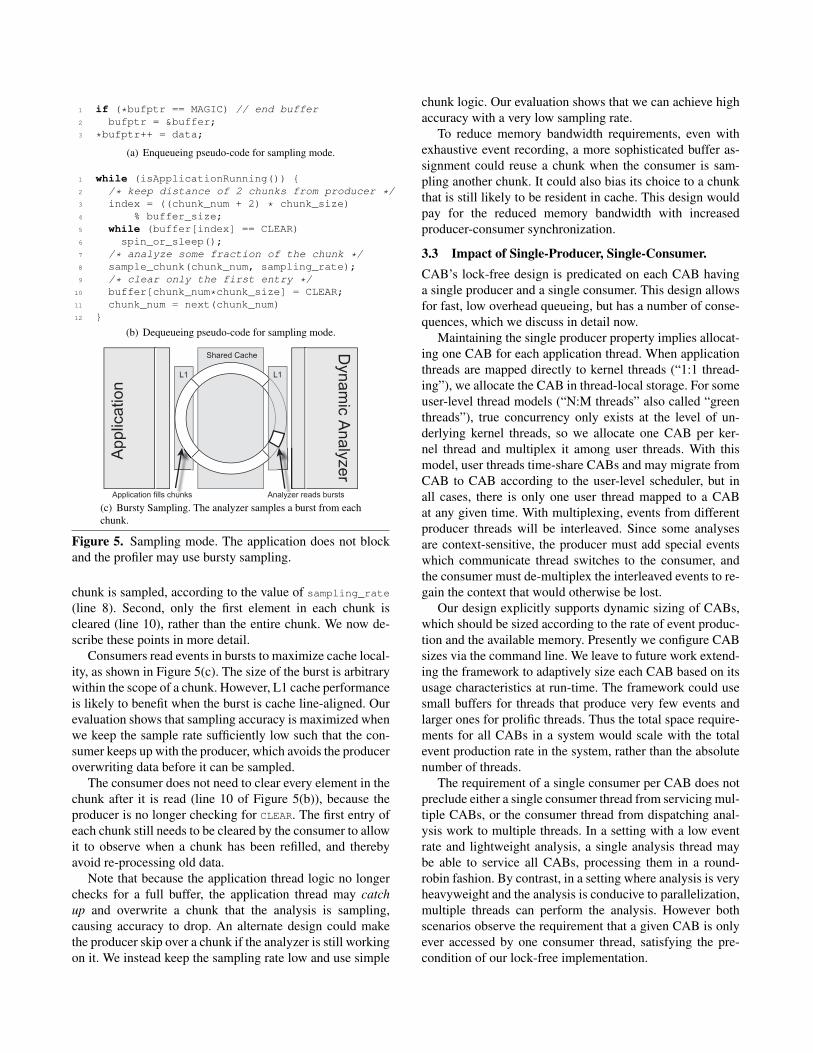
1 if (*bufptr == MAGIC) // end buffer2 bufptr = &buffer;3 *bufptr++ = data;
(a) Enqueueing pseudo-code for sampling mode.
1 while (isApplicationRunning()) {2 /* keep distance of 2 chunks from producer */3 index = ((chunk_num + 2) * chunk_size)4 % buffer_size;5 while (buffer[index] == CLEAR)6 spin_or_sleep();7 /* analyze some fraction of the chunk */8 sample_chunk(chunk_num, sampling_rate);9 /* clear only the first entry */
10 buffer[chunk_num*chunk_size] = CLEAR;11 chunk_num = next(chunk_num)12 }
(b) Dequeueing pseudo-code for sampling mode.
App
licat
ion
Dynam
ic Analyzer
Application fills chunks Analyzer reads burstss chunks
Shared Cache
1L1L
(c) Bursty Sampling. The analyzer samples a burst from eachchunk.
Figure 5. Sampling mode. The application does not blockand the profiler may use bursty sampling.
chunk is sampled, according to the value of sampling_rate(line 8). Second, only the first element in each chunk iscleared (line 10), rather than the entire chunk. We now de-scribe these points in more detail.
Consumers read events in bursts to maximize cache local-ity, as shown in Figure 5(c). The size of the burst is arbitrarywithin the scope of a chunk. However, L1 cache performanceis likely to benefit when the burst is cache line-aligned. Ourevaluation shows that sampling accuracy is maximized whenwe keep the sample rate sufficiently low such that the con-sumer keeps up with the producer, which avoids the produceroverwriting data before it can be sampled.
The consumer does not need to clear every element in thechunk after it is read (line 10 of Figure 5(b)), because theproducer is no longer checking for CLEAR. The first entry ofeach chunk still needs to be cleared by the consumer to allowit to observe when a chunk has been refilled, and therebyavoid re-processing old data.
Note that because the application thread logic no longerchecks for a full buffer, the application thread may catchup and overwrite a chunk that the analysis is sampling,causing accuracy to drop. An alternate design could makethe producer skip over a chunk if the analyzer is still workingon it. We instead keep the sampling rate low and use simple
chunk logic. Our evaluation shows that we can achieve highaccuracy with a very low sampling rate.
To reduce memory bandwidth requirements, even withexhaustive event recording, a more sophisticated buffer as-signment could reuse a chunk when the consumer is sam-pling another chunk. It could also bias its choice to a chunkthat is still likely to be resident in cache. This design wouldpay for the reduced memory bandwidth with increasedproducer-consumer synchronization.
3.3 Impact of Single-Producer, Single-Consumer.CAB’s lock-free design is predicated on each CAB havinga single producer and a single consumer. This design allowsfor fast, low overhead queueing, but has a number of conse-quences, which we discuss in detail now.
Maintaining the single producer property implies allocat-ing one CAB for each application thread. When applicationthreads are mapped directly to kernel threads (“1:1 thread-ing”), we allocate the CAB in thread-local storage. For someuser-level thread models (“N:M threads” also called “greenthreads”), true concurrency only exists at the level of un-derlying kernel threads, so we allocate one CAB per ker-nel thread and multiplex it among user threads. With thismodel, user threads time-share CABs and may migrate fromCAB to CAB according to the user-level scheduler, but inall cases, there is only one user thread mapped to a CABat any given time. With multiplexing, events from differentproducer threads will be interleaved. Since some analysesare context-sensitive, the producer must add special eventswhich communicate thread switches to the consumer, andthe consumer must de-multiplex the interleaved events to re-gain the context that would otherwise be lost.
Our design explicitly supports dynamic sizing of CABs,which should be sized according to the rate of event produc-tion and the available memory. Presently we configure CABsizes via the command line. We leave to future work extend-ing the framework to adaptively size each CAB based on itsusage characteristics at run-time. The framework could usesmall buffers for threads that produce very few events andlarger ones for prolific threads. Thus the total space require-ments for all CABs in a system would scale with the totalevent production rate in the system, rather than the absolutenumber of threads.
The requirement of a single consumer per CAB does notpreclude either a single consumer thread from servicing mul-tiple CABs, or the consumer thread from dispatching anal-ysis work to multiple threads. In a setting with a low eventrate and lightweight analysis, a single analysis thread maybe able to service all CABs, processing them in a round-robin fashion. By contrast, in a setting where analysis is veryheavyweight and the analysis is conducive to parallelization,multiple threads can perform the analysis. However bothscenarios observe the requirement that a given CAB is onlyever accessed by one consumer thread, satisfying the pre-condition of our lock-free implementation.

4. A Model For Analysis OverheadThe performance benefit of offloading dynamic analysiswork in a separate thread depends on a number of factors,such as the amount of time spent in the application versusthe analysis code, and the amount of data the applicationmust transfer to another core for processing. If the amountof time spent transferring data far exceeds the time spentprocessing that data, the concurrent analysis is unlikely toshow significant benefit.
This section describes a basic cost model for overheadsin concurrent and single-threaded dynamic analysis systems.The model provides a detailed look at which performancecharacteristics determine the success of a concurrent imple-mentation, and thus help identify the types of analysis forwhich a concurrent implementation is beneficial.
The model presented below compares a single-threadedscenario, where the application and analysis execute in thesame thread, to a concurrent scenario, where the applicationand analysis execute in separate threads and communicatethrough shared memory. We start with the following defini-tions:
A Isolated application execution time.P Isolated analyzer execution time.Es Execution time with instrumentation and analysis
inline in the ssame thread as the application.Ec Execution time with a concurrent analyzer.
and a simple model of overheads:
Ai Application overhead due to instrumentationto produce events.
Iap Interference overhead due to applicationand analyzer (profiler) running insame thread (when single-threaded).
Aq Application thread overhead due to queueing(when concurrent).
Pc Analyzer thread overhead due to communicationand dequeueing (when concurrent)
The event instrumentation overhead Ai is idealized, sincein practice it is hard to isolate the cost of instrumentation forextracting events from the surrounding code which processesthose events. In a single threaded system, Iap is the indirectoverhead due to resource contention between the applicationand the analyzer sharing common hardware. The effectswill depend on the nature of P and may include memorycontention, cache displacement, register pressure, etc. Wedefine Es, the cost of single-threaded analyzer as:
Es = A + Ai + P + Iap (1)
In a concurrent system, the queuing overhead Aq reflectstime spent by the application enqueueing items and blockingon communication to the analyzer, plus the indirect effectenqueueing has of displacing the application’s cache. Pc
reflects the cost to the analyzer of dequeueing events, which
includes the communication overhead of loading data from ashared cache. Ai, Aq and Pc are each a function of the eventrate: the rate at which the application generates analysisevents. To define the cost of concurrent analysis, Ec, we startwith the cost of each of the two threads, EA
c and EPc , and
consider each thread separately with the assumption that thegiven thread is dominant (i.e. it never waits for the other).When the application dominates:
EAc = A + Ai + Aq (2)
and when the analyzer dominates:
EPc = P + Pc (3)
Since the application EAc and the analyzer EP
c are concur-rent, one may dominate the other. For simplicity, we assumethat for a given analyzer, either the application or analyzerwill uniformly dominate. In practice, the application and an-alyzer may exhibit phased behavior, but event bursts shouldbe somewhat smoothed by buffering. In any case, the sim-plification helps illuminate the nature of the problem. Un-der these assumptions, execution time for concurrent analy-sis can be defined as:
Ec = max(EAc , EP
c ) (4)
We now discuss the conditions that make concurrent analysisworthwhile, looking at the two cases separately when eitherthe application or analyzer dominates.
Application Thread Dominates. The application domi-nates when EA
c ≥ EPc , i.e., the application takes longer
than the analysis:
A + Ai + Aq ≥ P + Pc (5)
For concurrent analysis to improve performance in this sce-nario, it must maximize Es − EA
c :
Es − EAc = P + Iap −Aq ≥ 0 (6)
P + Iap ≥ Aq (7)
Concurrent analysis will improve performance as long as theapplication queuing costs, Aq, are small relative to analysiscosts, P + Iap. As we show in Section 6.2, Aq is typicallysmall. Iap is a function of P , and thus a very lightweight ana-lyzer, where P +Iap is smaller than Aq, will not benefit fromconcurrent analysis. We show this case holds for methodcounting, but in all the other cases we tested, which includesthe only slightly more expensive call graph construction, thecost of P + Iap is greater than Aq, and the framework pro-vides performance benefits. However, because the benefitEs − EA
c = Iap + P −Aq, and from Equation 5,
P −Aq ≤ A + Ai − Pc (8)
in the case the application dominates, the benefit of concur-rent analysis is limited.
Profiler Thread Dominates. In scenario 2, where EAc <
EPc , waiting for the analyzer becomes the bottleneck. For a
concurrent analyzer to improve performance, it must maxi-mize: Es − EP
c :
Es − EPc = A + Ai + Iap − Pc ≥ 0 (9)
A + Ai + Iap ≥ Pc (10)
Concurrent analysis will improve performance as long asthe communication cost is small relative to the applicationthread and associated overhead (A + Ai + Iap). Note thatonce the analyzer dominates, the performance improvement,Es − EP
c , is independent of the analyzer’s execution time,P . The speedup of the concurrent analyzer is determinedby the analyzer’s buffering and communication costs Pc; ananalyzer with higher cost P does not provide more incentivefor a concurrent implementation.
Extensions and Lessons. We can draw a number of lessonsfrom the analysis above. When the application thread dom-inates and EA
c ≥ EPc , the performance improvement from
concurrent analysis is limited by the single-threaded ana-lyzer cost P + Iap. When the analyzer thread dominates, theperformance improvement from concurrent analysis is lim-ited by time spent in the application thread and associatedoverhead (A + Ai + Iap).
In all cases, communication performance (Aq and Pc) iskey because it determines whether the theoretical improve-ments of concurrent analysis can be realized in practice. Thegoal of CAB is to reduce these communication costs as faras possible, thus allowing concurrent analysis to be effectivefor a wider class of analyzers than is possible today.
The model assumes that the analysis is executed con-currently with the application, but is not itself parallelized(subdivided into multiple worker threads). Once an analy-sis adopts a concurrent model, parallelizing the analysis be-comes relatively easier and has the potential to significantlyimprove performance when analysis time dominates applica-tion time. We do not investigate parallelizing the analyzersthemselves here because this process is is highly dependenton the particular analyses. Instead, we focus on minimizingcommunication overhead as part of a general framework.
5. ImplementationWe next discuss implementation details that are specific toour particular environment, and then we briefly describeeach of the five dynamic analyses that we implemented inour framework.
5.1 Platform-Specific Implementation DetailsWe implemented our framework in Jikes RVM [1]. JikesRVM is an open source high performance Java Virtual Ma-chine (VM) written almost entirely in a slightly extendedJava. This setting affected our implementation only in thatwe needed to take care to ensure the enqueueing operationsavoid locking out the garbage collector.
We implement our framework using two threading mod-els: N:M and native, which we describe below. While wewere developing this concurrent analysis framework, re-searchers changed from N:M threads implemented in JikesRVM 2.9.2 to native threads implemented in Jikes RVM3.1.0. This transition was imposed upon us, but it serves asan opportunity to demonstrate the generality of CAB withrespect to fundamentally different threading models.
Native threads improve average performance over N:Mthreads and is therefore preferable. Jikes RVM version 3.1.0however improves over 2.9.2 in many other ways as well,which makes it difficult to compare their performance di-rectly. For example, biased locking has reduced thread syn-chronization overhead, the Immix garbage collector im-proves locality and garage collection times [5], and the com-piler generates better code.
We implemented our framework in Jikes RVM 2.9.2with N:M threads and then ported it to native threads inJikes RVM 3.1.0. Except for the changes in how we mapthe analysis thread and the user threads, which we describebelow, our instrumenting and analysis code remained thesame. We have not yet however ported our experimentalinfrastructure, which teases apart the different overheadsand reports cache behaviors to explain our results. We thusreport overall performance results for all the client analysesfor both N:M and native threading models, but a detailedbreakdown analysis is presented for N:M threads only. Thetrends are the same for both models.
N:M Threading Version 2.9.2 of Jikes RVM uses an N:Mthreading model (also known as “green threads”), whichmultiplexes N user-level threads onto M virtual processorsvia a simple timer-based scheduler that the system triggersat yield points in the application. The Jikes RVM compil-ers inject yield points in method prologues, epilogues, andcontrol-flow back edges. Each of the M virtual processorsmaps directly to a single native thread that the operating sys-tem manages. Jikes RVM chooses M to match the numberof available hardware threads. Jikes RVM uses a Processor
data structure for per-virtual-processor state.Since true concurrency only exists among the M virtual
processors, we implemented CABs at this level, associat-ing one CAB with each Processor. Many user threads mayshare a given virtual processor, but only one thread can everbe executing on a virtual processor at any time. The sched-uler may migrate user threads among virtual processors asit schedules them. We modified Jikes RVM’s scheduler to:a) prescribe the affinity between virtual processors and theunderlying hardware, b) prevent the migration of applicationthreads onto analysis virtual processors, and c) record threadscheduling events in the CAB. We use the first two modifi-cations to schedule producer and consumer threads in pairson distinct cores with a common last level cache. The pro-ducer uses the third modification to inform the consumer ofthe changing affinity between producer threads and CABs.

1 mov eax $BUFPTR[esi]2 cmp [eax], CLEAR3 jne B4 A: mov [eax], $DATA5 add eax, 46 mov $BUFPTR[esi], eax
(a) Precise Mode (Fast Path).
1 B: cmp [eax], MAGIC2 jne C3 mov eax, $BUFADDR[esi]4 cmp [eax], CLEAR5 jeq A6 C: call block()7 jmp A
(b) Precise Mode (Slow Path).
1 mov eax $BUFPTR[esi]2 cmp [eax], MAGIC3 jne A4 mov eax, $BUFADDR[esi]5 A: mov [eax], $DATA6 add eax, 47 mov $BUFPTR[esi], eax
(c) Sampling Mode (Slow path is just line 4).
Figure 6. x86 assembly code for CAB enqueueing oper-ations. The esi register is used as a base register for theProcessor object in Jikes RVM, and eax is a register allo-cated by the compiler.
Native Threading Version 3.1.0 of Jikes RVM uses anative threading model, which maps each user and VMthread onto one operating system thread (also known as a“pthread”). Jikes RVM does not control the thread schedul-ing. It instead relies on the operating system scheduler.Timer-based sampling may still trigger thread yield points,as in N:M threads. The OS may migrate the user thread todifferent cores transparently to Jikes RVM. Therefore, thisimplementation does not control the affinity between theuser and analysis threads.
Unlike in the N:M implementation, with native threadsthe framework takes the number of analysis threads as a pa-rameter. The framework assigns each user thread a thread-local CAB buffer and an analysis thread. When the userthread terminates, the framework processes any remainingchunks by moving them to a pending buffer queue on theassociated analysis thread for processing. We assume thatthread creation and termination is infrequent and thus syn-chronize accesses to the pending queue.
Instrumentation and Enqueueing Each dynamic analysisin our implementation has four parts: 1) program instrumen-tation that produces an event, 2) enqueueing operations, 3)dequeueing operations, and 4) analysis. Parts 1) and 4) areanalysis-specific and are described below in Section 5.2. Weuse a straightforward implementation of part 3) from the de-sign section. The remainder of this section presents furtherdetails on our enqueueing implementation.
Figure 6 shows x86 assembly code for enqueueing inboth exhaustive and sampling modes. Note the simplicity ofthe common case code (Figures 6(a) and 6(c)). In samplingmode, the slow path comprises just a single instruction (line4). The rest of this section describes how we implementthe call to block() (line 6 of Figure 6(b)) to avoid lockingout other threads and to avoid introducing unsafe threadswitches.
In exhaustive mode, the producer may block while theconsumer catches up. It is essential that this blocking ex-hibits correct scheduling behavior and does not: a) lock outother threads, or b) allow garbage collection to occur at un-safe points.
It is only correct (i.e., safe) to perform garbage collectionwhen the runtime system can correctly enumerate all thepointer references into the heap. These references residein the statics, registers, and stack locations. To reduce theburden on the compiler, which generates this enumeration,a garbage collection (GC) safe point is typically a subsetof all possible instructions in the program. In Jikes RVM,each method call, method return, loop back edge, allocation,and potentially exception generating instruction is a GC safepoint. The Jikes RVM compiler guarantees that all compiledcode will reach reach a GC-safe point in a timely manner byinjecting conditional yield points on each loop back edge andmethod prologue, and a map that can enumerates referencesat each one of these points.
Thus if a producer does not yield to GC when blocked,the garbage collector will not be able to proceed, and then allapplication threads will block waiting for GC the next timethey try to allocate a new object, leading to deadlock. Forthis reason, our producer, rather than simply spinning, callsthe block() method (line 6, Figure 6(b)), which explicitlychecks whether a GC yield is necessary (line 5, Figure 3(b)).This protocol ensures that a blocked producer does not lockout other threads.
However, if an analysis requires instrumentation on aninstruction that is not a GC safe point, it may block at a GCunsafe point. For example, cache simulation requires instru-mentation at every load and store, which are not, in gen-eral, GC safe points. We address this problem by using anon-blocking enqueue (Figure 6(c)) for instrumentation atnon-GC safe points. We add checks at each loop back edgeand method prologue to ensure there is sufficient memoryin the buffer before the next GC safe point for any poten-tial enqueues. Our current implementation uses the gener-ous heuristic of ensuring that there is a full chunk availableat each check. While this heuristic works very well in prac-tice, it cannot guarantee correctness since it does not countthe maximum number of potential enqueues. An industrialstrength solution would not be particularly difficult to en-gineer; the compiler could estimate the number of potentialenqueues and compare with the buffer size, or guarantee afixed limit by enforcing a maximum on the length of non-

GC-safe paths by injecting occasional safe-points (at the ex-pense of generating the appropriate GC maps). However, weleave such an implementation to future work.
5.2 Dynamic AnalysesTo evaluate our concurrent dynamic analysis framework, weprototyped five popular profiling algorithms taken from theliterature: method counting, call graph profiling, call treeprofiling, path profiling, and a cache simulator. In each case,we instrument the application and implement the event pro-cessing logic, and bind the two with our dynamic analy-sis framework providing the event handling glue. All in-strumentation is performed after inlining, so inlined methodcalls are not instrumented. Path profiling produces 64 bitevent records, whereas the other clients produce 32 bit eventrecords. In each case, we implement a sequential and con-current version of the analysis for comparison.
Method counting On entry to each method, the methodcounting instrumentation writes a 32 bit method identifierinto the event buffer. The analysis uses an array of methodindexes initialized to zero. For each entry in the event buffer,the profile thread reads the entry and increments the corre-sponding method counter. The single-threaded version sim-ply increments the appropriate element in the array uponeach method entry.
Call graph profiling On entry to each method, call graphprofiling instrumentation produces a 32 bit profile eventwhich includes the current method and its caller. To identifythe caller, the instrumentation must walk up the stalk, whichrequires three memory loads in Jikes RVM. We are able topack both the caller and callee into 32 bits since 16 bits issufficient to identify all methods in our programs (as well asmany larger ones). Thus, the profile event rate is exactly thesame as for method counting. The analysis reads the events,computes a hash, and increments the corresponding hashtable entry indexed by the event. The single-threaded imple-mentation performs a hash table look-up and increment oneach method entry.
Call tree profiling Call tree profiling is a dynamic analysistool to classify a user program’s behavior for automatedsupport [13]. It summarizes a subtree of depth two in thedynamic call tree to represent the software execution. Toreduce the overhead of call tree profiling, Ha et al. used abit vector on the stack to mark the set of the calls. Unliketheir implementation, we construct the dynamic call tree onthe analysis threads using the trace of method calls sent overthe CAB to capture the subtree pattern. The instrumentationis exactly the same as call graph profiling, which is necessaryto construct the dynamic call tree.
This design is an interesting use of the concurrent dy-namic analysis, because it makes the heavy-weight optimiza-tion for the instrumentation unnecessary, it simplifies the im-
plementation the analysis code, and yet it achieves good per-formance.
Path profiling We inject full path profiling instrumenta-tion into the application [4]. Path profiling assigns a uniquenumber to all possible acyclic paths through a method andstores each executed path during execution. We adapt Bondand McKinley’s basic implementation from the Jikes RVMresearch archive [7]. This version does not include optimiza-tions that: a) eliminate increments to the path register onsome edges and b) use arrays instead of hash tables whenmethods are small, which is much more efficient. While aproduction implementation would include these optimiza-tions, they are not key to our evaluation.
The application instrumentation for path profiling is themost invasive of all the clients. On entry to each method,the path profiling instrumentation clears the path register.On each branch, it increments the path register by somevalue. On each back-edge and method exit, the instrumen-tation stores the path number in the profile event buffer andresets it to zero. Path profiling uses a 64 bit record sincethe path numbers are often larger than 32 bits in Java [7].For each path number, the profile thread computes a hashand increments the corresponding entry in the hash table.The single-threaded version performs this same work, buton each back-edge and method exit.
Thus, path profiling is more invasive, produces more andlarger entries, and uses a larger hash table to store its entriescompared to method counting, call graph profiling, and calltree profiling. Prior work finds, and our results confirm,that sequential exhaustive path profiling can add overheadsranging from 20% to over 100% of execution time.
Cache simulation We also implement a set associativecache simulator, which is similar to dcache implementedin Pin [21]. For each load and store instruction, the applica-tion instrumentation writes the 32 bit address into the buffer,using the low order bit to indicate whether the operationwas load or store. Because these addresses are already inregisters, this instrumentation, while prolific, is cheap. Itdoes have a very high event rate, and therefore stresses thecommunication mechanisms in our framework. The analysisthread consumes each entry, computing a new state for thecache. It stores cache state in arrays. For our experiments,the cache simulator models a 32KB 4-way set associative L1and a 512KB 8-way set associative L2. The L1 and L2 havea line size of 64B, are inclusive and have an LRU policy. Inthe single-threaded implementation, the analysis code callsout to a routine that updates the cache state at every load andstore. Fully accurate cache simulation is expensive; it addsoverheads ranging from 200 to 4500% to application time.
These five clients thus insert a wide range of types of instru-mentation and perform light to heavy weight analysis.
Benchmarks
compress
jessraytrace
db javacm
pegaudio
mtrt
jackantlr
bloatfop
hsqldb
jython
luindex
pmd
GeoMean
Rel
ativ
e E
xecu
tion
Tim
e (%
)
−10
0
10
20
30
40
−10
0
10
20
30
40Call Graph (N−way) Path Profiling (N−way) Call Graph (FastForward) Path Profiling (FastForward)
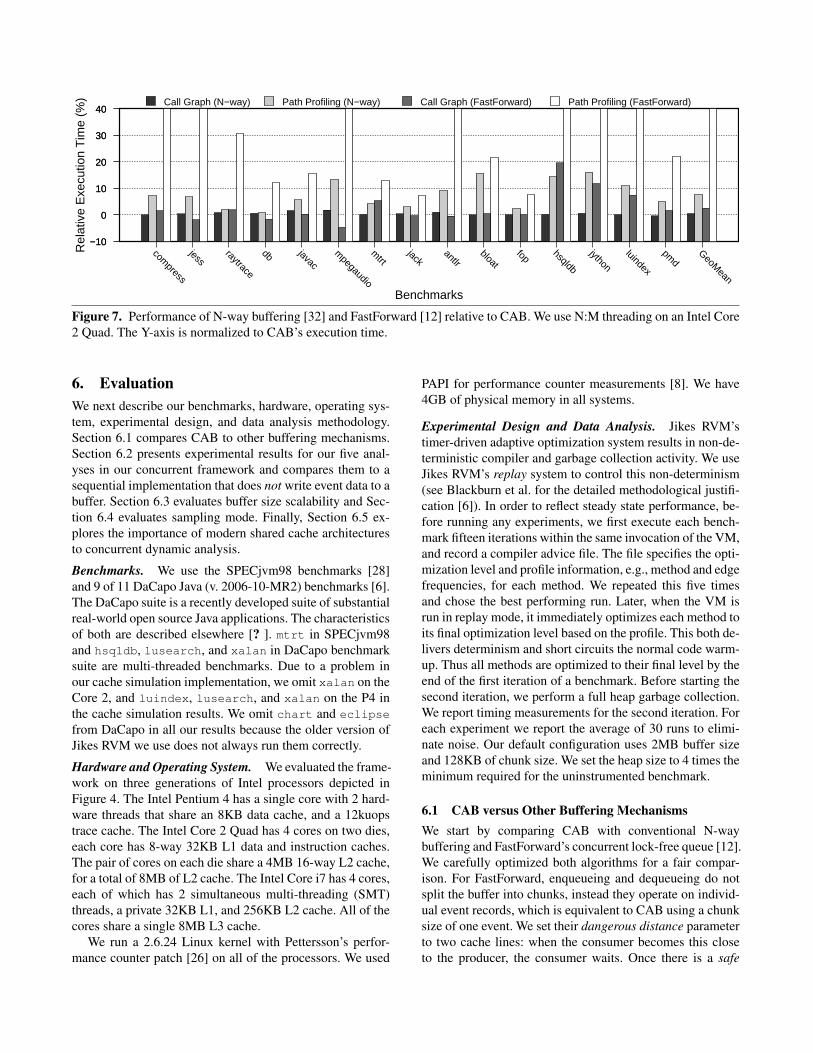
Figure 7. Performance of N-way buffering [32] and FastForward [12] relative to CAB. We use N:M threading on an Intel Core2 Quad. The Y-axis is normalized to CAB’s execution time.
6. EvaluationWe next describe our benchmarks, hardware, operating sys-tem, experimental design, and data analysis methodology.Section 6.1 compares CAB to other buffering mechanisms.Section 6.2 presents experimental results for our five anal-yses in our concurrent framework and compares them to asequential implementation that does not write event data to abuffer. Section 6.3 evaluates buffer size scalability and Sec-tion 6.4 evaluates sampling mode. Finally, Section 6.5 ex-plores the importance of modern shared cache architecturesto concurrent dynamic analysis.
Benchmarks. We use the SPECjvm98 benchmarks [28]and 9 of 11 DaCapo Java (v. 2006-10-MR2) benchmarks [6].The DaCapo suite is a recently developed suite of substantialreal-world open source Java applications. The characteristicsof both are described elsewhere [? ]. mtrt in SPECjvm98and hsqldb, lusearch, and xalan in DaCapo benchmarksuite are multi-threaded benchmarks. Due to a problem inour cache simulation implementation, we omit xalan on theCore 2, and luindex, lusearch, and xalan on the P4 inthe cache simulation results. We omit chart and eclipse
from DaCapo in all our results because the older version ofJikes RVM we use does not always run them correctly.
Hardware and Operating System. We evaluated the frame-work on three generations of Intel processors depicted inFigure 4. The Intel Pentium 4 has a single core with 2 hard-ware threads that share an 8KB data cache, and a 12kuopstrace cache. The Intel Core 2 Quad has 4 cores on two dies,each core has 8-way 32KB L1 data and instruction caches.The pair of cores on each die share a 4MB 16-way L2 cache,for a total of 8MB of L2 cache. The Intel Core i7 has 4 cores,each of which has 2 simultaneous multi-threading (SMT)threads, a private 32KB L1, and 256KB L2 cache. All of thecores share a single 8MB L3 cache.
We run a 2.6.24 Linux kernel with Pettersson’s perfor-mance counter patch [26] on all of the processors. We used
PAPI for performance counter measurements [8]. We have4GB of physical memory in all systems.
Experimental Design and Data Analysis. Jikes RVM’stimer-driven adaptive optimization system results in non-de-terministic compiler and garbage collection activity. We useJikes RVM’s replay system to control this non-determinism(see Blackburn et al. for the detailed methodological justifi-cation [6]). In order to reflect steady state performance, be-fore running any experiments, we first execute each bench-mark fifteen iterations within the same invocation of the VM,and record a compiler advice file. The file specifies the opti-mization level and profile information, e.g., method and edgefrequencies, for each method. We repeated this five timesand chose the best performing run. Later, when the VM isrun in replay mode, it immediately optimizes each method toits final optimization level based on the profile. This both de-livers determinism and short circuits the normal code warm-up. Thus all methods are optimized to their final level by theend of the first iteration of a benchmark. Before starting thesecond iteration, we perform a full heap garbage collection.We report timing measurements for the second iteration. Foreach experiment we report the average of 30 runs to elimi-nate noise. Our default configuration uses 2MB buffer sizeand 128KB of chunk size. We set the heap size to 4 times theminimum required for the uninstrumented benchmark.
6.1 CAB versus Other Buffering MechanismsWe start by comparing CAB with conventional N-waybuffering and FastForward’s concurrent lock-free queue [12].We carefully optimized both algorithms for a fair compar-ison. For FastForward, enqueueing and dequeueing do notsplit the buffer into chunks, instead they operate on individ-ual event records, which is equivalent to CAB using a chunksize of one event. We set their dangerous distance parameterto two cache lines: when the consumer becomes this closeto the producer, the consumer waits. Once there is a safe
Core−i7
Core−2
Pentium−4
0
100
instrumentation enqueue enqueue+dequeue concurrent (N:M) sequential
Core−i7
Core−2
Pentium−4
Ove
rhea
d (%
)
0
5
10
15
20
25
(a) Method Counting
Core−i7
Core−2
Pentium−4
0
5
10
15
20
25
30
(b) Call Graph Profiling
Core−i7
Core−2
Pentium−4
0
10
20
30
40
50
60
70
80
(c) Call Tree Profiling
Core−i7
Core−2
Pentium−4
0
20
40
60
80
100
120
140
(d) Path Profiling
Core−i7
Core−2
Pentium−4
0100200300400500600700800900
10001100
(e) Cache Simulation
Figure 8. Exhaustive mode overhead with performance break-down, averaged over all benchmarks (N:M threading model).
distance of six cache lines, the consumer begins processingevents again. We use the same algorithm and parameters asspecified in the FastForward paper [12].
Our implementation of N-way buffering improves in twoways over PiPA [32]. First, we removed semaphores forbuffer switching to lock-free synchronization as in CAB.Second, the buffer size is aligned to a power of two such thatthe end of each buffer is evaluated by a modulo operationand test instruction. For fair comparison with CAB, we donot pin the buffer into a fixed memory location which wouldremove a memory load, since a fixed memory location isincompatible with multi-threaded analysis. Note that a bufferin N-way buffering is essentially the same as a chunk inCAB, but they are accessed differently; CAB’s operation isasymmetric while N-way buffering is symmetric.
Figure 7 compares the performance of these bufferingmechanisms to CAB on two representative analyses: callgraph and path profiling. Call graph analysis requires farless communication compared to path profiling; the commu-nication overhead of these clients are discussed in detail inSection 6.2. The performance of N-way buffering and Fast-Forward queue is reported relative to CAB’s execution time,where higher than zero means worse than CAB. For dynamicanalyses that perform less communication, like call graphprofiling, there is no significant difference between the threebuffering designs. However, for path profiling where the datasharing cost is high, CAB outperforms FastForward by a sig-nificant margin. The FastForward queue is well designed as ageneral purpose queue, but the absence of chunks and batchprocessing causes significant overhead when used for con-current dynamic analysis. CAB performs better than heavilyoptimized N-way buffering by ∼8% on average, and up to16%. The performance improvements of CAB are most sig-nificant on benchmarks that produce events more frequently,such as jython and hsqldb.
The results show that CAB is more efficient in transfer-ring events from one thread to another than other bufferingdesigns, especially when there is significant data communi-cation between the producer and consumer. This result sug-
gests that existing dynamic analyses that use buffering canachieve a speed-up transparently by using CAB.
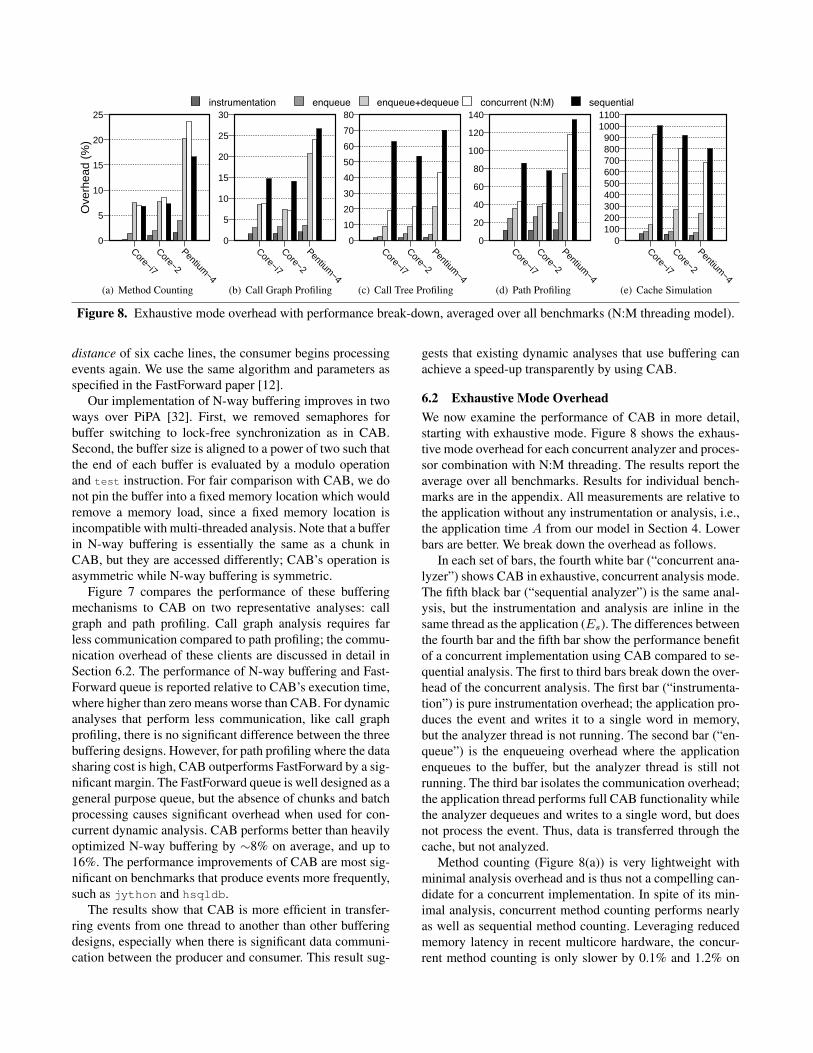
6.2 Exhaustive Mode OverheadWe now examine the performance of CAB in more detail,starting with exhaustive mode. Figure 8 shows the exhaus-tive mode overhead for each concurrent analyzer and proces-sor combination with N:M threading. The results report theaverage over all benchmarks. Results for individual bench-marks are in the appendix. All measurements are relative tothe application without any instrumentation or analysis, i.e.,the application time A from our model in Section 4. Lowerbars are better. We break down the overhead as follows.
In each set of bars, the fourth white bar (“concurrent ana-lyzer”) shows CAB in exhaustive, concurrent analysis mode.The fifth black bar (“sequential analyzer”) is the same anal-ysis, but the instrumentation and analysis are inline in thesame thread as the application (Es). The differences betweenthe fourth bar and the fifth bar show the performance benefitof a concurrent implementation using CAB compared to se-quential analysis. The first to third bars break down the over-head of the concurrent analysis. The first bar (“instrumenta-tion”) is pure instrumentation overhead; the application pro-duces the event and writes it to a single word in memory,but the analyzer thread is not running. The second bar (“en-queue”) is the enqueueing overhead where the applicationenqueues to the buffer, but the analyzer thread is still notrunning. The third bar isolates the communication overhead;the application thread performs full CAB functionality whilethe analyzer dequeues and writes to a single word, but doesnot process the event. Thus, data is transferred through thecache, but not analyzed.
Method counting (Figure 8(a)) is very lightweight withminimal analysis overhead and is thus not a compelling can-didate for a concurrent implementation. In spite of its min-imal analysis, concurrent method counting performs nearlyas well as sequential method counting. Leveraging reducedmemory latency in recent multicore hardware, the concur-rent method counting is only slower by 0.1% and 1.2% on

Core−i7
Core−2
Pentium−4
Ove
rhea
d (%
)
02468
101214161820
(a) Method Counting
Core−i7
Core−2
Pentium−4
02468
101214161820
(b) Call Graph Profiling
Core−i7
Core−2
Pentium−4
05
101520253035404550
(c) Call Tree Profiling
Core−i7
Core−2
Pentium−4
0
20
40
60
80
100
120
140
(d) Path Profiling
Core−i7
Core−2
Pentium−4
0150300450600750900
1050120013501500
(e) Cache Simulation
Figure 9. Exhaustive mode overhead, average over all benchmarks (native threading model).
the Core i7 and Core 2 respectively, while it was 7% sloweron the hyper-threaded Pentium 4.
Call graph profiling performs only slightly more analy-sis computation than method counting, yet the concurrentcall graph performs better than the sequential version. Con-current call graph profiling has approximately half the over-head of the sequential implementation in Core i7 and Core 2.For call graph profiling, and the other heavier-weight clients,concurrent execution on the P4 shows benefit, but less thanthe other architectures, because the application and analyzershare the core, and thus there is less true concurrency.
Call tree profiling has the same amount of communica-tion as call graph profiling, but performs more analysis. Thisanalysis time is still less than the application time, and thusconcurrent dynamic analysis improves further over sequen-tial. For example, concurrent call tree profiling’s overhead is60% less than sequential profiling on the Core i7.
Path profiling has more communication overhead thancall graph profiling, but the computation required for eachrecord is similar (updating a hash table). This increase re-sults in a higher relative enqueueing cost (second bar) com-pared to the other analyzers. On the P4, path profiling timeoften dominates application time, which limits performanceimprovements, as our model predicts, but concurrent analy-sis still reduces overhead by on average 17%. On the Core2 and Core i7, concurrent path profiling decreases the over-head by about half compared to sequential profiling. Theseresults show that CAB is efficiently offloading the profiledata to the other core.
The cache simulator is an extreme case of heavy-weightanalysis. The analyzer itself is an order of magnitude slowerthan the application. Thus, even if all the event data weretransferred to the other core with zero overhead, the bene-fit of the concurrent cache simulator is limited to a 100%reduction, i.e., eliminating the application execution time.However, we measured faster critical path execution becauseCAB offloads load and store data from the critical path. CABthus sometimes reduces the overhead by more than the ap-plication time. Our results show that concurrent cache sim-
ulator was faster by 73% on the Core i7, and 110% on theCore 2, and 193% on the Pentium 4.
Native threading Figure 9 presents the average concurrentanalysis overhead using our native thread implementation.These results show similar overheads compared to the N:Mthreading results discussed above. The native thread imple-mentation is relative to a better baseline; without concur-rent analysis, native threads and other enhancements im-prove performance over the Jikes RVM version with N:Mthreading by 15 to 20%. Our native thread implementationof concurrent analysis improves over the N:M thread ver-sion for method counting and call graph profiling, and is abit slower for path profiling and cache simulation. These re-sults confirm that the threading model is not central to ourresults.
Exhaustive Mode Summary Our concurrent dynamic anal-ysis framework improves performance on three generationsof hardware, from the Pentium 4 to the Core i7. All of ourresults, except for cache simulator on Core i7, show thatnewer generation multicores yield the largest improvements.This trend supports our contention that concurrent dynamicanalysis will be more important for future architectures, andthat our framework can be the basis for this and other appli-cations that require offloading work to other cores.
6.3 Buffer Size ScalabilityOne of the strengths of our concurrent dynamic analysisframework is the scalability of the buffer size in CAB. Theparticular benchmark and analysis together determine a min-imal buffer size that is sufficient to minimize the overheadthat comes from a variable event rate. If large buffers causeperformance degradations, as reported for PiPA [32], the in-creased headroom of the larger buffer will come at the costof degraded average performance.
Figure 10 presents buffer size scalability with path pro-filing and shows L1 and L2 misses, as well as the cyclesblocked on the slow-path of the CAB enqueueing operationfor hsqldb, a representative benchmark. The appendix con-

Buffer Size
16K 32K 64K 128K 256K 512K 1M 2M 4M 8M 16M
Nor
mal
ized
Ove
rhea
d
0
1
2
3
4
5
6
7Execution time L1 data cache miss L2 miss Cycles blocked in slow−path
Figure 10. Performance as buffer size varies for path pro-filing on DaCapo hsqldb (using N:M threading on an IntelCore 2 Quad).
tains results for six more DaCapo programs. This experi-ment is performed on a Core 2 Quad processor because ithas the most irregular memory latency of the three proces-sors we evaluate. Each of the metrics is normalized to themeasurement with no analyzer. Since the application neverblocks without an analyzer, we normalize cycles blocked tothe slow-path with a 16KB buffer size.
L1 misses are high for small buffers because there aremore conflict misses between the application and analyzerthreads while the application is blocked. L1 misses drop nearthe 128KB and 512KB buffer sizes, and grow again becausea larger buffer size increases the memory footprint of thebuffer. There are few L2 misses on small buffers becausethey fit into the L2 cache, and L2 misses grow as the bufferstarts to contend with the application memory.
The execution time shows that the overhead is nearly con-stant given a sufficiently large buffer size, demonstrating thatthe overhead is not correlated to L1 or L2 cache misses andthat larger buffers do not degrade performance. This resultsupports our hypothesis that the design of CAB allows thehardware prefetcher and cache subsystem to hide overheads.
6.4 Sampling Mode Accuracy vs OverheadFigure 11 reports the overhead and error rate of call graphprofiling and path profiling in sampling mode running on aCore 2 Quad. The graphs on the left show sampling overheadand the graphs on the right show accuracy.
For the overhead graphs, the y-axis shows percent over-head, while the x-axis shows the sampling rate, expressedas the percent of samples that are processed by the analyzerthread. All sampling mode data was collected using a defaultburst size of 64 bytes, which is equal to the cache line sizeon each of the processors we evaluated. A sampling rate ofzero means that no samples were processed by the analyzerthread, and thus represents the minimum overhead possible.Note that a 100% sampling rate is not the same as exhaustivemode. The analyzer does not intentionally discard any sam-ples, but since the application does not block, it is possible
for the application to overwrite samples before they reachthe analyzer.
In the accuracy graphs, the y-axis reports the error rate,which is the average error rate of each individual metric.Each individual error rate is defined as follows:
Error Rate =
∣∣∣∣∣Actual Frequency − Sampled FrequencySampling Rate
Actual Frequency
∣∣∣∣∣For example, in call graph profiling, an individual error rateis the error rate of each caller and callee pair. The errorrate on the accuracy graph is the average accuracy of allthe individual error rates. This error rate treats low to highfrequency events equally so that it is not biased.
The overall performance trend is not surprising; overheadincreases linearly as the sample rate is increased. Samplerates ranging from 5% to 20% offer a significant reductionin overhead versus the same profile collected in exhaustivemode (from Figure 8), yet still produce profiles with ex-tremely high accuracy. The average overhead reduction rela-tive to the exhaustive profile was 55% for both call graph andpath profiling at 5% sampling rate, and the error rate is lessthan 3% (97% accurate). Depending on the use of the profiledata, this sampled profile may be indistinguishable from anexhaustive mode profile.
For some benchmarks, the error rate begins increasingrapidly when the number of samples taken increases past acertain point, which is quite counter intuitive. More samplesusually results in a more accurate profile. This degradationoccurs when the analyzer thread cannot keep up with the ap-plication thread and the CAB buffer overflows. At this point,data is lost in large, non-random bursts, so the accuracy ofthe sampled profile suffers. Path profiling is more expen-sive, so increasing the sample rate leads to buffer overflowsooner than with call graph profiling. To avoid this degrada-tion, our algorithm could overflow by periodically samplingthe buffer head and tail, and scale back the sample rate ac-cordingly. We leave this functionality to future work.
6.5 Shared cache and fine-grained parallelismWe now evaluate why concurrent analysis has become fea-sible with recent multicore hardware. A concurrent dynamicanalysis is fine-grained parallelism where data sharing hap-pens frequently, thus the performance is sensitive to the la-tency and the bandwidth of inter-core communication. Toshow how much benefit comes from the low-latency com-munication, we changed the affinity of the analyzer threadand the application thread to force them onto different dieson the Intel Core 2 Quad processor. In this configuration,they are much less likely to be on cores that share a cacheat any level. In this experiment, we use one application andone profiler thread to avoid cache thrashing among appli-cation threads. Figure 12 compares the performance of thisnew configuration, called “no cache sharing”, to the originalshared L2, and single-threaded configurations. The figure re-

Sampling Rate (%)
Ove
rhea
d (%
)
0 5 10 15 20 25 30 35 40 45 50 55 60 65 70 75 80 85 90 95 100
−10
−5
0
5
10
15
20
25
30antlrbloatfophsqldbjythonluindexpmd
Call graph profiling sampling accuracy
Err
or R
ate
(%)
0 5 10 15 20 25 30 35 40 45 50 55 60 65 70 75 80 85 90 95 100
0
1
2
3
4
5
6
7
8
9
10
11
12
13
14
15antlr
bloat
fop
hsqldb
jython
luindex
pmd
(a) Call Graph profiling sampling overhead and error rate
Sampling Rate (%)
Ove
rhea
d (%
)
0 5 10 15 20 25 30 35 40 45 50 55 60 65 70 75 80 85 90 95 100
0
10
20
30
40
50
60
70
80antlrbloatfophsqldbjythonluindexpmd
Path profiling sampling accuracy
Err
or R
ate
(%)
0 5 10 15 20 25 30 35 40 45 50 55 60 65 70 75 80 85 90 95 100
0
1
2
3
4
5
6
7
8
9
10
11
12
13
14
15antlr
bloat
fop
hsqldb
jython
luindex
pmd
(b) Path profiling sampling overhead and error rate
Figure 11. Sampling overhead and error rate for call graph and path profiling (N:M threading on an Intel Core 2 Quad).
Benchmarks
compress
jessraytrace
db javacm
pegaudio
mtrt
jackantlr
bloatfop
hsqldb
jython
luindex
pmd
Geo−Mean
Ove
rhea
d
00.5
11.5
22.5
33.5
44.5
55.5
66.5
77.5
8concurrent, shared L2 concurrent, no cache sharing sequential
Figure 12. The importance of shared caches. Path profiling overhead with and without sharing between analyzer andapplication threads. Note that y-axis is the factor of overhead, and not a percentage.
ports overhead as a factor slowdown, not as percent. Sincein this configuration the threads must communicate throughmemory instead of the L2, the overhead increases from anaverage of∼ 50% to∼ 250%, confirming that in our setting,cache-aware communication is critical to good performance.
7. Future WorkWe believe that there are additional opportunities to reducespace overhead without compromising performance by au-tomatically and dynamically adapting CAB buffer sizes, aswell as the number of analysis threads. In particular, our na-
tive thread implementation keeps the CAB buffer in thread-local storage, which makes the number of buffers propor-tional to the number of threads. A more space-efficient de-signs may be possible where the number of buffers are pro-portional to the number of processors. These topics are beingleft for future work.
In addition, our current implementation binds only oneanalysis thread to each buffer. To speed up heavyweightanalyses such as cache simulation, we plan to explore paral-lelizing the analysis logic itself and using multiple analysisthreads to process a single buffer.

8. ConclusionManaged languages have succeeded in part because the runup in single processor speeds from Moore’s law more thancompensated for the cost of abstractions, such as managedruntimes and dynamic analyses. To continue to give pro-grammers current and future generations of powerful ab-stractions, we will need to construct efficient mechanismsthat more carefully minimize their costs. This paper ad-dresses the cost of dynamic analysis. We introduce a frame-work that uses CAB, a new highly-optimized cache-friendlyasymmetric buffering mechanism, that outperforms the priorstate of the art, sometimes significantly. For extremely lightweight analysis (i.e., few events and little processing) ourframework is not beneficial, but for a wide class of dy-namic analysis, we show that our framework improves per-formance. This paper takes an important step towards reduc-ing abstraction costs for dynamic analyses by utilizing other-wise idle cores in multicore systems. We believe that our op-timization lessons are broadly applicable, and can help opti-mize more generic parallel programs with heavy inter-threadcommunication.
A. Additional ResultsExhaustive Mode Overhead Figure 13 reports the per-benchmark breakdown of CAB’s exhaustive mode overheadwith N:M threading executing on the Core 2 Quad processor.Please refer to [14] for complete results on the other archi-tectures (Core i7 and Pentium 4). Figure 8 in Section 6.2summarizes this data for all architectures. Similarly, Fig-ure 14 reports the per-benchmark exhaustive mode over-heads for the native threading model. Figure 9 in Section 6.2summarizes this data.
Buffer Size Scalability Figure 15 reports performance asbuffer size increases when performing path profiling, foreach of the remaining DaCapo benchmarks. Figure 10 ofSection 6.3 presented this data for the hsqldb benchmark.
References[1] B. Alpern, D. Attanasio, J. J. Barton, M. G. Burke, P.Cheng, J.-D.
Choi, A. Cocchi, S. J. Fink, D. Grove, M. Hind, S. F. Hummel,D. Lieber, V. Litvinov, M. Mergen, T. Ngo, J. R. Russell, V. Sarkar,M. J. Serrano, J. Shepherd, S. Smith, V. C. Sreedhar, H. Srinivasan,and J. Whaley. The Jalapeno virtual machine. IBM System Journal,39(1), Feb. 2000.
[2] M. Arnold and D. Grove. Collecting and exploiting high-accuracycall graph profiles in virtual machines. In International Symposium onCode Generation and Optimization, pages 51–62, 2005.
[3] M. Arnold and B. G. Ryder. A framework for reducing the cost ofinstrumented code. In ACM Conference on Programming LanguageDesign and Implementation, pages 168–179, Snowbird, Utah, 2001.
[4] T. Ball and J. R. Larus. Efficient path profiling. In ACM/IEEEInternational Symposium on Microarchitecture, pages 46–57, Paris,France, 1996.
[5] S. M. Blackburn and K. S. McKinley. Immix: A mark-region garbagecollector with space efficiency, fast collection, and mutator locality. InACM Conference on Programming Language Design and Implemen-tation, pages 22–32, Tuscon, AZ, June 2008.
[6] S. M. Blackburn, R. Garner, C. Hoffman, A. M. Khan, K. S. McKin-ley, R. Bentzur, A. Diwan, D. Feinberg, D. Frampton, S. Z. Guyer,M. Hirzel, A. Hosking, M. Jump, H. Lee, J. E. B. Moss, A. Phansalkar,D. Stefanovic, T. VanDrunen, D. von Dincklage, and B. Wiedermann.The DaCapo benchmarks: Java benchmarking development and anal-ysis. In ACM Conference on Object–Oriented Programming, Systems,Languages, and Applications, pages 83–89, Portland, OR, Oct. 2006.
[7] M. D. Bond and K. S. McKinley. Continuous path and edge profiling.In ACM/IEEE International Symposium on Microarchitecture, pages130–140, Barcelona, Spain, 2005.
[8] S. Browne, J. Dongarra, N. Garner, K. London, and P. Mucci. A scal-able cross-platform infrastructure for application performance tuningusing hardware counters. In Supercomputing, pages 1–13, Article 42,2000.
[9] D. Bruening. Efficient, Transparent, and Comprehensive RuntimeCode Manipulation. PhD thesis, Massachusetts Institute of Technol-ogy, 2004.
[10] J. Chow, T. Garfinkel, and P. M. Chen. Decoupling dynamic programanalysis from execution in virtual environments. In USENIX AnnualTechnical Conference, Boston, MA, 2008.
[11] K. Gharachorloo and P. B. Gibbons. Detecting violations of sequentialconsistency. In ACM Symposium on Parallel Algorithms and Architec-tures, pages 316–326, Hilton Head, South Carolina, 1991.
[12] J. Giacomoni, T. Moseley, and M. Vachharajani. FastForward forefficient pipeline parallelism: a cache-optimized concurrent lock-freequeue. In ACM Symposium on Principles and Practice of ParallelProgramming, pages 43–52, Salt Lake City, UT, 2008.
[13] J. Ha, C. J. Rossbach, J. V. Davis, I. Roy, H. E. Ramadan, D. E. Porter,D. L. Chen, and E. Witchel. Improved error reporting for software thatuses black-box components. In ACM Conference on ProgrammingLanguage Design and Implementation, pages 101–111, San Diego,California, 2007.
[14] J. Ha, M. Arnold, S. M. Blackburn, and K. S. McKinley. A concur-rent dynamic analysis framework for multicore hardware. TechnicalReport TR-09-24, The University of Texas at Austin, 2009.
[15] S. Hangal and M. S. Lam. Tracking down software bugs usingautomatic anomaly detection. In International Conference on SoftwareEngineering, pages 291–301, Orlando, Florida, 2002.
[16] M. Herlihy. Wait-free synchronization. ACM Transactions on Pro-gramming Language Systems, 13(1):124–149, 1991.
[17] M. Hirzel and T. Chilimbi. Bursty tracing: A framework for low-overhead temporal profiling. In ACM Workshop on Feedback-Directedand Dynamic Optimization, pages 117–126, December 2001.
[18] M. S. Lam, M. Martin, B. Livshits, and J. Whaley. Securing webapplications with static and dynamic information flow tracking. InACM Workshop Partial Evaluation and Semantics-Based ProgramManipulation, pages 3–12, San Francisco, California, 2008.
[19] L. Lamport. Specifying concurrent program modules. ACM Transac-tions on Programming Language Systems, 5(2):190–222, 1983.
[20] W. Lin, S. K. Reinhardt, and D. Burger. Reducing DRAM latencieswith an integrated memory hierarchy design. In IEEE InternationalSymposium on High Performance Computer Architecture, pages 302–312, 2001.
[21] C.-K. Luk, R. Cohn, R. Muth, H. Patil, A. Klauser, G. Lowney, S. Wal-lace, V. J. Reddi, and K. Hazelwood. Pin: building customized pro-gram analysis tools with dynamic instrumentation. In ACM Confer-ence on Programming Language Design and Implementation, pages190–200, Chicago, IL, 2005.
[22] M. Martin, B. Livshits, and M. S. Lam. Finding application errorsand security flaws using PQL: a Program Query Language. In ACMConference on Object–Oriented Programming, Systems, Languages,and Applications, pages 365–383, San Diego, CA, 2005.
[23] T. Moseley, A. Shye, V. J. Reddi, D. Grunwald, and R. Peri. ShadowProfiling: Hiding instrumentation costs with parallelism. In Interna-tional Symposium on Code Generation and Optimization, pages 198–208, Washington, DC, 2007.

compress
jessraytrace
db javacmpegaudio
mtrtjack
antlrbloat
fop hsqldbjython
luindex
lusearch
pmdxalan
GeoMean
Ove
rhea
d (%
)
−10−5051015202530
instrumentation enqueue enqueue+dequeue concurrent (N:M) sequential
(a) Method Counting Overhead Percentage
compress
jessraytrace
db javacmpegaudio
mtrtjack
antlrbloat
fop hsqldbjython
luindex
lusearch
pmdxalan
GeoMean
Ove
rhea
d (%
)
−10−50510152025303540
instrumentation enqueue enqueue+dequeue concurrent (N:M) sequential
(b) Call Graph Profiling Overhead Percentage
compress
jessraytrace
db javacmpegaudio
mtrtjack
antlrbloat
fop hsqldbjython
luindex
lusearch
pmdxalan
GeoMean
Ove
rhea
d (%
)
−20020406080100120140160180200220
instrumentation enqueue enqueue+dequeue concurrent (N:M) sequential
(c) Call Tree Profiling Overhead Percentage
compress
jessraytrace
db javacmpegaudio
mtrtjack
antlrbloat
fop hsqldbjython
luindex
lusearch
pmdxalan
GeoMean
Ove
rhea
d (%
)
−20020406080100120140160
instrumentation enqueue enqueue+dequeue concurrent (N:M) sequential
(d) Path Profiling Overhead Percentage
compress
jessraytrace
db javacmpegaudio
mtrtjack
antlrbloat
fop hsqldbjython
luindex
lusearch
pmdGeoMean
Ove
rhea
d (%
)
0300600900
1200150018002100240027003000
instrumentation enqueue enqueue+dequeue concurrent (N:M) sequential
(e) Cache Simulation Overhead Percentage
Figure 13. Per-benchmark exhaustive mode overhead on Core 2 (N:M threading).

compress
jessraytrace
db javacm
pegaudio
mtrt
jackantlr
bloatfop
hsqldb
jython
luindex
lusearch
pmd
xalanGeoM
ean
Ove
rhea
d (%
)
−505
101520253035404550
Core i7 Core 2 Pentium 4
(a) Method Counting Overhead Percentage
compress
jessraytrace
db javacm
pegaudio
mtrt
jackantlr
bloatfop
hsqldb
jython
luindex
lusearch
pmd
xalanGeoM
ean
Ove
rhea
d (%
)
−505
101520253035404550
Core i7 Core 2 Pentium 4
(b) Call Graph Profiling Overhead Percentage
compress
jessraytrace
db javacm
pegaudio
mtrt
jackantlr
bloatfop
hsqldb
jython
luindex
lusearch
pmd
xalanGeoM
ean
Ove
rhea
d (%
)
−200
20406080
100120140160180200
Core i7 Core 2 Pentium 4
(c) Call Tree Profiling Overhead Percentage
compress
jessraytrace
db javacm
pegaudio
mtrt
jackantlr
bloatfop
hsqldb
jython
luindex
lusearch
pmd
xalanGeoM
ean
Ove
rhea
d (%
)
0306090
120150180210240270300
Core i7 Core 2 Pentium 4
(d) Path Profiling Overhead Percentage
compress
jessraytrace
db javacm
pegaudio
mtrt
jackantlr
bloatfop
hsqldb
jython
luindex
lusearch
pmd
xalanGeoM
ean
Ove
rhea
d (%
)
0400800
12001600200024002800320036004000
Core i7 Core 2 Pentium 4
(e) Cache Simulation Overhead Percentage
Figure 14. Per-benchmark exhaustive mode overhead (native threading).

Jython
Buffer Size
16K 32K 64K 128K 256K 512K 1M 2M 4M 8M 16M
Nor
mal
ized
Ove
rhea
d
0
1
2
3
4
5
6
7Execution time L1 data cache miss L2 miss Cycles blocked in slow−path
Antlr
Buffer Size
16K 32K 64K 128K 256K 512K 1M 2M 4M 8M 16M
Nor
mal
ized
Ove
rhea
d
0
1
2
3
4
5
6
7Execution time L1 data cache miss L2 miss Cycles blocked in slow−path
Bloat
Buffer Size
16K 32K 64K 128K 256K 512K 1M 2M 4M 8M 16M
Nor
mal
ized
Ove
rhea
d
0
1
2
3
4
5
6
7Execution time L1 data cache miss L2 miss Cycles blocked in slow−path
Fop
Buffer Size
16K 32K 64K 128K 256K 512K 1M 2M 4M 8M 16MN
orm
aliz
ed O
verh
ead
0
1
2
3
4
5
6
7Execution time L1 data cache miss L2 miss Cycles blocked in slow−path
Luindex
Buffer Size
16K 32K 64K 128K 256K 512K 1M 2M 4M 8M 16M
Nor
mal
ized
Ove
rhea
d
0123456789
10Execution time L1 data cache miss L2 miss Cycles blocked in slow−path
Pmd
Buffer Size
16K 32K 64K 128K 256K 512K 1M 2M 4M 8M 16M
Nor
mal
ized
Ove
rhea
d
0
1
2
3
4
5
6
7Execution time L1 data cache miss L2 miss Cycles blocked in slow−path
Figure 15. Performance as buffer size varies for each of the DaCapo benchmarks. Results are for path profiling using N:Mthreading on an Intel Core 2 Quad.
[24] N. Nethercote and J. Seward. Valgrind: a framework for heavy-weight dynamic binary instrumentation. In ACM Conference on Pro-gramming Language Design and Implementation, pages 89–100, SanDiego, California, 2007.
[25] M. Paleczny, C. Vick, and C. Click. The Java HotSpot server com-piler. In Java Virtual Machine Research and Technology Symposium,Monterey, CA, April 2001. Sun Microsystems.
[26] M. Pettersson. Linux Intel/x86 performance counters, 2003.http://user.it.uu.se/mikpe/linux/perfctr/.
[27] R. Shetty, M. Kharbutli, Y. Solihin, and M. Prvulovic. Heap-Mon: a helper-thread approach to programmable, automatic, and low-overhead memory bug detection. IBM Journal of Research and Devel-opment, 50(2/3):261–275, 2006.
[28] SPECjvm98 Documentation. Standard Performance Evaluation Cor-poration, release 1.03 edition, March 1999.
[29] S. Wallace and K. Hazelwood. SuperPin: Parallelizing dynamic in-strumentation for real-time performance. In International Symposiumon Code Generation and Optimization, pages 209–220, Washington,DC, 2007.
[30] Z. Wang, K. S. McKinley, A. Rosenberg, and C. C. Weems. Using thecompiler to improve cache replacement decisions. In International
Conference on Parallel Architectures and Compilation Techniques,pages 199–208, Charlottesville, VA, Sept. 2002.
[31] C. Yuan, N. Lao, J.-R. Wen, J. Li, Z. Zhang, Y.-M. Wang, and W.-Y.Ma. Automated known problem diagnosis with event traces. In ACMEuropean Conference on Computer Systems, pages 375–388, Leuven,Belgium, 2006.
[32] Q. Zhao, I. Cutcutache, and W.-F. Wong. PiPA: Pipelined profiling andanalysis on multi-core systems. In International Symposium on CodeGeneration and Optimization, pages 185–194, Boston, MA, 2008.
[33] P. Zhou, F. Qin, W. Liu, Y. Zhou, and J. Torrellas. iWatcher: Effi-cient Architectural Support for Software Debugging. In ACM/IEEEInternational Symposium on Computer Architecture, pages 224–235,Munchen, Germany, June 2004.