a concept for assuring the quality of seafoods to consumers
TRANSCRIPT

MFR PAPER 1276 Table I.-The approximate shelf life ofcod fillets (Ronalvalll et aI., 1973).
A Concept for Assuring the Quality ofSeafoods to Consumers
Temperalure
OF 0C
32 034 1.1137 2.7839 3.8941 5.0044 6.6749 9.4456 13.30
Approximateshelf file (days)
1411876543
L. J. RONSIVALLI, C. GORGA, J. D. KAYLOR, and J. H. CARVER
ABSTRACT - For more than a decade numerous surveys of the quality ofseafoods at retail counters have resulted in consistent adverse reports, and it hasbeen concluded that the unreliability of the quality of seafoods is the major reasonwhy their per capita consumption is so much lower than it is for beef, pork, orpoultry. A concept for insuring the Grade A quality of seafoods was developed andtested in an attempt to demonstrate that the consumption of fresh fish will increasewhen their quality and image are improved. This paper describes the concept, itsimplementation under federal coordination, and its successful implementation byindustry which has grown from a pilot operation involving five retail stores andabout 200 pounds (91 kg) of fillets per week to over 200 stores and over 15,000pounds (6,803 kg) of fillets per week - and still growing.
INTRODUCTION
For more than a decade Consumer'sUnion has published articles condemning the quality of fishery productsavailable to the American consumer.The following quote (Anonymous,1965) is a representative sample of thatliterature.
"One likely reason for this country'slow consumption of seafood-whichwas held at an average of 10 or IIpounds a year per person for more than ageneration-is that most people seldomget to taste the sweet, delicate flavor offresh-caught fish. It's probable that thisplentiful food, rich in protein, vitamins,and minerals and relatively inexpensive,goes a-begging because, by the time itreaches the dinner table, it has usuallyattained an age and condition warrantingits religious connotation as a penancefood. "
Articles by other consumer groupshave been even more damaging to theimage of fish as food. Some of themhave condemned the processors, because by their brand name they were theonly identifiable elements in the distribution chain. The National MarineFisheries Service (NMFS), previouslythe Bureau of Commercial Fisheries,was also implicated, because the U.S.inspection sticker was on some of thepoor quality samples (Anonymous,1961). (But in most cases, and certainly
January /978
in the cases involving the inspectionsticker, the products were of soundquality when they left the plant.)
The per capita (per year) consumption of fish in the United States is about12 pounds (5.4 kg), while that of beef isabout 120 pounds (about 54 kg), that ofpork is about 60 pounds (about 27 kg),and that of poultry is about 50 pounds(about 23 kg). It is ironical that theprotein source which is considered to bethe most desirable from a health pointof view should be consumed in thesmallest quantity. However, per capitaconsumption of fish is not uniformthroughout the country; and some dataindicate that it is much higher in coastalareas (about twice the average) wherefish of high quality is readily accessible. It is much lower in inland areaswhere the quality of fish available toconsumers is relatively poor. It hasbeen observed that when a consumerdoes not like a cereal he has purchased,he simply buys that of another brand,but when a consumer is dissatisfiedwith a fish purchase, he stops buyingfish.
From earlier work, it was determinedthat the shelf life of a few seafoods held
The authors are with the NortheastFisheries Center, Gloucester Laboratory, National Marine FisheriesService, NOAA, Emerson Avenue,Gloucester, MA 01930.
at 31°_33°F (-0.56°-0.56°C) is about2 weeks from the time they are harvested. (The shelf life of a product, inthis case, ends when it becomes unacceptable as a food; that is, the total timeit takes for the product to change fromGrade A to Grade B to Grade C and thento the point just before it becomes unacceptable.)' It has been established thatthe shelf life of fresh seafoods is affected mainly by the temperature atwhich they are held (Table 1). Forexample, if handling conditions are notstrict and the temperature of fish filletsis allowed to rise from 32 OF (O°C) to49°F (9.4°C), the product shelf lifewill be reduced from 14 days to 4 days.This gives too little time for distribution, and by the time it is sold, it maywell be less than Grade A in quality.Thus, the importance of temperature inthe control of quality is evident. Thisrequirement has been emphasized ashas been that of packaging (Ronsivalliand Charm, 1975; Ronsivalli and Licciardello, 1976; and Slavin, 1961).While the quality of a seafood degradesrelatively rapidly and must inevitablyreach a stage of rejection as food, therate of spoilage .can be slowed by temperature control and protective packaging, and its quality can be measured toinsure that product of poor quality is not
'u .5. Grade A means the highest possible qualitywith no evidence of spoilage, and having all therequired product characteristics of size, shape.color, freedom from defects, etc. U.S. Grade Bmeans that the product is of good commercialquality. It may not be as desirable in appearance,size, etc., but its eating quality (odor, flavor, etc.)is quite acceptable with only slight evidence ofloss of the desirable eating quality. Grade Cmeans fairly good quality. The product is wholesome and nutritious but may be substantially lacking in desired appearance. It may show evidenceof sl ight to moderate changes. especially in flavorand odor. but still is free of offensive odors andflavors. Once the product shows evidence of badodors which are usually. though not always, associated with objectionable taste. it is consideredto be unacceptable. and its shelf life has ended. Itshould be emphasized that only U.S. Grade Aproducts were used in this experiment. and onlyU.S. Grade A products are used under this concept.
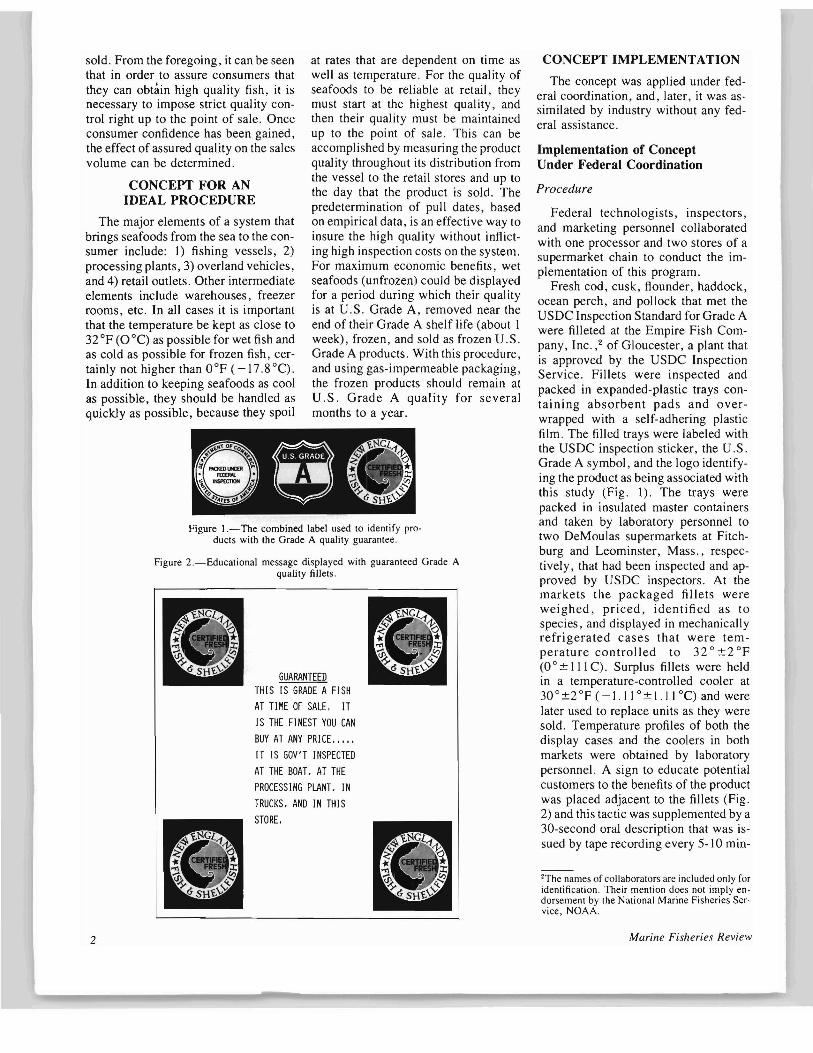
Figure I.-The combined label used to identify products with Ihe Grade A quality guarantee.
Figure 2.-Educational message displayed with guaranteed Grade Aquality fillets.
•·II··e·SGRADE~'~.. ':.. ". . \~. . .
CONCEPT IMPLEMENTATION
The concept was applied under federal coordination, and, later, it was assimilated by industry without any federal assistance.
Implementation of ConceptUnder Federal Coordination
2The names of collaborators are included only foridentification. Their mention does not imply endorsement by the National Marine Fisheries Service, NOAA.
Procedure
Federal technologists, inspectors,and marketing personnel collaboratedwith one processor and two stores of asupermarket chain to conduct the implementation of this program.
Fresh cod, cusk, ftounder, haddock,ocean perch, and pollock that met theUSDC Inspection Standard for Grade Awere filleted at the Empire Fish Company, Inc.,2 of Gloucester, a plant thatis approved by the USDC InspectionService. Fillets were inspected andpacked in expanded-plastic trays containing absorbent pads and overwrapped with a sel f-adhering plasticfilm. The filled trays were labeled withthe USDC inspection sticker, the U.S.Grade A symbol, and the logo identifying the product as being associated withthis study (Fig. I). The trays werepacked in insulated master containersand taken by laboratory personnel totwo DeMoulas supermarkets at Fitchburg and Leominster, Mass., respectively, that had been inspected and approved by USDC inspectors. At themarkets the packaged fillets wereweighed, priced. identified as tospecies, and displayed in mechanicallyrefrigerated cases that were temperature controlled to 32°±2°F(OO±IIIC). Surplus fillets were heldin a temperature-controlled cooler at30 °±2 OF ( -1.1 1° ± 1.11 0C) and werelater used to replace units as they weresold. Temperature profiles of both thedisplay cases and the coolers in bothmarkets were obtained by laboratorypersonnel. A sign to educate potentialcustomers to the benefits of the productwas placed adjacent to the fillets (Fig.2) and this tactic was supplemented by a30-second oral description that was issued by tape recording every 5-10 min-
at rates that are dependent on time aswell as temperature. For the quality ofseafoods to be reliable at retail, theymust start at the highest quality, andthen their quality must be maintainedup to the point of sale. This can beaccomplished by measuring the productquality throughout its distribution fromthe vessel to the retail stores and up tothe day that the product is sold. Thepredetermination of pull dates, basedon empirical data, is an effective way toinsure the high qual ity without inft icting high inspection costs on the system.For maximum economic benefits, wetseafoods (unfrozen) could be displayedfor a period during which their qualityis at U.S. Grade A, removed near theend of their Grade A shelf life (about Iweek), frozen, and sold as frozen U.S.Grade A products. With this procedure,and using gas-impermeable packaging,the frozen products should remain atU.S. Grade A quality for severalmonths to a year.
@)...>.. ~.......1~-f:.
GUARANTEEDTH[S [S GRADE AFISHAT TIME OF SALE, ITIS THE FINEST YOU CANBUY AT ANY PRICE., ...IT IS GOV'T INSPECTEDAT THE BOAT. AT THEPROCESSING PLANT, INTRUCKS, AND IN THISSTORE.
CONCEPT FOR ANIDEAL PROCEDURE
The major elements of a system thatbrings seafoods from the sea to the consumer include: 1) fishing vessels, 2)processing plants, 3) overland vehicles,and 4) retail outlets. Other intermediateelements include warehouses, freezerrooms, etc. In all cases it is importantthat the temperature be kept as close to32 OF (O°C) as possible for wet fish andas cold as possible for frozen fish, certainly not higher than OaF (-17.8 0C).In addition to keeping seafoods as coolas possible, they should be handled asquickly as possible, because they spoil
sold. From the foregoing, it can be seenthat in order to assure consumers thatthey can obtain high quality fish, it isnecessary to impose strict quality control right up to the point of sale. Onceconsumer confidence has been gained,the effect of assured quality on the salesvolume can be determined.
2 Marine Fisheries Review

1200
1100
900
1000
10(18-22)76 820 0 820(25-29) 680 58 622
11(1-5) 560 0 560(8-12) 400 422 1-22(15-19) 440 315 125(22-26) 320 46 274
11/29-12/3 780 89 69112(6-10) 1,150 0 1.150
(13-17) 550 84 466(20-24) 320 64 256(27-31) 0 126 '-126
1(3-7)77 0 0 0(10-14) 460 0 460(17-21) 430 38 392(24-28) 1,050 0 1,050
1/31-2/4 400 0 4002(7-11) 360 89 271(14-18) 510 132 378(21-25) 510 172 338
2/28-3/4 460 106 3543(7-11) 0 82 '-82
10,200 1,823 8,377
Week Delivery Returns Sales
Table 2.-Schedule of deliveries and returns ofGrade A fillets ofalx epeelea of flah to two retailstores (in pounds).
'The negative values included units from prior deliveries thai were not picked up earlier.
kg) to °pounds per week. An apparentanomaly in the figure is the high rate ofreturns on the fourth and fifth weeks,but this is explained by the fact that thereturns were from prior deliveries (e.g.,the first and second weeks), and werenot picked up earlier. Although one candetect much less than a trend, returnswere proportionately higher at the beginning than at the middle or the end ofthe experiment; the largest deliverieswere not followed by large returnssee Figure 3 and Table 2. Indeed, large
III II II II II I I
I I II
I II I I , I I
I I I I II I I I I I
, I II I I
II III I I I I
I ,
200
1 2 3 4 5 6 7 8 9 10 II 12 13 14 15 16 17 18 19 20 21TIME (Wks)
Figure 3.-Deliveries (solid lines) and returns (broken lines) of fish fillets.
800
100
o
300
700...0
;;; 600I-
~ 500o~
4400
the end of the experiment, it was reported that some consumers activelyrequested the U.S. inspected New England brand fish. They did not wantregular, store-brand fish, and this wasthe first evidence that the buying judgment of the consumer was influencedby assured quality. As far as processorsare concerned, the Empire Fish Company, which has remained with usthroughout the experiment, has beenand still is highly interested in the program. Other processors are now alsodemonstrating an interest in participating. Managers of the fish counters wereunanimous in their praise for the program. They were pleased with the customer satisfaction and appearance andquality of the product. The prepackaging aspect was also highly desirable tothem.
While considerable pertinent information was gained, it is not possible toquantify the effect of guaranteed quality on the sales volume because deliveries were unable to keep up with thedemand. Nor was it possible to makeany determination concerning the potentiaJ demand. As can be seen fromFigure 3, there were no excesses insome cases. The amount of fillets thatwas returned (returns) varied greatlyand erratically, ranging from amaximum of 422 pounds (about 191
As a result of this work, it is indicated that the concept of quaJity controlcan receive wide acceptance by theconsumer, the processor, and the seller.While it is generally conceded thatthere is a relatively high rate of rejection of fish purchases among consumers, the most important demonstrationof consumer satisfaction in this particular case was the complete absence ofconsumer complaints on the quality ofthe product during the entire 20-weekperiod of the experiment which involved the sale of nearly 10,000 pounds(4,535 kg) of fillets of cod, cusk, flounder, haddock, ocean perch, and pollock. Consumers grew to accept theconcept of quality control, even if itmeant paying a higher price for productof guaranteed quality over productswithout guaranteed quality. At times,prices reached $1.00 per pound (0.45kg) more than fillets of other brands. By
utes. An NMFS marketing specialistcarried out the educational strategywhich also included assistance to thestore manager with recipe ideas, etc.Starting with the second or third day,the fillets were inspected daily by aUSDC inspector; and when the qualityof the fillets fell below U.S. Grade A,all of the remaining ones were withdrawn from sale and replaced with freshfillets when they were available. Thereturned fillets were put in a freezer atthe store and transferred frozen to thelaboratory and held for observation todetermine the commercial feasibility ofconverting fresh fillets to frozen filletsin their original package. Deliverieswere to be made twice each week inaccordance with direct requests by thechain's seafood buyer to the processor.This information was also relayed tolaboratory personnel who contacted inspectors to provide them with thenecessary information to set the inspection schedule. As the experiment progressed, and the Grade A shelf life ofthe product could be approximated, thefrequency of inspection was reduced tothe last few days of the expected duration of the shelf life. Laboratory personnel coordinated the entire projectand checked the functions of the various elements to insure adherence to theexperimental design.
Results and Discussion
January 1978 3

MFR Paper 1276. From Marine Fisheries Review, Vol. 40, No. I, January 1978.Copies of this paper, in limited numbers, are available from 0822. User Services Branch, Environmental Science Information Center, NOAA, Rockville,MO 20852. Copies of Marine Fisheries Review are available from the Superintendent of Documents, U.S. Government Printing Office. Washington, DC20402 for $1.10 each.
deliveries were associated with consistently low returns. Jn general, returnswere associated with the level of storeprices. When prices stood at their lowest (e.g., during special sales), returnswere negligible or nil. This was trueespecially for cod, cusk, and haddock.For ocean perch and pollock this relationship was not evident in the beginning, but it became evident toward themiddle of the experiment. For flounder,the case is more difficult to determine.The lowest price occurred at the end ofthe phase and it had only one incidence.The relationship between high pricesand high returns also appears to exist,but it could not be clearly determinedfrom available data. A more completeunderstanding of these relationshipswould also require comparative data formeat and poultry. Besides, the sale offish is clearly a function not only ofprice but also of quantity. Given theexistence of a wide socioeconomicspectrum of customers, one can sell alow amount of fish at almost any price,but to sell a large quantity is anothermatter.
The introduction of underutilizedspecies was expected to be facilitated ifconsumer confidence in the New England brand fish could be gained. Thedata collected in this experimentshowed that this expectation is premature. There was three times as muchhaddock sold as there was cod, eventhough educational information wasprovided on the eating and nutritionalsimilarities of cod to haddock, and eventhough cod generally sells for less thanhaddock. Cusk, which was cheaperthan the more familiar species, hardlymoved by comparison with the others(less than 2 percent of the total sales),and much of the cusk (about43 percent)had to be returned. It appears that consumers purchased on the basis ofspecies. Thus, we should not expectthat underutilized species will sell asreadily as conventional ones until consumer confidence in a brand starts toinfluence their buying judgment. Quality differences among displayed products might then become more important than species differences.
In order to capitalize on the strategyof freezing the product just before theend of its Grade A shelf life, it wasnecessary to know whether the product
could simply be frozen in its originalpackage (designed for maximum protection of the product whether frozen orunfrozen), or whether a repackagingstep in the process-a costly step-wasrequired. This aspect was studied in alimited way and the results obtainedthus far show that freezing in the original package is a definite possibility.Both the tray and the packaging material retained their physical and aestheticproperties. The price label appearedshopworn, but it normally would becovered or replaced with a new pricelabel. The inspection seal and Grade Alabel held up very well. There wassome frost formed on the inner surfaceof the plastic overwrap, but it did notdetract from the product which retainedits original appearance. On thawing,the frost disappeared, and both thepackage and its contents had the sameoutstanding appearance and qual ity thathave characterized this productthroughout.
Implementation of Conceptby Industry (Independentlyfrom Government)
A few months after this federallycoordinated experiment was initiated,the Empire Fish Company and the FirstNational Stores supermarket chain entered into an agreement (independentlyfrom government) to conduct a pilotoperation involving five randomlyselected stores and 200 pounds (about91 kg) of fish fillets per week. Exceptfor laboratory participation, the procedure used was the same as describedabove, and this independent effortadopted most of the quality controltechniques embodied in the concept developed by the federal effort. From thatexploratory step, the enterprise grew,and at last report, the Empire FishCompany was supplying about 200First National supermarkets a total ofabout 15,000 pounds of fillets perweek-and both the number of storesand the volume of product were stillgrowing.
If the concept becomes assimilated
by industry on a large scale, a numberof long range benefits are possible andultimately accruable to the consumer.Among these, the markets for highquality seafoods should expand to inland areas where a demand for thesecommodities already exists to a degree;a tendency to update and improveplants, vessels, and equipment wouldbe generated; and higher levels of investment would be encouraged, especially with the new opportunities possible under this country's extendedfisheries jurisdiction to 200 miles (124km) and the relatively recent emphasison the dietary benefits of fish.
ACKNOWLEDGMENTS
The authors acknowledge the cooperation and valuable assistance of theEmpire Fish Company, Inc., the A&PSupermarket Chain, the DeMoulasSupermarket Chain, Joseph Mendelsohn and J. Perry Lane of the Gloucester Laboratory, Henry McAvoy, Marketing Specialist of the National MarineFisheries Service Northeast Region,and numerous personnel from theNortheast Region's USDC InspectionService.
The authors also acknowledge thefinancial support of the New EnglandFisheries Steering Committee's TaskForce on Fishing Development and themoral support of Jake Dykstra, amember of that committee.
Finally, the authors acknowledge thestrong encouragement and the supportof the late Sam Favazza, ExecutiveSecretary of the Gloucester FisheriesCommission.
LITERATURE CITEDAnonymous. 1961. Frozen fried fish sticks. Consum.
Rep. 26:80-83.____ 1965. Frozen breaded fish ponions. Con
sum. Rep. 30:235-237.Ronsivalli, L. 1., and S. E. Chann. 1975. Spoilage and
shelf life prediction of refrigerated fish. Mar. Fish.Rev. 37(4):32-34.
___, R. J. Learson, and S. E. Chann. 1973.Slide rule for predicting shelf life of cod. Mar. FishRev. 35(7):34-36.
___, and 1. 1. Licciardello. 1976. Factors affeeting the shelf life of fish. Act. Rep. 27(2):34-42.
Slavin, 1. W. 1961. Packaging refrigerated seafood.Seafood Merch. 21(2): 13-15, 48-49.
4 Marine Fisheries Review