a comparison of tower to rooftop monitoring and resulting estimated performance andrew kurtz –...
TRANSCRIPT

A Comparison of Tower to Rooftop Monitoring and Resulting
Estimated Performance
Andrew Kurtz – APRS World, LLC
Why Collect Data?• To determine a site’s wind resource
• To determine the economic feasibility of installing a wind turbine
• A Poorly Sited Turbine:– Results in an unhappy customer– Is bad business– Hurts the industry

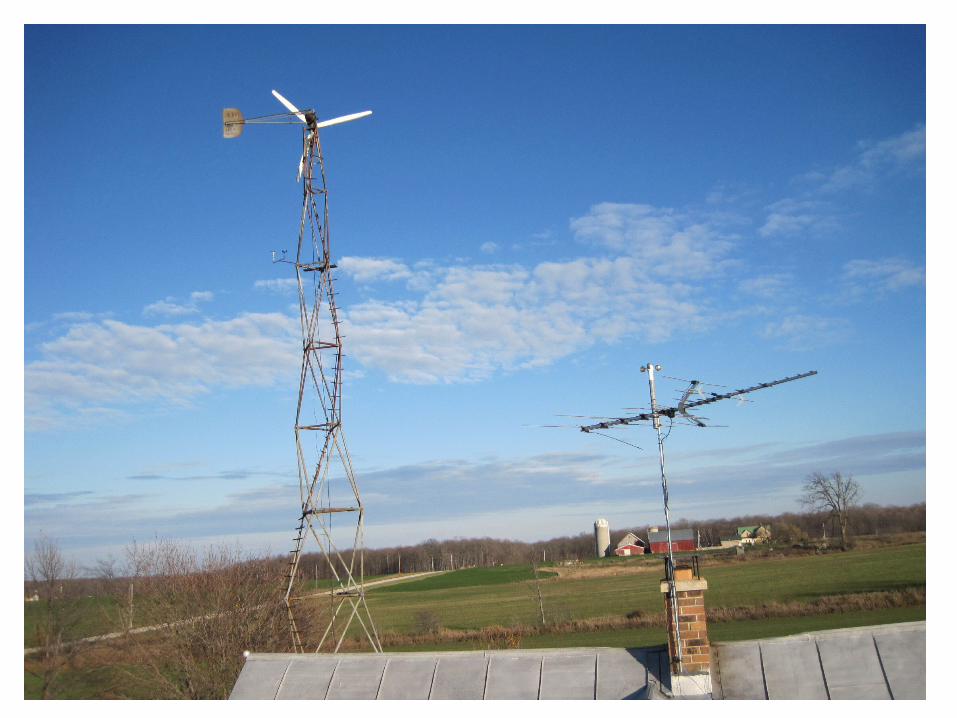
Mick’s Site

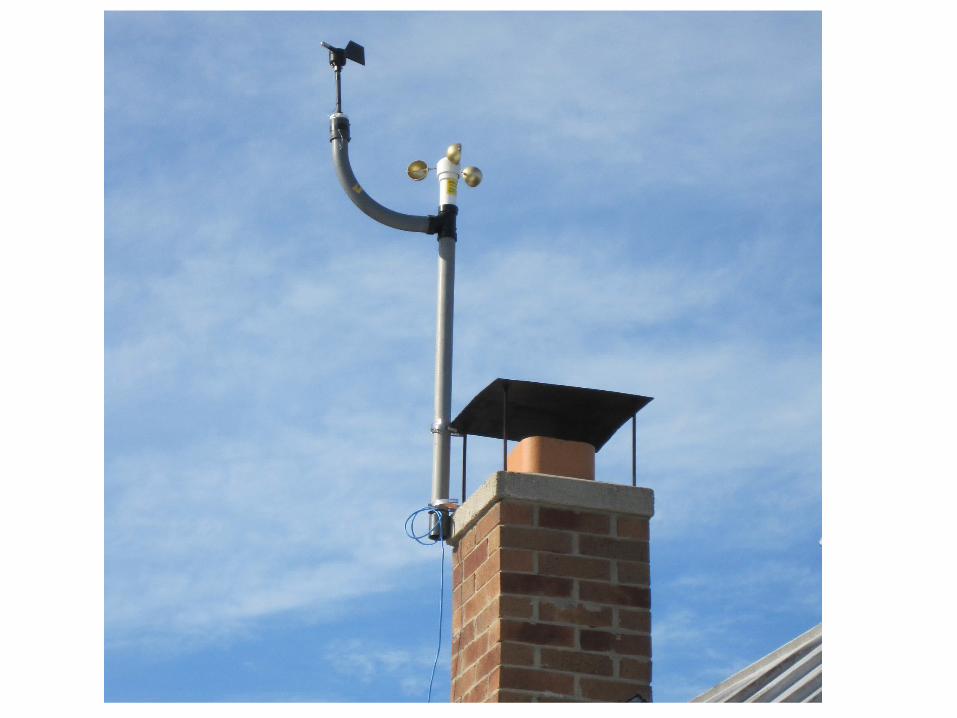
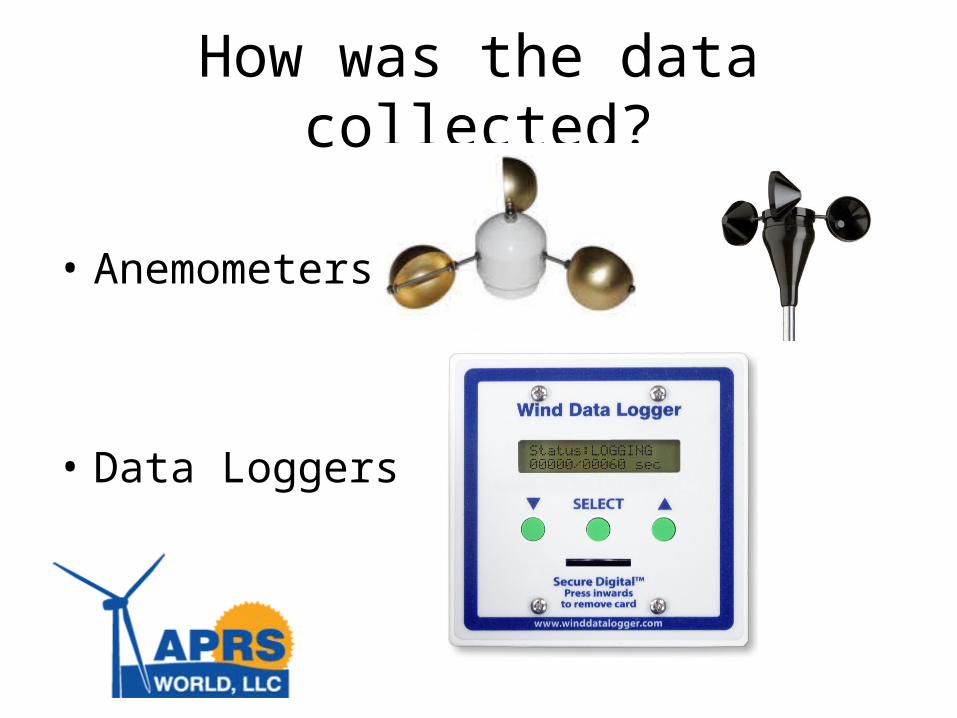
How was the data collected?
• Anemometers
• Data Loggers

Notes about the data• Recorded to memory card
• 1 CSV (spreadsheet) file per day
• Tilt-up Tower – Since Nov. 2007
• Rooftop – Since Dec 2009
• Result: over 3,200 files
• More than 4.6 million rows of data…
• That’s a lot of data!
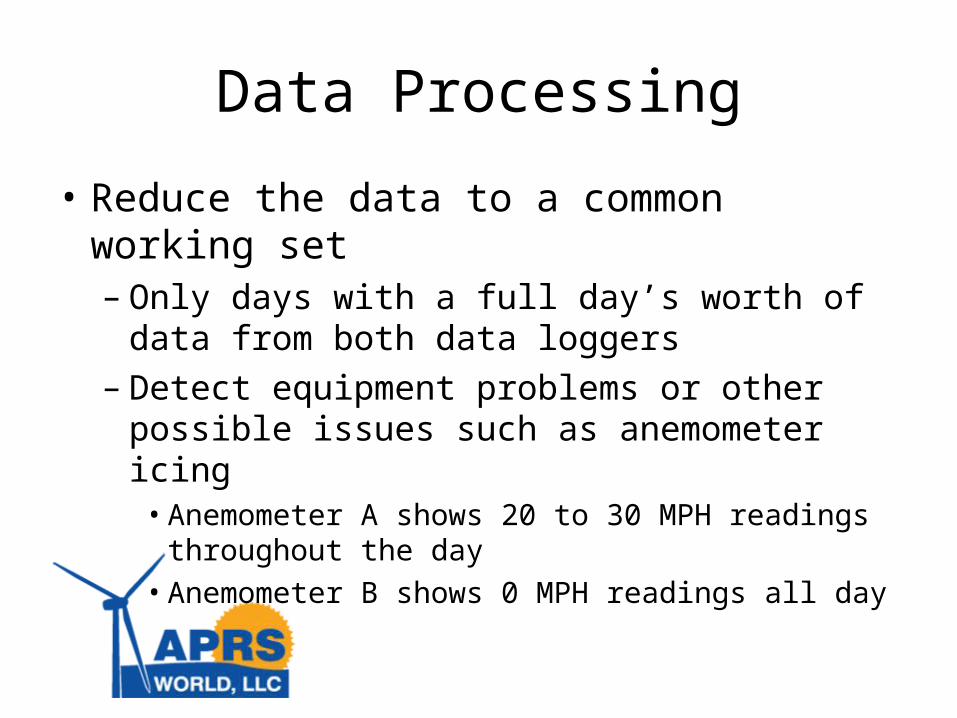
Data Processing
• Reduce the data to a common working set– Only days with a full day’s worth of data from
both data loggers– Detect equipment problems or other possible
issues such as anemometer icing• Anemometer A shows 20 to 30 MPH readings
throughout the day• Anemometer B shows 0 MPH readings all day

Working with databases
• Easier to work with large quantities of data
• Example, average wind speed: mysql> SELECT ROUND(AVG(wsTower74),1)
FROM towerData;
Result: 10.7 (MPH)
• Possible to do more complex operations such as frequency distributions
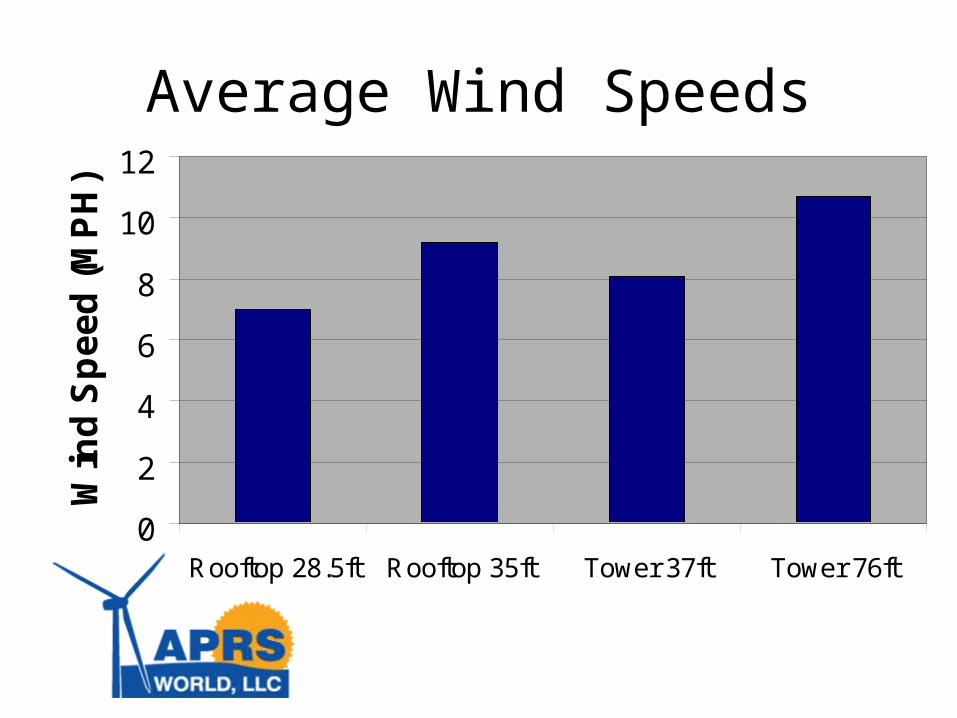
0
2
4
6
8
10
12
Rooftop 28.5ft Rooftop 35ft Tower 37ft Tower 76ft
Win
d S
pe
ed
(M
PH
)Average Wind Speeds

Wind Speed Frequency Distribution
0
2
4
6
8
10
12
14
1 5 9 13 17 21 25 29
Speed (MPH)
Per
cen
tag
e
Rooftop 28.5 ft Rooftop 35 ft Tower 37 ft Tower 76 ft

Ratio of Available Energy
0
0.5
1
1.5
2
2.5
3
Rooftop 28.5ft Rooftop 35ft Tower 37ft Tower 76ft

Estimated Annual Energy ProductionTurbine A – 1.1m rotor diameter
0
50
100
150
200
250
Roof 28.5ft Roof 35ft Tower 37ft Tower 76ft
En
erg
y (k
Wh
)
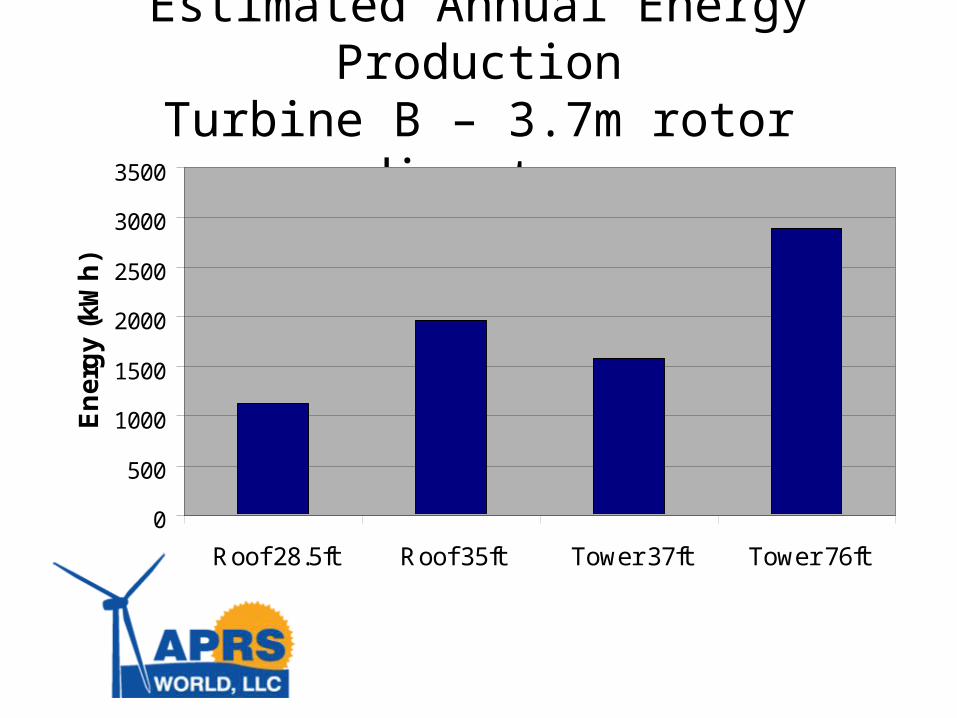
Estimated Annual Energy ProductionTurbine B – 3.7m rotor diameter
0
500
1000
1500
2000
2500
3000
3500
Roof 28.5ft Roof 35ft Tower 37ft Tower 76ft
En
erg
y (k
Wh
)
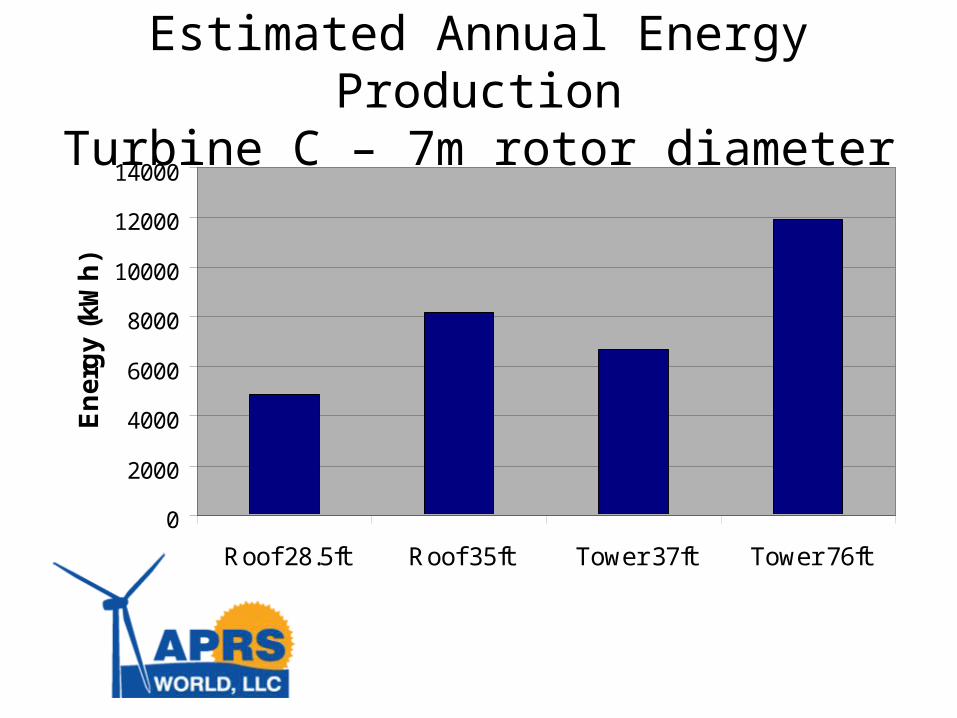
Estimated Annual Energy ProductionTurbine C – 7m rotor diameter
0
2000
4000
6000
8000
10000
12000
14000
Roof 28.5ft Roof 35ft Tower 37ft Tower 76ft
En
erg
y (k
Wh
)
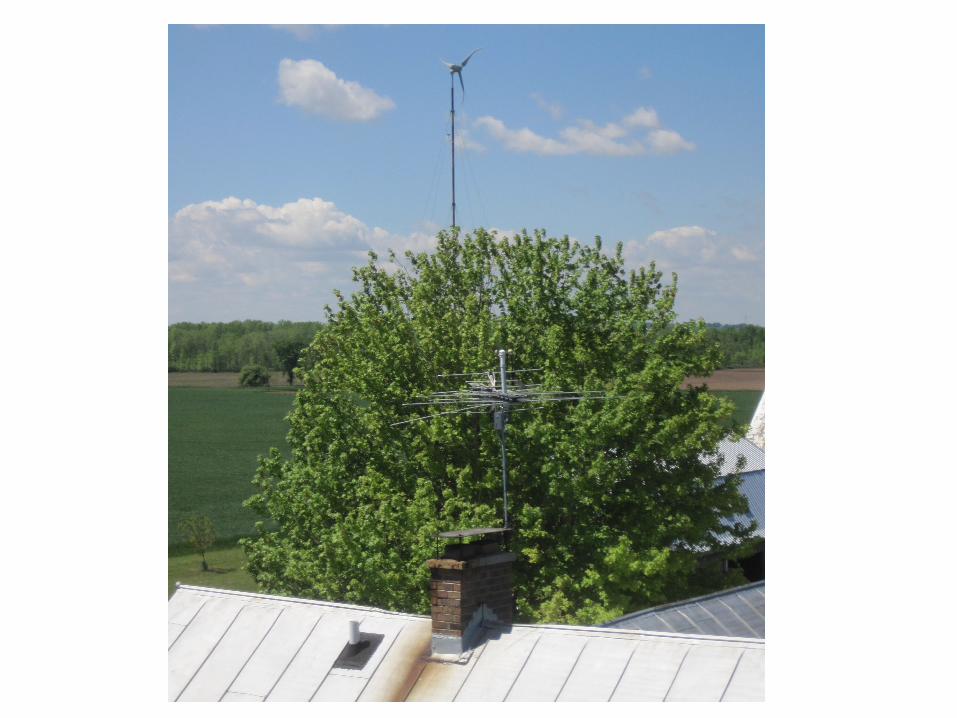
Conclusions• Different locations on the same property
show significantly different wind resource
• You don’t truly know the wind resource for a particular location without collecting data
• The results speak for themselves: Proper siting on a sufficiently tall tower is critical to wind turbine performance
e-mail: [email protected]: www.aprsworld.com