a comparison of canadian and u.s. productivity levels: an
TRANSCRIPT

A Comparison of Canadian and U.S.Productivity Levels: An Explorationof Measurement Issuesby John R. Baldwin, Jean-Pierre Maynard, Marc Tanguay,
Micro-economic Analysis Division18-F, R.H. Coats Building, Ottawa, K1A 0T6
Telephone: 1 800 263-1136
This paper represents the views of the authors and does not necessarily reflect the opinions of Statistics Canada.
Catalogue no. 11F0027MIE — No. 028
ISSN: 1703-0404
ISBN: 0-662-39120-9
Research Paper
Economic Analysis (EA) Research Paper Series
Fanny Wong and Beiling Yan
A Comparison of Canadian and U.S. Productivity Levels: An Exploration of Measurement Issues
by
John R. Baldwin, Jean-Pierre Maynard, Marc Tanguay, Fanny Wong and Beiling Yan
11F0027MIE No. 028 ISSN: 1703-0404
ISBN: 0-662-39120-9
Micro-economic Analysis Division
18-F, R.H. Coats Building Statistics Canada
Ottawa, ON K1A 0T6
How to obtain more information : National inquiries line: 1 800 263-1136 E-Mail inquiries: [email protected]
January 2005
The authors' names are listed alphabetically. This paper represents the views of the authors and does not necessarily reflect the opinions of Statistics Canada. The authors gratefully acknowledge comments from many people at Statistics Canada, Finance Canada, the Bureau of Labor Statistics and from the Vancouver Productivity Conference in June 2004 organised by Erwin Diewert and Alice Nakamura.
Published by authority of the Minister responsible for Statistics Canada
© Minister of Industry, 2005
All rights reserved. No part of this publication may be reproduced, stored in a retrieval system or transmitted in any form or by any means, electronic, mechanical, photocopying, recording or otherwise without prior written permission from Licence Services, Marketing Division, Statistics Canada, Ottawa, Ontario, Canada K1A 0T6.
Aussi disponible en français

Economic Analysis Research Paper Series - 3 - Statistics Canada - Catalogue No. 11F0027 No. 028
Table of Contents Abstract .................................................................................................................................................................... 4
Executive summary.............................................................................................................................................. 5
1. Introduction ...................................................................................................................................................... 7
2. Methodological issues.................................................................................................................................. 10
3. Data issues........................................................................................................................................................ 12
3.1 Output .............................................................................................................................................................. 12 3.1.1 Valuation of output................................................................................................................................... 13 3.1.2 The valuation of financial intermediation services .................................................................................. 15 3.1.3 The statistical discrepancy ....................................................................................................................... 16 3.1.4 Defining the business sector..................................................................................................................... 17
3.2 Relative prices.................................................................................................................................................. 17 3.2.1 Pricing imports and exports ..................................................................................................................... 22
3.3 Labour input..................................................................................................................................................... 26 3.3.1 Measures of labour input ......................................................................................................................... 26 3.3.2 Survey instruments ................................................................................................................................... 28 3.3.3 The U.S. methodology for calculating total annual hours worked ........................................................... 32 3.3.4 The Canadian methodology for calculating total annual hours worked ................................................. 35 3.3.5 Canada/U.S. labour comparisons ............................................................................................................ 36
3.4 Labour productivity levels in Canada and the United States .......................................................................... 39
4. Conclusion......................................................................................................................................................... 41
Appendix A: PPPs for Canada/U.S. comparison ................................................................................... 44
Appendix B: Estimates of labour inputs using comparable methodology................................... 45
Appendix C: Results when all health and education are placed in non-business ..................... 47
References .............................................................................................................................................................. 48

Economic Analysis Research Paper Series - 4 - Statistics Canada - Catalogue No. 11F0027 No. 028
Abstract This paper examines the level of labour productivity in Canada relative to that of the United States in 1999. In doing so, it addresses two main issues. The first is the comparability of the measures of GDP and labour inputs that the statistical agency in each country produces. Second, it investigates how a price index can be constructed to reconcile estimates of Canadian and U.S. GDP per hour worked that are calculated in Canadian and U.S. dollars respectively. After doing so, and taking into account alternative assumptions about Canada/U.S. prices, the paper provides point estimates of Canada’s relative labour productivity of the total economy in 1999 of around 94% that of the United States. The paper points out that at least a 10 percentage point confidence interval should be applied to these estimates. The size of the range is particularly sensitive to assumptions that are made about import and export prices.

Economic Analysis Research Paper Series - 5 - Statistics Canada - Catalogue No. 11F0027 No. 028
Executive summary This paper examines the level of labour productivity in Canada relative to that of the United States in 1999. In doing so, it addresses two main issues. The first is the comparability of the measures of GDP and labour inputs that the statistical agency of each country produces. Second, it investigates how a price index can be constructed to reconcile estimates of Canadian and U.S. GDP per hour worked that are calculated in Canadian and U.S. dollars respectively. In the first part of the paper, we approach this task by harmonizing output and labour input measures between the two countries. Harmonizing output measures required few modifications. Harmonizing the measures of labour input required slightly larger modifications. Labour input is defined as total hours worked and is obtained by estimating total number of jobs and multiplying it by hours worked per job. The number of jobs is taken from the official estimates of both countries. But the official hours worked per job in the U.S. is obtained from a source and a methodology that is quite different than in Canada. For the purpose of comparing productivity levels between Canada and the United States, we construct an estimate of U.S. hours worked per job using a U.S. survey that is comparable to the one used in Canada—a household survey. In deriving this estimate, we also adopt a similar methodology to that used in Canada to estimate average hours worked. The effect of this change increased the U.S. estimates of labour inputs relative to Canada compared to official estimates of hours worked for the United States. Constructing a price index that can be applied to the two separate estimates of productivity (one in Canadian dollars and one in U.S. dollars) is more difficult than the reconciliation of the estimates of GDP and labour. A price index is required to transform Canadian GDP per hour worked calculated in Canadian dollars and U.S. GDP per hour worked calculated in U.S. dollars to a common price structure. Purchasing power price (PPP) indices are used to compare GDP levels across countries. We note that PPPs are statistical constructs and, as such, should have confidence intervals applied to them. The OECD recommends that the confidence intervals of real expenditures be at least 10 percentage points around the point estimate—but in practice, statistical agencies like the Australian Bureau of Statistics and Eurostat apply wider bands that involve 15 to 20 percentage points. Moreover, there is a particular problem in using the official PPPs that are derived for comparing expenditures when it comes to comparing productivity levels. The PPP relatives that are produced by Statistics Canada are calculated for the purpose of examining differences in standards of living—not for comparing differences in productivity levels. In order to adapt the price relative from the PPP used for comparing standards of living to a price relative for a productivity comparison, assumptions have to be made about whether Canadian exports are priced exactly at U.S. prices corrected for the exchange rate (satisfying the law of one price) and whether imports end up at landed prices in Canada that are exactly equal to U.S. prices corrected by the exchange rate. Using the assumption that the law of one price holds, Canadian labour productivity in the total economy is 94% that of the United States. We must recognize the estimate of 94% is a

Economic Analysis Research Paper Series - 6 - Statistics Canada - Catalogue No. 11F0027 No. 028
constructed statistic with a confidence interval of at least 10 percentage points if we follow the admonition of the OECD and more if we adopt the practice of both the Australian Bureau of Statistics and of Eurostat writers. That means we cannot rule out the possibility that Canadian labour productivity in the overall economy is at least as large as that of the United States. Nor can we rule out that our relative level is at least 10 percentage points behind that of the United States. Our point estimate of the relative productivity measure is sensitive to the assumption that is made about the price of exports and imports. If we assume export and import prices are not translated directly from one currency to another by the exchange rate, our point estimate of the productivity gap changes. If we allow for a 10 percentage point deviation from this assumption for imports and exports, then the productivity gap disappears.

Economic Analysis Research Paper Series - 7 - Statistics Canada - Catalogue No. 11F0027 No. 028
1. Introduction Productivity measures provide an indicator of the efficiency of the economy—in that they compare the amount of output that is produced per unit of inputs devoted to the production process. Labour productivity is defined as the amount of output1 per unit of labour input, where the former is usually measured at the level of the total economy in terms of gross domestic product (GDP) and the latter as employment or hours worked. This is a ‘partial’ productivity measure because it only considers one input—labour. Other less popular ‘partial’ measures that are sometimes produced include: output per unit of capital, or output per unit of intermediate materials consumed in the production process, or output per unit of energy consumed. Each of these partial measures may increase because the production process has become more efficient or because other factor inputs changed. For example, labour productivity may increase because more capital is supplied to workers (the capital/labour ratio is increasing) or because firms find new ways to produce more output with a given amount of inputs (for example, via organizational change, larger plant scale, or new techniques). Multifactor productivity measures (sometimes referred to as total factor productivity measures) combine several of these ‘partial’ productivity measures into a more comprehensive, inclusive measure that captures how much output is produced relative to a bundle of several inputs, where the latter is calculated as a weighted sum of many inputs. Productivity measures may focus either on levels or growth rates. In the former case, statistical measures may be produced of the output per hour worked (for example, $20 per hour). In the latter case, statistical measures will focus on how rapidly productivity has grown over a period of time (say by 5%). Both are of interest to those who make cross-country comparisons. Comparing levels allows statements to be made about whether one country is as ‘productive’ as another. Comparing growth rates allows statements to be made about whether two countries are making equal progress in improving productivity. The productivity program of Statistics Canada has focused on estimating the rate of growth of productivity—using both partial and multifactor productivity measures. And via its analytical program, it provides information to users on cross-country differences in productivity growth rates between Canada and other countries (primarily the United States).2 While it produces estimates of the level of some partial measures of productivity (for example, labour), it has not used these in the past for the purposes of cross-country comparisons. This paper is our first attempt to do so. The analytical focus on growth rates rather than on levels at Statistics Canada is done because the problems in comparing growth rates across countries are felt to be less than in comparing levels. There are two reasons for this. First, despite improvements to the international harmonization of statistical measurement systems since 1945, there are still differences in the
1. Output is usually used in this paper in the generic sense as the product produced. For the total economy, the
concept is usually represented by an estimate of GDP. At the industry level, it is represented either by value added or gross output (the value of production).
2. For examples, see Productivity Growth in Canada (2001, 2002).

Economic Analysis Research Paper Series - 8 - Statistics Canada - Catalogue No. 11F0027 No. 028
way different countries measure output and inputs. These differences have more impact on the accuracy of comparisons of relative productivity levels than they do on the accuracy of comparisons of growth rates. For example, household surveys and employer surveys in both Canada and the United States yield different estimates of employment. But both sources yield about the same growth rates across many time periods.3 This means that the level of labour productivity for Canada and the United States can differ quite substantially if two different sources are used to capture employment, but the growth in labour productivity will be about the same. Second, a comparison of productivity levels between Canada and the United States is generally avoided because the price data that are required to translate nominal or current dollar GDP differences between Canada and the United States into real GDP differences (differences that take into account differences in the prices of two countries) are not as readily available as are price data that allow for a reasonably accurate translation of changes over time in nominal dollar GDP into changes in ‘real’ output in each country. Statistics Canada collects hundreds of price series in order to estimate how much prices are changing over time so that it can deflate changes in nominal or current dollar GDP to produce accurate estimates of ‘real’ changes in output—changes that hold the price structure constant. The United States does the same. By contrast, the amount of detail available to translate relative nominal dollar GDP estimates in Canada and the United States into comparisons of relative ‘real’ GDP is much less. This in turn affects the quality of cross-country estimates of differences in productivity levels. Notwithstanding these problems, comparisons of productivity levels are often made by analysts. Data bases have been collected and cross-country comparisons made by the OECD, The Groningen Growth and Development Centre, the U.S. Conference Board, the National Institute of Economic and Social Research in London and the Centre for the Study of Living Standards in Canada.4 The majority of these institutes collect data from various statistical agencies for their cross-country comparisons, sometimes making attempts to standardize for differences in methodologies. The OECD, along with other members of the international community like the IMF and the United Nations, has led the way towards harmonization by emphasizing the importance to its member states of adhering to the international standard provided by SNA (93) for measuring gross domestic product. More recently, it has tried to harmonize the methods used to measure productivity and, indirectly, the measures that go into the productivity estimates (OECD, 2001). There have also been efforts and standards aimed at greater international harmonization of labour data since 1945. And efforts of the International Labour Organization, in conjunction with the OECD, have recently been devoted to harmonizing the methods and definitions used in collecting consistent estimates of hours worked. Despite these efforts, there are still differences in methods and coverage of official statistics across countries. Even though sources and methodology differ, when they are held constant over time, these different sources may yield reasonably accurate estimates of the relative magnitude of productivity growth across countries. In contrast, the comparison of productivity levels is more
3. See Scarpetta, Bassinini, Pilat and Schreyer (2000), Annex. 4. For a useful discussion of the various data sources along with Web links, see Smith (2003).

Economic Analysis Research Paper Series - 9 - Statistics Canada - Catalogue No. 11F0027 No. 028
problematic. For example, different statistical sources for measuring labour inputs produce quite different estimates of productivity levels across countries and of the relative productivity of two countries. Referring to productivity problems in Canada, Sulzenko and Kalwarowsky (2000) claim that Canada’s standard of living was 25 percent below that of the United States in the late 1990s and that overall Canadian productivity was 15 percent below that of the United States. Sharpe (2001, p. 9) claims that Canadian GDP per capita was 79% of the United States in 1999 and its labour productivity equally low—levels that are also suggested by Card and Freeman (2002, p. 42). On the other hand, Fortin (2003, p. 39) estimates output per hour worked in Canada was 90% that of the U.S. in 2001. Professional economists have provided a rather wide range of estimates in describing the relative performance of the Canadian economy compared to the United States as of the end of the 1990s. More importantly, almost all treat their point estimate as a population value and give little attention to the confidence interval that interested readers should use when interpreting the significance of their estimates. Variations in estimates of relative performance are caused by several factors. First, there are differences in the measures being used. Some refer to output per capita, others to output per worker, and still others to measures of total factor productivity. Second, there are differences in the variables that are used to measure inter-country differences in performance. Both outputs and inputs are often measured in several different ways by the same statistical agency. While the productivity divisions of statistical agencies are charged with deciding upon the appropriate measures that should be used together for productivity estimates, outsiders sometimes choose measures that are not compatible one with another. Equally important, measures can be used for different countries that are derived in quite different ways. Many of those pursuing answers to the size of inter-country productivity differences are well aware of deficiencies in the data that they use; but interest in differences in productivity levels does not depend on the existence of perfect statistics. Analysts in search of answers to important questions make do with the data that they can find. Many analysts who attempt these comparisons often request guidance from Statistics Canada on the nature of the problems that they should consider when interpreting the meaning of the differences in productivity levels. Since comparisons of levels are less accurate than comparisons of growth rates,5 guidance is sought on the nature of the confidence interval or of the corrections that should be made. This paper explores these issues. The following sections deal with four important measurement issues. The first is the nature of the GDP output measure that should be used for comparisons between Canada and the United States. The second is the nature of the correction process that should be used to compare GDP calculated in Canadian dollars to GDP calculated in U.S. dollars. Third, we discuss differences in the measurement of labour input in the two countries. The final section then provides a measure of relative labour productivity in the two countries.
5. For a discussion of the types of confidence intervals that should be used for cross-country comparisons of
Canada/U.S. growth rates, see Baldwin and Harchaoui (2001a).
Economic Analysis Research Paper Series - 10 - Statistics Canada - Catalogue No. 11F0027 No. 028
2. Methodological issues Productivity measures are key indicators of the state of the economy. Several different productivity measures are used for this purpose. Labour productivity measures were the first set of summary productivity statistics to be developed, are relatively simple, and are closely related to measures of both well-being and of the efficiency of the production process. Labour productivity is defined as the amount of output (usually measured as GDP at the level of the total economy or value added at the industry level) produced per unit of labour input (measured either as number of workers or as hours worked). It is used to capture the efficiency with which the economic system transforms labour into output. Labour productivity is closely related to a commonly used measure of economic well-being—GDP per capita, since:
1) / ( / )*( / )GDP Pop GDP L L Pop= where Pop is population and L is the labour input. This identity demonstrates that the output per person (GDP/Pop) that is available for distribution to a society’s population will increase if labour productivity (GDP/L) is higher and/or as the proportion of the population that is working (L/Pop) increases. But it also shows that cross-country estimates of GDP per capita and labour productivity can deviate from one another if the rate at which the population is employed differs across countries. Labour productivity captures only one dimension of the efficiency of the production process. The measure of labour productivity is only one of several partial statistical measures that describe the efficiency of the production process—that describe how well the economy is doing in terms of transforming inputs into outputs. Other factor inputs include capital, energy and intermediate goods and services. Each of these can be combined with output (i.e., GDP or value added) to produce other partial measures, such as capital productivity, or energy productivity. Ultimately, the efficiency of the economy depends not just on how efficiently labour is being employed, but also on how efficiently all the other inputs are being used. A more comprehensive measure of overall productivity combines all of these partial measures into an aggregate index called multifactor productivity (MFP)—the ratio of output produced per combined bundle of inputs—labour, capital, energy and intermediate goods and services.
2) ( / )i iMFP w GDP I=∑
where Ii is the i’th factor input and wi is the weight used to aggregate the various components. Using a production function framework, where output is written as a function of inputs (i.e.,
* ( , )Q A f K L= where K represents capital and L represents labour) allows differences in outputs

Economic Analysis Research Paper Series - 11 - Statistics Canada - Catalogue No. 11F0027 No. 028
across countries to be divided into the differences in the amount of the factor inputs (K,L) that are used in the production process and relative efficiency. Relative output levels (Q) in Canada (C) and the U.S. (U) can be written as a function of relative efficiency levels (MFP), relative levels of labour (L) and capital (K) with the following formula.6
3) ln( / ) ln( / ) ln( / ) ln( / )l kQc Qu MFPc MFPu s Lc Lu s Kc Ku= + + where sl and sk are the shares of total GDP that goes to labour remuneration and capital remuneration, respectively. This framework can be rewritten as
4) ln(( / ) /( / )) ln( / ) ln(( / ) /( / )kQc Lc Qu Lu MFPc MFPu s Kc Lc Ku Lu= + Equation 4 demonstrates that relative labour productivity of two countries is affected by the relative technical efficiency (MFP) and the relative capital labour ratios (K/L) of those two countries. Analysts have used equation 4 to investigate the sources of differences in labour productivity between countries—to ask whether it is just efficiency differences or the differences in other factors like the amount of capital per worker that have contributed to differences in labour productivity and, therefore, to differences in GDP per capita. Labour productivity can be higher in one country compared to another either because the capital intensity of the production process is higher (workers get more capital to work with), because of a superior quality of the work force (perhaps because of more education), or because of the inherent superiority of the production process (a higher overall MFP). Superior efficiency gains may occur if firms in one country are larger and, as a result, reduce their unit production costs by taking advantage of economies of scale, or if new superior technologies are more frequently employed, or if new more effective forms of organization are adopted. Separating the causes behind higher (or lower) levels of labour productivity is important since policy interventions may differ depending on the causes behind differences in labour productivity. Most comparisons of inter-country differences in productivity focus on labour productivity—both because the data required to estimate labour productivity are easier to obtain and because this measure is conceptually easier to explain and to understand than multifactor productivity measures. We therefore examine differences in labour productivity between Canada and the United States in this paper. But we are cognizant that we ultimately want to provide a more complete picture of the differences in the two countries’ production systems—and for that we need to examine not only labour productivity, but other aspects of the production systems of the two countries as well. In particular, we ultimately need to ask whether the differences in labour productivity that are revealed are related to differences in capital intensity or differences in the skill levels of the labour force.
6. See www.statcan.ca/english/concepts/15-204/index.htm

Economic Analysis Research Paper Series - 12 - Statistics Canada - Catalogue No. 11F0027 No. 028
3. Data issues 3.1 Output Measures of output are required for estimates of labour productivity. At the level of the economy, output is captured with GDP. At the level of the industry, output is generally measured as value added.7 The latter, when summed to level of the economy, will equal GDP. We concentrate here on those factors that affect differences in the measurement of output in the total economy and the business sector. To measure the business sector, we exclude the economic activity of several sectors from the GDP estimate for the total economy. The excluded activities encompass public administration, the production of private households, the imputation of rent to owner-occupied dwellings as well as the activities of non-profit organizations.8 These non-business activities include public health and education facilities as part of non-profit organizations. It is sometimes argued that this makes comparisons between the business sectors of Canada and the United States problematic because this places most of health and education activity in Canada in the non-business sector since health and education are generally produced by publicly owned entities in Canada while it leaves these activities in the business sector in the United States because of the large private health and education sector in the United States. This is incorrect. It is the U.S. practice at present to include most of education and health in the non-profit sector and therefore to exclude it from the business sector. Nevertheless, it still may be the case that the for-profit health and education sectors that remain in the U.S. business sector are relatively larger than the for-profit health and education activities that remain in the Canadian business sector. In the appendix, we discuss what would happen if we transfer all for-profit health and education from the business sector to the non-business sector to test whether our results depend on the allocation of health and education. They do not. We focus on the business sector as well as the total economy because both are inherently of interest. But it should be noted that there are more difficulties in measurement in the government sector and that measures for the total economy, which includes government, are inherently less accurate. In order to calculate productivity growth, we need to measure outputs separately from inputs. But most statistical agencies do not do this for the public sector.9 For the public sector, output is measured generally as the sum of inputs and, therefore, productivity growth here is generally zero. It is often argued that it is best in these circumstances to remove the government sector and consider the business sector separately because aggregate indices for the total economy contain a subset (government) where meaningful information on productivity growth does not exist.
7. Output at the industry level is also alternately measured as gross value of production for some productivity
estimates. 8. More precisely, it excludes non-profit organizations serving households (i.e., the Red Cross) but not non-profit
serving businesses (i.e., the Canadian Manufacturers Association). 9. When they do so, they generally make arbitrary assumptions about the level of productivity that is built into
output estimates.

Economic Analysis Research Paper Series - 13 - Statistics Canada - Catalogue No. 11F0027 No. 028
Moreover, in cross-country comparisons, the aggregate will depend on the size of the government sector in different countries. That is, the aggregate measure of relative productivity growth is just a weighted average of the relative productivity growth in the business sector and in the government sector, where the latter is equal to zero by construction. Despite the shortcomings in the measure of relative productivity calculated for the total economy as a whole, we also report the results for the total economy here because of widespread interest in this concept. Both Canada and the United States have a comprehensive system of statistics measuring output in the economy that is based on quite similar definitions and coverage using the guidelines provided in the System of National Accounts 1993. Despite the similarities between the Systems of National Accounts in the two countries, there are several differences that have had an effect on comparisons of levels until the 2003 comprehensive U.S. revision. 3.1.1 Valuation of output Gross value of production may be valued at the factory gate of the producing unit, including product taxes, excluding product taxes, including or not including revenue received as subsidies, or at the place of the purchasing unit. Different conventions lead to different measures of GDP for the total economy or value added at the industry level. GDP measured at market prices is defined as the aggregate expenditure on all goods and services (consumption, investment, government and net exports) measured at purchasers’ prices (including taxes paid). GDP at basic prices is GDP calculated at market prices less taxes paid on products plus any subsidies on consumption. GDP at factor cost is GDP at basic prices less indirect taxes on factor inputs less subsidies on these inputs. When the national accounts are created for particular industries, Canada measures gross value of production at what it refers to as modified basic prices—the price received on products that excludes any product taxes but that also excludes subsidies received.10 However, for the total economy, Canada produces measures at market prices, basic prices and factor costs. Table 1 contains estimates of Canadian GDP at factor cost, at basic prices and at market prices for 1999.11 GDP at basic prices is 6% higher than GDP at factor cost because taxes less subsidies on factors of production are added. GDP at market prices is another 8% higher than GDP at basic prices because taxes less subsidies on products are then added.
10. Statistics Canada argues that this corresponds to the invoice price and therefore is more easily collected in its
production surveys. 11. We choose to focus on 1999 since the estimates of GDP have now been moved from being classified as
preliminary to being final (subject only to historical revisions) while subsequent years are still preliminary and because PPPs are available for this year.
Economic Analysis Research Paper Series - 14 - Statistics Canada - Catalogue No. 11F0027 No. 028
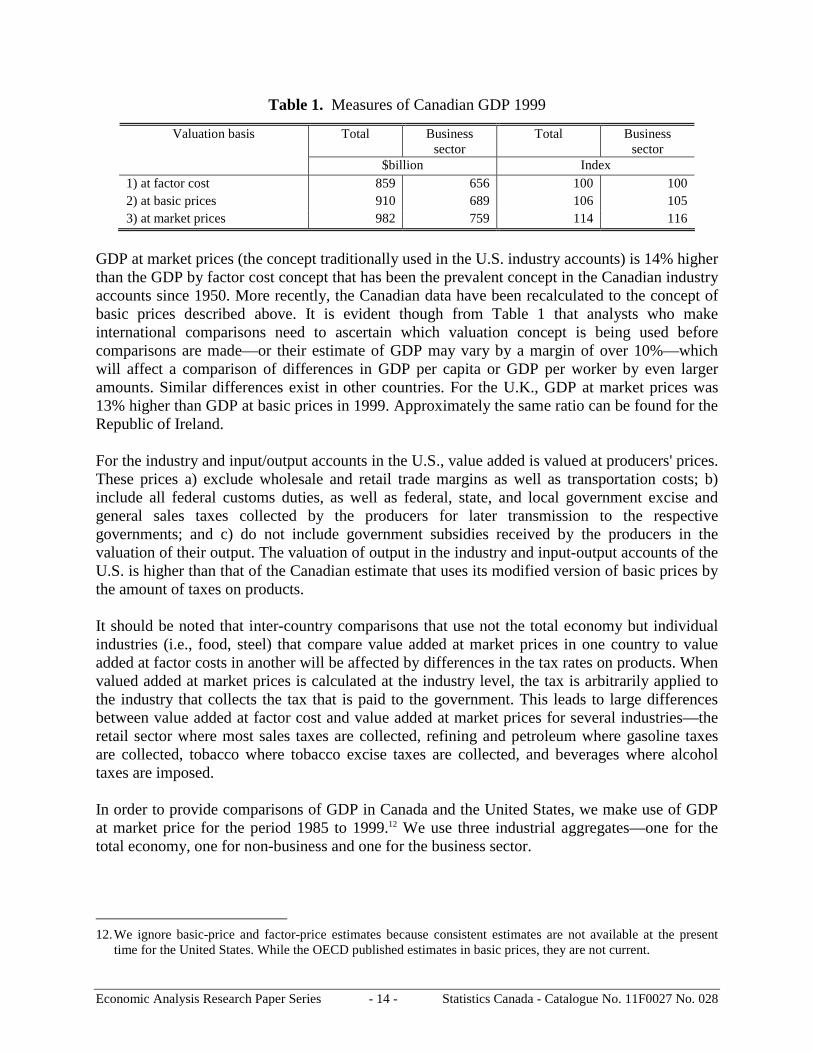
Table 1. Measures of Canadian GDP 1999
Total Business sector
Total Business sector
Valuation basis
$billion Index 1) at factor cost 859 656 100 100 2) at basic prices 910 689 106 105 3) at market prices 982 759 114 116
GDP at market prices (the concept traditionally used in the U.S. industry accounts) is 14% higher than the GDP by factor cost concept that has been the prevalent concept in the Canadian industry accounts since 1950. More recently, the Canadian data have been recalculated to the concept of basic prices described above. It is evident though from Table 1 that analysts who make international comparisons need to ascertain which valuation concept is being used before comparisons are made—or their estimate of GDP may vary by a margin of over 10%—which will affect a comparison of differences in GDP per capita or GDP per worker by even larger amounts. Similar differences exist in other countries. For the U.K., GDP at market prices was 13% higher than GDP at basic prices in 1999. Approximately the same ratio can be found for the Republic of Ireland. For the industry and input/output accounts in the U.S., value added is valued at producers' prices. These prices a) exclude wholesale and retail trade margins as well as transportation costs; b) include all federal customs duties, as well as federal, state, and local government excise and general sales taxes collected by the producers for later transmission to the respective governments; and c) do not include government subsidies received by the producers in the valuation of their output. The valuation of output in the industry and input-output accounts of the U.S. is higher than that of the Canadian estimate that uses its modified version of basic prices by the amount of taxes on products. It should be noted that inter-country comparisons that use not the total economy but individual industries (i.e., food, steel) that compare value added at market prices in one country to value added at factor costs in another will be affected by differences in the tax rates on products. When valued added at market prices is calculated at the industry level, the tax is arbitrarily applied to the industry that collects the tax that is paid to the government. This leads to large differences between value added at factor cost and value added at market prices for several industries—the retail sector where most sales taxes are collected, refining and petroleum where gasoline taxes are collected, tobacco where tobacco excise taxes are collected, and beverages where alcohol taxes are imposed. In order to provide comparisons of GDP in Canada and the United States, we make use of GDP at market price for the period 1985 to 1999.12 We use three industrial aggregates—one for the total economy, one for non-business and one for the business sector.
12. We ignore basic-price and factor-price estimates because consistent estimates are not available at the present
time for the United States. While the OECD published estimates in basic prices, they are not current.

Economic Analysis Research Paper Series - 15 - Statistics Canada - Catalogue No. 11F0027 No. 028
Table 2. Nominal GDP ratio (Canada/U.S.), market price
Year Total Business Non-business 1985 11.5 11.2 12.5 1990 11.7 11.4 12.6 1993 10.9 10.4 12.6 1996 10.7 10.4 11.8 1999 10.6 10.5 11.0
The ratio of Canadian GDP to U.S. GDP is presented in Table 2. At the level of the total economy, Canadian GDP starts in 1985 at 11.5% of the U.S. GDP and declines slightly to 10.6% by 1999. The ratio of GDP measured at market prices in the Business sector declines marginally from 11.2% to 10.5% over the same period. The relative values in Table 2 are calculated from the GDP estimates of each country calculated in their respective currencies (that is, Canadian and U.S. dollars, respectively). In order to provide comparable estimates of productivity across the two countries, it is necessary to take into account differences in methodology and differences in prices in the two countries. We do that below. But first, we discuss several areas where Canada and the U.S. have differed substantially over the last several years. 3.1.2 The valuation of financial intermediation services The output of banks and other financial institutions is derived by financial intermediation. And its value is derived as the total property income receivable minus total interest payable.13 The System of National Accounts is balanced in the sense that the value added of all industries adds to the total final expenditures on goods and services on one side and to all factor incomes on the other side. In order to accomplish this, the production of the financial sector must be allocated—as being disposed of as intermediate consumption by enterprises and governments, as final consumption by households, or as exports to non-residents. The System of National Accounts determines this allocation in the case of financial services by assuming that the value of the output of financial services accrues to the beneficiaries of the financial intermediation service—either the borrowers or the holders of accounts—in the way of unpriced services. Both Canada and the United States calculate the value added in this industry in a similar way. But until the U.S. revision in late 2003, it had been allocated differently. In the United States, the entire output was allocated to depositors, while in Canada it was allocated to both depositors and borrowers. As most of the depositors belong to the household sector and most of the borrowers belong to the business sector, the choice of the U.S. convention resulted in a much bigger allocation to final consumption by households, hence GDP in the United States. This difference meant that in Canada about 50% of the output is allocated to final expenditures but in the U.S. about 80% was allocated to final expenditures.
13. This excludes the value of property income receivable from investments of one's own funds.

Economic Analysis Research Paper Series - 16 - Statistics Canada - Catalogue No. 11F0027 No. 028
When part of the output is allocated to borrowers in the business sector, the Accounts treats this as both a service received and a service that has been paid for. Thus the larger the percentage of this industry that is allocated as intermediate product, the smaller is contribution to total GDP produced by the financial sector. In effect, allocating the value of financial services to other businesses results in a removal of part of the output of this sector from total GDP ultimately created. In 1999, of the $26 billion Canadian output of the deposit taking financial intermediaries and consumer loan companies, about $13 billion was allocated to consumers and the remainder to the business sector.14 If the entire amount was allocated to consumers, total GDP at market prices in 1999 would increase by about 1.3%; or business sector GDP at market prices would increase by 1.8%.15 With the 2003 revision of the U.S. National Accounts, the difference in methodology has disappeared from the estimates available for total GDP. Therefore, we make use of the revised U.S. estimates for 1999 in this study.16 3.1.3 The statistical discrepancy The output of the National Accounts is built up in several different ways that, in theory, should give the same result. On the one hand, it is generated from measuring all expenditures in the total economy—consisting of consumption, investment, government, and net exports. On the other hand, it is derived from measuring all the payments that are made to the factors of production that produce the output—payments to workers and payments to capital.17 The two approaches rely on different sources for data. For expenditures, the Accounts rely on surveys of sales, production, and trade. For the income side, they rely on surveys of labour compensation and profits. Although taken together, these different sources measure the same concept, they rarely sum to exactly the same number. The difference between the two is called the statistical discrepancy. In Canada, quarterly GDP is calculated both from the expenditure and income side. The difference is calculated and half of that difference is added or subtracted from each side to derive the official estimate of GDP.
14. See Lal (2003). 15. The differences that emerge from this area are even larger if the numbers published by the OECD are used. For
this purpose, Canada removes all financial net income from final expenditures in order to be comparable to most other countries. This practice leads to even greater differences with the U.S. (see Lal, 2003).
16. It should be noted that differences may still exist if the split between consumer and business deposits differs in Canada and the United States.
17. GDP can also be built up from estimates of value added per industry by adding together the value added of all industries.

Economic Analysis Research Paper Series - 17 - Statistics Canada - Catalogue No. 11F0027 No. 028
Table 3. Canada and U.S. GDP (1999), millions
Canada ($Cdn.)
United States
($U.S.)
Canada/U.S. ratio (%)
1 2 3 Total 982,441 9,268,400 10.6
Business 759,347 7,243,400 10.5
In the United States, the statistical discrepancy is handled differently. The U.S. National Income and Product Accounts treat their expenditure side as the most accurate estimate of GDP. The difference between the expenditure-based and the income-based GDP is calculated and the entire amount is added to the income side as a separate item to make it equal to the expenditure side. The discrepancy was 0.5% of National Income in 1999 but it had increased to 1.6% by 2000.18 In this study, we make use of the U.S. estimate taken from the expenditure side and the Canadian estimate that is derived from the compromise discussed above. 3.1.4 Defining the business sector Productivity analysts often focus on a subsector of the total economy that is referred to as the business sector. The business sector excludes non-market activity. There are two reasons for dividing up the economy in this way. First, it may be inherently useful to understand how productivity is evolving in each area. Second, there are differences in the ability of statistical agencies to measure productivity in the non-market sector because it is difficult to measure real output in these areas. For Canadian purposes, the non-business sector is defined to include government administration, non-profit activity and the rent that is imputed to owner-occupied housing. Until the recent revisions of the NIPA accounts, the U.S. non-business sector was defined somewhat differently. But the recent revisions have made changes to the U.S. concept to bring it closely in line with the Canadian. The Business sector of the Canadian economy accounted for 77.2% of the GDP of the total economy in 1999, while it made up 78.2% of the U.S. economy in the same year. Table 3 contains the values of GDP measured at market prices for the two countries that are used in this study.19 The U.S. figures are derived from the 2003 comprehensive revision. The Canadian data for 1999 are current as of April 28th, 2004. 3.2 Relative prices To create measures of productivity that abstract from price changes over time or price differences across countries, we need to transform output (GDP or value added) measured in nominal dollars into a statistic that is more akin to a physical concept. For purposes of
18. This is 0.4% of GDP at market prices in 1999 and 1.3% in 2000. 19. For the purpose of calculating GDP in the business sector at market prices, all product taxes and subsidies were
assigned to the business sector in the United States but only 90% were assigned in Canada.

Economic Analysis Research Paper Series - 18 - Statistics Canada - Catalogue No. 11F0027 No. 028
productivity measurement, it is not sufficient to know that Canada produced, say $100,000 (Cdn.) of lumber per worker, and that the U.S. produced, say $50,000 (U.S.) per worker; for productivity estimates, we need to know whether Canada produced more physical output (board feet of lumber) per worker than did the United States. In order to transform the relative dollar estimates of total GDP (or industry value added) that are produced in two countries into a measure of relative physical outputs, a measure of relative prices is required. If the price of Canadian lumber is $2Cdn and that of lumber in the U.S. is $1U.S., then the relative price is 2 and the relative quantity produced is 1 (100,000/50,000 divided by 2). There is a similar need to transform changes in the dollar amounts of GDP that occur over time into measures of change that abstract from or remove price changes from the calculation of productivity growth. Estimates of productivity growth are derived from a comparison of the growth in output relative to the growth in inputs like labour and capital. Changes over time in the output of the lumber industry that are measured in terms of dollars of output (what is referred to as nominal or current dollar output) have to be transformed into measures of change that abstract from changes in prices, a measure that is more akin to physical changes. The latter are referred to as constant-dollar changes, though some use the more emotive phrase—‘real’-output changes. In our simple example that involves one industry and one product, these constant-dollar changes would be akin to measures of the increase in the board feet of lumber produced. But in a more complex world, the measures are not physical in the normal sense. In a world where both lumber and airplanes are produced, any measure of output involves an aggregation of disparate products, with aggregators that are prices. The change in an aggregate measure of value of output calculated using i goods between period t-1 and t is:
11 1* *it itt t it it
i i
Q Q p q p q−− −− = −∑ ∑
‘Real’ or constant-price indices of changes in outputs simply choose relative prices in a particular way to provide a construct for comparing changes over time that abstract from relative price changes. That is, these indices value the different commodities that are produced by an economy over different time periods using a constant set of prices—either the prices used in the first period (a Laspeyres index), those in the final period (a Paasche index), or some combination of the two. Normally, statistical agencies have the raw material that is required to estimate indices of ‘real’ or constant-price changes. They collect hundreds of prices that are used for the creation of price indices that track price changes over time. These indices are then used to deflate changes in current dollar expenditures to produce ‘real’ or constant-price changes. For the input/output accounts, price data are available for both changes in inputs and outputs. As such, national statistical agencies publish rates of growth of ‘real’ output by industry that can then be used for the calculation of growth rates of productivity. A similar deflation process is required for cross-country comparisons. But greater conceptual and practical difficulties exist when it comes to creating deflators for cross-country comparisons of relative GDP. Price deflators are meant to provide index numbers that when used for deflation purposes tell us something useful about the extent to which changes in ‘real’ outputs permit

Economic Analysis Research Paper Series - 19 - Statistics Canada - Catalogue No. 11F0027 No. 028
higher welfare or allow us to infer that productivity has increased by indicating whether there has been a shift in the production function. The index number literature has outlined the conditions that allow a calculated index number to do so. To use index numbers in a meaningful way for one of these purposes requires assumptions: a) that tastes or technology remain constant, and/or b) that a common set of commodities exists. Comparisons of real income over time involve fewer departures from these assumptions than cross-country comparisons.20 Over short periods of time, tastes and technology remain relatively constant. In contrast, it is likely that the difference in the social environment found across some countries leads to substantial differences in tastes and that, in some cross-country comparisons, commodity sets are often quite different. As such, comparisons across countries that differ in terms of production or consumption bundles of products may be less meaningful than between countries that are more similar.21 However, researchers have argued that these differences are relatively unimportant for Canada/U.S. comparisons because of the similarities between the two countries.22 There still remains the issue of price measurement. Statistical agencies do not generally collect large numbers of estimates of relative prices that can be used for studies of cross-country relative productivity. But they do collect a limited set of price data that are provided to international agencies—the OECD23 and the World Bank24—for their purchasing power parity (PPP) programs. These programs estimate differences in the amount of income in two countries that is required to allow the purchase of an equivalent bundle of goods given the differences in prices. Suppose, for example, that the price of lumber in Canada and the U.S. was such that $100 (Cdn.) bought the same amount of lumber as $80 (U.S.), then the calculated PPP would be 1.25. Ratios such as these are then used to deflate differences in nominal dollar expenditures to provide ratios of ‘real’ expenditure differences between two countries. These PPP programs make use of price data that are collected on final expenditure categories, often by personnel who are also involved in the consumer price programs of various countries. The price data are collected and transmitted to international agencies (the OECD and the World Bank), who transform them into ratios and use them to compare the GDP between countries using a constant price structure—by using the rates that equalize the purchasing power of different currencies to deflate ratios of one country’s GDP to that of another, when both are measured in different currencies. These deflated measures are often referred to as ratios of ‘real’ expenditures in the two countries being compared.25 There are several problems that arise when the PPP prices are used to deflate cross-country differences in GDP in order to estimate real output differences for productivity comparisons (Hooper, 1996; Pilat, 1996). The first is that cross-country prices are drawn from market prices:
20. See Ulmer (1972, p. 73). 21. See also SNA (1993). Para 16.79. 22. Daly (1972, p. 109). 23. See OECD, 1995. 24. See United Nations 1994. 25. It is useful to note that they are not ‘real’ in the sense that the ratio of physical quantities of board feet of lumber
is ‘real’ since they combine many quite disparate products into one index. The value of the resulting ratio is not unique. It depends on the relative weights used for aggregation of the price relatives.

Economic Analysis Research Paper Series - 20 - Statistics Canada - Catalogue No. 11F0027 No. 028
i.e., final expenditures that contain both trade and transport margins. They also include indirect taxes less subsidies on final products. If comparisons are being made of GDP at market prices, this does not create a problem. But if GDP is defined at factor costs (without indirect taxes, or subsidies, or final product taxes), then corrections have to be made to inter-country purchasing price (PPP) indices based on market prices. Second, the PPPs that are normally estimated are taken from domestic consumption expenditures. As such they do not directly take into account the prices of imports and exports per se. Of course, when samples are taken of prices in domestic markets, these prices are a blend of prices of domestically produced goods and imports and if we are only concerned about comparing relative national expenditures (whether they be consumption, investment, or government spending), then the system that produced PPPs is adequate. Worrying about import and export prices is a problem when we want to compare production rather than consumption across countries. For then we need to back out the effect of imports on total domestic sales (which consist of domestic production and imports) and add in domestic production that went to export markets, since domestic production equals total domestic consumption minus imports plus exports. Third, while the PPP method that is used for the final expenditure categories can be applied to the economy as a whole, it is not easily applied to particular industries for two reasons. First, the data are collected for commodity bundles that do not necessarily result in good coverage at the industry level.26 The PPP program was not designed to provide adequate coverage for the final products produced by individual 4-digit industries.27 Second, the sampling procedure for the PPPs was designed to give reasonable coverage for expenditures on final goods—not intermediate commodities that are consumed by industries. Since industry studies investigating real output work with measures of value added—gross output minus material, services, and energy inputs—we need deflators for both gross output (final demand categories) and for the intermediate inputs. The PPP program of most countries was not designed to provide deflators in the latter area. Analysts have offered solutions to these problems. Hooper (1996) makes adjustments to the international PPPs calculated by the OECD by adjusting for difference in trade margins, and indirect taxes so that GDP at factor costs can be compared. He also adjusts for export and import price differences by assuming that each are the average of the prices of two countries being compared. But he provides no justification for this latter assumption. In order to transform commodity PPPs into estimates that can be used at the industry level for both output and input measures, Jorgenson and Kuroda (1990) use the commodity PPPs and input/output tables that combine both industry and commodity data to derive measures of prices that can be used for both outputs and inputs at the individual industry level. Lee and Tang (2001)
26. Even the quality of data at the national level is sometimes problematic. Many countries do not have an official
PPP program. They extract a sample of prices from their prices program under instructions from international agencies and then transmit them to the international agencies so that the latter can calculate PPPs. As such, many national agencies do not take responsibility for the accuracy of the final estimates.
27. Both Australia (2002) and Stapel (2004) from Eurostat warn that existing PPPs are not accurate enough to support very accurate estimation of industry PPPs.

Economic Analysis Research Paper Series - 21 - Statistics Canada - Catalogue No. 11F0027 No. 028
perform the same exercise for Canada in 1995 by using some 201 commodity PPPs and matching them as best they could to some 249 common but different commodity groups in the Input/Output tables. But this approach means that only a small number of relative prices are available per industry and leaves the accuracy of the results in question. An alternate approach has been taken in many studies that measure price differences at the industry level—particularly in manufacturing, an industry where statistical agencies have long collected detailed commodity data on outputs and inputs and their prices. The unit-value (UV) method uses unit values derived from the commodity data that are collected from the Census of Manufactures of different countries. Unit prices are derived by dividing the value of production of certain commodities by the physical units that are produced of the same commodities. Since these values are calculated directly from factory shipments, they offer the advantage that the derived price directly measures production that is bound for both domestic and export markets. This approach has been used to compare Canada/U.S. manufacturing productivity by West (1971) for 1963, by Frank (1977) and by Baldwin and Green (2003) for the 1920s. The same technique has been used extensively to study productivity differences between European countries and the United States (Paige and Bombach, 1959). Research studies carried out at the National Institute for Economic Research have compared Britain to the United States and Germany (Smith, Hitchens and Davies, 1982, O’Mahony, 1992). Research studies associated with the Groningen Growth and Development Centre (see Maddison and Van Ark, 1988; Van Ark, 1993) have examined differences across a number of European countries. There are several problems that the UV technique faces. One problem arises from the type of commodity data used and differences across two countries in the commodity mix. Unit values are often calculated for categories that are quite broad and that may involve a mix of heterogeneous commodities. The resulting index is rather crude. As a result of this problem, cross-country comparisons are often restricted to a set of industries that produce a relatively homogenous commodity set. The prices of wheat and flour, for example, are easier to compare than the diverse range of chemical products, where there are often substantial differences across countries in commodities produced. Unit values also suffer from the same paucity of data that besets the commodity expenditure PPP calculations. Unit values are available for only a sample of goods. It is worth noting that a good estimate does not necessarily require a 100% matching process. It only requires a well designed matched set. But most UV exercises do not start by designing a good sample; they use what they can find. The third major problem that many international UV studies face is a problem resulting from a lack of international standardization in commodity codes. Product codes often differ across countries and it is difficult to match similar commodities. Even when commodities are given the same name (i.e., gasoline), care must be given to adjust for quality differences—as minor as differences in units of measurement. Gallons can be either imperial or U.S. gallons. Tons may be long or short tons. Even bricks can have differences in standard measures across countries.

Economic Analysis Research Paper Series - 22 - Statistics Canada - Catalogue No. 11F0027 No. 028
As a result of these disadvantages, many cross-country industry studies limit themselves to a handful of industries. For example, a Canada/U.S. comparison done by West (1971) used only 30 of about 100 3-digit industries for which he felt had products that were homogeneous enough to permit comparisons. Frank (1977) examined only 33 industries. De Jong’s 1996 comparison of Canada to the United States matched only about 27% of the total Canadian output for the derivation of the Canada/U.S. relative unit value (van Ark and Timmer, 2001. p. 12). Baldwin and Gorecki (1986) extend the observation set for comparisons in the 1980s by modeling Canadian prices as a function of U.S. prices and the Canadian tariff for those industries where reasonable price comparisons can be made and then by spreading these estimates to other industries using estimated tariff rates, which are more readily acquired than are price data. In this study, we are interested only in asking how labour productivity in the total economy and in the business sector compares to that in the United States. Since we are working at a relatively high level of aggregation (the total economy or the business sector), we make use of the expenditure PPPs that Statistics Canada collects for bilateral comparisons between Canada and the United States. These estimates are taken from the underlying data used for Statistics Canada’s bilateral purchasing power parity program with the United States (See Statistics Canada, 1993, 1999, 2002).28 Several modifications were made to the 1999 PPP benchmark estimates for our purposes. First, we modify the estimates to cover the business sector as well as the total economy. This was done by removing public administration, non-profit health and education, other non-profits and owner-occupied rents. Second, we make adjustments for the openness of the Canadian economy. Other studies have essentially ignored the issue of the pricing of imports and exports, both because it is difficult to find data on prices in these markets, but also because the economies being studied did not trade intensively. A Canada/U.S. comparison cannot ignore this issue because of the size of imports and exports. In 1999, the export-to-GDP ratio was 41% for the total economy (55% for the business sector) in Canada, while the import-to-GDP ratio was 39% for the total economy (52% for the business sector). A discussion of the impact of alternate assumptions about how imports and exports are priced is presented below. 3.2.1 Pricing imports and exports In this section, we make use of Canada/U.S. PPPs for 1999 as published by Statistics Canada (Statistics Canada, 2002). Before we do so, a brief note on the accuracy of the PPP program in general is warranted.
28. The reader is warned that the Canada/U.S. comparison will differ from published comparisons of the OECD that
do not compare Canada and the U.S. directly. The OECD adopts a methodology that allows for comparisons across countries that in turn satisfy certain desirable properties (see van Ark 1996). As useful as these multilateral exercises are, they sometimes provide bilateral comparisons that do not seem very sensible. As a result of extensive interest in Canada/U.S. comparisons, Statistics Canada provides direct measures of Canada/U.S. price differences that only use data from these two countries.

Economic Analysis Research Paper Series - 23 - Statistics Canada - Catalogue No. 11F0027 No. 028
PPPs are produced by international agencies like the OECD and the World Bank for the purposes of cross-country comparisons of GDP. They are the outgrowth of post-World War II concerns with the relative success of European economies and subsequently by the United Nations with the economic progress that member countries were making. The development of these PPPs owes much to economists working at the predecessor of the OECD who later relocated to the University of Pennsylvania. Both the OECD and the United Nations have found it essential for their cross-country work to construct PPPs and led the way in this task by asking statistical agencies for the data to produce these PPPs. Most statistical agencies have provided what they had from their own price programs—but left the responsibility for the quality of the product produced to the agencies that took national data and produced international PPP indices. For many commodities, the data available in individual countries for transmission to the international agencies was not comprehensive—with a small number of commodities being sampled. In other cases, no data were available and the international agencies have filled in the missing observations with the means of the rest of the sample. In some cases (capital equipment), the commodities that are used for comparison are not easily found in all countries. Generally, national statistical agencies take an agnostic position on the quality of the data.29 National agencies provide underlying price series as requested, but do not produce the final product. However, when statisticians are asked as experts to comment on the resulting PPPs, the results have been less than flattering. Two reports by statisticians (Castles, 1997; Ryten, 1999) have been highly critical of the PPPs actually produced. Castles recommended that the calculation of non-household components of GDP should be scrapped (Statistical Commission of the United Nations, 1999). Ryten took much the same view and questioned the value of the whole program given its present degree of accuracy. While we make use here of the PPP estimates for Canada and the United States that are published by Statistics Canada, it is worth noting that the agency essentially produces these estimates to rectify a problem that is created by the OECD’s estimates of PPPs. The OECD estimates are constructed in order to satisfy certain objectives for multilateral comparisons. As such, bilateral estimates such as those for Canada and the United States that come from the technique that are produced to meet the purposes of multilateral comparisons sometimes appear problematic. This was the case for Canada/U.S. comparisons derived from the OECD procedures. Unfortunately, most Canadian users want PPPs for Canada/U.S. comparisons. To satisfy this group, Statistics Canada took the data that are transmitted to the OECD and calculated an alternate PPP for Canada/U.S. comparisons. But this PPP is essentially a derivative of the OECD program. However, Statistics Canada makes certain improvements—by better matching products, by extending coverage and by making use of certain formulae that are better suited to bilateral comparisons.30 Nevertheless, it should be recognized that the resulting PPP is only an estimate of a true population value—an estimate that is subject to the normal types of errors associated with constructed statistics. These errors can occur because the prices that are sampled can be considered to come from a stochastic process that generates a range of prices, only some of
29. Since they do not comment gratuitously on the work of others. 30. See Dryden, Reut and Slater (1987) for a discussion of the Canada/U.S. bilateral comparison.
Economic Analysis Research Paper Series - 24 - Statistics Canada - Catalogue No. 11F0027 No. 028
which are actually observed.31 Errors are also made because of poor coverage and other measurement problems. For example, for the Canada/U.S. bilateral comparison, there are no data for the prices of financial services. Therefore, following the OECD instructions on the data to be placed in these cells, Statistics Canada fills in the average PPP for all other commodities. As a result, users of the PPP are warned to use a confidence interval. In particular, Statistics Canada notes the OECD’s warning that “at the level of GDP, a broad and arbitrary rule of thumb is that differences in indices of real final expenditure and real final expenditure per head need to be at least five percentage points to be considered as statistically significant”.32 As with many statistics derived from the National Accounts, it is difficult to derive these confidence intervals with the normal degree of precision that comes from the application of classical statistical theory—and they must remain judgemental. It is therefore significant that the range is stated as at least 5% because it is clear from the usage of statistical agencies that even broader bounds are regarded as desirable. For example, the Australian Bureau of Statistics (2002) uses PPPs to group countries into broad categories (high, high-middle, low-middle, and low-income groups). Defining the OECD average as 100, these four groups are defined as above 120, from 100-120, from 50-99 and below 50. These ranges are a good deal larger than 5%. A Eurostat paper, Stapel (2004), also uses broad ranges—defining the lowest group as being 75% below the mean, the next group as running from 75% to 90% of the mean, the middle group as ranging from 90% of the mean to 110% above the mean, and the top group as running from 110% to 125% of the mean.33 In practice, then confidence intervals of upwards of 20 percentage points are used by statisticians for real expenditure comparisons. These confidence intervals have been derived when the PPP is being used to measure differences in real expenditures and for the average OECD country. As indicated above, it is important to be explicit about the assumptions used for calculating the price of traded goods when the PPP is being used for productivity purposes—particularly for a country such as Canada where imports and exports are such a large percentage of GDP. Recall that the calculation of the PPP can be done using either expenditures or production. Consider the differences. The PPP for expenditures (PPPe) can be written as the weighted sum of the ratio of the PPP for domestic production that is consumed (either by consumers, investment or government) in Canada (PPPc) and the PPP for imports that are consumed in Canada (PPPm).34
1) PPPe = s1 * PPPc + s2* PPPm where s2 is the share of imports and s1 is just (1-s2). This measure can be estimated from the prices collected by the Canada/U.S. PPP program of Statistics Canada that compares the relative Canada/U.S. prices of consumption and investment goods that are used in final demand. But it should be noted that this program produces only the average overall ratio (PPPe), and not the
31. See Feenstra and Reinsdorf (2003) for an approach that considers how a price index can recognize this problem. 32. These warnings can be found in Statistics Canada (1999, p. 13); in Australian Bureau of Statistics (2002); and in
Stapel (2004). 33. The same paper notes that any expenditure group categories would have even larger confidence intervals since
the commodities chosen are not very comprehensive at this level. 34. Throughout we will be assuming that U.S. domestic prices reflect domestic production prices.

Economic Analysis Research Paper Series - 25 - Statistics Canada - Catalogue No. 11F0027 No. 028
individual components (PPPc or PPPm)—because the sampling procedure that is followed either cannot or does not distinguish between the price of a good that is made domestically or that is imported. The relative price that is germane to comparing real output across countries is outlined in equation 2. The production PPP (PPPp) is a weighted average of the PPP for domestic production that goes to domestic use (PPPc) and the PPP of exports (PPPx).
2) PPPp= s3 * PPPc + s4* PPPx where s4 is the share of exports and s3 is just (1-s4). Equation 2 can be modified by adding and subtracting a term equal to s2* PPPm, which produces
3) PPPp = s3*PPPc + s2*PPPm + s4* PPPx - s2*PPPm Simplifying by adding and subtracting terms
4) PPPp = s1* PPPc + s2*PPPm + (s3-s1)*PPPc + s4*(PPPx-PPPm) + (s4-s2)(PPPm)
5) PPPp = PPPe + s4*(PPPx-PPPm) + (s4-s2)*(PPPm-PPPc) If it is assumed that the relative prices of exports and imports (expressed in Canadian as opposed to U.S. dollars) exactly reflect the exchange rate (ER), then the second term disappears and this equation reduces to
6) PPPp = s5*PPPe +(s6)*(ER) where GDP = C + I + (X-M) and s5= (C+I)/GDP and s6= (X-M)/GDP It is, however, not clear that the assumption about import and export prices that is implicit in equation 6 is correct. It is probably the case that some Canadian exports are only going to be sold in U.S. markets if they are set equal to or below the U.S. price. In this case, the PPP for exports is either going to just be equal to the exchange rate or slightly below it. It is also not clear that it is reasonable to assume that imports are set equal to U.S. prices and to choose the exchange rate as the PPP for this group, especially when tariffs on imports into Canada exist and when transport and trade margins have to be added to U.S. products marketed in Canada.35 This deviation can also result from non arm’s-length pricing. This could occur if transfer prices by multinationals impart a slightly downward bias in Canadian export prices from third-party transactions and bias upward Canadian import prices above world levels.
35. What is relevant is the relative size of the transport and trade margins that are added to imports marketed in
Canada relative to the same goods marketed in the United States.

Economic Analysis Research Paper Series - 26 - Statistics Canada - Catalogue No. 11F0027 No. 028
Table 4. Alternative PPP rates, market price (Canada/U.S.)
1985 1990 1993 1996 1999 GDP Total Economy 1) PPPm=PPPx=Pu*ER 1.20 1.23 1.22 1.20 1.18
2) PPPm=Pu*ER*(1.10) PPPx=Pu*ER*(0.90)
1.13 1.17 1.15 1.10 1.06
GDP Business Sector 3) PPPm=PPPx=Pu*ER 1.19 1.25 1.24 1.25 1.24
4) PPPm=Pu*ER*(1.10) PPPx=Pu*ER*(0.90)
1.11 1.19 1.16 1.15 1.12
Therefore, we calculate our PPPs for production using two assumptions. In the first case, we assume that both imports and exports are priced to world levels. In the second case, we assume exports are priced 10% below U.S. levels and we assume that imports are converted at the exchange rate and increased by 10%. The rate of 10% is arbitrarily chosen, not with the intent of arguing that it is the most appropriate assumption, but to demonstrate the sensitivity of the results to changing the assumption that the exchange rate is the appropriate transformation rate for imports and exports. The two different estimates of the overall PPP for the total economy and the business sector are presented in Table 4. Lines 1 and 3 make use of the assumption that U.S. import and Canadian export prices are transformed from the currency of one country to the other by the exchange rate. Lines 2 and 4 make use of the assumption that they deviate by 10% from the first assumption. Changing the assumptions about import and export prices has a significant impact on the relative price ratio. Assuming that exports are priced slightly below the U.S. price level and that imports enjoy a slight margin in the Canadian market decreases the PPP deflator by 11% in 1999.36 And of course, each of these estimates is subject to confidence intervals because the basket of goods that is chosen is neither large nor always representative. For the purpose of this study, we will examine how our answers are affected by the use of these two alternatives. 3.3 Labour input 3.3.1 Measures of labour input Accurate comparisons of inter-country differences in productivity require not only comparable measures of relative output but also measures of the intensity of factor inputs. For labour input, measures of work are required. As was the case for output measures, the SNA (1993) also defines standards that are meant to be used to produce internationally comparable measures of
36. Other assumptions can be used to provide other scenarios—but they essentially fall within the bounds provided
by these two estimates. We could, for example, make use of information on what the actual PPP was for tradable goods in 1999 and argue that import prices essentially determine this ratio and that we should therefore set the PPP for import prices equal to the actual PPP of tradable goods in 1999. And we could continue to adopt the assumption that exports are priced slightly below the exchange rate. Using these assumptions, the PPP for the total economy would be 1.15 rather than 1.18 in 1999.

Economic Analysis Research Paper Series - 27 - Statistics Canada - Catalogue No. 11F0027 No. 028
labour input. Statistics Canada’s productivity program takes data on labour market activity and produces a measure of labour input that accords with these definitions (Baldwin and Harchaoui, 2004). Two main measures of work can be found in international comparisons. The first is the number of workers (measured either by the number of jobs or the number of people employed).37 The second is the volume of work effort that is expended by workers. The latter is often measured with hours worked. Over time, the composition of the labour force has changed substantially. More jobs are non-standard (i.e., part-time, temporary, self-employed) today than 20 years ago. If labour input is measured in terms of number of jobs (workers), comparisons through time and across countries can be biased if number of jobs (workers) is used because of differences in the mix of standard and non-standard workers. Accordingly, Statistics Canada uses hours worked as the appropriate measure for the total volume of labour input in its productivity estimates.38 Statistics on hours worked that are calculated for Statistics Canada’s productivity program include: a) hours actually worked during normal periods of work; b) time worked in addition to hours worked during normal periods of work, and generally paid
at higher rates than the normal rate (overtime); c) time spent at the place of work on work such as the preparation of the workplace, repairs and
maintenance, preparation and cleaning of tools, and the preparation of receipts, time sheets and reports;
d) time spent at the place of work waiting or standing-by for such reasons as lack of supply of work, breakdown of machinery, or accidents, or time spent at the place of work during which no work is done but for which payment is made under a guaranteed employment contract; and
e) time corresponding to short periods of rest at the workplace, including tea and coffee breaks. Statistics of hours actually worked exclude: a) hours paid for but not actually worked, such as paid annual leave, paid public holidays, paid
sick leave; b) meal breaks; and c) time spent on travel to and from home and work.
37. Alternately, some studies make use of a full-time equivalent concept of employment—the number of hours
worked divided by the normal number of hours worked by a full-time employee. 38. This is also the concept recommended by the International Labour Organization. It should be noted, however,
that the OECD, until recently, has generally not used hours worked—but rather jobs or employment.

Economic Analysis Research Paper Series - 28 - Statistics Canada - Catalogue No. 11F0027 No. 028
3.3.2 Survey instruments Data on labour inputs are collected by statistical agencies from two separate sources—from firm-based employer surveys on the one hand, and from household surveys on the other hand. Firm-based instruments survey employers in order to collect data, while household surveys sample the population of individuals who are potential workers. In Canada, the firm-based instrument is the Survey of Employment, Payrolls and Hours (SEPH), which is conducted at the establishment level and depends on administrative data for employment and a survey for hours-paid for production workers and standard hours for non-production workers. In the U.S., the Current Employment Statistics survey (CES) is an employer-based program that is derived from a sample of non-farm establishments and is collected in cooperation between the federal government and state employment security agencies. In Canada, the Labour Force Survey (LFS) is the large household survey providing employment and hours worked data; in the U.S., its equivalent is the Current Population Survey (CPS). The accuracy of estimates generated by both types of surveys will depend on the sample size and the accuracy of the frame that is used for sampling purposes; however, because of the skewness in the size distributions of firms, errors in the survey frame used for firm surveys can have a much larger effect on the final estimates provided by firm-based employer surveys than inaccuracies in a household frame. The Canadian experience in this area is illustrative. Throughout most of the 1990s, the employer- based survey (SEPH) has provided estimates of jobs worked that were well below those of the Labour Force Survey (LFS)—but have gradually moved up towards those of the LFS as the frame used for SEPH improved with the use of tax data from administrative sources. Because of this, the productivity program at Statistics Canada relies on the household survey (LFS) for benchmark estimates of total jobs in the economy and their trend.39 SEPH, on the other hand, is felt to provide a better split of employment across detailed industries because firms are more accurately assigned to industries in the employer survey because of the existence of a Business Register than workers are assigned to industries based on information collected on a household survey. SEPH and other industry survey data are therefore used to split estimates of labour inputs at the aggregate level derived from the LFS into detailed industry estimates for the Canadian productivity program. Coverage of the economy often differs between firm and household surveys. For example, the coverage of the establishment survey (CES) that is used in the U.S. to derive labour input by the Bureau of Labor Statistics (BLS) for the productivity program is limited to employers and therefore does not reflect total labour market activity in that it misses the self-employed.40 Furthermore, many firm-based surveys have other coverage limitations. For example, some exclude agriculture, fishing and household services and/or establishments below a certain size
39. Since the LFS excludes Indian Reserves and, in the past, the Territories, the productivity estimates make
adjustments for these exclusions. 40. The BLS therefore supplements the estimates of production worker employment derived from the CES with
estimates of self-employment from the CPS.

Economic Analysis Research Paper Series - 29 - Statistics Canada - Catalogue No. 11F0027 No. 028
threshold.41 Household surveys, on the other hand, are not as likely to face these population limitations. A common disadvantage of firm-based surveys is that they do not produce data on the number of persons employed. Employer surveys measure jobs in the firms that they survey and not the number of people employed. To estimate the number of persons employed from data on number of jobs, the extent of multiple job-holding has to be estimated. Household surveys also directly measure the number of people employed but when they ask questions about whether an individual holds multiple jobs, they can provide measures of jobs as well.42 Productivity measures need to capture hours worked and not hours paid if they are to accurately represent the time devoted to work. Both employer and household surveys have potential problems with capturing data on hours worked. Firm-based employer surveys typically collect data on hours paid (or standard hours paid), rather than hours worked. Records of hours paid are the usual measure that employers keep in their management information systems and that therefore can be collected from an employer survey. Hours paid includes hours not worked because of vacation, illness, holiday, etc., and excludes hours worked but not paid (i.e., unpaid overtime). While a correction can be made to hours-paid, as measured in employer surveys, to derive hours worked using a supplementary survey (as was done in the U.S.), this adds an additional possibility of error that has become more important in the last two decades. The problem of estimating actual hours worked rather than hours paid is more readily solved in household surveys. A well-designed household survey will ask the respondent directly for hours worked—and with a well-crafted set of questions, household surveys can focus directly on the concept that is required for productivity purposes. Employer surveys do not do this. Furthermore, even if this was attempted in an employer survey, the employer would be unlikely to be able to report the unpaid overtime of employees that needs to be included in the hours worked estimate for productivity measures. Obtaining data in this area is important. The share of employees engaged in unpaid overtime in an average week has grown in Canada from 7.4% in 1997 to 9.1% in 2002. In comparison, paid overtime workers have increased from 6.4% to 7.5% over the same period. In terms of hours of work, unpaid overtime accounts for approximately 2.4% of total actual hours, compared with 1.8% from paid overtime. In countries where unpaid overtime is significant, failing to account for unpaid overtime leads to an underestimate of actual hours worked, and an overestimate of the labour productivity level. (Maynard and Sunter, 2003). Both employer and household surveys also suffer from reference-week problems. They both collect data for a limited number of weeks. In Canada and the United States, the household labour survey is conducted for one week each month. When that week is not representative because it contains a holiday that the other weeks do not contain (or vice versa), extrapolating the result from the reference week in which the survey was taken to the rest of the month is
41. In Canada, SEPH excludes agriculture, fishing and trapping, armed forces, religious organizations and private
household workers. 42. At least to the extent that there is no limit to the number of jobs that the survey questionnaire can handle. In
practice, many household surveys only allow for a limited number of secondary jobs.

Economic Analysis Research Paper Series - 30 - Statistics Canada - Catalogue No. 11F0027 No. 028
problematic. But while both types of surveys have to wrestle with this problem, household surveys can and have been designed to tackle the problem by posing special questions to the respondents. Employer surveys generally do not take such events into consideration. Estimates of hours worked derived from household surveys can do so when combined with other information on holidays in periods other than the reference week. One of the advantages of household surveys is that they can be designed with a set of prompts to handle special events. One approach to reducing response error is to use a series of questions that assist the respondent in reconstructing work hours for the previous week and in recalling specific events that may have reduced the number of hours worked, such as a particular holiday. Typically, the questions start with an anchor such as usual hours, then proceed to elicit information about absences, paid and unpaid overtime that may have occurred in the reference week, and then finish with a question about hours actually worked in the reference week. Sequences of questions such as these allow estimates to be derived of usual hours worked (without an usual event such as a holiday) that can be used to extrapolate the answers derived from a reference week that contains the special event to other weeks in the month when the survey was not being performed. Firm-based employer surveys tend not to capture the information that allows for these types of calculations. The Canadian LFS adopted this approach to deriving estimates of hours worked in 1976, and added some refinements in 1997. The U.S. Current Population Survey (CPS) adopted a similar approach in 1994. Before 1994, the CPS simply asked for the number of hours worked without the set of prompting questions. A further enhancement to the Canadian LFS was made in the late 1990s. Taking advantage of the fact that the LFS is administered through computer-assisted interviewing, an automated modification was made to the question on absence from work whenever a holiday had occurred during the reference week. The modified question included a reminder to respondents about the holiday. While a household survey can potentially provide more accurate data in areas that an employer survey cannot, there is nevertheless the question about overall accuracy. When it comes to estimating hours worked, household surveys are sometimes criticized for problems that arise from proxy reporting and from recall bias. Robinson and Bostrom (1994) suggest that reports by respondents on hours worked from a household labour survey are biased relative to the estimates derived from a Time Diary, though a subsequent study by Jacobs (1998), challenges the notion that problems exist. Jacobs (1998) argues that the answers to household-derived data are compatible with survey information from the same respondents on the time of departure and return from work.43 More recently, Eldridge (2004) notes that more recent versions of the CPS (the post redesign version with the new questions and prompts to deal with holidays) does not produce results that are all that different from the American Time Use Survey—at least for the reference weeks of the CPS.44
43. It is sometimes suggested that proxy reporting gives problems to household surveys because, at least in Canada,
over half of all people are covered by a proxy respondent. Lemaître (1998) suggests that inconsistencies are found as often in non-proxy as proxy responses.
44. It slightly overestimates for non-reference weeks—but the CPS in the latter case is not corrected for holidays.

Economic Analysis Research Paper Series - 31 - Statistics Canada - Catalogue No. 11F0027 No. 028
Table 5. Average annual actual weekly hours worked (all workers), 1998
Canadian Labour Force Survey
Canadian Time Use Survey
Difference (hours)
Total 33.9 34.8 -0.9 Gender
Male 37.7 38.2 -0.5 Female 29.4 30.4 -1.0
Source: Maynard and Sunter, 2004.
Researchers in other countries have compared the results of surveys of time use, which provide a detailed set of results on work hours that are captured in diaries, to the results of labour force surveys. Surveys of time use may provide data that are more accurate when the information in the diaries is collected on an ongoing basis, since the information that comes from a labour force survey often involves recall bias on the part of respondents who are expected to report their work hours in a previous period.45 However, studies in both the U.K. and Canada confirm that the results from a household survey approximate closely the results from time use surveys. The U.K. Labour Force Survey produces estimates of basic weekly hours worked that are higher than its employer earnings survey (New Earnings Survey (NES)). Across all occupations, average usual/normal basic hours worked were 39 hours and 58 minutes from the U.K. Labour Force Survey, but only 37 hours and 56 minutes from the NES (Williams, 2004). In order to investigate the validity of the LFS hours worked number, Williams (2004) compares the results that the ONS Time Use Survey produced to the U.K. Labour Force Survey. A comparison of the LFS and TUS for average usual hours worked showed the two were almost the same. Usual weekly hours worked in the main job were 39 hours and 34 minutes in the LFS and 40 hours and 9 minutes in the TUS. The U.K. study concludes that under the assumption that an accurate benchmark is provided by the Time Use survey method, similarities with the LFS average actual hours worked estimates imply that the recall approach used in the LFS is quite accurate at recording average actual hours worked at an aggregate level. A recent Finnish study (Keinänen, 2004) reports similar results in comparing the 1999-2000 Time Use survey and the LFS for that country. For the universe as a whole, the LFS reported hours worked at 33.9 hours per week while the Time Use survey reported exactly the same number. Canadian data confirm these findings. Recent work that compares the LFS to the Canadian Time Use Survey finds close similarities at the aggregate level (Table 5). The total actual hours worked derived from the LFS for 1998 was 33.9 hours while it was slightly higher in the TUS at 34.8—a difference of only 0.9 hours.
45. Time use surveys also potentially force respondents to be exhaustive in their assignment of hours during a day to
different purposes and therefore may provide more accurate estimates.

Economic Analysis Research Paper Series - 32 - Statistics Canada - Catalogue No. 11F0027 No. 028
In summary, household surveys tend to more accurately capture data on hours worked than do employer surveys for several reasons. They can directly estimate hours worked rather than hours paid. They allow the reference week problem to be resolved. They are often designed to provide more exhaustive coverage of populations. And they appear to more closely approximate the benchmark results provided by time use surveys. 3.3.3 The U.S. methodology for calculating total annual hours worked The United States productivity program primarily uses an employer survey program—the Current Employment Statistics Survey (CES)—to estimate the number of jobs and hours worked. Since the CES survey covers only non-farm employees, additional information on jobs in the self-employed and other industries (farms) that are not covered in the employer survey is added from its household survey (the CPS). Data for fishing, hunting, services to agriculture and military personnel are drawn from administrative sources. Hours data from the CES corresponds to hours paid not hours worked. Using data from the BLS Hours at Work survey that was recently replaced by the National Compensation Survey, these data on hours paid are converted to estimates of hours worked. At the present time, these adjustments are based on entitlements rather than actual days taken. Household surveys offer the possibility of making more accurate corrections directly. It is important to note that these establishment surveys collect hours data only for production and non-supervisory workers. The U.S. estimate of hours at work that uses the CES alone excludes supervisors, managers, and professionals who are most likely to have flexible schedules and, in Canada at least, work longer hours and are entitled to more vacation time than production workers.46 Hours for these workers, who represent about 30% of goods-producing industries’ workers and 15% of private service-producing industries, were traditionally added to the estimates for production workers by assuming that non-production workers devote the same hours to work as production workers (Eldridge, 2003). If non-production workers work longer hours than production workers in the U.S., as they do in Canada, the employer-based U.S. estimate of hours is downward biased relative to Canada, where non-production hours worked per job are estimated directly and are found to be higher per person than for production worker jobs. Recently, the U.S. has made an attempt to correct this problem by taking the ratio of hours worked of supervisory workers to production workers from the CPS and applying this ratio to the hours worked of production workers from the CES (Eldridge, Manser and Otto, 2004). This approach means that the U.S. estimate is based partially on the CES and partially on the CPS.
46. For a recent exploration of the impact of using the CPS to estimate the hours worked for supervisory workers,
see Eldridge, Manser and Otto (2004). This study found that supervisory hours in 1999 are underestimated by about 10%.

Economic Analysis Research Paper Series - 33 - Statistics Canada - Catalogue No. 11F0027 No. 028
Figure 1. Non-farm sector: Comparison of CPS employment (excluding self-employment and unpaid family workers) versus CES jobs (without adjustment for multiple jobs)
100,000
105,000
110,000
115,000
120,000
125,000
130,000
135,000
Jul-92 Nov-93 Apr-95 Aug-96 Jan-98 May-99 Oct-00 Feb-02 Jun-03
Month
CPS
em
ploy
men
t lev
el/C
ES
job
leve
l
CPS (excluding self-employed and unpaid family workers) CES
Finally, in the estimation of labour inputs derived from the U.S. CES, there is no adjustment made for hours worked without pay. Flexible work arrangements between employer and employees have become increasingly common. As a result, only a slight majority of workers fit into the stereotype of a “9-to-5 Monday to Friday job at a specific workplace”. New information technologies, such as lap tops, cell phones and internet connectivity, combined with new management practices, have allowed an increasing number of workers to perform at least part of their work from home and when they travel, and to work schedules outside the 9-to-5 standard. For these categories of employees, the employer is an imperfect source of information on hours worked. The alternative to the CES is the CPS that counts number of persons employed. There is a difference between the two surveys since number of jobs (when there is multiple job-holding) taken from the CES should be larger than number of employees taken from the CPS. Figure 1 compares the number of jobs that are derived from the CES to the number of employed (without self-employed or unpaid family workers that are not included in the CES) that are derived from the CPS. It is apparent that the estimate of jobs from the CES is higher than the estimate of employment that comes from the CPS (when the self-employed and unpaid family workers that are not included in the CES are excluded from the CPS).

Economic Analysis Research Paper Series - 34 - Statistics Canada - Catalogue No. 11F0027 No. 028
Figure 2. CPS jobs and CES jobs estimates adjusted for consistency with the Canadian estimation framework, total economy, seasonally adjusted, 1994-2002
115,000
120,000
125,000
130,000
135,000
140,000
145,000
150,000
1994
Q1
1994
Q3
1995
Q1
1995
Q3
1996
Q1
1996
Q3
1997
Q1
1997
Q3
1998
Q1
1998
Q3
1999
Q1
1999
Q3
2000
Q1
2000
Q3
2001
Q1
2001
Q3
2002
Q1
2002
Q3
Num
ber
of jo
bs, t
otal
eco
nom
y (i
n th
ousa
nds)
Adjusted CPS Adjusted CES
Adjustment for consistency with the Canadian labour context Adjusted CES (Total Economy - Jobs) CES jobs Add: 1. Main & Secondary Jobs in Farm Sector 2. Non-farm unincorporated self-employed main and secondary jobs 3. Non-farm unpaid family main and secondary jobs 4. Non-farm private household main and secondary jobs (including wage and salary employee jobs, self-employed jobs, and unpaid family jobs) 5. Armed Forces Less: 6. Agricultural services wage and salary main jobs 7. Farm unpaid absentees, excluding agricultural services 8. Non-Farm private household unpaid absentees Adjusted CPS (Total Economy - Jobs) CPS employment Add: 1. Multiple-Job Holders in all sectors 2. Armed Forces Less: 3. Unpaid Absentees in all sectors
Neither the CPS nor the CES directly produce the SNA concept of jobs. But they can both be adjusted to do so. To accomplish this, we start with the CPS reported employment estimate, add in multiple-job holders in all sectors and employment in the armed forces, and subtract unpaid absentees in all sectors.47 In the case of the CES, we start with total jobs, add in main and secondary jobs in the farm sector, non-farm unincorporated self-employed main and secondary jobs, non-farm unpaid family main and secondary jobs (including wage and salaried employee jobs, self-employed jobs and unpaid family jobs) and finally the armed forces and then subtract farm unpaid absentees, excluding agricultural services, non-farm private household unpaid
47. Except for the armed forces estimates, the adjustments come from the CPS.

Economic Analysis Research Paper Series - 35 - Statistics Canada - Catalogue No. 11F0027 No. 028
absentees and agricultural services wage and salary main jobs.48 When this is done (Figure 2), there are differences between the adjusted CES and the adjusted CPS series—with the former being larger than the latter in more recent years. The BLS prefers the CES over the CPS for growth rates because it develops consistent time series for the former. The CES, unlike the CPS, revises historical measures based on changes in methods and source data and continuously benchmarks to universe totals taken from State unemployment insurance records. The CPS does not receive the same attention and while it benchmarks to decennial population totals, it does so with a lag.49 Attempts have not been made to revise historical labour force series derived from the CPS to reflect changes in survey questions, the introduction of computer-assisted personal interviews or the introduction of decennial census population controls.50 And indeed, Figure 2 shows that the level of the two series (after adjusted for differences) is quite similar until 1997, but since then the CPS has been allowed to fall behind the CES. 3.3.4 The Canadian methodology for calculating total annual hours worked At Statistics Canada, the volume of hours worked that is used in the productivity program results from a combination of two independent but simultaneous exercises that use the household survey on persons employed, jobs, and hours worked, supplemented with information from the employer survey. In the first instance, the household survey (the Labour Force Survey (LFS)) is used to estimate the number of employed and the number of jobs. Data collection for the LFS occurs each month during the week following the LFS reference week. The reference week is normally the week containing the 15th day of the month. The sample size is 53,000 households, and labour-market information is collected for all persons aged 15 and over. For the Canadian productivity accounts, the official employment series at the aggregate level is derived from the LFS, which is based on persons employed, and is adjusted to the SNA concept of jobs by adding the jobs of multiple job holders and excluding those persons absent from work without pay during the reference week to produce total number of jobs. Adjustments are made for exclusions to the LFS (i.e., regular military, employed persons living on Indian reserves) to reflect the total economy. Annual average hours worked per job are derived from the same household survey (the LFS). This survey was developed to deal with the problems of estimating hours worked for a labour force that can be working for pay, working without pay, being paid but not working, or on holiday. And the nature of the survey instrument, using specially developed computer prompts, allows for accurate estimation of days that are taken off as a result of special events. For those employed, in addition to usual work hours, specific information related to the reference week is collected on hours absent from work, paid overtime, unpaid overtime and actual hours worked.
48. Agricultural service workers (taken from the CES) are subtracted to avoid double counting because they are in
the farm sector estimates derived from the CPS. All other adjustments, with exception of armed forces are taken from the CPS.
49. See Nardone et al., 2003. 50. Communications from the BLS.

Economic Analysis Research Paper Series - 36 - Statistics Canada - Catalogue No. 11F0027 No. 028
In the case of full- or part-week absence from work, the main reason for the absence is recorded. This provides a measure of hours actually worked that is then extrapolated to other weeks of the month between the survey reference weeks. For this extrapolation, consideration is given to whether a special event (holiday) took place in the reference week and whether a similar special event (holiday) occurred in the other weeks that are being estimated. For multiple jobholders, the LFS collects information on the usual and actual work hours of additional jobs, thereby providing an estimate of total hours worked on all jobs. The labour force survey is used to calculate hours worked rather than the employer-based survey because none of this important information is available from the employer-based survey. The total number of hours worked is calculated in the Canadian productivity accounts by multiplying the estimate of the number of jobs derived from the LFS and administrative sources by the hours worked per job that is derived from the LFS. A three-step procedure going from jobs to average hours worked per job to total hours worked is used because the extrapolation procedure using average hours (hours worked per person) is more stable than a procedure that just uses total hours worked. Table 6 summarises the methodology used to produce estimates of jobs and hours worked consistent with SNA concepts.
Table 6. Sources and methods
Concept Number of jobs Annual average hours per job Wage and salary workers Detailed estimates by industry and
province/territory using data from several sources, adjusted to the LFS benchmark which include adjustments for LFS exclusions.
Actual hours worked from the LFS adjusted for specific holidays and other special events.
Self-employed Detail projected from the quinquennial Census of Population, adjusted to LFS benchmarks.
Primarily LFS.
When more detailed industry data are constructed in the Canadian productivity accounts, firm-based surveys (SEPH, the Census of Manufactures,..) are used to split the benchmark totals provided by the LFS at a very detailed industry level—partly because the LFS often has far less coverage at the individual industry level than firm-based surveys, partly because the industry coding of establishment survey data is more consistent with the output measures that are mainly collected from establishment surveys and used for productivity calculations. 3.3.5 Canada/U.S. labour comparisons Because there can be differences in the estimates of labour input that are derived from different survey instruments, cross-country comparisons in this area need to tread cautiously. They need to consider the size of the differences that are produced by alternate data sources and to standardize sources and methodology as much as possible. This is what we do here for a Canada/U.S. comparison. We construct an estimate of hours worked per job for the U.S. using a methodology and data sources similar to those used in Canada that is crafted specifically for the purposes at hand, that is, a cross-country comparison of productivity level. We then apply this estimate to the official U.S. estimate of the number of jobs.

Economic Analysis Research Paper Series - 37 - Statistics Canada - Catalogue No. 11F0027 No. 028
We construct alternate estimates of hours worked per job for the United States, not because we feel that the methodology used by the BLS for their own purposes is flawed. The U.S. estimates are produced for the purposes of estimating productivity growth rates—not for cross-country comparisons of the level of productivity. And for the purposes of estimating productivity growth, using the CES as opposed to the CPS may not matter much.51 Here we are asking how differences in productivity levels might best be constructed. For this exercise, we believe it is appropriate to try and use sources that are as comparable as possible for estimating the level of hours worked per job. And we feel that the strength of household surveys for calculating hours worked per job speaks in favour of their use for cross-country comparisons—especially when comparable approaches are used.52 Therefore, we apply comparable methodology to Canadian and U.S. labour force surveys to obtain an estimate of hours worked per job and then we multiply the official estimates of jobs by the estimate of hours worked per job. While we could also have chosen to use our employer survey (SEPH) to estimate hours worked, we feel that there are problems in using this source for both productivity growth and for productivity level comparisons. For the former, there have been too many changes made to the coverage of the SEPH survey in the past 20 years to use it for growth estimates over long periods. Recently, the survey has been redesigned to make use of administrative data and the coverage of the population has changed (increased) considerably. This gives an upward bias to growth in employed persons derived from the survey over certain periods of time. For level comparisons, there are other problems. In particular, the survey only collects hours-paid for production workers and usual hours for salaried workers. The difference between these two concepts and the hours worked measure has increased over time and varies over the business cycle (Maynard and Sunter, 2004). And the employer survey cannot be used to account for special events—and therefore will give incorrect estimates of hours worked per job. In order to calculate the estimate of total hours worked per job for the United States that is comparable to the one used for the Canadian productivity estimates, we make use of the U.S. CPS and follow the same procedures used to produce annualised estimates of average hours worked per job from the Canadian LFS. As is the case for the Canadian LFS, the actual hours worked in the CPS are calculated using the definitions of the SNA. They are also collected from a similar set of questions. Holidays are treated the same way in both countries—that is, the Canadian method of ascertaining the effect of holidays is applied to the U.S. data to make the estimates as comparable as possible. As we do in Canada, we then multiply these annualised average hours worked per job by the number of jobs. For this purpose, we choose essentially the jobs estimate produced from the CES by the productivity program of the BLS because it is built from a number of different sources with a better comprehensive coverage of the economy than is the CPS.53 In both Canada and the U.S., the estimates of jobs are built up from several sources because no one source covers all 51. For comparisons of the two, see National Bank of Canada (2004), Sharpe (2003). 52. We also believe that there are more similarities between the household surveys in the two countries than there are
in the employer surveys. 53. Despite the problems with the totals with regards to the number of jobs in the CPS, we believe this survey offers
superior estimates of hours worked per job for all the reasons outlined in the previous sections. Household surveys are potentially more accurate; they duplicate time use surveys; they can be adjusted appropriately to handle a myriad of detail; they can be adjusted to handle holidays in the reference period and in non-reference weeks.

Economic Analysis Research Paper Series - 38 - Statistics Canada - Catalogue No. 11F0027 No. 028
sectors. In Canada, the estimate of number of jobs comes primarily from the LFS, but it incorporates additional information on the military, the Territories and first-nation communities that are taken from other sources. In the U.S., the estimate that we use is the one that the U.S. productivity program constructs starting with the CES—because it is constructed to apply to the official SNA concept. We modify the concept slightly to meet the SNA concept employed in Canada—by adding in main and secondary jobs in the farm sector, non-farm unincorporated self-employed main and secondary jobs, non-farm unpaid family main and secondary jobs (including wage and salaried employee jobs, self-employed jobs and unpaid family jobs) and finally the armed forces and then subtract farm unpaid absentees, excluding agricultural services, non-farm private household unpaid absentees and agricultural services wage and salary main jobs. The relationship between the adjusted job number and the official estimate used by the productivity program is presented in Figure 3—along with the raw estimates produced by the CPS household survey and the CES establishment survey.
Figure 3. Official jobs (productivity program), household and establishment surveys,
seasonally adjusted, 1994-2002
100,000
105,000
110,000
115,000
120,000
125,000
130,000
135,000
140,000
145,000
150,000
1994
Q1
1994
Q3
1995
Q1
1995
Q3
1996
Q1
1996
Q3
1997
Q1
1997
Q3
1998
Q1
1998
Q3
1999
Q1
1999
Q3
2000
Q1
2000
Q3
2001
Q1
2001
Q3
2002
Q1
2002
Q3
Num
ber
of jo
bs (
in th
ousa
nds)
Official mixed of jobs and persons employed (productivity program)Adjusted official jobs (productivity program)CPSCES
Adjusted official jobs (productivity program) Official jobs (productivity program) Add: 1. Farm secondary jobs, excluding agricultural services (all class of workers) 2. Non-farm private household secondary jobs (all class of workers) 3. Non-farm unincorporated self-employed secondary jobs 4. Non-farm unpaid family secondary jobs 5. Agricultural services secondary jobs (unincorporated self-employed and unpaid family workers) Less: 6. Farm unpaid absentees 7. Non-farm private household unpaid absentees Note: The CPS is an employment estimate that includes both self-employed and unpaid family workers. The CES is an estimate of jobs that excludes these categories but that includes multiple jobs. See also Figure 1.

Economic Analysis Research Paper Series - 39 - Statistics Canada - Catalogue No. 11F0027 No. 028
Table 7. Canada and U.S. jobs and hours worked (1999)
Canada United States All Business
sector All Business
sector Number of jobs (000) 14,823 11,782 145,736 112,274 Hours worked (millions) 26,342 21,431 273,698 215,554
The estimates of comparable U.S. and Canadian employment data (jobs and hours worked) are presented in Table 7. More detailed comparisons of the results that are produced by this method and the official U.S. method are produced in Appendix B.
Table 8. Ratio of labour input in Canada to the United States
Canada/U.S. All Business
sector Number of jobs 10.2 10.5 Hours worked 9.6 9.9
The ratio of Canadian to U.S. hours worked is presented in Table 8. Whether we examine the total economy or just the business sector has little influence on the results. For the total economy, Canada has 10.2% the number of jobs in the U.S. as of 1999, but 9.6% the number of hours worked. These ratios are 10.5% and 9.9% for the business sector.54 3.4 Labour productivity levels in Canada and the United States The results of the previous sections are brought together here to provide an estimate of the relative labour productivity of Canada and the United States in 1999. The year 1999 is chosen because it is the most recent year for which final GDP estimates are available and the underlying price data are available for calculation of the PPPs.55 GDP estimates for the two countries are used and two estimates of the PPP are applied to provide a Canada/U.S. comparison. The first uses the assumption that imports and exports are converted at the exchange rate. The second estimate assumes that Canadian goods had to be priced slightly below similar U.S. goods to enable them to enter the U.S. market and that U.S. imports end up at landed prices that are slightly above the U.S. price corrected for the exchange rate. The labour input measures are derived from comparable household surveys in both countries using the Canadian methodology to interpolate between reference weeks.
54. The OECD multi country study by Scarpetta, Bassanini, Pilat and Schreyer (2000), which contains, inter alia,
Canada and the United States comparisons for 1998, uses data that is less developed than our own. It reports the ratio of Canada/U.S. hours worked per employee as 96.5% compared to our estimate of 94.6% for hours per job. The OECD ratio of Canada/U.S. employment is 10.9% while our ratio of Canada/U.S. jobs is 10.2% The OECD ratio of total hours worked in the OECD study is 10.5% while our estimate is 9.6%.
55. Source data in the 1990s are only collected at 3-year intervals. Intervening years are imputed using trends in inflation.

Economic Analysis Research Paper Series - 40 - Statistics Canada - Catalogue No. 11F0027 No. 028
Table 9. Relative Canada/U.S. labour productivity for total economy (1999)
Canada United States Canada/U.S. (%) GDP (market price at $ own currency) 982,441 9,268,400 10.6
PPP
1) assumption #1 1.18 2) assumption #2 1.06 Hours Worked 26,342 273,698 9.6
GDP/Hours worked ($U.S.) 1) Using PPP#1 31.7 33.9 93.6 2) Using PPP #2 35.2 33.9 104.1
When expressed in the respective currencies of the two countries, the relative Canada/U.S ratio of GDP in the total economy is slightly higher than the relative ratio of hours worked (10.6% and 9.6%, respectively)—Table 9. Using the first assumption about the prices of imports and exports, Canadian labour productivity in the total economy is 94% that of the United States. We must recognize the estimate of 94% is a constructed statistic with a confidence interval of at least 5 percentage points if we follow the admonition of the OECD and more if we adopt the practice of both the Australian Bureau of Statistics and of Eurostat writers. That means we cannot rule out the possibility that Canadian labour productivity in the overall economy is at least as large as that of the United States. Nor can we rule out that our relative level is at least 10 percentage points behind that of the United States. All we can say is that, with assumption #1 about import and export prices, our point estimate is about 94% of the United States with a confidence interval around this of at least 10 percentage points. In order to emphasize the sensitivity of the estimate to changes in the assumptions, we provide an example of what would happen if we assumed that Canadian goods are priced slightly below similar U.S. goods to enable them to enter the U.S. market and that U.S. imports end up at landed prices that are slightly above the U.S. price corrected for the exchange rate.56 When this is done, the point estimate for the productivity level of the Canadian economy moves to 104% of the U.S. economy. Once again, a confidence interval should be applied to this estimate of at least 10 percentage points. The relative productivity of the Canadian business sector is lower than the relative productivity of the entire Canadian economy (Table 10). Using the first assumption about the prices of imports and exports, Canadian labour productivity in the business sector is 85% that of the United States. But assuming that Canadian exports were priced slightly below similar U.S. goods to enable them to enter the U.S. market and that U.S. imports end up at landed prices that are slightly above the U.S. price corrected for the exchange rate increases the relative labour productivity to 94% that of the American.
56. Making use of the intermediate assumption that the import PPP equals the tradable PPP and that the export PPP
is derived from shaving 10% off the U.S. price (see footnote 26) would leave Canadian productivity equal to 96% of American productivity.

Economic Analysis Research Paper Series - 41 - Statistics Canada - Catalogue No. 11F0027 No. 028
Table 10. Relative Canada/U.S. labour productivity of business sector (1999)
Canada United States Canada/U.S. (%) GDP (market price at $ own currency) 759,347 7,243,400 10.5
PPP
1) assumption #1 1.24 2) assumption #2 1.12 Hours Worked 21,431 215,554 9.9
GDP/Hours worked ($U.S.) 1) Using PPP#1 28.5 33.6 84.7 2) Using PPP #2 31.6 33.6 94.0
Once more, we need to recognize that both estimates require a confidence interval. If we apply the 10 percentage point confidence interval (remembering that several statistical agencies treat this is as a lower limit), the relative productivity of the business sector could be as high as about 89% (or as low as 79%) using the first set of assumptions about imports and exports and between 89% and 99% using the second set of assumptions. The difference in the results for the total economy and the business sector is caused by differences in the measured productivity of the non-business sector. Despite the fact that the ratios of nominal GDP per worker are about the same in the two countries, the ratio of real GDP in the non-business sector in Canada compared to the U.S. is much higher than in the business sector because the relative prices that are used in the PPP calculation for government depends more on relative factor prices than actual market prices—because of the way in which PPPs are calculated for non-business sectors. These PPPs basically depend on relative wage rates, which are lower in Canada, after correcting for exchange rate differences. The PPPs for the non-business sector may of course be correct, even if they are much lower than the overall PPP and lower than for goods. The PPP data in the business sector for services, where labour determines the basic cost of the good, indicate that the prices of these commodities are considerably lower in Canada than in the United States.
4. Conclusion This comparison of the levels of labour productivity in Canada and the United States has addressed two main issues. The first is the comparability of the measures of GDP and labour inputs that the statistical agencies of each country produce. Second, we have asked how a price index can be constructed to reconcile estimates of Canadian and U.S. GDP per hour worked that are calculated in Canadian and U.S. dollars respectively. We have approached this task by first harmonizing output and labour input measures between the two countries. Harmonizing output measures required no adjustment since the two countries now use similar methods. Harmonizing the measures of labour input required slightly larger modifications. In this case, an estimate of U.S. hours worked was derived from a U.S. survey that

Economic Analysis Research Paper Series - 42 - Statistics Canada - Catalogue No. 11F0027 No. 028
is comparable to the one used in Canada and similar methodology is employed. In deriving this estimate, we adopted a methodology similar to that used in Canada to estimate average hours worked from a labour force survey. The effect of this change increased the U.S. estimates of labour inputs and therefore reduced differences in labour productivity levels from those traditionally quoted. Constructing a price index that could be applied to the two separate estimates of productivity (one in Canadian dollars and one in U.S. dollars) was more difficult than the reconciliation of the estimates of GDP and labour. A price index is required to transform Canadian GDP per hour worked calculated in Canadian dollars and U.S. GDP per hour worked calculated in U.S. dollars to a common price structure. The PPP price relatives that are produced by Statistics Canada are calculated for the purpose of examining differences in standards of living—not productivity differences. In order to adapt the price relative from the PPP used for comparing standards of living to a price relative for a productivity comparison, assumptions have to be made about whether Canadian exports have to be priced slightly below their U.S. competitors’ prices to penetrate U.S. markets or whether imports end up at landed prices that are slightly above the U.S. price corrected for the exchange rate. Our results are sensitive to the assumption that is made in this area. If we assume export and import prices are translated directly from one currency to another by the exchange rate, the overall Canadian economy is only about 94% as productive as that of the United States. If we allow for a 10 percentage-point deviation, then the productivity gap disappears. It is not our purpose to argue that the latter assumption is correct—only to indicate the range over which we should look for estimates of the true answer. It is clear that a more precise estimate requires further work on Canadian export and import prices—a subject that has received very little empirical attention. But even if we assume that import and export prices follow the law of one price, we still need to apply a confidence interval to our point estimate. We caution those who are willing to apply the law of one price and treat the estimate of Canada’s relative productivity level of 94% as having no uncertainty. Suggested confidence intervals around this estimate of at least 10 percentage points and probably higher leave us unable to reject the possibility that the Canadian economy is as productive as the American. But equally, we cannot reject the possibility that Canada is less than 90% as productive as the U.S. economy. Existing data on relative Canada/U.S. prices simply do not permit more precision. As much as interested analysts would like to have a more precise estimate of the Canadian level of productivity relative to that of the U.S., the statistics that are available do not permit it. We have also asked whether a simple measure of output per unit of labour input gives us appropriate signals about the performance of different segments of the economy. In the first instance, we have answered this by focusing both on the total economy and then on the business sector. The business sector excludes public administration, the production of the household sector, the output of owner-occupied housing, and non-profit organizations (including non-profit health and education). It is noteworthy that when this is done, the gap between Canada and the United States widens. It is tempting to draw the conclusion from this evidence that the Canadian public sector is more productive than the American; but this would be wrong. Relative prices

Economic Analysis Research Paper Series - 43 - Statistics Canada - Catalogue No. 11F0027 No. 028
calculated for the government sector are notoriously imperfect. Because there is no marketed output for the government sector, price indices are calculated for this sector by using input price indices. Most of the input into the government sector arises from wages, and Canadian wages are below those of Americans. As a result, it is not clear that we should conclude from this that the government sector is more productive in Canada—rather, it may be the result of the manner in which government output is valued in the National Accounts. This paper has left several questions unanswered—the chief one being the reasons for the differences in levels that have been measured herein. Research needs to focus on how much of the difference in productivity levels comes from differences in industrial structure. Work needs to be performed on differences in capital intensity and their importance. In an earlier study (Baldwin and Harchaoui, 2001b), we noted that capital investment in Canada has fallen behind investment in the United States. In the 1960s, investment in machinery and equipment as a percentage of GDP averaged 6.18% in Canada and 6.13% in the United States. Canada fell behind the U.S. in the 1970s (6.45% in Canada and 7.18% in the U.S.). This gap widened in the 1980s (6.54% in Canada and 7.78% in the U.S.) and continued to increase in the 1990s (6.13% in Canada and 8.20% in the U.S.). At the same time, Canada saw an increase in labour inputs that exceeded those of the United States over much of this period. All of this would have reduced the Canadian capital/labour ratio relative to that of the United States. While many factors underlie differences in labour productivity, capital intensity is one of the most important. Work, therefore, is required to measure more precisely the extent to which capital/labour ratios differ between the two countries and how much of the difference in labour productivity in the business sector might be attributed to this factor. We also need to extend our comparisons of the business sector to ask whether there are particular sectors where Canada lags behind the United States. Baldwin and Chowhan (2003) show that most of the difference in the growth in labour productivity in Canada and the United States in the 1990s disappears when the self-employed are removed from the business sector. Canada has a higher proportion of its employment in self-employment and the income per hour worked of the self-employed is much less than in the United States. Asking whether this is the prime reason behind the difference in the relative productivity of the business sector, therefore, needs to be investigated.

Economic Analysis Research Paper Series - 44 - Statistics Canada - Catalogue No. 11F0027 No. 028
Appendix A: PPPs for Canada/U.S. comparison In this table, we present the estimates of PPPs that were developed for the business and non-business definitions that are used in the body of the text—when for-profit health and education are left in the business sector.
Table A1. PPP (Canada/U.S.) for GDP at market prices—assuming both exports and imports are transformed at the exchange rate
Year Total Business Non-business 1985 1.20 1.19 1.24 1990 1.23 1.25 1.15 1993 1.22 1.24 1.17 1996 1.20 1.25 1.06 1999 1.18 1.24 1.02
Table A2. PPP (Canada/U.S.) for GDP at market prices—assuming both exports and imports are transformed at the exchange rate (minus and plus 10%)
Year Total Business Non-business 1985 1.13 1.11 1.17 1990 1.17 1.19 1.09 1993 1.15 1.16 1.09 1996 1.10 1.15 0.96 1999 1.06 1.12 0.90

Economic Analysis Research Paper Series - 45 - Statistics Canada - Catalogue No. 11F0027 No. 028
Appendix B: Estimates of labour inputs using comparable methodology We make several adjustments to official Canadian and U.S. series in order to provide comparable data on the labour input for Canada/U.S. productivity comparisons. Panel B contains the official estimates of number of jobs and hours worked per job that are used in the productivity programs of both Canada and the United States. The Canadian data on jobs are built from a number of different sources but rely heavily on the household survey—the LFS. The U.S. derives their estimates from an employer-based survey. In Canada, hours worked are derived from the LFS. In the U.S., hours worked in the productivity program come from the CES for production workers and are supplemented by the CPS for non-production workers. In Panel A, we derived an “adjusted” U.S. estimate of labour input to provide more comparable estimates to those used in Canada. We estimated average hours worked per job from the U.S. household survey using the methodology employed in Canada. This leads to changes from the official numbers used in the U.S. productivity program. We then derive an estimate of total hours worked using jobs from the official estimates and the hours worked estimate from the CPS. We utilize this construction for our cross-country calculations since the U.S. jobs estimate is a comprehensive estimate constructed from a number of different sources, much as the Canadian estimate is, but the average hours estimate comes from a comparable estimate of hours worked derived from the U.S. household survey. We derive an estimate of the business sector by excluding the same sectors in both Canada and the United States, which entails a slight change to the official Canadian estimates.
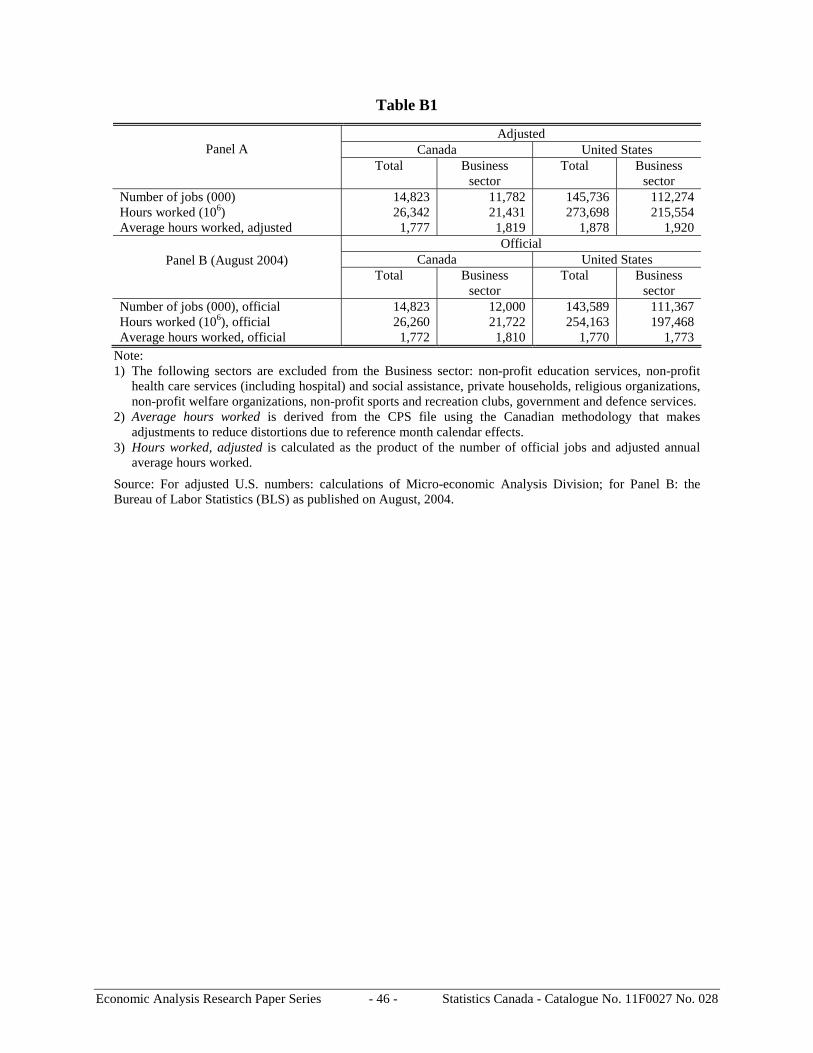
Economic Analysis Research Paper Series - 46 - Statistics Canada - Catalogue No. 11F0027 No. 028
Table B1
Adjusted Canada United States
Panel A
Total Business sector
Total Business sector
Number of jobs (000) 14,823 11,782 145,736 112,274 Hours worked (106) 26,342 21,431 273,698 215,554 Average hours worked, adjusted 1,777 1,819 1,878 1,920
Official Canada United States
Panel B (August 2004)
Total Business sector
Total Business sector
Number of jobs (000), official 14,823 12,000 143,589 111,367 Hours worked (106), official 26,260 21,722 254,163 197,468 Average hours worked, official 1,772 1,810 1,770 1,773
Note: 1) The following sectors are excluded from the Business sector: non-profit education services, non-profit
health care services (including hospital) and social assistance, private households, religious organizations, non-profit welfare organizations, non-profit sports and recreation clubs, government and defence services.
2) Average hours worked is derived from the CPS file using the Canadian methodology that makes adjustments to reduce distortions due to reference month calendar effects.
3) Hours worked, adjusted is calculated as the product of the number of official jobs and adjusted annual average hours worked.
Source: For adjusted U.S. numbers: calculations of Micro-economic Analysis Division; for Panel B: the Bureau of Labor Statistics (BLS) as published on August, 2004.

Economic Analysis Research Paper Series - 47 - Statistics Canada - Catalogue No. 11F0027 No. 028
Appendix C: Results when all health and education are placed in non-business It is sometimes argued that comparisons between the business sectors of Canada and the United States are problematic because most health and education activity in Canada is placed in the non-business sector since health and education are generally produced by publicly owned entities in Canada, while health and education are left in the business sector in the United States because of the large private health and education activity in the United States. This argument is incorrect since the U.S. also includes most of the education and health in the non-profit sector and, therefore, excludes it from the business sector. Nevertheless, it still may be the case that the for-profit portions of the health and education sectors that remain in the U.S. business sector are relatively larger than the for-profit health and education activities that remain in the Canadian business sector. To test this hypothesis, we transfer all for-profit health and education from the business sector to the non-business sector. We create two new sectors that we refer to as the commercial sector and non-commercial sectors (where the non-commercial sector now contains all health and education activity). We present below the original results for the business sector and the results for the commercial sector. The latter are basically the same. The results therefore do not depend on the allocation of private health and education.
Table C1. Relative Canada/U.S. labour productivity
Business Commercial
1) Using assumption #1 for calculation of the PPP
84.7
85.0

Economic Analysis Research Paper Series - 48 - Statistics Canada - Catalogue No. 11F0027 No. 028
References Australian Bureau of Statistics. 2002. “Purchasing Power Parities and Real Expenditures-1999 benchmark results for OECD countries,” Australian Economic Indicators. Catalogue No. 1350.0. Baldwin, J.R. and J. Chowhan. 2003. The Impact of Self-Employment on Labour Productivity Growth: A Canada/U.S. Comparison. Economic Analysis Research Paper Series 11F0027MIE2003016. Analytical Studies Branch. Ottawa: Statistics Canada. Baldwin, J.R. and P.K. Gorecki 1986. The Role of Scale in Canada/U.S. Productivity Differences in the Manufacturing Sector, 1970-79. Volume 6. Research Program of the Royal Commission on the Economic Union and Development Prospects for Canada. Toronto: University of Toronto Press. Baldwin, J.R. and A. Green. 2003. The Productivity Difference between Canada and the United States: A Historical Perspective on the late 1920s. Mimeo. Micro-economic Analysis Division. Ottawa: Statistics Canada. Baldwin, J.R. and T.M. Harchaoui. 2001a. “The Precision of Productivity Measures.” In Productivity Growth in Canada. Catalogue No. 15-204-XIE. Edited by John Baldwin and Tarek Harchaoui. Ottawa: Statistics Canada. Baldwin, J.R. and T.M. Harchaoui. 2001b. “The Structure of Investment in Canada and Its Impact on Capital Accumulation.” In Productivity Growth in Canada. Catalogue No. 15-204-XIE. Edited by John Baldwin and Tarek Harchaoui. Ottawa: Statistics Canada. Baldwin, J.R. and T.M. Harchaoui. 2004. “The Integration of the Canadian Productivity Accounts within the System of National Accounts.” Paper prepared for CRIW Conference. Washington, D.C. Card, D. and R. Freeman. 2002. “What Have Two Decades of British Economic Reform Delivered in Terms of Productivity Growth?” International Productivity Monitor 5, (Fall 2002): 41-53. Castles, I. 1997. “Review of the OECD-Eurostat PPP Program.” STD/PPP (97)5, June. Daly, D. 1972. “Uses of International Price and Output Data.” In D.J. Daly (ed.) International Comparisons of Prices and Output. Studies in Income and Wealth, Volume 37. National Bureau of Economic Research. New York: Columbia University Press. Pp. 85-141. Dryden, J., K. Reut and B. Slater. 1987. “Bilateral Comparison of Purchasing Power Parity between the United States and Canada.” Supplement to Quarterly Consumer Prices and Price Indexes. Catalogue No. 62-010 (October-December). Ottawa: Statistics Canada. Eldridge, L. 2003. Overview on measuring working time in the U.S. Bureau of Labor Statistics. Paper presented at the Paris Group Meeting, NSE, London.

Economic Analysis Research Paper Series - 49 - Statistics Canada - Catalogue No. 11F0027 No. 028
Eldridge, L. 2004. Hours Measures for Productivity Measurement and National Accounting. Paper prepared for the meeting of the Paris Group, September 2004. Eldridge, L., M. Manser and P.F. Otto. 2004. “Alternative measures of supervisory employee hours and productivity growth.” Monthly Labour Review. April: 9-28. Feenstra, R.C. and M.B. Reinsddorf. 2003. “Should Exact Index Numbers Have Standard Errors? Theory and Application to Asian Growth.” Working Paper No. 10107. National Bureau of Economic Research. Cambridge: Mass. Fortin, P. 2003. “Differences in Annual Hours Worked per Capita Between the United States and Canada.” International Productivity Monitor 6, Spring 2003, 19-37. Frank, J.G. 1977. Assessing Trends in Canada’s Competitive Position: The Case of Canada and the United States. Ottawa: Conference Board of Canada. Hooper, P. 1996. “Comparing Manufacturing Output Levels Among the Major Industrial Countries.” In P. Schreyer (ed). 1996 OECD Expert Workshop on Productivity: International Comparison and Measurement Issues. Chapter 10. Jacobs, J. 1998. “Measuring Time at Work: Are Self-Reports Accurate?” Monthly Labour Review, December. Jong, G. de. 1996. Comparative Productivity in Canadian Manufacturing. University of Groningen. Mimeo. Jorgenson, D.W. and M. Kuroda. 1990. “Productivity and International Competitiveness in Japan and the United States, 1960-85.” In C.R. Hulten (ed.). Productivity in the U.S. and Japan. University of Chicago Press. Keinänen, P. 2004. ‘Definition and Measurement of Actual Hours Worked: Finnish Experience.” Paper prepared for the Paris Group Meeting, September Lisbon. Lal, K. 2003. “Measurement of Output, Value-added, GDP.” In Canada and the United States: Similarities and Differences. Ottawa: Statistics Canada. Lee, F.C. and J. Tang. 2001. “Productivity Levels and International Competitiveness Between Canada and the United States.” In Industry-level Productivity and International Competitiveness Between Canada and the United States. Edited by D.W. Jorgenson and F. Lee. Industry Canada Research Monograph, pp. 155-79. Ottawa. Lemaître, G. 1998. “A Look at Response Errors in the Labour Force Survey.” Canadian Journal of Statistics, Vol. 16, Supplement, 1988, 127-141. Maddison, A. and B. van Ark. 1988. Comparisons of Real Output in Manufacturing. Policy Planning and Research Working Papers, WPS5, World Bank, Washington, D.C.

Economic Analysis Research Paper Series - 50 - Statistics Canada - Catalogue No. 11F0027 No. 028
Maynard, J.-P. and D. Sunter 2003. Hours of work and Productivity: concepts and measures. Statistics Canada, Paper presented at the Paris Group Meeting, NSI, London. Maynard, J.-P. and D. Sunter 2004. Principles to Measure Hours of Work. Statistics Canada, Paper that will be presented at the 2004 Paris Group Meeting, Lisbon. National Bank of Canada. 2004. “The American Productivity Puzzle.” The Economic Weekly. January 30th. Nardone, T., M. Bowler, J. Knopf, K, Kirkland and S. Wetrogan. 2003. “Examining the Discrepancy in Employment Growth between the CPS and the CES.” A paper prepared for presentation to the Federal Economic Statistics Advisory Committee. October. OECD. 1995. National Accounts, Main Aggregates. Volume 1. 1960-93. Statistics Directorate. Paris. OECD. 2001. Measuring Productivity: OECD Manual—Measurement of Aggregate and Industry-Level Productivity Growth. Paris. O’Mahony, M. 1992. “Productivity Levels in British and German Manufacturing Industry.” National Institute Economic Review, No. 139. February. Paige, D. and G. Bombach. 1959. A Comparison of National Output and Productivity. OECD. Paris. Pilat, D. 1996. Labour Productivity Levels in OECD Countries: Estimates for Manufacturing and Selected Service Sectors. Economics Department Working Papers, No. 169. Organization for Economic Cooperation and Development: Paris. OECD/GD (96) 138. Robinson, J.P. and A. Bostrom. 1994. “The Overestimated Workweek? What Time Diary Measures Suggest?” Monthly Labour Review (August). Ryten, J. 1999. “The evaluation of the International Comparison Programme.” Report to IMF, UN and World Bank, September. Scarpetta, S., A. Bassinini, D. Pilat and P. Schreyer. 2000. Economic Growth in the OECD Area: Recent Trends at the Aggregate and Sectoral Level. Economics Department Working Paper, No. 248. OECD: Paris. Sharpe, A. 2001. “Determinants of Trends in Living Standards in Canada and the United States, 1989-2000.” International Productivity Monitor, No. 2 (Spring): 3-11. Sharpe, A. 2003. “Why are Americans more productive than Canadians.” International Productivity Monitor, No. 6 (Spring): 22-42. Smith, J. 2003. “International Productivity Comparisons: An Examination of Data Sources.” International Productivity Monitor, 6 (Spring): 64-71.

Economic Analysis Research Paper Series - 51 - Statistics Canada - Catalogue No. 11F0027 No. 028
Smith., A.D., D.M.W.N. Hitchens and S.W. Davies. 1982. International Industrial Productivity: A Comparison of Britain, America and Germany. Cambridge University Press. Cambridge. Stapel, S. 2004. “Challenging the ‘Snapshot Theory’ of Purchasing Power Parities: Eurostat’s Revision of the PPP 1995-2000.” Paper prepared for the SSHRC International Conference Index Number Theory and the Measurement of Prices and Productivity. Vancouver, Canada. Statistical Commission of the United Nations. “Observations of the World Bank of the report on the evaluation of the International Comparison Program.” Economic and Social Council. United Nations. 30th session. 1999. Statistics Canada. 1993. “International Price and Quantity Comparisons: Purchasing Power Parities and Real Expenditures, Canada and the United States.” In National Income and Expenditures Accounts, Annual Estimates, 1981-92. Catalogue No. 13-201. Ottawa: Statistics Canada. Statistics Canada. 1999. “Purchasing Power Parities and Real Expenditures, United States and Canada, An Update to 1998.” In National Income and Expenditures Accounts, Quarterly Estimates, Third Quarter 1999. Catalogue No. 13-001. Ottawa: Statistics Canada. Statistics Canada. 2002. Purchasing Power Parities and Real Expenditures, United States and Canada, 1992-2001. System of National Accounts. Catalogue No. 13-604. Ottawa. Sulzenko, A. and J. Kalwarowsky. 2000. “A Policy Challenge for a Higher Standard of Living.” Isuma 1(1). System of National Accounts (SNA). 1993. Published jointly by the Commission of the European Communities/Eurostat, the International Monetary Fund, the Organisation for Economic Co-operation and Development, the Statistics Division of the former Department for Economic and Social Information and Policy Analysis and the regional commissions of the United Nations Secretariat, and the World Bank. Copyright (c) 1993, European Communities, IMF, OECD, United Nations and World Bank. Ulmer, M.J. 1972. “Comment on The Theory of International Comparisons of Real Income and Prices.” In D.J. Daly (ed). International Comparisons of Prices and Output. Studies in Income and Wealth, Volume 37. National Bureau of Economic Research. New York: Columbia University Press. Pp. 71-76. United Nations and Commission of the European Communities. 1994. World Comparisons of the Real Gross Domestic Product and Purchasing Power, 1985. Phase V of the International Comparison Programme. New York. van Ark, B. 1992. “Comparative Productivity in British and American Manufacturing.” National Institute Economic Review, No. 142: 63-74.

Economic Analysis Research Paper Series - 52 - Statistics Canada - Catalogue No. 11F0027 No. 028
van Ark, B. 1996. “Issues in Measurement and International Comparison of Productivity-An Overview.” In OECD Industry Productivity: International Comparisons and Measurement Issues, Paris: OECD, pp.19-47. van Ark, B. and M.P. Timmer. 2001. “PPS and International Productivity Comparisons: Bottlenecks and New Direction.” Joint World Bank-OECD Seminar on PPPs, Washington D.C. http:/www.oecd.org/pdf/M00019000/M00019160.pdf Walters, D. 1968. Canadian Income Levels and Growth. Staff Study No. 23. Ottawa: Economic Council of Canada. West, E.C. 1971. Canada-United States Price and Productivity Differences in Manufacturing Industries, 1963. Staff Study No. 32. Ottawa: Economic Council of Canada. Williams, R.D. 2004. “Investigating Hours Worked Measurements.” Labour Market Trends Office of National Statistics. February. London:U.K.