a comparative study on tolerance analysis approaches · tolerance analysis employing proprietary...
TRANSCRIPT
HAL Id: hal-01094270https://hal.archives-ouvertes.fr/hal-01094270
Submitted on 12 Dec 2014
HAL is a multi-disciplinary open accessarchive for the deposit and dissemination of sci-entific research documents, whether they are pub-lished or not. The documents may come fromteaching and research institutions in France orabroad, or from public or private research centers.
L’archive ouverte pluridisciplinaire HAL, estdestinée au dépôt et à la diffusion de documentsscientifiques de niveau recherche, publiés ou non,émanant des établissements d’enseignement et derecherche français ou étrangers, des laboratoirespublics ou privés.
A Comparative Study on Tolerance Analysis ApproachesBenjamin Schleich, Nabil Anwer, Z. Zhu, Lihong Qiao, Luc Mathieu, Sandro
Wartzack
To cite this version:Benjamin Schleich, Nabil Anwer, Z. Zhu, Lihong Qiao, Luc Mathieu, et al.. A Comparative Study onTolerance Analysis Approaches. International Symposium on Robust Design – ISoRD14, Aug 2014,copenhagen, Denmark. <hal-01094270>
International Symposium on Robust Design – ISoRD14
A Comparative Study on Tolerance Analysis Approaches
B. Schleich1, N. Anwer
2, Z. Zhu
3, L. Qiao
3, L. Mathieu
2, S. Wartzack
1
1. Chair of Engineering Design KTmfk, Friedrich-Alexander-University Erlangen-Nürnberg, Martensstraße 9, 91058 Erlangen, GERMANY
2. Automated Production Research Laboratory LURPA, Ecole Normale Superieure de Cachan, 61 Avenue du President Wilson, 94230 Cachan, FRANCE
3. Advanced Manufacturing Technology and Systems Research Center, Beihang University, 37 Xueyuan Road, Haidian District, Beijing, 100191, CHINA
Computer-Aided Tolerancing, Skin Model, Tolerance Simulation
Abstract
Robust product designs are characterized by their insensitivity to disturbances and noise, such as geometric part deviations, which are inevitably observed on every manufactured workpiece. These observed deviations are covered by the axioms of manufacturing imprecision and measurement uncertainty, which convey the concepts of variability and uncertainty as fundamental aspects of robust design. In order to ensure the product function though the presence of these geometric part deviations without building physical artefacts, tolerance simulations are employed in the context of computer-aided tolerancing. Motivated by the shortcomings of existing tools, the concept of Skin Model Shapes has been developed as a novel paradigm for the computer-aided tolerance analysis. This paper presents a comparative study on the standard procedure for the tolerance analysis employing proprietary CAT tools and the tolerance simulation based on Skin Model Shapes. For this purpose, two exemplary study cases are highlighted. Based on the comparisons, general remarks on the use of CAT tools in the context of tolerance analysis and robust design are derived.
1. Introduction
Robust product designs are characterized by their insensitivity to disturbances and noise factors. In order to attain such robust product designs, Robust Design Methodology (RDM) is of high importance during all development stages of engineering design (Hasenkamp, Arvidsson and Gremyr, 2009), where a widely acknowledged definition of RDM is given by Arvidsson and Gremyr (2008): “Robust Design Methodology is understood as systematic efforts to achieve insensitivity to noise factors. These efforts are founded on an awareness of variation and can be applied in all stages of product design.” Based on this rather generic definition, geometric variations management can be seen as a branch of RDM that deals with noise factors, which are related to the part and product geometry, and aims at ensuring the product function though the presence of geometric part deviations. The need for geometric variations management in the context of robust design is based on the fact, that geometric deviations are inevitably observed on every manufactured workpiece since they are covered by the axiom of manufacturing imprecision and the axiom of measurement uncertainty (Srinivasan, 2006). These axioms convey the concepts of variability and uncertainty as two fundamental aspects of robust design.
In general, achieving the robust design principles, namely the insensitivity to noise, the awareness of variation and the continuous applicability, by implementing RDM in industrial practice requires support by operational tools. However, a low use of RDM in practice has been reported, which has been traced back to a lack of such operational tools (Eifler, Ebro and Howard, 2013) and a deficit in quantitative models that support design teams in decision making (Thornton, Donnelly and Ertan, 2000). In the context of geometric variations management, such operational tools are subsumed under the term “Computer-Aided Tolerancing (CAT)”. They offer functionalities for the tolerance allocation and annotation in CAD models as well as for the tolerance simulation. However, these tools are quite specific and are often employed solely by experts. Furthermore, the implemented algorithms are only presented as grey boxes to the users and deciders. Thus, the benefit of these proprietary CAT tools is limited, since the results are hard to understand and to interpret, which may lead to insufficient tolerancing decisions in design and manufacturing (Mathieu and Ballu, 2007). With the aim to emphasize the need for new paradigm shifts in the context of computer-aided geometric variations management, a comparative study on the standard procedure for the tolerance analysis employing proprietary CAT tools and the tolerance simulation based on Skin Model Shapes is presented in this paper. For this purpose, two exemplary study cases are highlighted. Based on the comparisons, general remarks for the use of CAT tools in the context of robust design are derived and future challenges for the development of operational tolerance analysis tools are carved out. The paper is structured as follows. In the next section, computer-aided tolerancing approaches are briefly explained and qualitatively compared. Thereafter, two case studies are presented in order to highlight the differences and similarities of both approaches. Finally, a conclusion and an outlook are given.
2. A Brief Review on Computer-Aided Tolerancing Approaches
Geometric variations management covers manifold activities from design to manufacturing and to inspection, which are performed by many actors employing various tools. However, the consideration of geometric tolerances at early stages of the design of physical artefacts is a key issue for achieving robust product designs. Computer-Aided Tolerancing (CAT) tools have been developed in order to support these tolerancing activities during design, such as the derivation of geometric requirements, the tolerance specification, the tolerance synthesis, and the tolerance analysis as can be seen from Figure 1. For example, the derivation of geometric requirements from functional requirements is supported by the functional key characteristics (FKC) flow-down (Thornton, 1999) or the functional requirements/dimensions matrix (Islam, 2004). The traceability of these geometric requirements throughout the product development process can then be supported by adequate product models (Dufaure and Teissandier, 2008). Based on the geometric requirements, approaches for the automated generation of datum references and tolerancing schemes (Anselmetti, 2006) as well as for single-part tolerancing (Anselmetti, Chavanne, Yang and Anwer, 2010) have been proposed. The manual annotation of geometric specifications to virtual product models in CAD environments is supported by automated validity checks in modern CAT systems (Clozel, Lacour and Rance, 2012). Finally, many mathematical models for the simulation of the effects of geometric deviations and specifications on the geometric requirements have been proposed (Prisco and Giorleo, 2002; Hong and Chang, 2002; Polini, 2012), and have also been used for the tolerance design in early design stages (Ziegler and Wartzack, 2013), for the tolerance-cost optimization of mechanism (Walter and Wartzack, 2013), and for the robustness analysis of compliant assemblies (Söderberg, Lindkvist and Dahlström, 2006). In this context, particularly computer aided tolerance analysis has gained much research attention during the last decades, since the prediction of the effects of geometric deviations on the product quality without building physical prototypes is a key issue in the design and manufacturing of high quality products at moderate costs. Therefore, a focus is set on the procedure for the tolerance analysis in the following sections.
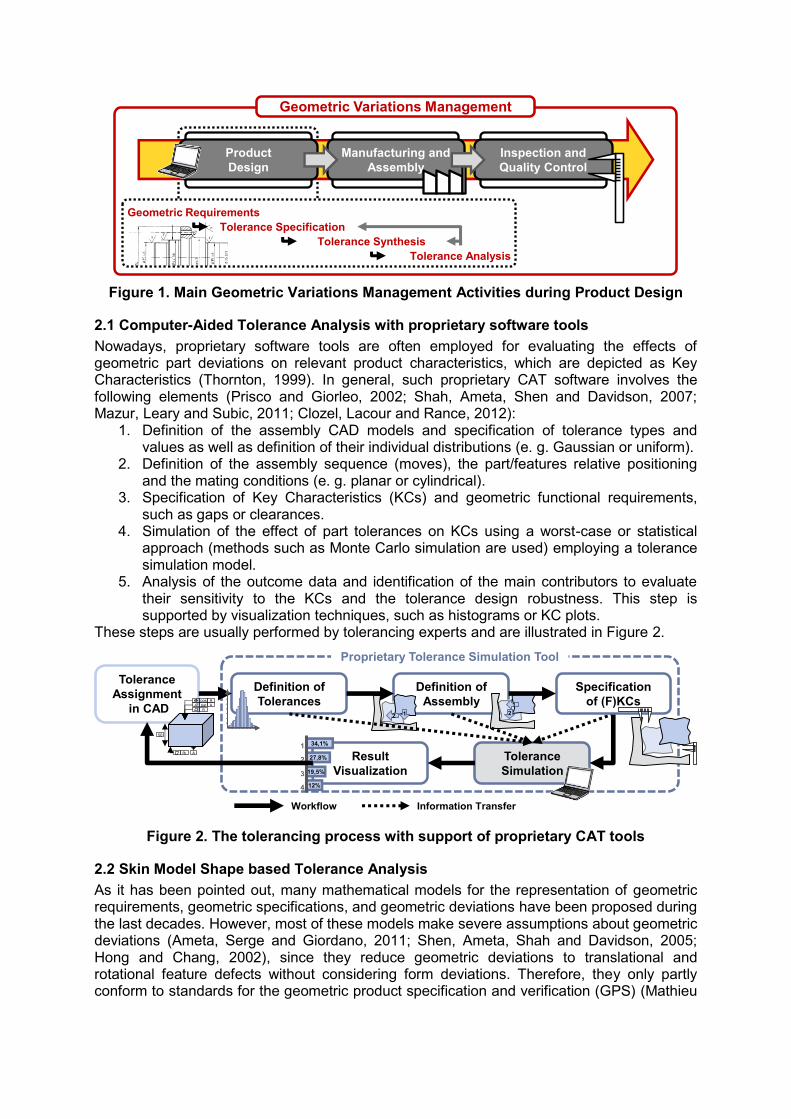
Figure 1. Main Geometric Variations Management Activities during Product Design
2.1 Computer-Aided Tolerance Analysis with proprietary software tools
Nowadays, proprietary software tools are often employed for evaluating the effects of geometric part deviations on relevant product characteristics, which are depicted as Key Characteristics (Thornton, 1999). In general, such proprietary CAT software involves the following elements (Prisco and Giorleo, 2002; Shah, Ameta, Shen and Davidson, 2007; Mazur, Leary and Subic, 2011; Clozel, Lacour and Rance, 2012):
1. Definition of the assembly CAD models and specification of tolerance types and values as well as definition of their individual distributions (e. g. Gaussian or uniform).
2. Definition of the assembly sequence (moves), the part/features relative positioning and the mating conditions (e. g. planar or cylindrical).
3. Specification of Key Characteristics (KCs) and geometric functional requirements, such as gaps or clearances.
4. Simulation of the effect of part tolerances on KCs using a worst-case or statistical approach (methods such as Monte Carlo simulation are used) employing a tolerance simulation model.
5. Analysis of the outcome data and identification of the main contributors to evaluate their sensitivity to the KCs and the tolerance design robustness. This step is supported by visualization techniques, such as histograms or KC plots.
These steps are usually performed by tolerancing experts and are illustrated in Figure 2.
Figure 2. The tolerancing process with support of proprietary CAT tools
2.2 Skin Model Shape based Tolerance Analysis
As it has been pointed out, many mathematical models for the representation of geometric requirements, geometric specifications, and geometric deviations have been proposed during the last decades. However, most of these models make severe assumptions about geometric deviations (Ameta, Serge and Giordano, 2011; Shen, Ameta, Shah and Davidson, 2005; Hong and Chang, 2002), since they reduce geometric deviations to translational and rotational feature defects without considering form deviations. Therefore, they only partly conform to standards for the geometric product specification and verification (GPS) (Mathieu
Manufacturing and
Assembly
Inspection and
Quality Control
Product
Design
Geometric Variations Management
Tolerance Synthesis
Tolerance Analysis
Geometric Requirements
Tolerance Specification
Tolerance
Assignment
in CAD
Definition of
Tolerances
Definition of
Assembly
Tolerance
Simulation
Result
Visualization
Proprietary Tolerance Simulation Tool
Workflow Information Transfer
Specification
of (F)KCs
1. 34,1%
27,8%
19,5%
12%
2.
3.
4.
12
1
2ft
par Apos A
Afb
50
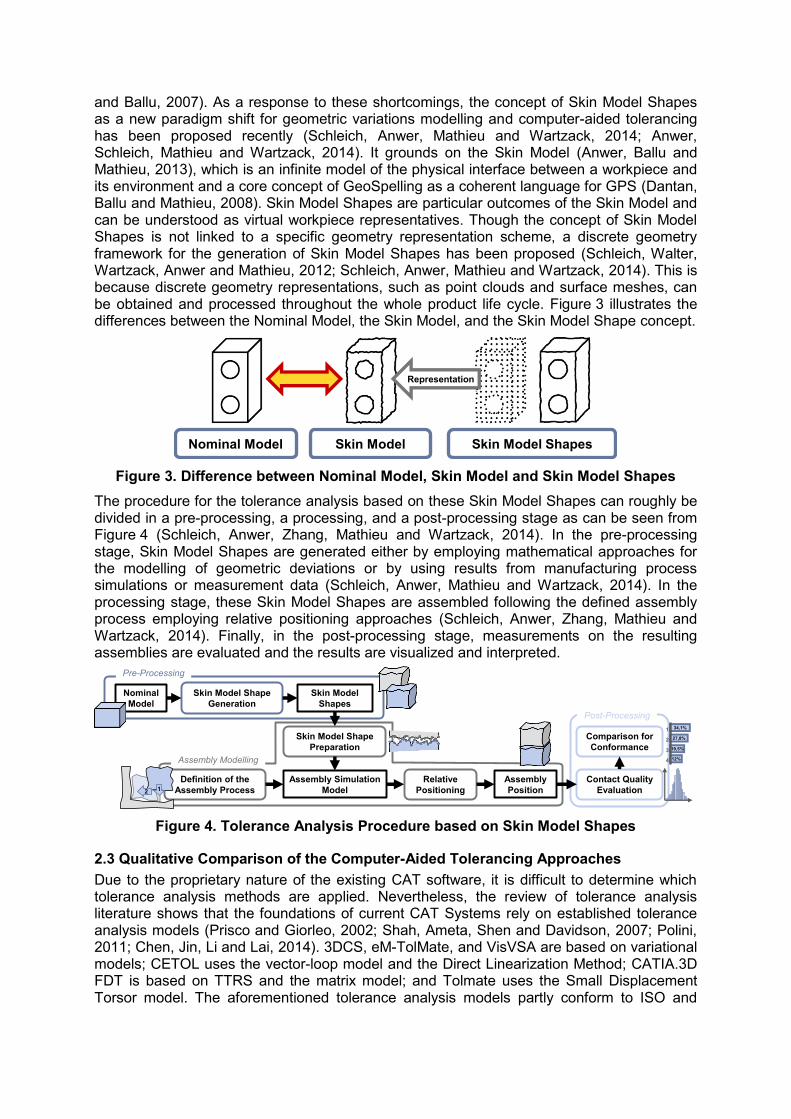
and Ballu, 2007). As a response to these shortcomings, the concept of Skin Model Shapes as a new paradigm shift for geometric variations modelling and computer-aided tolerancing has been proposed recently (Schleich, Anwer, Mathieu and Wartzack, 2014; Anwer, Schleich, Mathieu and Wartzack, 2014). It grounds on the Skin Model (Anwer, Ballu and Mathieu, 2013), which is an infinite model of the physical interface between a workpiece and its environment and a core concept of GeoSpelling as a coherent language for GPS (Dantan, Ballu and Mathieu, 2008). Skin Model Shapes are particular outcomes of the Skin Model and can be understood as virtual workpiece representatives. Though the concept of Skin Model Shapes is not linked to a specific geometry representation scheme, a discrete geometry framework for the generation of Skin Model Shapes has been proposed (Schleich, Walter, Wartzack, Anwer and Mathieu, 2012; Schleich, Anwer, Mathieu and Wartzack, 2014). This is because discrete geometry representations, such as point clouds and surface meshes, can be obtained and processed throughout the whole product life cycle. Figure 3 illustrates the differences between the Nominal Model, the Skin Model, and the Skin Model Shape concept.
Figure 3. Difference between Nominal Model, Skin Model and Skin Model Shapes
The procedure for the tolerance analysis based on these Skin Model Shapes can roughly be divided in a pre-processing, a processing, and a post-processing stage as can be seen from Figure 4 (Schleich, Anwer, Zhang, Mathieu and Wartzack, 2014). In the pre-processing stage, Skin Model Shapes are generated either by employing mathematical approaches for the modelling of geometric deviations or by using results from manufacturing process simulations or measurement data (Schleich, Anwer, Mathieu and Wartzack, 2014). In the processing stage, these Skin Model Shapes are assembled following the defined assembly process employing relative positioning approaches (Schleich, Anwer, Zhang, Mathieu and Wartzack, 2014). Finally, in the post-processing stage, measurements on the resulting assemblies are evaluated and the results are visualized and interpreted.
Figure 4. Tolerance Analysis Procedure based on Skin Model Shapes
2.3 Qualitative Comparison of the Computer-Aided Tolerancing Approaches
Due to the proprietary nature of the existing CAT software, it is difficult to determine which tolerance analysis methods are applied. Nevertheless, the review of tolerance analysis literature shows that the foundations of current CAT Systems rely on established tolerance analysis models (Prisco and Giorleo, 2002; Shah, Ameta, Shen and Davidson, 2007; Polini, 2011; Chen, Jin, Li and Lai, 2014). 3DCS, eM-TolMate, and VisVSA are based on variational models; CETOL uses the vector-loop model and the Direct Linearization Method; CATIA.3D FDT is based on TTRS and the matrix model; and Tolmate uses the Small Displacement Torsor model. The aforementioned tolerance analysis models partly conform to ISO and
Representation
Skin Model ShapesNominal Model Skin Model
Nominal
Model
Skin Model Shape
Generation
Skin Model
Shapes
Pre-Processing
Assembly Simulation
Model
Definition of the
Assembly Process
Assembly Modelling
Relative
Positioning
Assembly
Position
Skin Model Shape
Preparation
Contact Quality
Evaluation
Comparison for
Conformance
Post-Processing
12
1. 34,1%
27,8%
19,5%
12%
2.
3.
4.
ASME standards, and many issues are still to be investigated in depth, such as the combination of 3D tolerance zones, envelope and independence principles, form tolerances, material condition modifiers, datum precedence, closed form solutions in the case of Monte Carlo simulations, and Solid/Rigid body assumptions (Shah, Ameta, Shen and Davidson, 2007; Polini, 2011). Furthermore, the assumptions made by these systems, regarding for example the generation of geometric part deviations, are often not conform to real-life situations in later stages and are presented as black boxes to the designer. Thus, it is hard to derive resilient tolerancing decisions on the basis of the obtained tolerance analysis results. In contrast to the procedure supported by these systems, the tolerance analysis approach based on Skin Model Shapes is a new theory, which covers the whole product origination process from design to manufacturing and inspection to final product performance testing (Schleich and Wartzack, 2014). This is because Skin Model Shapes are based on discrete geometry representations, such as point clouds and surface meshes, which can be obtained from the nominal model by tessellation techniques during the design stage as well as from manufacturing process simulations or measurement data of part prototypes during manufacturing and inspection. Moreover, meshes obtained from FEA or CFD simulations can be directly used for the tolerance analysis. Furthermore, the approach allows the consideration of form deviations and is conform to current and future GD&T standards.
3. Experiments and Results
In the following, both approaches for the tolerance analysis are applied to two case studies in order to highlight their differences and to obtain a quantitative comparison, where 3DCS by DCS is used as a proprietary CAT tool. The first study case aims at testing the consideration of geometric specifications according to ISO standards, whereas the second case study targets studying the effects of the assembly sequence on the tolerance analysis results. Both case studies are inspired by the work of Anselmetti and Mathieu (2001).
3.1 Case Study 1 – Consideration of GD&T standards
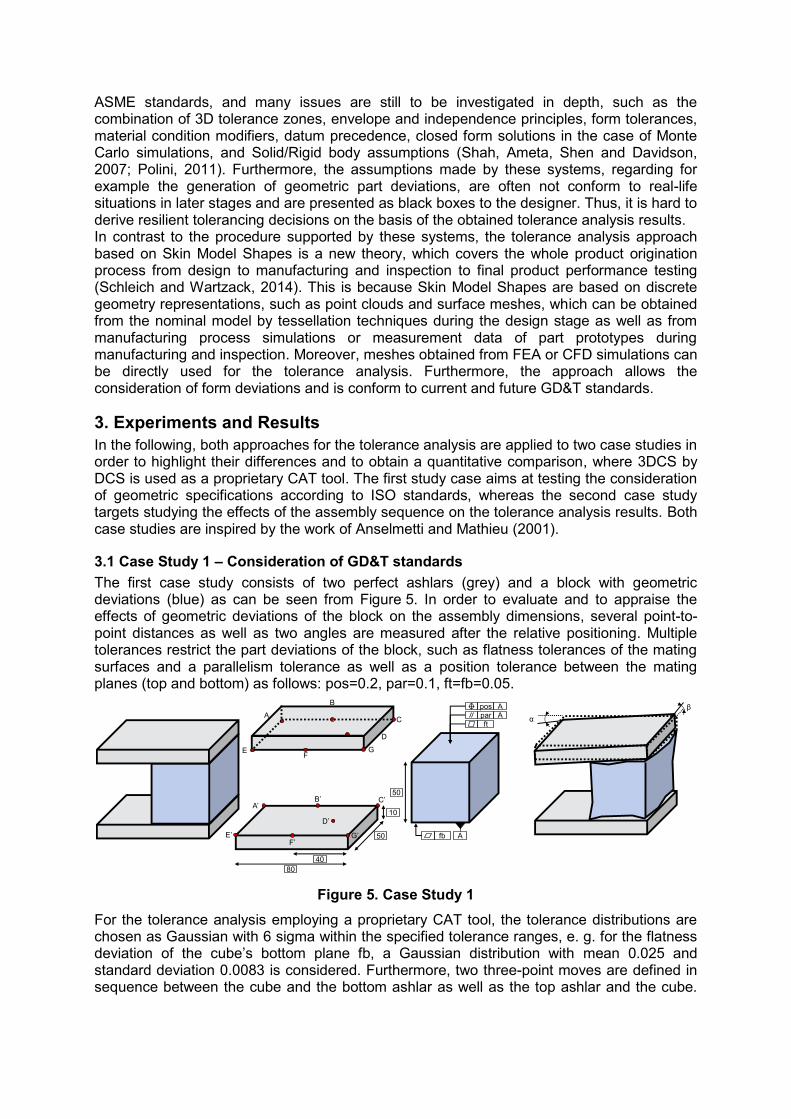
The first case study consists of two perfect ashlars (grey) and a block with geometric deviations (blue) as can be seen from Figure 5. In order to evaluate and to appraise the effects of geometric deviations of the block on the assembly dimensions, several point-to-point distances as well as two angles are measured after the relative positioning. Multiple tolerances restrict the part deviations of the block, such as flatness tolerances of the mating surfaces and a parallelism tolerance as well as a position tolerance between the mating planes (top and bottom) as follows: pos=0.2, par=0.1, ft=fb=0.05.
Figure 5. Case Study 1
For the tolerance analysis employing a proprietary CAT tool, the tolerance distributions are chosen as Gaussian with 6 sigma within the specified tolerance ranges, e. g. for the flatness deviation of the cube’s bottom plane fb, a Gaussian distribution with mean 0.025 and standard deviation 0.0083 is considered. Furthermore, two three-point moves are defined in sequence between the cube and the bottom ashlar as well as the top ashlar and the cube.
EF
G
CA
B
D
80
E’
A’
F’G’
C’B’
D’10
50
40
ft
par A
pos A
Afb
50
αβ
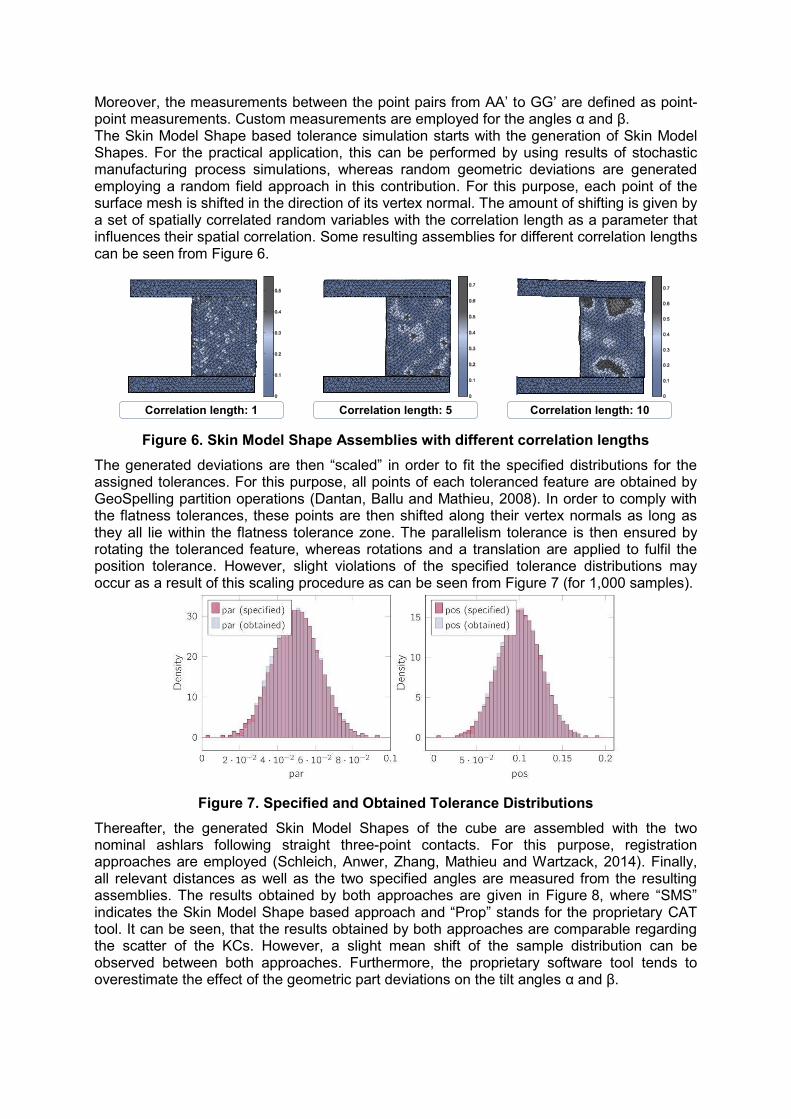
Moreover, the measurements between the point pairs from AA’ to GG’ are defined as point-point measurements. Custom measurements are employed for the angles α and β. The Skin Model Shape based tolerance simulation starts with the generation of Skin Model Shapes. For the practical application, this can be performed by using results of stochastic manufacturing process simulations, whereas random geometric deviations are generated employing a random field approach in this contribution. For this purpose, each point of the surface mesh is shifted in the direction of its vertex normal. The amount of shifting is given by a set of spatially correlated random variables with the correlation length as a parameter that influences their spatial correlation. Some resulting assemblies for different correlation lengths can be seen from Figure 6.
Figure 6. Skin Model Shape Assemblies with different correlation lengths
The generated deviations are then “scaled” in order to fit the specified distributions for the assigned tolerances. For this purpose, all points of each toleranced feature are obtained by GeoSpelling partition operations (Dantan, Ballu and Mathieu, 2008). In order to comply with the flatness tolerances, these points are then shifted along their vertex normals as long as they all lie within the flatness tolerance zone. The parallelism tolerance is then ensured by rotating the toleranced feature, whereas rotations and a translation are applied to fulfil the position tolerance. However, slight violations of the specified tolerance distributions may occur as a result of this scaling procedure as can be seen from Figure 7 (for 1,000 samples).
Figure 7. Specified and Obtained Tolerance Distributions
Thereafter, the generated Skin Model Shapes of the cube are assembled with the two nominal ashlars following straight three-point contacts. For this purpose, registration approaches are employed (Schleich, Anwer, Zhang, Mathieu and Wartzack, 2014). Finally, all relevant distances as well as the two specified angles are measured from the resulting assemblies. The results obtained by both approaches are given in Figure 8, where “SMS” indicates the Skin Model Shape based approach and “Prop” stands for the proprietary CAT tool. It can be seen, that the results obtained by both approaches are comparable regarding the scatter of the KCs. However, a slight mean shift of the sample distribution can be observed between both approaches. Furthermore, the proprietary software tool tends to overestimate the effect of the geometric part deviations on the tilt angles α and β.
Correlation length: 1 Correlation length: 5 Correlation length: 10

Figure 8. Results of Case Study 1 for a commercial CAT tool (Prop) and the tolerance analysis based on Skin Model Shapes (SMS)
3.2 Case Study 2 – Influence of the positioning scheme
The second case study consists of two parts, where the second part (blue) is assembled in the first part (grey) as can be seen from Figure 9. In order to ensure that the resulting gap s between the parts lies within some predefined requirements, flatness deviations of the mating surfaces and the measurement surfaces as well as perpendicularity and position tolerances are assigned to the parts as follows: ft=0.05, per=0.2, pos(A|B)=1, pos(C|D)=0.4.
Figure 9. Case Study 2
s
40
Aft
ft
ftB pos A B
per A
ftpos C D
ftper C
D
30
C ft
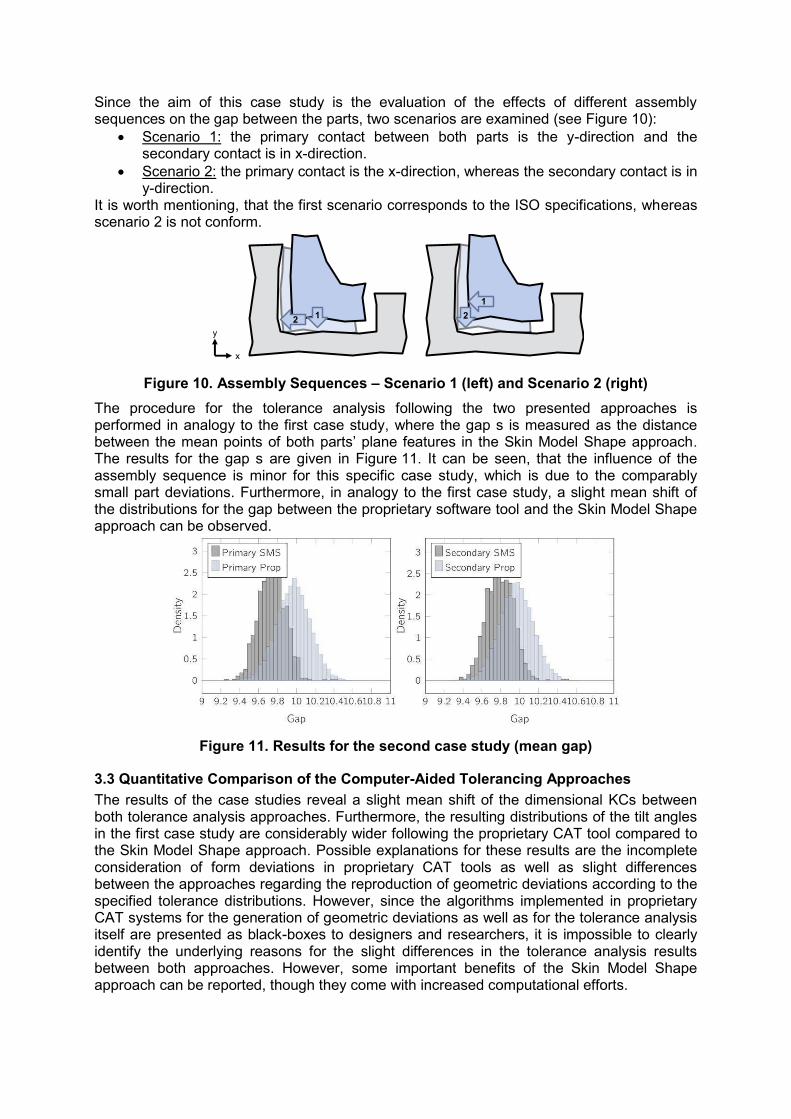
Since the aim of this case study is the evaluation of the effects of different assembly sequences on the gap between the parts, two scenarios are examined (see Figure 10): Scenario 1: the primary contact between both parts is the y-direction and the
secondary contact is in x-direction. Scenario 2: the primary contact is the x-direction, whereas the secondary contact is in y-direction.
It is worth mentioning, that the first scenario corresponds to the ISO specifications, whereas scenario 2 is not conform.
Figure 10. Assembly Sequences – Scenario 1 (left) and Scenario 2 (right)
The procedure for the tolerance analysis following the two presented approaches is performed in analogy to the first case study, where the gap s is measured as the distance between the mean points of both parts’ plane features in the Skin Model Shape approach. The results for the gap s are given in Figure 11. It can be seen, that the influence of the assembly sequence is minor for this specific case study, which is due to the comparably small part deviations. Furthermore, in analogy to the first case study, a slight mean shift of the distributions for the gap between the proprietary software tool and the Skin Model Shape approach can be observed.
Figure 11. Results for the second case study (mean gap)
3.3 Quantitative Comparison of the Computer-Aided Tolerancing Approaches
The results of the case studies reveal a slight mean shift of the dimensional KCs between both tolerance analysis approaches. Furthermore, the resulting distributions of the tilt angles in the first case study are considerably wider following the proprietary CAT tool compared to the Skin Model Shape approach. Possible explanations for these results are the incomplete consideration of form deviations in proprietary CAT tools as well as slight differences between the approaches regarding the reproduction of geometric deviations according to the specified tolerance distributions. However, since the algorithms implemented in proprietary CAT systems for the generation of geometric deviations as well as for the tolerance analysis itself are presented as black-boxes to designers and researchers, it is impossible to clearly identify the underlying reasons for the slight differences in the tolerance analysis results between both approaches. However, some important benefits of the Skin Model Shape approach can be reported, though they come with increased computational efforts.
12 2
1
x
y

4. Conclusion and Outlook
Geometric variations management is a highly relevant issue for the design of functioning products at low manufacturing and inspection costs. In this context, particularly the tolerance analysis is a key activity which comprises the evaluation of the effects of geometric deviations on relevant key characteristics. In this paper, the standard tolerance analysis procedure based on a proprietary computer aided tolerancing tool has been compared to the tolerance analysis based on Skin Model Shapes, as a novel concept for CAT and geometric variations management. For this purpose, both approaches have been briefly introduced and applied to two case studies, where the first one aimed at highlighting the influence of geometric part deviations on multiple functional key characteristics and the second one considered the assembly sequence as another “design” parameter especially in the field of body construction, such as in automotive and aircraft industries. Based on a qualitative and quantitative comparison between these approaches, it can be found, that the tolerance analysis framework based on Skin Model Shapes overcomes major shortcomings of proprietary CAT tools, such as the limited conformance to GD&T standards, the lacking consideration of form deviations and the missing link to subsequent steps and activities of geometric variations management. However, additional efforts are required in order to develop a comprehensive CAT theory based on the Skin Model concept. Future research in this field will focus on the consideration of further physical phenomena, such as friction and wear in the tolerance simulation models based on Skin Model Shapes, as well as on the processing of results obtained from computer-aided engineering applications, such as for manufacturing process simulations and structural reliability evaluation.
Acknowledgments
The authors gratefully acknowledge a mobility funding of the Bavarian Academic Center for France (BFHZ) under the reference number Az 15_13. The authors would also like to thank Beijing Municipal Education Commission (Build a Project) for its support.
References
Ameta, G., Serge, S. and Giordano, M., 2011. Comparison of Spatial Math Models for Tolerance Analysis: Tolerance-Maps, Deviation Domain, and TTRS. Journal of Computing and Information Science in Engineering, 11(2), Paper no. 21004. Anselmetti, B., 2006. Generation of functional tolerancing based on positioning features. Computer-Aided Design, 38(8), pp. 902–919. Anselmetti, B., Chavanne, R., Yang, J. X. and Anwer, N., 2010. Quick GPS: A new CAT system for single-part tolerancing. Computer-Aided Design, 42(9), pp. 768–780. Anselmetti, B. and Mathieu, L., 2001. Evaluation des performances des logiciels d'aide au tolérancement. In: . 2001. Integrated Design and Production CPI, Fez (Maroc), Paper No. 8. Anwer, N., Ballu, A. and Mathieu, L., 2013. The skin model, a comprehensive geometric model for engineering design. CIRP Annals - Manufacturing Technology, 62(1), pp. 143–146. Anwer, N., Schleich, B., Mathieu, L. and Wartzack, S., 2014. From Solid Modelling to Skin Model Shapes: Shifting paradigms in Computer-Aided Tolerancing. CIRP Annals - Manufacturing Technology, 63(1), pp. 137-140. Arvidsson, M. and Gremyr, I., 2008. Principles of robust design methodology. Quality and Reliability Engineering International, 24(1), pp. 23–35. Chen, H., Jin, S., Li, Z. and Lai, X., 2014. A comprehensive study of three dimensional tolerance analysis methods. Computer-Aided Design, 53(0), pp. 1–13. Clozel, P., Lacour, D. and Rance, P. A., 2012. 3D Tolerances Analysis integrated to Digital Mock Up: MECAmaster for CATIA V5. In: X. J. Jiang, ed. 2012. Proceedings of the 12th CIRP International Conference on Computer Aided Tolerancing, Huddersfield. Dantan, J.-Y., Ballu, A. and Mathieu, L., 2008. Geometrical product specifications – model for product life cycle. Computer-Aided Design, 40(4), pp. 493–501. Dufaure, J. and Teissandier, D., 2008. A tolerancing framework to support geometric specifications traceability. The International Journal of Advanced Manufacturing Technology, 36(9-10), pp. 894–907.
Eifler, T., Ebro, M. and Howard, T. J., 2013. A Classification of the industrial Relevance of Robust Design Methods. In: U. Lindemann, S. Venkataraman, Y. Kim, and S. W. Lee, eds. 2013. Proceedings of the 19th International Conference on Engineering Design ICED13, Seoul, Paper no. 511. Hasenkamp, T., Arvidsson, M. and Gremyr, I., 2009. A review of practices for robust design methodology. Journal of Engineering Design, 20(6), pp. 645–657. Hong, Y. S. and Chang, T. C., 2002. A comprehensive review of tolerancing research. International Journal of Production Research, 40(11), pp. 2425–2459. Islam, M. N., 2004. Functional dimensioning and tolerancing software for concurrent engineering applications. Computers in Industry, 54(2), pp. 169–190. Mathieu, L. and Ballu, A., 2007. A Model for a Coherent and Complete Tolerancing Process. In: J. Davidson, ed. 2007. Models for Computer Aided Tolerancing in Design and Manufacturing: Springer Netherlands, pp. 35–44. Mazur, M., Leary, M. and Subic, A., 2011. Computer Aided Tolerancing (CAT) platform for the design of assemblies under external and internal forces. Computer-Aided Design, 43(6), pp. 707–719. Polini, W., 2011. Geometric Tolerance Analysis. In: B. M. Colosimo, and N. Senin, eds. 2011. Geometric Tolerances: Springer London, pp. 39-68. Polini, W., 2012. Taxonomy of models for tolerance analysis in assembling. International Journal of Production Research, 50(7), pp. 2014–2029. Prisco, U. and Giorleo, G., 2002. Overview of current CAT systems. Integrated Computer-Aided Engineering, 9, pp. 373–387. Schleich, B., Anwer, N., Mathieu, L. and Wartzack, S., 2014. Skin Model Shapes: A new Paradigm Shift for Geometric Variations Modelling in Mechanical Engineering. Computer-Aided Design, 50, pp. 1–15. Schleich, B., Anwer, N., Zhang, W., Mathieu, L. and Wartzack, S., 2014. Skin Model Based Simulation of Contact and Mobility for Mechanical Assemblies. In: J. Tan, ed. 2014. Proceedings of the 13th CIRP Conference on Computer Aided Tolerancing, Paper no. 13. Schleich, B., Walter, M., Wartzack, S., Anwer, N. and Mathieu, L., 2012. A Comprehensive Framework for Skin Model Simulation. In: ASME, ed. 2012. Proceedings of the ASME 2012 11th Biennial Conference on Engineering Systems Design and Analysis, Nantes, pp. 567–576. Schleich, B. and Wartzack, S., 2014. How can Computer Aided Tolerancing support Closed Loop Tolerance Engineering? In: G. Moroni, and T. Tolio, eds. 2014. Proceedings of the 24th CIRP Design Conference, Milano, Italy, Paper no. 167. Shah, J. J., Ameta, G., Shen, Z. and Davidson, J., 2007. Navigating the Tolerance Analysis Maze. Computer-Aided Design and Applications, 4(5), pp. 705–718. Shen, Z., Ameta, G., Shah, J. J. and Davidson, J. K., 2005. A Comparative Study Of Tolerance Analysis Methods. Journal of Computing and Information Science in Engineering, 5, pp. 247–256. Söderberg, R., Lindkvist, L. and Dahlström, S., 2006. Computer-aided robustness analysis for compliant assemblies. Journal of Engineering Design, 17(5), pp. 411–428. Srinivasan, V., 2006. Computational Metrology for the Design and Manufacture of Product Geometry: A Classification and Synthesis. Journal of Computing and Information Science in Engineering, 7(1), pp. 3–9. Thornton, A. C., 1999. A Mathematical Framework for the Key Characteristic Process. Research in Engineering Design, 11(3), pp. 145–157. Thornton, A. C., Donnelly, S. and Ertan, B., 2000. More than Just Robust Design: Why Product Development Organizations Still Contend with Variation and its Impact on Quality. Research in Engineering Design, 12(3), pp. 127–143. Walter, M. and Wartzack, S., 2013. Statistical Tolerance-Cost-Optimization of Systems in Motion Taking into Account Different Kinds of Deviations. In: M. Abramovici, and R. Stark, eds. 2013. Smart Product Engineering: Springer Berlin Heidelberg, pp. 705–714. Ziegler, P. and Wartzack, S., 2013. Concept for tolerance design in early design stages based on skeleton models. In: U. Lindemann, S. Venkataraman, Y. Kim, and S. W. Lee, eds. 2013. Proceedings of the 19th International Conference on Engineering Design ICED13, Seoul. Benjamin Schleich Research Associate Chair of Engineering Design KTmfk, Department of Mechanical Engineering, FAU Erlangen-Nürnberg Martensstraße 9, 91058 Erlangen, GERMANY +49 (0) 9131 – 85 23 220 [email protected] | www.mfk.fau.de