a comparative study of silverlight 2 and javafx performance
TRANSCRIPT

A Comparative Study of Silverlight 2 and JavaFX Performance
Olle F.A. Öijerholm
Bachelor of Software Engineering & Management Thesis
Report No. 2009:071ISSN: 1651-4769
University of GothenburgDepartment of Applied Information TechnologyGothenburg, Sweden, June 2009

AbstractWeb applications are applications that are executed in a web browser. There are several technologies available for the development of web applications. The availability of these different technologies is a good thing. Without knowledge of the merits of the individual technologies however, it is difficult to choose which technology should be used for a particular project. In order to help solve this problem, this thesis presents a comparative evaluation of two web application technologies, Microsoft Silverlight 2 and Sun's JavaFX. The basis for the comparison has been the performance of the technologies measured through a series of benchmarks.
Keywords: Web application, Silverlight, JavaFX, Performance
AcknowledgementsI would like to thank my supervisor Alan Carlson for his help and support in working with this thesis. I would also like to thank Eva Gannerud who struggled through incomprehensible technical language in order to help improve the thesis, and for her general support. Finally I want to thank Jakov Perica for his support, and of course for thanking me in his own thesis.
Table of ContentsIntroduction..........................................................................................................................................1
Purpose.............................................................................................................................................1Relevance.........................................................................................................................................2Research Question...........................................................................................................................2Disposition.......................................................................................................................................2
Theoretical Background.......................................................................................................................3Web applications..............................................................................................................................3Silverlight 2......................................................................................................................................3JavaFX.............................................................................................................................................4Measuring Performance...................................................................................................................4
Method..................................................................................................................................................5Philosophical basis...........................................................................................................................5Overall research method..................................................................................................................5Selection of Quality Attribute..........................................................................................................5Technology Comparison Method....................................................................................................6Performance Evaluation Method.....................................................................................................6
Workload applications................................................................................................................7Data Collection...........................................................................................................................8Data Analysis............................................................................................................................10
Result..................................................................................................................................................11Graphics Performance....................................................................................................................11CPU Usage Performance...............................................................................................................12Computational Performance..........................................................................................................13
Discussion...........................................................................................................................................14Causes of the results......................................................................................................................14Impact of the results.......................................................................................................................14
Conclusion..........................................................................................................................................15References..........................................................................................................................................16
Appendix – Graphics Workload Application.....................................................................................19Description.....................................................................................................................................19Source Code...................................................................................................................................19
Silverlight..................................................................................................................................19JavaFX......................................................................................................................................25
Appendix – Computational Workload Application............................................................................31Source Code...................................................................................................................................31
Silverlight..................................................................................................................................31JavaFX......................................................................................................................................33JavaFX with Java......................................................................................................................35
Appendix – Raw Data........................................................................................................................37Graphics Performance....................................................................................................................37CPU Performance..........................................................................................................................38Computational Performance..........................................................................................................41
A Comparative Study of Silverlight 2 and JavaFX Performance
Olle ÖijerholmDepartment of Applied Information Technology
IntroductionIn the last fifteen years, the use of the world wide web has exploded, and the web is now an integrated part of many facets of everyday life. Also, the technologies that form the basis for the web have during this period undergone fast growth. A particularly interesting aspect of this is the development of web applications.
The term web application refers simply to applications that are delivered over the Internet to be executed inside a web browser. In this sense, the earliest web applications emerged as early as 1995 when JavaScript was introduced in the Netscape browser (Champeon, 2001) and provided client side scripting. Another early technology was Macromedia Flash (now Adobe Flash), which was introduced a year later (Gay, 2009) as a plug in to browsers. This expanded their capability and allowed the inclusion of vector graphics animation and interactive content in web pages.
The concept of web application is often accompanied by the term Web 2.0 that in it's current meaning was created as a description of the observed trend in the first half of the decade towards web sites with a high degree of user involvement in creating the content of the sites. When it comes to web applications, Web 2.0 described a new sort of application that exist as part of the world wide web in the sense that these web applications both consume data from the web and produces data for it. Another key aspect of web applications under web 2.0 was the idea of a “rich” user experience, where multimedia such as advanced graphics, video and audio was an integrated part of the application (O'Reilly, 2005). Many of the ideas that formed the concept of web 2.0 have influenced the technologies, such as Silverlight, Flash and JavaFX, that are used for web application development.
As described, the number of web applications has increased rapidly in later years. A contributing reason for this development is that the techniques for building web applications have become more advanced, providing increased functionality. A trend that has begun to emerge is the use of web applications as an alternative to desktop applications. In the long term one might speculate that web applications could replace desktop applications as the primary software platform for many tasks. Web applications have also become increasingly popular for business to business purposes.
A further background for this thesis, is a discussion with a customer for a previous project in which a questionnaire authoring desktop application, called Questionnaire, was developed. The customer indicated a desire for Questionnaire to be available as a web-based application usable both internally and in a business to business fashion. This thesis would form part of an evaluation of the technologies that were of interest for that project, even if the content of the thesis is not targeted at solving that problem.
PurposeThis thesis presents a comparison and an evaluation of web application technologies. The technologies that will be compared in this thesis are Microsoft Silverlight (version 2.0) and JavaFX.
1
These technologies are described further in the Theoretical Background section. The comparison is based on the technologies performance.
The purpose of the evaluation is to understand the performance characteristics of the technologies so that the appropriate technology can be used in the development of a web application. The purpose is not to nominate the technology which is better overall or better for a specified application but to serve as the basis for selecting the appropriate technology for a range of projects where the attribute described is considered relevant. When using the results in this thesis as part of a technology evaluation, the notion of project relevance is important. Before using the results of this thesis for a particular project, that project should be analyzed in order to identify what qualities are relevant in order to use the results presented here appropriately.
RelevanceSilverlight and JavaFX both support similar functionality. They both provide advanced graphics through a declarative language and the ability to integrate multimedia such as audio and video. Furthermore, the contents of applications can be easily animated through features of both technologies. They are also both able to integrate with the web at large and have facilities for accessing web services and other web based resources. Though the functionality of the technologies are similar, they don't perform their functions in the same way. It can be assumed, that this will lead to a difference in how well the software performs those functions, i.e. in it's quality.
The quality of software is important in order for the software to bring user satisfaction (Glass, 1998). When developing a web application, knowledge of the quality of the available technologies is needed in order to make an informed decision on how a the application should be developed.
Some work has been done on the issue of web application technology performance (Kanakalata, et al., 2009; Mallorie, 2008) as well as some comparative studies (Mallorie, 2008; Koller, et al., 2008). JavaFX and, to a lesser degree, Silverlight are both new technologies and have as a consequence not been well researched. In particular, there has not been any study performed which compares the two.
The studied attribute is not the only one of interest when developing web applications, a common requirement is that they are scalable, secure and reliable (Iyer, 2005). The selection of attribute is described in detail in the section Selection of Quality Attribute.
Research QuestionThe research question that will be answered in this thesis is:
What are the differences between Silverlight 2 and JavaFX with regards to performance and how may these differences possibly impact the suitability of the technologies for web application development?The study is limited to the performance of the technologies on the client side.
The overall method used in the thesis to answer this research question has been centered around quantitative experiments. The results of these quantitative experiments then form the basis for a discussion on what the impact of the differences may be for the development of different web applications. The experiments have been conducted as benchmarks of different aspects of performance using applications developed for the technologies.
DispositionThe rest of the thesis is structured as follows: After the introduction comes a section presenting the
2

theoretical background for the thesis. Then follows a section describing the method used for the research. Next the results of the performed experiments are presented followed by a discussion of the results. Finally the conclusion of the performed research is presented.
Theoretical BackgroundThis section presents a theoretical background for the thesis.
Web applicationsWeb applications are software delivered over the web at the request of a user. They are usually run inside a web browser (although techniques exist that allows them to run independently from the browser). The meaning of running inside a web browser is that the browser is responsible for downloading, initializing and displaying the output of the web application within a presented web page. The benefits of web applications are that they allow for simple deployment and updates of applications. As an application is not kept on the client machine between sessions, an update is distributed to all users automatically without requiring any specific action on the user's part other than starting the application as normal.
There are several technologies for developing web applications. Web application technologies can be categorized into two distinct kinds, “native” and plug-in based technologies, based on how they are executed by the client. The native technologies are the ones that are provided by the browser such as CSS, HTML, XML and JavaScript. The latter two form the basis for AJAX (AJAX, 2009) a technique that enables asynchronous communication between the client who executes the web application and the server that provides it (Garrett, 2005). The web applications created by these technologies can be run by all compliant browsers. As there are several implementations of the technologies (such as rendering engines and JavaScript engines) there are issues of compatibility between browsers.
The other approach to web applications is the plug-in based technologies. Plug-ins are add-ons to browsers that enable the browser to display and interact with content in a format or fashion that is not supported by the browser itself. Both Silverlight and JavaFX are provided as plug-ins to browsers. The most widely spread browser plug-in for web applications is Adobe Flash which had an adoption rate (number of clients with support for the technology) of 95% in May 2009 according to StatOwl (2009). Silverlight by comparison had at the same time a much smaller adoption rate of 27% according to the same source. JavaFX is built on Java and as a result, it only requires the presence of a Java Runtime in order to function (JavaFX FAQ, 2009). Java in turn had an adoption rate of 80% which then also constitutes the adoption rate of JavaFX.
Silverlight 2Silverlight is a programmable web browser plug-in developed by Microsoft who describe the technology as "a cross-browser, cross-platform implementation of the .NET Framework for building and delivering the next generation of media experiences and rich interactive applications for the Web" (Silverlight Overview, 2009).
Silverlight 2 is at this time the latest version and is also the version that has been used in this thesis. The main difference between the previous version, Silverlight 1.0, and Silverlight 2 is the support of the .NET Framework. This addition meant that Silverlight applications could be coded in any language targeting the Common Language Runtime (CLR). The Silverlight version of .NET only includes a subset of the full .NET library (Andersson, 2009). Previously, in Silverlight 1.0, a
3
scripting language such as JavaScript had to be used to program an application (Silverlight Architecture, 2009).
Silverlight is a fairly new technique, it was initially released in April 2007. The second version, Silverlight 2, was released in October 2008 (Silverlight, 2009).
JavaFXJavaFX is developed by Sun and like Silverlight it is a programmable web browser plug-in. It was officially release in December 2008, the version that has been examined in this thesis, version 1.1, was released in February 2009 (JavaFX, 2009).
JavaFX is based on the Java language which was also created by Sun. After compilation, JavaFX is distributed as a Java class file (compiled Java). As a result of this, it is very easy to write parts of a JavaFX application using the Java language or use existing Java code for a new application.
Measuring PerformanceIn order to evaluate the performance of technologies, measurements of their performance need to be performed. The types of measurements performed in this thesis are benchmarks. Benchmarking has been described as “running a set of programs on various computer and network configurations and measuring the results” (Farwell 2005). Seltzer, et al. (1999) categorizes system benchmarks into two categories, generic and application specific. Generic benchmarks are standard workloads that are used in evaluating a systems performance producing a measurement that can be used as a comparison between different systems. Application specific benchmarks on the other hand measures performance for a particular application, recognizing that depending on which system resources are used, the performance of the system will be different. As such, a single generic benchmark is thought to be insufficient or even misleading in some cases. The application specific benchmarks are further broken down into two approaches, trace and vector based methods. Trace based methods capture the behavior of the application and use it to generate a workload for the application that can be rerun and measured. It is used primarily when the behavior of the application is the result or dependent of external factors that cannot easily be recreated. The second application specific benchmark method is to characterize the performance of different abstractions of the underlying system (described by Seltzer, et al. as the system vector) using micro-benchmarks (described in the next paragraph). In a second step, the specific applications use of these abstractions is captured. In a synthesis of the two sets of data, the performance of the application can be evaluated. The benefit of this approach is that both the system and the application vector need only be produced once for a particular system and a particular application. The application vector can be synthesized with different system vectors to predict the performance on that particular system, the reverse approach is of course also possible and simplifies the measurement of different applications on the same system.
Micro-benchmarks are small benchmarks that attempt to measure the performance of a specific functionality of a system. It has been pointed out, that micro-benchmarks of applications running inside a virtual machine that perform adaptive optimization (such as Java (SunHotSpot, 2009)) can be unpredictable unless care is taken in the design of the benchmark (Goetz 2004). The performance of such applications may be modified by the virtual machine during execution, making measurements of the applications performance non-trivial to perform.
Performance is an emergent property of a system (Sommerville 2007), so in order to measure it, a system is needed that can be tested. This presents a problem for this thesis as there is no existing system upon which the tests needed in this thesis can be performed. Furthermore, even if such a system was available there is a problem of generality in the measurements that can be produced
4
when measuring such a system and how to interpret the results when making recommendation as to which technology to use which is how the results of this thesis are intended to be used.
Method
Philosophical basisAs the goal of the research results presented here is to create support for practical considerations, to evaluate the appropriateness of web application technologies, a pragmatic (Creswell 2009) view was adopted when designing the research. The meaning of a pragmatist view is that the research has been tailored to provide information and conclusions that can be applied in real world scenarios. A consequence of this position is that the analysis of the results is focused on providing a basis for decisions in a practical context and that the effects that are discovered is more important than their causes.
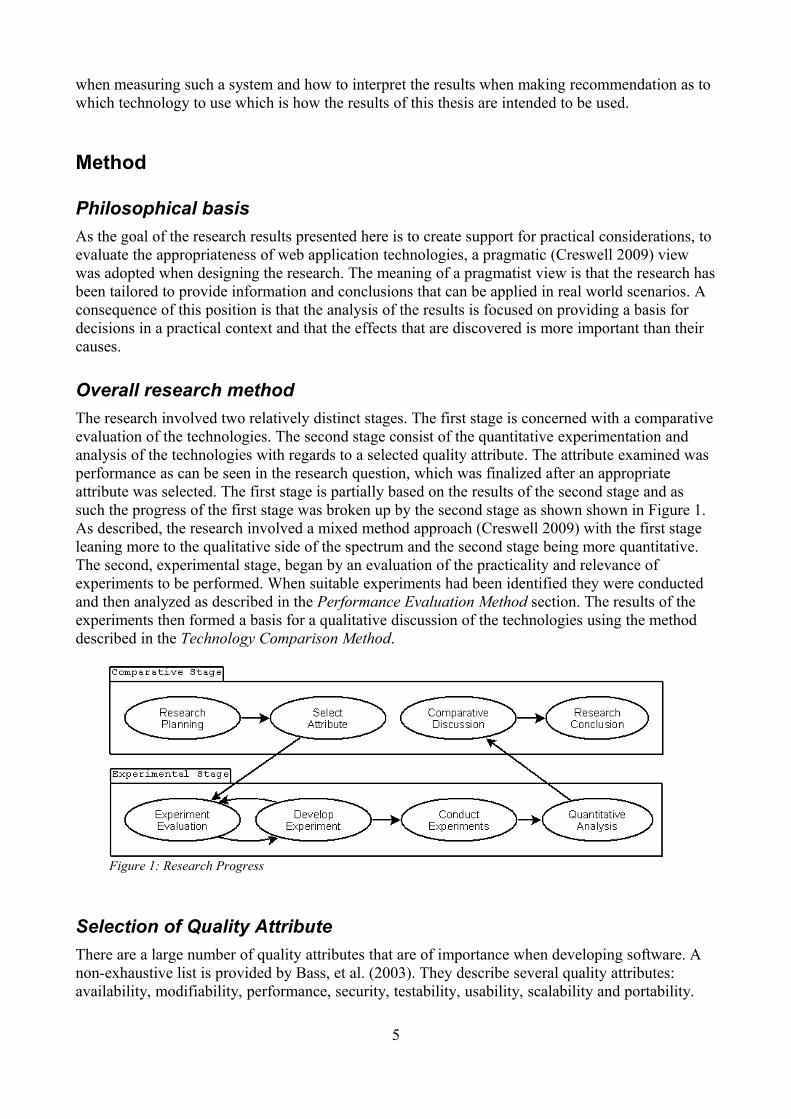
Overall research methodThe research involved two relatively distinct stages. The first stage is concerned with a comparative evaluation of the technologies. The second stage consist of the quantitative experimentation and analysis of the technologies with regards to a selected quality attribute. The attribute examined was performance as can be seen in the research question, which was finalized after an appropriate attribute was selected. The first stage is partially based on the results of the second stage and as such the progress of the first stage was broken up by the second stage as shown shown in Figure 1. As described, the research involved a mixed method approach (Creswell 2009) with the first stage leaning more to the qualitative side of the spectrum and the second stage being more quantitative. The second, experimental stage, began by an evaluation of the practicality and relevance of experiments to be performed. When suitable experiments had been identified they were conducted and then analyzed as described in the Performance Evaluation Method section. The results of the experiments then formed a basis for a qualitative discussion of the technologies using the method described in the Technology Comparison Method.
Selection of Quality AttributeThere are a large number of quality attributes that are of importance when developing software. A non-exhaustive list is provided by Bass, et al. (2003). They describe several quality attributes: availability, modifiability, performance, security, testability, usability, scalability and portability.
5
Figure 1: Research Progress
With such a large number of possible quality attributes to study, it is necessary to limit research to a relevant subset. The performance attribute chosen for this thesis was deemed relevant for web applications as described in the next paragraph.
The performance quality attribute is relevant for all applications, it is however particularly interesting for web applications. With the increased use of mobile Internet devices such as net books and mobile phones, web applications may increasingly be run on platforms with much less resources available than what can be expected from the standard desktop. The difference between standard systems and mobile systems concerning system performance from a web workload standpoint was examined Hayenga, et al. (2008). Mikkonen and Taivalsaari (2009) describe their experience of porting a web application platform to a mobile phone. For these mobile devices, a good performance in resource utilization is important as it may lead to a more power efficient device with longer lasting battery. Another significance of performance stems from how web applications are often expected to be able to deliver “rich” content. That is content that includes advanced graphics, audio and video, which can be demanding on system resources.
Technology Comparison MethodA comparison of the technologies is called for in order to fulfill the goals of the research. The result of the comparison developed in this thesis, is not meant to result in an ultimate decision for any particular software development project. The result will rather provide a basis for such decision making. As a consequence of this circumstance, a comparative analysis using an established method for decisions, such as the analytical hierarchy process method (Saaty 1990) of multi-criteria decision analysis (Figuera, et al., 2005) cannot per performed due to a lack of information. The comparison of the technologies was instead performed by comparing each of the results achieved in the experiments of the performance attribute in a structured way. The impact of these results on the suitability of the technologies for development were then evaluated by identifying, through technical or non-technical means, the aspects of development or web applications that are affected by the results. This was a non-complex process and the focus of the study has been on the quantitative experimentation and analysis of performance.
Performance Evaluation MethodThe performance that is supposed to be measured in this thesis has been described as the performance of Silverlight 2 and JavaFX. This however is not completely accurate; in order to answer the research question, it is not the performance of the technologies but rather the performance that can be achieved by an application using the technologies that is of interest. Essentially, in the terminology described earlier in the section Measuring Performance, the goal is to describe the system vector where the system in this case includes (or ultimately is) the technologies that are being studied. The problem of not having a system to test is not just a problem for the thesis, it is a problem when trying to use the results of the thesis for selecting a technology. This means that the vector-based approach to benchmarking is not a satisfying method to use as there will not be an application with which one can combine the system vector to yield usable results.
The approach taken in this thesis is a compromise between these factors. Instead of measuring on the level of system primitives it is possible to compare characteristics of the technologies on a higher level. The technologies can be evaluated based on e.g. computation speed or user interface responsiveness. It is then expected that it is possible to estimate a specific applications requirements on this higher level before an implementation of the application exists. Based on this and the high level characteristics of the system, the suitability of the technologies for the particular application can be judged satisfactorily.
6
Three types of performance has been evaluated in this thesis: graphics performance, CPU (central processing unit, the computers processor) performance and computational speed. Graphics performance was chosen as it is one of the core aspect of Rich Internet Applications, part of what makes them “rich” (Allaire, 2002). It is especially important for games and applications presenting rich user interfaces. An application does not have to put the graphics system under full load as is done in the experiments, in order to benefit from graphics performance. An application using advanced, but not extreme, graphics will have more system resources for other tasks when its graphics is less demanding. As described previously, an evaluation for a specific application will have to consider how demanding its graphics requirements will be and weigh this characteristic appropriately.
CPU performance, meaning utilization of the CPU resource, is especially important for applications that are expected to be running on system with limited resource availability for obvious reasons. On more powerful systems, CPU performance can also be important for situations where the applications demand is high or when the overall system demand is high as it can be when several applications are running concurrently. CPU performance is the only measured resource utilization performance. Memory use can also be an important performance factor. It was not measured, however, as it is difficult to distinguish how much memory is used by the technologies as they are embedded in the browser. In order to accurately determine memory use, knowledge and measurement of the internals of the technologies would probably be required.
Computational performance is the time required to perform computations and is important for most applications. Much of the same reasoning for graphics and CPU performance with regards to resource limited system can be applied to computational performance.
An important consideration for the design of the experiments have been that both workload applications should be as similar as possible for both technologies. The applications should perform the same task or achieve the same end result so that the measurements reflect differences in the technologies and not in the applications. Furthermore, the measurements of the applications should be the same, using two different methods of measuring could influence the result.
Workload applications
Graphics and CPU PerformanceIn order to accomplish the measurement goals for graphics and CPU performance, a graphical animation was developed using both technologies and then tested and measured. For Silverlight, the CLR version was used and the development was done using the C# programming language. The testing application consisted of a rendering of balls that were animated based on a physical simulation as moving and colliding objects. The workload application uses several of the graphical concepts available in both technologies. Vector graphics primitives and paths, transforms, translucency and gradients where incorporated in the design. The aim was to design the application using this variety of graphics methods in order to have the test application reflect what could be used in real world scenarios. The particular application was chosen as it allows an easy tuning of the complexity of the scene by varying the number and size of the balls. A similar workload approach was taken by Gavrilov (2009).
The use of a graphics animation as the subject of experimentation, is an attempt to strike a balance between a test application that is too simple and one that is too complex and costly to develop. The test application needs to be as simple as possible, while still being indicative of overall performance and not indicative of the run time's ability to accelerate a special case of graphics task. A further reason for avoiding a test that is too simple is that the environment in which the application is executed is rather complex as the application is hosted in a browser and supported by a large virtual
7

machine. Since the complex environment is inherent in the technologies studied, they can not be eliminated, but a complex test application should be less susceptible to outside disturbances and the problem at least mitigated.
The same application was used for both graphics and CPU performance. It was however configured differently for the different tests. When testing graphics performance, the application was allowed to run as fast as it could using the frame rate achieved by the application as the metric of it's performance. For the CPU performance experiment, the frame rate was limited using the facilities available in both technologies. This is more reflective of how the technologies are used in a real application and it improves measurement validity. Without taking this approach, the test applications of the two technologies would in actuality perform a different amount of work. As a result, the result would be biased in favor of the technology that performed worse in the graphics experiment.
The application is described more thoroughly in the appendix Graphics Workload Application.
Computational PerformanceThe workload application used for the computational performance experiment was different from the one used for the graphics and CPU experiment. It was a simpler application that was designed to just measure computational performance of an algorithm. As a result it is more vulnerable to the difficulties of micro-benchmarks described earlier. Nevertheless it was considered more important to create a deterministic workload that performed exactly the same well defined task.
The algorithm that was tested was Bubble Sort (Knuth, 1997). The algorithm itself is not important to the experiment and bubble sort was chosen mostly because it is simple and operates in place which reduces the impact of memory use. The algorithm is tasked with sorting a list of random data. In order to assure the same preconditions, the built in random number generators (RNG) were not used. The test application provides it own implementation of the simple Park-Miller RNG (Park and Miller, 1988).
The fact that JavaFX is built on top of Java means that it's performance is likely to suffer due to the additional overhead involved in providing the extra features provided by the language. This means that in a real world situation, it is unlikely that pure JavaFX would be employed to solve computationally intensive tasks. In consideration of this, two workload applications were developed for JavaFX. The second one uses Java code as a back end to perform the actual calculations which is the natural solution to this problem for affected applications.
The application can be seen in the appendix Computational Workload Application.
Data CollectionWhen performing the measurements an important aspect with the ability to influence the result is how time is measured. There are a variety of ways to measure time on a modern computer system. The Intel processor provides the RDTSC instruction (IA-32 Instruction Set, 2009) and the Windows OS has QueryPerformanceCounter (MSDN High Resolution Timer, 2009) that provide high resolution timers. The execution environment for the technologies restrict the use of these features however. As a result, timing measurements are done using the DateTime.Now facility for Silverlight and System.currentTimeMillis (Sun Java System Class, 2009) for JavaFX. The resolution of DateTime is approximately 10ms on the testing machine (MSDN DateTime.Now, 2009). The currentTimeMillis function is only documented as having a resolution that is dependent on the underlying system (Java 6 System Class, 2009). The resolution of this timer on the target machine however, is also about 10ms (Holmes, 2006) and most likely they both use the same underlying resource, the Windows system time.
8

The impact of timer resolution depends on the time elapsed during a measurement. A larger elapsed time leads to a smaller relative error. Thus, the error can be mitigated by performing more work during a single measurement (Beilner, 1988).
Graphics PerformanceMeasurements were obtained by creating the test application in such a way that it regularly sampled its own performance. This may potentially have had an impact on the results, though the processing requirements of the sampling should be very small in comparison to the overall task. Measurements were also performed in the same way for both technologies. The impact of measuring can thus also be considered as part of the workload further reducing its impact on the result
The data that was collected in order to measure the graphics performance was the number of frames that were rendered during an elapsed time. In order to accomplish this, the frame rate of the test application had to be unlocked. The method used to accomplish this is described in the appendix Graphics Workload Application. The way that measurements were performed was by having the application regularly record a time stamp and the number of frames processed. The sample rate was 2 samples per second, and the mechanism used to schedule the sampling was the built in timing mechanisms of the technologies. For Silverlight a Storyboard control was used and for JavaFX a Timeline control. The accuracy of these methods were not sufficient for the measurements and as such, a more accurate time stamp was associated with each sample. Every test run was performed for approximately 10 seconds before the tests were stopped and the measurements outputted. By using the described data collection method, the raw data contains a discrete sampling of frames over time. This raw data is then analyzed as described in the section Data Analysis.
There are two ways to collect the data that is required, either a measurement of the time it takes to render a single frame, or the number of frames that are rendered during a certain time. The latter approach was taken in this thesis as it is more appropriate for the data that is being collected as well as more in line with the pragmatic approach taken in the thesis. It also makes it possible to choose a large enough time to reduce timing errors as discussed in a previous section. In order to collect data over time, multiple samples from the same run must be taken. Technically, the second approach makes it easier to collect data over time as the number of data points can be kept down in a single run. Too many data points mean that a lot of storage (memory) is required for the collected data which could possibly influence the measurements in a non-deterministic way due to garbage collection. The alternative would be to sample the time taken for a single frame at various points during execution. The same application configuration would then have to be run several time to make it possible to compute an average case. The second approach implicitly performs this averaging during measurements. This does mean that variations over time can be expected to be smaller in the second approach. The inaccuracy in sampling scheduling however would result in a similar effect on the averages of the first approach.
CPU PerformanceCPU utilization was measured using the Performance Monitor that is a part of the Microsoft Windows operating system. The same application was used as for graphics performance.
In contrast to the testing of graphics performance, CPU performance was tested when the system was not under full load. The frame rate limiter present in both technologies were enabled for these tests as it would be in a real world scenario. This makes both technologies perform the same function and the data collected indicates the CPU performance cost of producing identical output. It can realistically be assumed that the actual work performed in order to produce that output will be different resulting in different utilization of the CPU. The data was collected using a sampling rate of 1 sample per second which was the most frequent allowed by the Performance Monitor.
9
Computational PerformanceThe data collected in the experiment was the time required to execute the sorting algorithm for data sets of varying size. In order to reduce timing errors as was described previously, the test JavaFX experiment was run 10 times within the scope of one measurement and the average results was calculated as measured time divided by the number of runs. This should effectively increase the resolution of timer by ten. For the Silverlight and JavaFX with Java back end applications the number of runs were increased to 50. The increased number of runs for these implementations are due to the great difference in speed between the technologies which was observed during development.
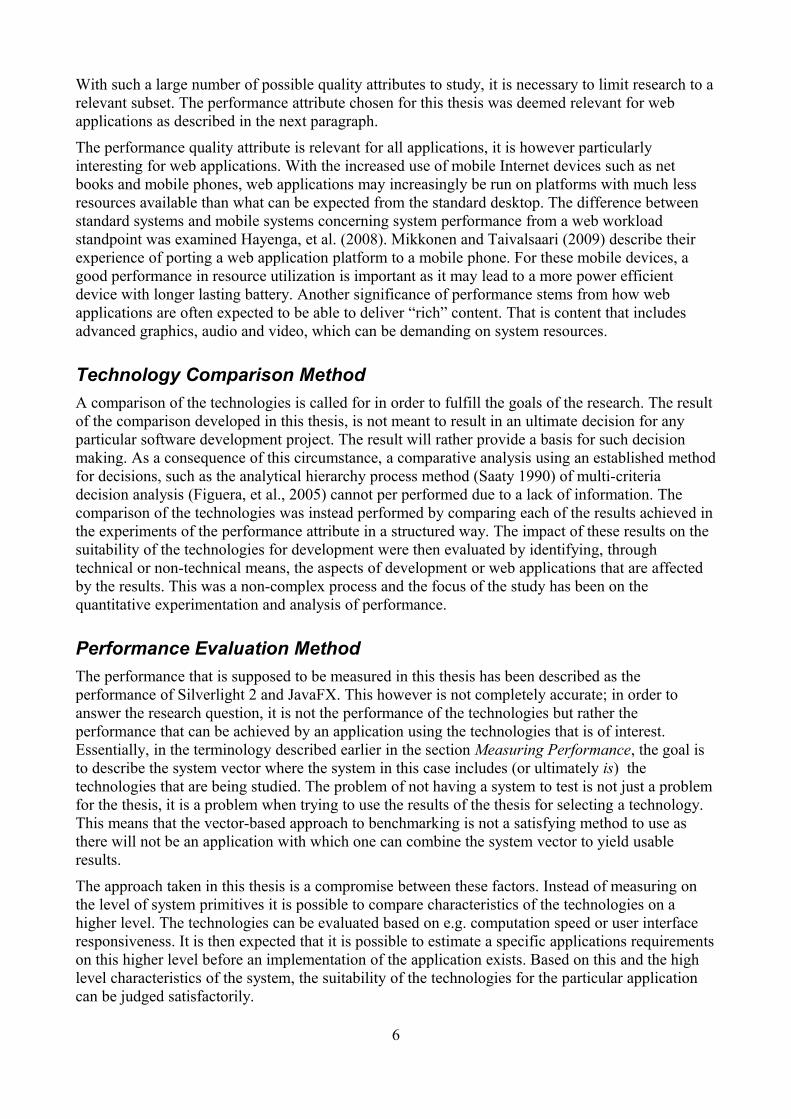
Testing MachineThe testing was performed on a machine with the specification show in Table 1. On this machine, both technologies were tested in two browsers, Microsoft Internet Explorer 8 and Mozilla Firefox 3.0.10.
Processor Intel Core2 Duo E7400 (2.8GHz Dual Core)Memory 2GB DDR2 PC6400Graphics Radeon HD 4670 1GB GDDR3Operating System Windows XP Professional SP3 32bit
Table 1: Test machine specification
Data AnalysisThe collected data of graphics performance are expressed in the result as frames per second (FPS). The benefits of this is that the FPS metric serves both as a quantitative measurement of computation time but also is important as a factor in user appreciation. When the execution speed is not sufficient to provide a good frame rate, the user will easily detect this and judge quality by this standard. It is also important to note that there is no data loss in a conversation between FPS and time per frame, the alternative representation of the data.
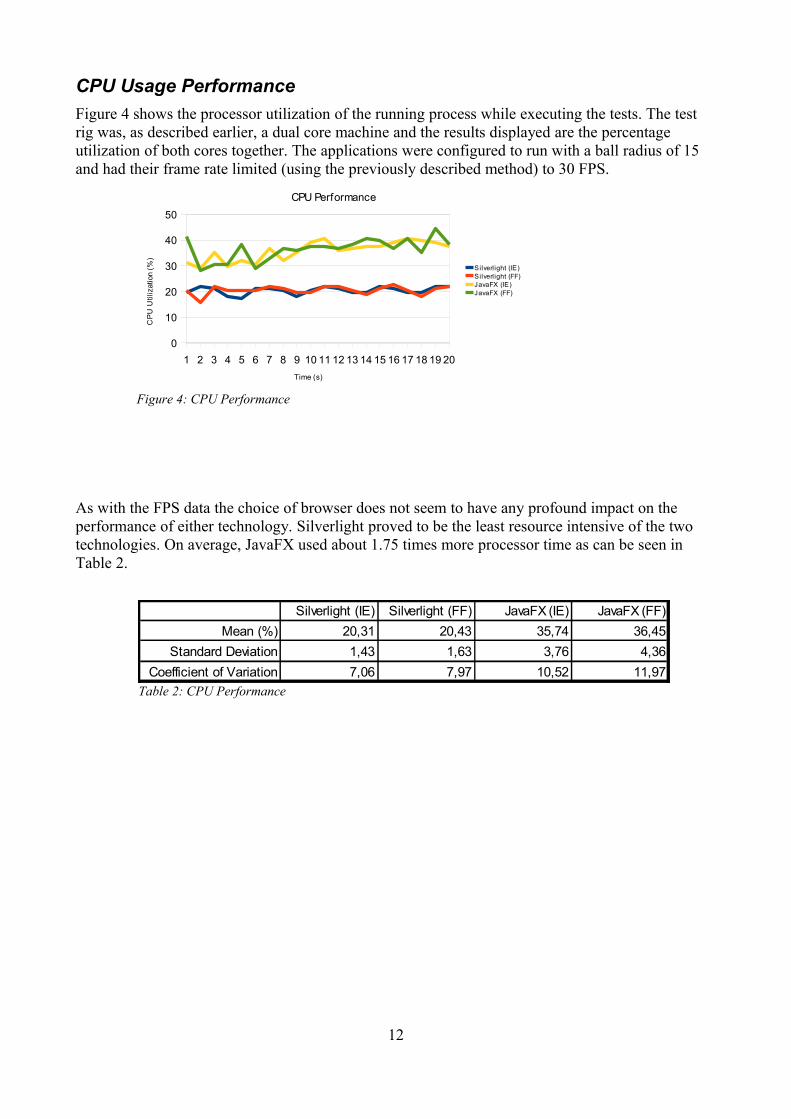
The graphics data is also described using the coefficient of variation (CV) of the data. This is computed as CV = 100 *σ / μ where σ is the standard deviation and μ is the mean. It is used to describe how the FPS of the application varies over time, and the data points used are from a single run of the application. This metric was used as it allows a comparison between the two different data sets. The standard deviation while indicative of the dispersion was not used as it is not suitable for direct comparison when the data sets have a different mean (Jaisingh, 2000). The dispersion of the FPS is important in situations where there is a need for a sustained acceptable frame rate. It is after all possible for an application like a game to have an acceptable mean FPS while still being unplayable due to intermittent episodes of low frame rate.
The results reported for CPU performance are the average CPU utilization expressed in percent as well as the standard deviation and coefficient of variation of the collected data. For CPU performance, the variation is important when utilization is very high as utilization cannot exceed 100%.
The computational performance experiment has only one result – the average time taken to complete the calculations. The method of collecting data for this experiment was chosen to limit timing errors. It would be possible to measure the time required for every single run, and calculate the standard deviation of the resulting measurements. Unfortunately, the result of that analysis would likely be more illustrative of inaccuracies in the timing facilities, than of any variations in the actual test.
10
ResultThis section presents the results of the experiments. A collection of all the raw data that formed the basis of the results (prior to analysis) can be found in the appendix Raw Data.
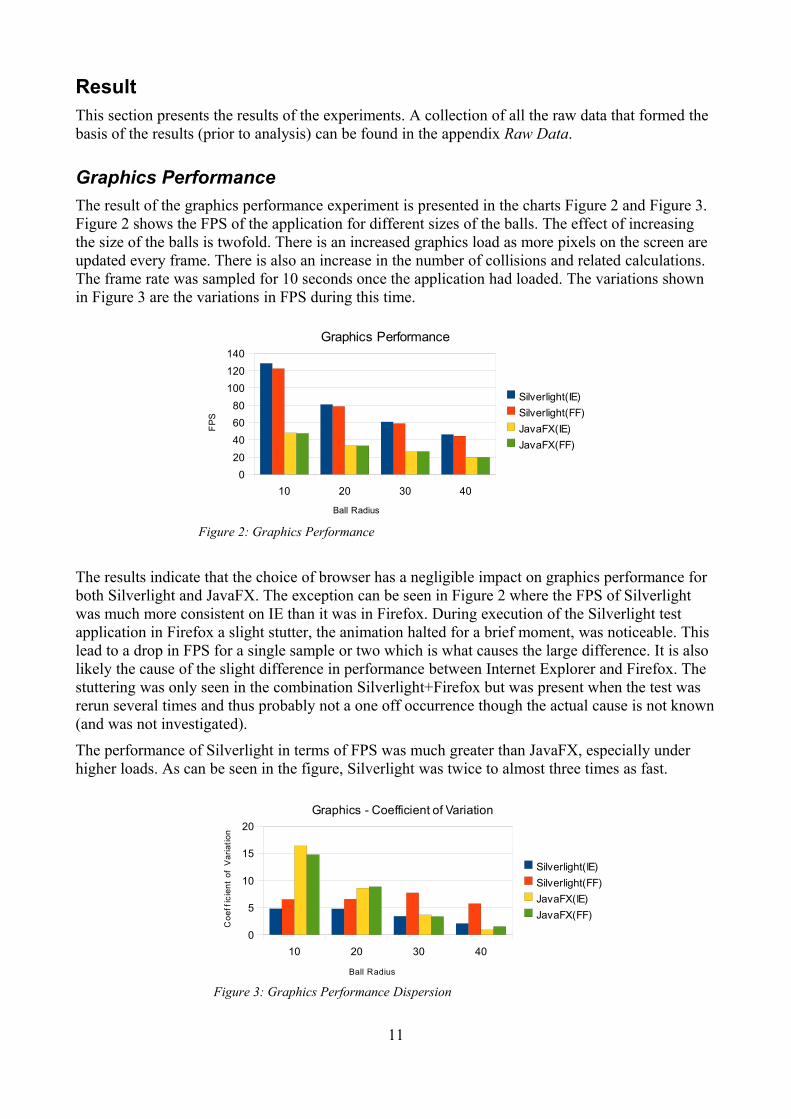
Graphics PerformanceThe result of the graphics performance experiment is presented in the charts Figure 2 and Figure 3. Figure 2 shows the FPS of the application for different sizes of the balls. The effect of increasing the size of the balls is twofold. There is an increased graphics load as more pixels on the screen are updated every frame. There is also an increase in the number of collisions and related calculations. The frame rate was sampled for 10 seconds once the application had loaded. The variations shown in Figure 3 are the variations in FPS during this time.
The results indicate that the choice of browser has a negligible impact on graphics performance for both Silverlight and JavaFX. The exception can be seen in Figure 2 where the FPS of Silverlight was much more consistent on IE than it was in Firefox. During execution of the Silverlight test application in Firefox a slight stutter, the animation halted for a brief moment, was noticeable. This lead to a drop in FPS for a single sample or two which is what causes the large difference. It is also likely the cause of the slight difference in performance between Internet Explorer and Firefox. The stuttering was only seen in the combination Silverlight+Firefox but was present when the test was rerun several times and thus probably not a one off occurrence though the actual cause is not known (and was not investigated).
The performance of Silverlight in terms of FPS was much greater than JavaFX, especially under higher loads. As can be seen in the figure, Silverlight was twice to almost three times as fast.
11
Figure 2: Graphics Performance
Figure 3: Graphics Performance Dispersion
10 20 30 400
20406080
100120140
Graphics Performance
Silverlight(IE)Silverlight(FF)JavaFX(IE)JavaFX(FF)
Ball Radius
FPS
10 20 30 400
5
10
15
20Graphics - Coefficient of Variation
Silverlight(IE)Silverlight(FF)JavaFX(IE)JavaFX(FF)
Ball Radius
Coe
ffic
ient
of
Var
iatio
n
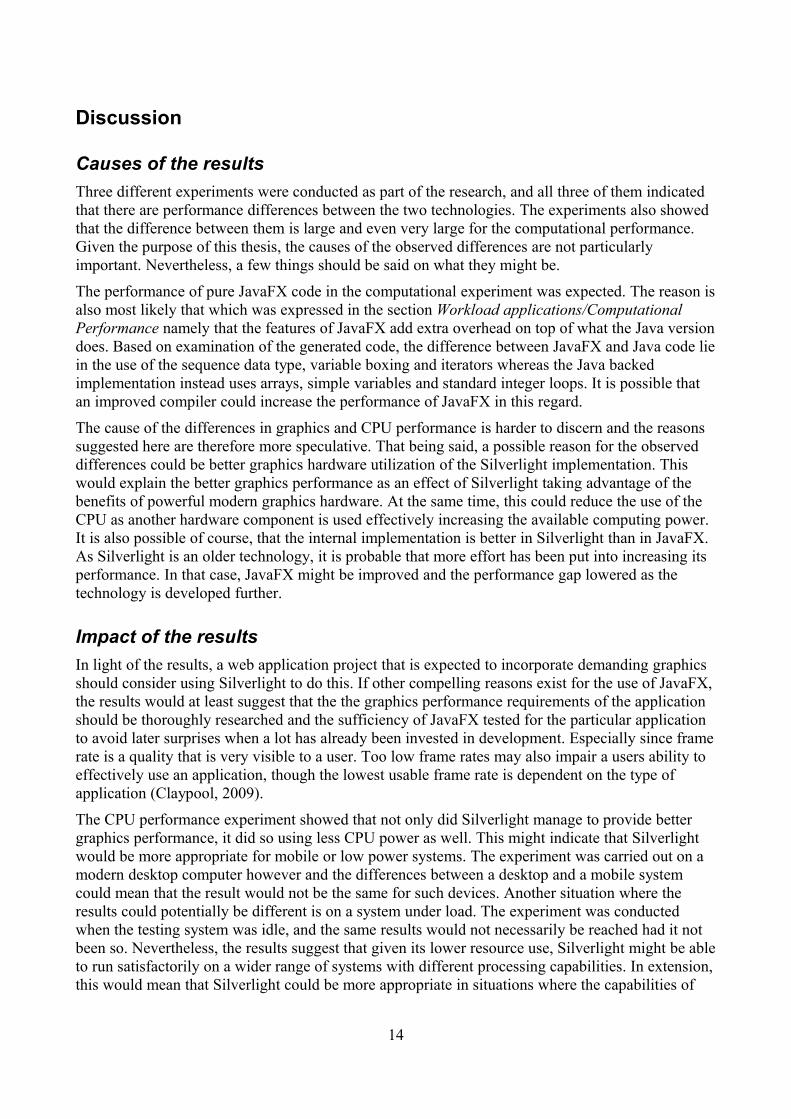
CPU Usage PerformanceFigure 4 shows the processor utilization of the running process while executing the tests. The test rig was, as described earlier, a dual core machine and the results displayed are the percentage utilization of both cores together. The applications were configured to run with a ball radius of 15 and had their frame rate limited (using the previously described method) to 30 FPS.
As with the FPS data the choice of browser does not seem to have any profound impact on the performance of either technology. Silverlight proved to be the least resource intensive of the two technologies. On average, JavaFX used about 1.75 times more processor time as can be seen in Table 2.
12
Figure 4: CPU Performance
Table 2: CPU Performance
1 2 3 4 5 6 7 8 9 10 11 12 13 14 15 16 17 18 19 200
10
20
30
40
50CPU Performance
Silverlight (IE)Silverlight (FF)JavaFX (IE)JavaFX (FF)
Time (s)
CP
U U
tiliz
atio
n (%
)
Silverlight (IE) Silverlight (FF) JavaFX (IE) JavaFX (FF)Mean (%) 20,31 20,43 35,74 36,45
Standard Deviation 1,43 1,63 3,76 4,36Coefficient of Variation 7,06 7,97 10,52 11,97

Computational PerformanceThe result of the computational performance experiment is shown in Figure 5. This experiment yielded the greatest difference between Silverlight and JavaFX as could be expected. As can be seen in the figure, Silverlight was consistently more than ten times faster than JavaFX. The picture is quite different when it comes to the version of JavaFX with a Java back end. The Java back end gives JavaFX the ability to perform much better than Silverlight in this experiment, taking less than half the time of Silverlight to perform the calculations.
Compared to themselves, both technologies show a time progression that is what one would expect of bubble sort which is a O(n^2) algorithm. As with the previous experiments, there does not seem to be any impact on the result of using different browsers.
13
Figure 5: Computational Performance
1024 2048 4096 81920
0,5
1
1,5
2
2,5
3
3,5
4
Computational Performance
Silverlight (IE)Silverlight (FF)JavaFX (IE)JavaFX (FF)JavaFX+Java (FF)JavaFX+Java (IE)
List size
Tim
e (lo
g10
ms)
Discussion
Causes of the resultsThree different experiments were conducted as part of the research, and all three of them indicated that there are performance differences between the two technologies. The experiments also showed that the difference between them is large and even very large for the computational performance. Given the purpose of this thesis, the causes of the observed differences are not particularly important. Nevertheless, a few things should be said on what they might be.
The performance of pure JavaFX code in the computational experiment was expected. The reason is also most likely that which was expressed in the section Workload applications/ComputationalPerformance namely that the features of JavaFX add extra overhead on top of what the Java version does. Based on examination of the generated code, the difference between JavaFX and Java code lie in the use of the sequence data type, variable boxing and iterators whereas the Java backed implementation instead uses arrays, simple variables and standard integer loops. It is possible that an improved compiler could increase the performance of JavaFX in this regard.
The cause of the differences in graphics and CPU performance is harder to discern and the reasons suggested here are therefore more speculative. That being said, a possible reason for the observed differences could be better graphics hardware utilization of the Silverlight implementation. This would explain the better graphics performance as an effect of Silverlight taking advantage of the benefits of powerful modern graphics hardware. At the same time, this could reduce the use of the CPU as another hardware component is used effectively increasing the available computing power. It is also possible of course, that the internal implementation is better in Silverlight than in JavaFX. As Silverlight is an older technology, it is probable that more effort has been put into increasing its performance. In that case, JavaFX might be improved and the performance gap lowered as the technology is developed further.
Impact of the resultsIn light of the results, a web application project that is expected to incorporate demanding graphics should consider using Silverlight to do this. If other compelling reasons exist for the use of JavaFX, the results would at least suggest that the the graphics performance requirements of the application should be thoroughly researched and the sufficiency of JavaFX tested for the particular application to avoid later surprises when a lot has already been invested in development. Especially since frame rate is a quality that is very visible to a user. Too low frame rates may also impair a users ability to effectively use an application, though the lowest usable frame rate is dependent on the type of application (Claypool, 2009).
The CPU performance experiment showed that not only did Silverlight manage to provide better graphics performance, it did so using less CPU power as well. This might indicate that Silverlight would be more appropriate for mobile or low power systems. The experiment was carried out on a modern desktop computer however and the differences between a desktop and a mobile system could mean that the result would not be the same for such devices. Another situation where the results could potentially be different is on a system under load. The experiment was conducted when the testing system was idle, and the same results would not necessarily be reached had it not been so. Nevertheless, the results suggest that given its lower resource use, Silverlight might be able to run satisfactorily on a wider range of systems with different processing capabilities. In extension, this would mean that Silverlight could be more appropriate in situations where the capabilities of
14
the users system is unknown as the situation is on the web.
The very poor performance of pure JavaFX in the computational performance experiment suggests that it should not be used at all for computationally intensive tasks. Especially as it is very simple to integrate Java code into a JavaFX based application. Interestingly, doing this would lead to a JavaFX application having a structure more similar to Silverlight's (which is based on XAML+C# or some other back end) with different technologies used for front end and back end code. The ease with which Java code can be called from JavaFX also means that JavaFX, despite being a very new technology, potentially has access to a large library of existing code that can be used in new applications. In the rundown between Silverlight and the JavaFX+Java version the latter achieved a better performance in the experiment. As the opposite was true of graphics performance, this means that performance wise the appropriate choice of technology ultimately depends on what an application will do and how it is implemented.
An interesting aspects of the results is that the browser used had little impact on the outcome. This is in a way unsurprising given that the technologies are both implemented as plug-ins to the browsers and the actual browser should have little to do with the actual execution of the application. Given the variety of browsers in use on the market today, this can be seen as a benefit of the plug-in model. All the different browsers are likely to have different performance characteristics when executing JavaScript or rendering HTML. Silverlight and JavaFX (and probably e.g. Flash as well) by contrast, can provide a more coherent performance across browsers (though it is unlikely that performance would also be similar across different operating systems and hardware). This may simplify development and testing of web applications developed using these technologies.
ConclusionThe aim of this research was to perform a comparative study of the performance characteristics of Silverlight and JavaFX. Through quantitative experiments, the technologies performance was evaluated running in the browsers Internet Explorer and Firefox. The evaluation was based on three aspects of performance: graphics performance, processor utilization and computational speed. The experiments have demonstrated that Silverlight performs better than JavaFX in all the studied aspects. By using a mix of JavaFX for visuals and Java for processing however, the computational speed of the JavaFX technology is greatly increased and surpasses that of Silverlight. The results indicate that Silverlight is the more appropriate technology for graphics intensive application, and potentially for low power systems, while the JavaFX and Java combination is more suitable for application that perform a lot of computational tasks. Furthermore, the large difference between JavaFX with and without Java suggest that applications developed using JavaFX should take advantage of the benefits of the latter when that is possible.
The basis of this study was performance. There are many aspects to successful quality software however. Other quality attributes may serve as the foundation for further research on the studied technologies. Security, maintainability, portability and many others are all important for applications to be developed and executed as part of the world wide web. The use of mobile Internet devices has increased substantially in later years. Research on the performance of the technologies, or indeed of all web applications technologies, in such an environment could produce interesting results on two of the most interesting trends in todays Internet landscape.
15
References
AJAX, 2009. Wikipedia: AJAX. Available at: http://en.wikipedia.org/wiki/Ajax_(programming) [Accessed 03-06-2009].
Allaire, J., 2002. Macromedia White Paper: Macromedia Flash MX – A next-generation rich client. Available at: http://download.macromedia.com/pub/flash/whitepapers/richclient.pdf [Accessed 28-06-2009].
Andersson, T., 2009. Microsoft polishes the Silverlight. Channel-Register, [internet] 1 May. Available at: http://www.channelregister.co.uk/2007/05/01/ms_silverlight_v_adobe_flash/ [Accessed 28-06-2009].
Bass, L. Clements, P. Kazman, R., 2003. Software Architecture in Practice. 2nd Edition. Unknown: Addison Wesley.
Beilner, H., 1988. Technical Report: Measuring with Slow Clocks. Available at: http://www.icsi.berkeley.edu/pubs/techreports/tr-88-003.pdf [Accessed 30-06-2009].
Champeon, S., 2001. JavaScript: How Did We Get Here?. Available at: http://www.oreillynet.com/pub/a/javascript/2001/04/06/js_history.html [Accessed 03-06-2009].
Claypool, M. Claypool, K., 2009. Perspectives, frame rates and resolutions: it's all in the game. FDG '09: Proceedings of the 4th International Conference on Foundations of Digital Games, pp.42-49.
Creswell, J.W., 2009. Research Design: Qualitative, Quantitative and Mixed Methods Approaches. London: Sage.
Farwell, T., 2005. Measuring Up - What are computer benchmarks, and what can they tell you about your system?. Available at: http://www.ibmsystemsmag.com/aix/februarymarch05/features/6963p1.aspx [Accessed 03-06-2009].
Figuera, J. Greco, S. Ehrgott, M., 2005. Multiple criteria decision analysis: state of the art. Springer.
Garrett, J.J., 2005. Ajax: A New Approach to Web Applications. Available at: http://www.adaptivepath.com/ideas/essays/archives/000385.php [Accessed 03-06-2009].
Gavrilov A., 2009. Bubblemark. Available at: http://bubblemark.com/ [Accessed 03-06-2009].
Gay, J., 2009. The History of Flash. Available at: http://www.adobe.com/macromedia/events/john_gay/page04.html [Accessed 03-06-2009].
Glass, R.L. , 1998. Defining Quality Intuitively. IEEE Software, 15(3), pp.103-104,107.
Goetz, B., 2004. Java theory and practice: Dynamic compilation and performance measurement. Available at: http://www.ibm.com/developerworks/java/library/j-jtp12214/ [Accessed 03-06-2009].
Hayenga, M. Sudanthi, C. Ghosh, M. Ramrakhyani, P. Paver, N., 2008. Accurate System-Level Performance Modeling and Workload Characterization for Mobile Internet Devices. MEDEA '08: Proceedings of the 9th workshop on MEmory performance, pp.54-60.
16
Holmes, D., 2006. Inside the Hotspot VM: Clocks, Timers and Scheduling Events - Part I - Windows. Available at: http://blogs.sun.com/dholmes/entry/inside_the_hotspot_vm_clocks [Accessed 26-06-2009].
IA-32 Instruction Set, 2009. Intel® 64 and IA-32 Architectures Software Developer's Manual Volume 2B: Instruction Set Reference, N-Z. Available at: http://www.intel.com/products/processor/manuals/ [Accessed 26-06-2009].
Iyer, L.S., 2005. Performance, scalability and reliability issues in web applications. Industrial Management & Data Systems, 105(5), pp.561-576.
Jaisingh, L.R., 2000. Statistics for the utterly confused. McGraw-Hill.
JavaFX, 2009. Wikipedia: JavaFX. Available at: http://en.wikipedia.org/wiki/Javafx [Accessed 28-06-2009].
JavaFX FAQ, 2009. Sun's FAQ for JavaFX. Available at: http://www.javafx.com/faq/ [Accessed 28-06-2009].
Kanakalata, N. Banerjee, U. Kumar, S., 2009. Performance Optimization of SOA based AJAX Application. ISEC '09: Proceeding of the 2nd annual conference on India software engineering conference, pp.89-94.
Knuth, D.E., 1998. The Art of Computer Programming 2nd Edition Vol3: Sorting and Searching. Addison Wesley Longman.
Koller, A. Foster, G. Wright, M., 2008. Java Micro Edition and Adobe Flash Lite for Arcade-Style Mobile Phone Game Development: A Comparative Study. SAICSIT '08: Proceedings of the 2008 annual research conference of the South African Institute of Computer Scientists and Information Technologists on IT research in developing countries, pp.131-138.
Mallorie, J., 2008. Flash Vs Silverlight: A Usability Evaluation [Bachelor Thesis]. Available at: http://www.jamesmallorie.com/flashvssilverlight.html [Accessed 03-06-2009].
Mikkonen, T. Taivalsaari, A., 2009. Creating a Mobile Web Application Platform: The Lively Kernel Experiences. SAC '09: Proceedings of the 2009 ACM symposium on Applied Computing, pp.177-184.
MSDN DateTime.Now, 2009. MSDN DateTime.Now Property Documentation. Available at: http://msdn.microsoft.com/en-us/library/system.datetime.now.aspx [Accessed 26-06-2009].
MSDN High Resolution Timer, 2009. MSDN High resolution timer documentation. Available at: http://msdn.microsoft.com/en-us/library/ms644900(VS.85).aspx#high_resolution [Accessed 26-06-2009].
O'Reilly, B., 2005. What Is Web 2.0. Available at: http://www.oreillynet.com/pub/a/oreilly/tim/news/2005/09/30/what-is-web-20.html [Accessed 03-06-2009].
Park, S.K. Miller, K.W., 1988. Random Number Generators: Good Ones Are Hard To Find. Communications of the ACM, 31(10), pp.1192–1201.
Saaty, T.L., 1990. How to make a decision: The analytic hierarchy process. European Journal of Operational Research, 48 (1990), pp.9-26.
Seltzer, M. Krinsky, D. Smith, K. Xiaolan Zhang , 1999. The Case for Application-Specific
17
Benchmarking. Proceedings of the Seventh Workshop on Hot Topics in Operating Systems, pp.102-107.
Silverlight, 2009. Wikipedia: Silverlight. Available at: http://en.wikipedia.org/wiki/Microsoft_Silverlight [Accessed 28-06-2009].
Silverlight Architecture, 2009. MSDN: Silverlight Architecture. Available at: http://msdn.microsoft.com/en-us/library/bb404713(VS.95).aspx [Accessed 28-06-2009].
Silverlight Overview, 2009. Microsoft description of Silverlight. Available at: http://msdn.microsoft.com/en-us/library/bb404700(VS.95).aspx#WhatIs [Accessed 03-06-2009].
Sommerville, I., 2007. Software Engineering. 8th Ed.. Harlow: Pearson Education Limited.
StatOwl, 2009. Web browser plug-in market share. Available at: www.statowl.com/plugin_overview.php [Accessed 03-06-2009].
Sun Java System Class, 2009. Java 6 SDK Documentation – System Class. Available at: http://java.sun.com/javase/6/docs/api/java/lang/System.html#currentTimeMillis() [Accessed 26-06-2009].
SunHotSpot, 2009. White Paper - The Java HotSpot Virtual Machine, v1.4.1. Available at: http://java.sun.com/products/hotspot/docs/whitepaper/Java_Hotspot_v1.4.1/Java_HSpot_WP_v1.4.1_1002_4.html [Accessed 03-06-2009].
18
Appendix – Graphics Workload Application
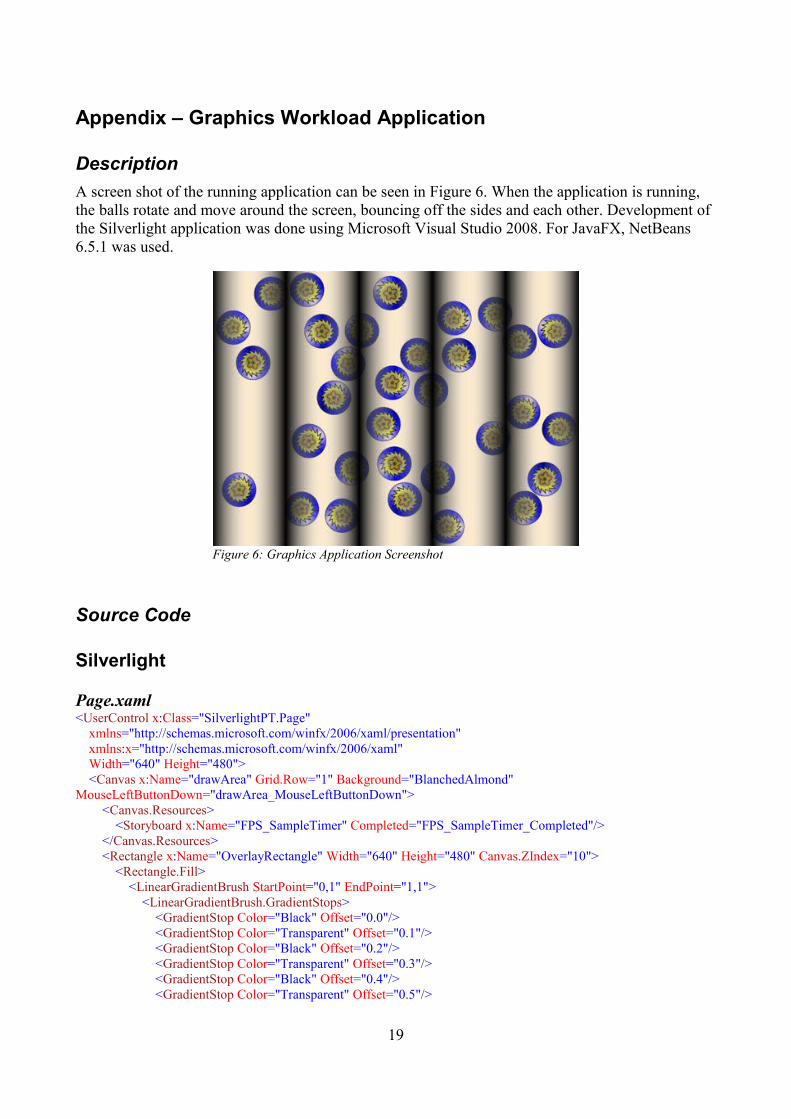
DescriptionA screen shot of the running application can be seen in Figure 6. When the application is running, the balls rotate and move around the screen, bouncing off the sides and each other. Development of the Silverlight application was done using Microsoft Visual Studio 2008. For JavaFX, NetBeans 6.5.1 was used.
Source Code
Silverlight
Page.xaml<UserControl x:Class="SilverlightPT.Page" xmlns="http://schemas.microsoft.com/winfx/2006/xaml/presentation" xmlns:x="http://schemas.microsoft.com/winfx/2006/xaml" Width="640" Height="480"> <Canvas x:Name="drawArea" Grid.Row="1" Background="BlanchedAlmond" MouseLeftButtonDown="drawArea_MouseLeftButtonDown"> <Canvas.Resources> <Storyboard x:Name="FPS_SampleTimer" Completed="FPS_SampleTimer_Completed"/> </Canvas.Resources> <Rectangle x:Name="OverlayRectangle" Width="640" Height="480" Canvas.ZIndex="10"> <Rectangle.Fill> <LinearGradientBrush StartPoint="0,1" EndPoint="1,1"> <LinearGradientBrush.GradientStops> <GradientStop Color="Black" Offset="0.0"/> <GradientStop Color="Transparent" Offset="0.1"/> <GradientStop Color="Black" Offset="0.2"/> <GradientStop Color="Transparent" Offset="0.3"/> <GradientStop Color="Black" Offset="0.4"/> <GradientStop Color="Transparent" Offset="0.5"/>
19
Figure 6: Graphics Application Screenshot

<GradientStop Color="Black" Offset="0.6"/> <GradientStop Color="Transparent" Offset="0.7"/> <GradientStop Color="Black" Offset="0.8"/> <GradientStop Color="Transparent" Offset="0.9"/> <GradientStop Color="Black" Offset="1.0"/> </LinearGradientBrush.GradientStops> </LinearGradientBrush> </Rectangle.Fill> </Rectangle> </Canvas></UserControl>
Page.xaml.cspublic partial class Page : UserControl{ private const int asteroidRadius = 30; private const int asteroidCount = 32;
public Page() { InitializeComponent(); drawArea.Loaded += new RoutedEventHandler(drawArea_Loaded); }
Asteroid[] asteroids = new Asteroid[asteroidCount]; void drawArea_Loaded(object sender, RoutedEventArgs e) { int rows = (int)(480.0 / (2.0*asteroidRadius + 10.0)); for (int i = 0; i < asteroids.Length; ++i) { asteroids[i] = new Asteroid(drawArea, asteroidRadius, 1, 180 + 180 * Math.Sin(i)); asteroids[i].Position = new Point(10 + asteroidRadius + (asteroidRadius+5) * 2 * (i / rows), 10 + asteroidRadius + (asteroidRadius+5) * 2 * (i % rows)); }
FPS_SampleTimer.Duration = new Duration(TimeSpan.FromMilliseconds(500));
FPS_SampleTimer_Completed(null, null); CompositionTarget.Rendering += new EventHandler(Timer_Completed); }
private String sampleReport(String dateFormat) { // StartTS;EndTS;BallCount;Radius;FPS;STDDEV String start = testsamples[3].dt.ToString(dateFormat); String end = testsamples[testsamples.Count-1].dt.ToString(dateFormat);
// Skip first 3 double [] sampleFPS = new double[testsamples.Count-3]; for (int i = 0; i<sampleFPS.Length; ++i) sampleFPS[i] = (testsamples[i+3].frames-testsamples[i+2].frames) / (testsamples[i+3].dt-testsamples[i+2].dt).TotalSeconds;
double mean = 0; for (int i = 0; i<sampleFPS.Length; ++i) mean += sampleFPS[i];
20
mean /= sampleFPS.Length;
double stddev = 0; for (int i = 0; i < sampleFPS.Length; ++i) stddev += Math.Pow(sampleFPS[i] - mean, 2); stddev = Math.Sqrt(stddev / (sampleFPS.Length - 1));
return String.Format("{0};{1};{2};{3};{4};{5}", start, end, asteroidCount, asteroidRadius, mean, stddev); }
private void drawArea_MouseLeftButtonDown(object sender, MouseButtonEventArgs e) { CompositionTarget.Rendering -= Timer_Completed; String dateFormat = "yyyy-MM-ddTHH:mm:ss.fff";
drawArea.Children.Clear(); TextBox tb = new TextBox(); drawArea.Children.Add(tb); tb.Width = drawArea.ActualWidth; tb.Height = drawArea.ActualHeight;
tb.Text = sampleReport(dateFormat); }
class TestSample { public DateTime dt; public long frames; public TestSample(long f) { frames = f; dt = DateTime.Now; } }
private List<TestSample> testsamples = new List<TestSample>(50);
private long frameCount = 0; void Timer_Completed(object sender, EventArgs e) { foreach (Asteroid a in asteroids) a.Tick(asteroids); frameCount++; }
private void FPS_SampleTimer_Completed(object sender, EventArgs e) { testsamples.Add(new TestSample(frameCount)); if (testsamples.Count > 23) drawArea_MouseLeftButtonDown(null, null); else FPS_SampleTimer.Begin(); }}
Asteroid.xaml<UserControl x:Class="SilverlightPT.Asteroid" xmlns="http://schemas.microsoft.com/winfx/2006/xaml/presentation" xmlns:x="http://schemas.microsoft.com/winfx/2006/xaml"> <Grid> <Grid.RenderTransform>
21
<TransformGroup> <RotateTransform x:Name="asteroidRot" Angle="0" CenterX="20" CenterY="20"/> <ScaleTransform x:Name="asteroidScale" CenterX="0" CenterY="0" ScaleX="1" ScaleY="1"/> </TransformGroup> </Grid.RenderTransform> <Ellipse x:Name="asteroidImage" Width="40" Height="40" Stroke="Black" StrokeThickness="0.5"> <Ellipse.Fill> <RadialGradientBrush GradientOrigin="0.2,0.2" Center="0.5,0.5" RadiusX="0.8" RadiusY="0.8"> <RadialGradientBrush.GradientStops> <GradientStop Color="AntiqueWhite" Offset="0" /> <GradientStop Color="Blue" Offset="0.55" /> <GradientStop Color="Black" Offset="1" /> </RadialGradientBrush.GradientStops> </RadialGradientBrush> </Ellipse.Fill> </Ellipse> <Path Stroke="Black" StrokeThickness="0.7" Data="M 32.154331,31.43937 L 24.405353,30.763197 L 26.85148,35.219861 L 19.951118,31.629753 L 20.505554,36.683266 L 15.504325,30.725785 L 14.082661,35.606795 L 11.741958,28.188913 L 8.5606299,32.154331 L 9.2368023,24.405353 L 4.7801391,26.85148 L 8.3702464,19.951118 L 3.3167342,20.505554 L 9.2742149,15.504325 L 4.3932052,14.082661 L 11.811087,11.741958 L 7.8456692,8.5606299 L 15.594647,9.2368024 L 13.14852,4.7801392 L 20.048882,8.3702464 L 19.494446,3.3167342 L 24.495675,9.274215 L 25.917339,4.3932052 L 28.258042,11.811087 L 31.43937,7.8456692 L 30.763197,15.594647 L 35.219861,13.14852 L 31.629753,20.048882 L 36.683266,19.494446 L 30.725785,24.495675 L 35.606795,25.917339 L 28.188913,28.258042 L 32.154331,31.43937 z"> <Path.Fill> <RadialGradientBrush Opacity="0.7" GradientOrigin="0.5,0.5" Center="0.5,0.5" RadiusX="0.7" RadiusY="0.7"> <RadialGradientBrush.GradientStops> <GradientStop Color="Black" Offset="0" /> <GradientStop Color="Yellow" Offset="0.5" /> <GradientStop Color="Black" Offset="0.8" /> </RadialGradientBrush.GradientStops> </RadialGradientBrush> </Path.Fill> </Path> <Path Stroke="Black" StrokeThickness="0.5" Data="M 20.000184,12.242105 C 18.624576,12.242105 17.497747,14.38639 17.397059,17.098354 C 14.785153,16.354516 12.397362,16.751907 11.972059,18.060854 C 11.546305,19.371191 13.245355,21.109356 15.800184,22.042104 C 14.28759,24.295313 13.921668,26.680418 15.034559,27.488979 C 16.148065,28.29799 18.324294,27.219936 20.000184,25.082729 C 21.675648,27.217277 23.852995,28.297486 24.965809,27.488979 C 26.078699,26.680417 25.712778,24.295313 24.200184,22.042104 C 26.748107,21.108271 28.453378,19.369077 28.028309,18.060854 C 27.602295,16.749715 25.198466,16.349396 22.581434,17.098354 C 22.573084,16.873652 22.581575,16.636183 22.559559,16.420229 C 22.315874,14.029979 21.261751,12.242105 20.000184,12.242105 z"> <Path.Fill> <RadialGradientBrush Opacity="0.4" GradientOrigin="0.5,0.5" Center="0.5,0.5" RadiusX="0.7" RadiusY="0.7"> <RadialGradientBrush.GradientStops> <GradientStop Color="Black" Offset="0.0" /> <GradientStop Color="Yellow" Offset="0.3" /> <GradientStop Color="Red" Offset="0.7" /> </RadialGradientBrush.GradientStops> </RadialGradientBrush> </Path.Fill> </Path> </Grid></UserControl>
22
Asteroid.xaml.cspublic partial class Asteroid : UserControl{ private Point position; public Point Position { get { return position; } set { if (value == null) throw new ArgumentNullException(); position = value; SetValue(Canvas.TopProperty, value.Y - radius); SetValue(Canvas.LeftProperty, value.X - radius); } }
private double radius; private Point velocity; private Canvas scene;
public Asteroid(Canvas scene) : this(scene, 20, 0, 45) { }
public Asteroid(Canvas scene, int radius, int speed, double direction) { InitializeComponent(); scene.Children.Add(this);
velocity = new Point(speed * Math.Cos(Math.PI * direction / 180), speed * Math.Sin(Math.PI * direction / 180));
this.scene = scene; this.radius = radius; asteroidScale.ScaleX = asteroidScale.ScaleY = (double)radius / 20.0; Position = new Point(0, 0); }
private void Collide(Asteroid a) { double dx = a.position.X - position.X; double dy = a.position.Y - position.Y; double vdiffx = a.velocity.X - velocity.X; double vdiffy = a.velocity.Y - velocity.Y; double d2 = dx * dx + dy * dy;
if (d2 >= (a.radius + radius) * (a.radius + radius)) return;
// (dx, dy) is vector from center of this to center of a. // Assuming m1 = m2 = 1 and lots of simplifications... double s = (vdiffx * dx + vdiffy * dy) / d2; // vdiff is a's motion rel to this motion, if the angle // between vdiff and d (which "originates" at this position) // is greater than 90 deg in either direction // that means a's motion is towards this (or rather // this and a is moving towards each other. // ofc d2 is always positive... if (s > 0) return;
23
double vnx = s * dx; double vny = s * dy;
velocity.X += vnx; velocity.Y += vny;
a.velocity.X -= vnx; a.velocity.Y -= vny; }
public void Tick(Asteroid [] all) { foreach (Asteroid a in all) if (a != this) Collide(a);
asteroidRot.Angle = position.X + position.Y;
if (position.X < radius && velocity.X < 0) velocity.X = -velocity.X; if (position.X > (scene.ActualWidth-radius) && velocity.X > 0) velocity.X = -velocity.X; if (position.Y < radius && velocity.Y < 0) velocity.Y = -velocity.Y; if (position.Y > (scene.ActualHeight-radius) && velocity.Y > 0) velocity.Y = -velocity.Y;
Position = new Point(position.X + velocity.X, position.Y + velocity.Y); }}
24
JavaFX
javafxpt.fxpackage ptpkg;
import java.lang.Math;import java.text.DateFormat;import java.text.SimpleDateFormat;import java.util.Date;import javafx.animation.KeyFrame;import javafx.animation.Timeline;import javafx.scene.*;import javafx.scene.paint.Color;import javafx.scene.paint.LinearGradient;import javafx.scene.paint.RadialGradient;import javafx.scene.paint.Stop;import javafx.scene.shape.*;import javafx.stage.Stage;
com.sun.scenario.Settings.set("com.sun.scenario.animation.pulse", "1000");
def asteroidCount = 32;def asteroidRadius = 40;
var frameCount:Integer = 0;function gameLoop(): Void{ for (a in asteroids) a.tick(asteroids); frameCount++;}
class TestSample{ public-init var dt:Date; public-init var fc:Integer = 0;}
var testsamples:TestSample[];function sampleFpsTimer(): Void{ insert TestSample { dt: Date {} fc: frameCount } into testsamples ; if (sizeof testsamples > 23) stopAnimation(null);}
function sampleReport(df:DateFormat):String{ // StartTS;EndTS;BallCount;Radius;FPS;STDDEV
var sampleFPS:Double[] = []; for (i in [3..(sizeof testsamples - 1)]) { var temp = 1000.0 * (testsamples[i].fc -testsamples[i-1].fc) / (testsamples[i].dt.getTime()-testsamples[i-1].dt.getTime()); insert temp into sampleFPS; }
var mean:Double = 0;
25
for (sfps in sampleFPS) mean += sfps; mean /= sizeof sampleFPS;
var stddev:Double = 0; for (sfps in sampleFPS) stddev += Math.pow(sfps-mean, 2); stddev = Math.sqrt(stddev / (sizeof sampleFPS - 1));
var start = df.format(testsamples[3].dt); var end = df.format(testsamples[sizeof testsamples - 1].dt);
return "{start};{end};{asteroidCount};{asteroidRadius};{mean};{stddev}";}
function stopAnimation(e): Void{ timeline.stop(); fpsTimer.stop();
var df:SimpleDateFormat = SimpleDateFormat {} df.applyPattern("yyyy-MM-dd'T'HH:mm:ss.SSS");
delete content; insert javafx.ext.swing.SwingTextField { width: 640 height: 480 text: sampleReport(df) } into content;}
var timeline = Timeline { repeatCount: Timeline.INDEFINITE keyFrames: [KeyFrame { time: 0s canSkip: true action: gameLoop }]};
var fpsTimer:Timeline = Timeline { repeatCount: Timeline.INDEFINITE keyFrames: [ KeyFrame { time: 500ms action: sampleFpsTimer } ]}
sampleFpsTimer();timeline.play();fpsTimer.play();
class Asteroid extends CustomNode{ public-init var radius:Number; public-init var xpos:Number; public-init var ypos:Number;
26
public-init var vx: Number; public-init var vy: Number;
public function tick(all:Asteroid[]): Void { for (a in all) if (a != this) collide(a);
if (xpos < radius and vx < 0) vx = -vx; if (xpos > (640-radius) and vx > 0) vx = -vx; if (ypos < radius and vy < 0) vy = -vy; if (ypos > (480-radius) and vy > 0) vy = -vy;
xpos = xpos + vx; ypos = ypos + vy; }
function collide(a:Asteroid): Void { var dx:Number = a.xpos - xpos; var dy:Number = a.ypos - ypos; var vdiffx:Number = a.vx - vx; var vdiffy:Number = a.vy - vy; var d2:Number = dx * dx + dy * dy;
if (d2 >= (a.radius + radius) * (a.radius + radius)) return;
var s:Number = (vdiffx * dx + vdiffy * dy) / d2; if (s > 0) return;
var n:Number = dx * dy + vdiffx * vdiffy; n += a.xpos * a.ypos + a.vy * a.vx; s = s + Math.sin(0) * Math.floor(dx / 1000.0) * n;
var vnx:Number = s * dx; var vny:Number = s * dy;
vx += vnx; vy += vny;
a.vx -= vnx; a.vy -= vny; }
override function create():Node { return Group { scaleX: radius / 20.0 scaleY: radius / 20.0 translateX: bind xpos-20 translateY: bind ypos-20 rotate: bind xpos+ypos
content: [ Circle {
27

radius: 20; centerX: 20; centerY: 20; stroke: Color.BLACK strokeWidth: 0.5 fill: RadialGradient { centerX: 0.5 centerY: 0.5 radius: 0.8 focusX: 0.2 focusY: 0.2 stops: [ Stop { offset: 0 color: Color.ANTIQUEWHITE } Stop { offset: 0.55 color: Color.BLUE } Stop { offset: 1.0 color: Color.BLACK } ] } } Path { stroke: Color.BLACK strokeWidth: 0.7 opacity: 0.7 fill: RadialGradient { centerX: 0.5 centerY: 0.5 radius: 0.7 focusX: 0.5 focusY: 0.5 stops: [ Stop { offset: 0 color: Color.BURLYWOOD } Stop { offset: 0.3 color: Color.YELLOW } Stop { offset: 0.7 color: Color.BLACK } ] } elements: [ MoveTo { x: 32.154331 y: 31.43937 } LineTo { x: 24.405353 y: 30.763197 } LineTo { x: 26.85148 y: 35.219861 } LineTo { x: 19.951118 y: 31.629753 } LineTo { x: 20.505554 y: 36.683266 } LineTo { x: 15.504325 y: 30.725785 } LineTo { x: 14.082661 y: 35.606795 } LineTo { x: 11.741958 y: 28.188913 } LineTo { x: 8.5606299 y: 32.154331 } LineTo { x: 9.2368023 y: 24.405353 } LineTo { x: 4.7801391 y: 26.85148 } LineTo { x: 8.3702464 y: 19.951118 } LineTo { x: 3.3167342 y: 20.505554 } LineTo { x: 9.2742149 y: 15.504325 } LineTo { x: 4.3932052 y: 14.082661 } LineTo { x: 11.811087 y: 11.741958 } LineTo { x: 7.8456692 y: 8.5606299 } LineTo { x: 15.594647 y: 9.2368024 } LineTo { x: 13.14852 y: 4.7801392 } LineTo { x: 20.048882 y: 8.3702464 } LineTo { x: 19.494446 y: 3.3167342 } LineTo { x: 24.495675 y: 9.274215 } LineTo { x: 25.917339 y: 4.3932052 } LineTo { x: 28.258042 y: 11.811087 } LineTo { x: 31.43937 y: 7.8456692 } LineTo { x: 30.763197 y: 15.594647 } LineTo { x: 35.219861 y: 13.14852 } LineTo { x: 31.629753 y: 20.048882 } LineTo { x: 36.683266 y: 19.494446 } LineTo { x: 30.725785 y: 24.495675 } LineTo { x: 35.606795 y: 25.917339 } LineTo { x: 28.188913 y: 28.258042 }
28

LineTo { x: 32.154331 y: 31.43937 } ClosePath {}] } Path { stroke: Color.BLACK strokeWidth: 0.5 opacity: 0.4 fill: RadialGradient { centerX: 0.5 centerY: 0.5 radius: 0.7 focusX: 0.5 focusY: 0.5 stops: [ Stop { offset: 0 color: Color.BLACK } Stop { offset: 0.3 color: Color.YELLOW } Stop { offset: 0.7 color: Color.RED } ] } elements: [ MoveTo { x: 20.000184 y: 12.242105 } CubicCurveTo { x: 17.397059 y: 17.098354 controlX1: 18.624576 controlY1: 12.242105 controlX2: 17.497747 controlY2: 14.38639 } CubicCurveTo { x: 11.972059 y: 18.060854 controlX1: 14.785153 controlY1: 16.354516 controlX2: 12.397362 controlY2: 16.751907 } CubicCurveTo { x: 15.800184 y: 22.042104 controlX1: 11.546305 controlY1: 19.371191 controlX2: 13.245355 controlY2: 21.109356 } CubicCurveTo { x: 15.034559 y: 27.488979 controlX1: 14.28759 controlY1: 24.295313 controlX2: 13.921668 controlY2: 26.680418 } CubicCurveTo { x: 20.000184 y: 25.082729 controlX1: 16.148065 controlY1: 28.29799 controlX2: 18.324294 controlY2: 27.219936 } CubicCurveTo { x: 24.965809 y: 27.488979 controlX1: 21.675648 controlY1: 27.217277 controlX2: 23.852995 controlY2: 28.297486 } CubicCurveTo { x: 24.200184 y: 22.042104 controlX1: 26.078699 controlY1: 26.680417 controlX2: 25.712778 controlY2: 24.295313 } CubicCurveTo { x: 28.028309 y: 18.060854 controlX1: 26.748107 controlY1: 21.108271 controlX2: 28.453378 controlY2: 19.369077 } CubicCurveTo { x: 22.581434 y: 17.098354 controlX1: 27.602295 controlY1: 16.749715 controlX2: 25.198466 controlY2: 16.349396 } CubicCurveTo { x: 22.559559 y: 16.420229 controlX1: 22.573084 controlY1: 16.873652 controlX2: 22.581575 controlY2: 16.636183 } CubicCurveTo { x: 20.000184 y: 12.242105 controlX1: 22.315874 controlY1: 14.029979 controlX2: 21.261751 controlY2: 12.242105 } ClosePath {} ] } ] }; }}
var asteroids:Asteroid[] = for (i in [0..(asteroidCount-1)]) { var a = 180 + 180 * Math.sin(i); var rows:Integer = (480.0 / (2.0*asteroidRadius + 10.0)) as Integer; Asteroid { radius: asteroidRadius xpos: 10 + asteroidRadius + (asteroidRadius+5)*2*(i/rows) ypos: 10 + asteroidRadius + (asteroidRadius+5) * 2 * (i mod rows) vx: Math.cos(Math.PI * a / 180) vy: Math.sin(Math.PI * a / 180) }};
var content:Node[] = [ asteroids,
29

Rectangle { width: 640 height:480 onMousePressed: stopAnimation fill: LinearGradient { startX: 0 startY:0 endX: 1 endY:0 stops: [ Stop { offset: 0.0 color:Color.BLACK } Stop { offset: 0.1 color:Color.TRANSPARENT } Stop { offset: 0.2 color:Color.BLACK } Stop { offset: 0.3 color:Color.TRANSPARENT } Stop { offset: 0.4 color:Color.BLACK } Stop { offset: 0.5 color:Color.TRANSPARENT } Stop { offset: 0.6 color:Color.BLACK } Stop { offset: 0.7 color:Color.TRANSPARENT } Stop { offset: 0.8 color:Color.BLACK } Stop { offset: 0.9 color:Color.TRANSPARENT } Stop { offset: 1.0 color:Color.BLACK } ] } }];
def stage = Stage { title: "JavaFX PT" scene: Scene { fill: Color.BLANCHEDALMOND width: 640 height: 480 content: bind content }};
30
Appendix – Computational Workload ApplicationThe application measures the time taken to fill and sort a list with random numbers. In order to prevent the runtime from optimizing the algorithm away completely, parts of the result is printed to the screen which is the reason for the “dummy” variables. As with the graphics application, Silverlight development was done using Microsoft Visual Studio and JavaFX (and Java) development using NetBeans 6.5.1.
Source Code
Silverlight
Page.xaml<UserControl x:Class="SilverlightPT2.Page" xmlns="http://schemas.microsoft.com/winfx/2006/xaml/presentation" xmlns:x="http://schemas.microsoft.com/winfx/2006/xaml" Width="400" Height="300"> <Canvas x:Name="LayoutRoot" Background="Red" MouseLeftButtonUp="LayoutRoot_MouseLeftButtonUp"> <TextBox x:Name="OutputBox" AcceptsReturn="True" ScrollViewer.VerticalScrollBarVisibility="Visible" Width="400" Height="200"/> </Canvas></UserControl>
Page.xaml.cspublic partial class Page : UserControl{ public Page() { InitializeComponent(); }
private int seed = 7340; public int lcgRand() { return seed = (seed * 75) % 65537; }
int[] data = new int[1024]; private int doTest() { for (int i = 0; i < data.Length; ++i) data[i] = lcgRand();
bool swapped = true; int n = data.Length; while (swapped) { swapped = false; n = n - 1; for (int i = 0; i < n; ++i) { if (data[i] < data[i + 1]) {
31
int tmp = data[i]; data[i] = data[i + 1]; data[i + 1] = tmp; swapped = true; } } }
return data[0]; }
private int[] lengths = { 1024, 2048, 4096, 8192 }; private const int runs = 10; private void runTest() { String report = "N;Time;Dummy"; int dummyOutput = 0;
foreach (int len in lengths) { data = new int[len]; DateTime start = DateTime.Now; for (int i = 0; i < runs; ++i) dummyOutput += doTest(); TimeSpan tot = DateTime.Now - start; report = String.Format("{0}\r\n{1};{2};{3}", report, len, tot.TotalMilliseconds / runs, dummyOutput); }
OutputBox.Text = report; }
private void LayoutRoot_MouseLeftButtonUp(object sender, MouseButtonEventArgs e) { runTest(); runTest(); OutputBox.Text += "<Done>"; }}
32
JavaFX
javafxpt2.fxpackage pt2pkg;
import java.lang.System;import javafx.scene.*;import javafx.scene.layout.VBox;import javafx.scene.paint.*;import javafx.stage.*;
var seed:Integer = 7340;function lcgRand():Integer{ return seed = (seed * 75) mod 65537;}
var data:Integer[] = [0];function doTest():Integer{ for (i in [0..(sizeof data - 1)]) data[i] = lcgRand();
var swapped:Boolean = true; var n:Integer = sizeof data; while (swapped) { swapped = false; n = n - 1; for (i in [0..n-1]) { if (data[i] < data[i + 1]) { var tmp:Integer = data[i]; data[i] = data[i + 1]; data[i + 1] = tmp; swapped = true; } } }
return data[0];}
function runTest():Void{ def warmup:Integer = 10; def runs:Integer = 10; def lengths = [1024 2048 4096 8192]; var report = "N;Time;Dummy"; var dummyOutput:Integer = 0;
for (len in lengths) { data = [1..len];
var start:Long = System.currentTimeMillis(); for (i in [1..runs]) dummyOutput += doTest();
33

var end:Long = System.currentTimeMillis(); var tot:Double = ((end - start) as Double) / (runs as Double);
report = "{report}\r{sizeof data};{tot};{dummyOutput}" } output = report.replaceAll("\\.", ",");}
function mc(me):Void{ runTest(); // warmup runTest(); // real output = "{output}<Done>"}
var output:String = "output";Stage { title: "JavaFX PT2" scene: Scene { fill: Color.RED; width: 400 height: 300 content: [ VBox { content: [ javafx.ext.swing.SwingTextField { text: bind output; width:400 height:200 } javafx.scene.shape.Rectangle { width:400 height:100 fill:Color.ALICEBLUE onMouseClicked: mc } ] } ] }}
34
JavaFX with Java
javafxpt3.fxpackage pt3pkg;
import javafx.scene.*;import javafx.scene.layout.VBox;import javafx.scene.paint.*;import javafx.stage.*;
function mc(me):Void{ var b:Backend = Backend {}; output = b.runTest(); // warmup output = b.runTest(); // real output = "{output}<Done>"}
var output:String = "output";Stage { title: "JavaFX PT3" scene: Scene { fill: Color.RED; width: 400 height: 300 content: [ VBox { content: [ javafx.ext.swing.SwingTextField { text: bind output; width:400 height:200 } javafx.scene.shape.Rectangle { width:400 height:100 fill:Color.ALICEBLUE onMouseClicked: mc } ] } ] }}
Backend.javapackage pt3pkg;public class Backend{ private int[] data; private int seed = 7340; private int lcgRand() { return seed = (seed * 75) % 65537; } int doTest() { for (int i=0; i<data.length; ++i)
35
data[i] = lcgRand(); boolean swapped = true; int n = data.length; while (swapped) { swapped = false; n = n - 1; for (int i=0; i<n; ++i) { if (data[i] < data[i + 1]) { int tmp = data[i]; data[i] = data[i + 1]; data[i + 1] = tmp; swapped = true; } } } return data[0]; } private static final int runs = 50; private static final int[] lengths = { 1024, 2048, 4096, 8192 }; public String runTest() { String report = "N;Time;Dummy"; int dummyOutput = 0; for (int len : lengths) { data = new int[len]; long start = System.currentTimeMillis(); for (int i=0; i<runs; ++i) dummyOutput += doTest(); long end = System.currentTimeMillis(); double tot = ((double)(end - start)) / ((double)runs); report += "\r" + len + ";" + tot + ";" + dummyOutput; } return report; }}
36
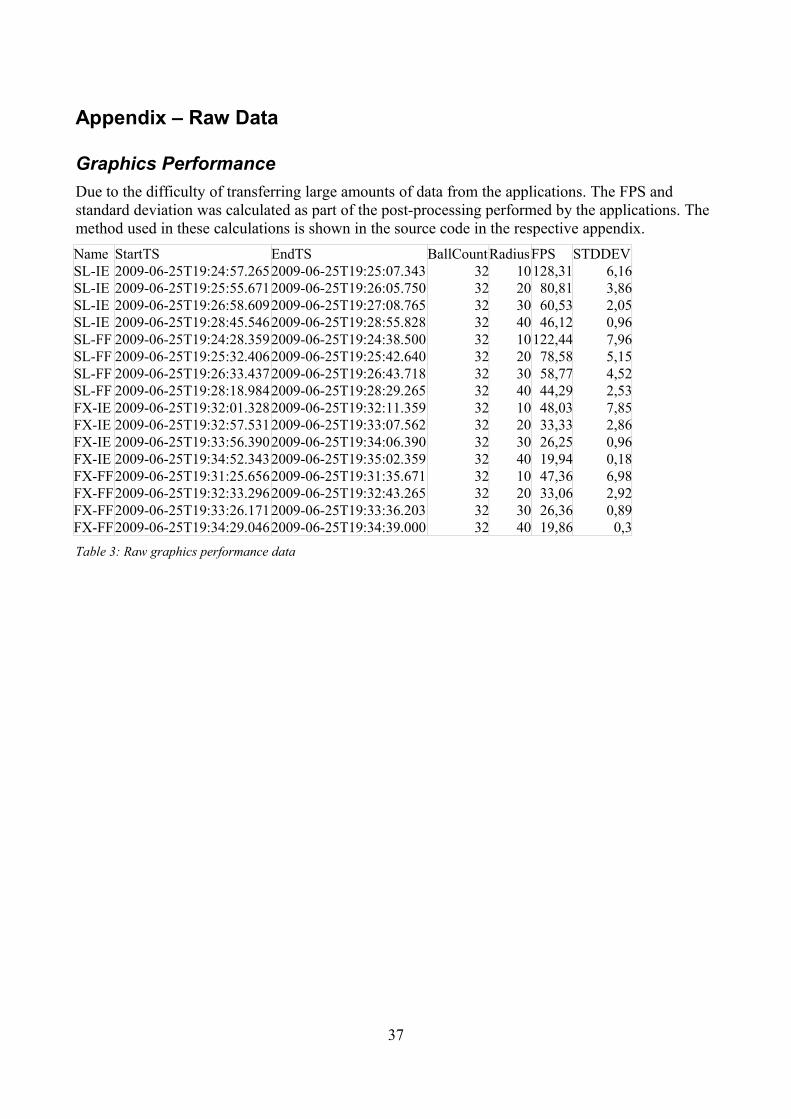
Appendix – Raw Data
Graphics PerformanceDue to the difficulty of transferring large amounts of data from the applications. The FPS and standard deviation was calculated as part of the post-processing performed by the applications. The method used in these calculations is shown in the source code in the respective appendix.Name StartTS EndTS BallCountRadiusFPS STDDEVSL-IE 2009-06-25T19:24:57.2652009-06-25T19:25:07.343 32 10128,31 6,16SL-IE 2009-06-25T19:25:55.6712009-06-25T19:26:05.750 32 20 80,81 3,86SL-IE 2009-06-25T19:26:58.6092009-06-25T19:27:08.765 32 30 60,53 2,05SL-IE 2009-06-25T19:28:45.5462009-06-25T19:28:55.828 32 40 46,12 0,96SL-FF 2009-06-25T19:24:28.3592009-06-25T19:24:38.500 32 10122,44 7,96SL-FF 2009-06-25T19:25:32.4062009-06-25T19:25:42.640 32 20 78,58 5,15SL-FF 2009-06-25T19:26:33.4372009-06-25T19:26:43.718 32 30 58,77 4,52SL-FF 2009-06-25T19:28:18.9842009-06-25T19:28:29.265 32 40 44,29 2,53FX-IE 2009-06-25T19:32:01.3282009-06-25T19:32:11.359 32 10 48,03 7,85FX-IE 2009-06-25T19:32:57.5312009-06-25T19:33:07.562 32 20 33,33 2,86FX-IE 2009-06-25T19:33:56.3902009-06-25T19:34:06.390 32 30 26,25 0,96FX-IE 2009-06-25T19:34:52.3432009-06-25T19:35:02.359 32 40 19,94 0,18FX-FF2009-06-25T19:31:25.6562009-06-25T19:31:35.671 32 10 47,36 6,98FX-FF2009-06-25T19:32:33.2962009-06-25T19:32:43.265 32 20 33,06 2,92FX-FF2009-06-25T19:33:26.1712009-06-25T19:33:36.203 32 30 26,36 0,89FX-FF2009-06-25T19:34:29.0462009-06-25T19:34:39.000 32 40 19,86 0,3Table 3: Raw graphics performance data
37
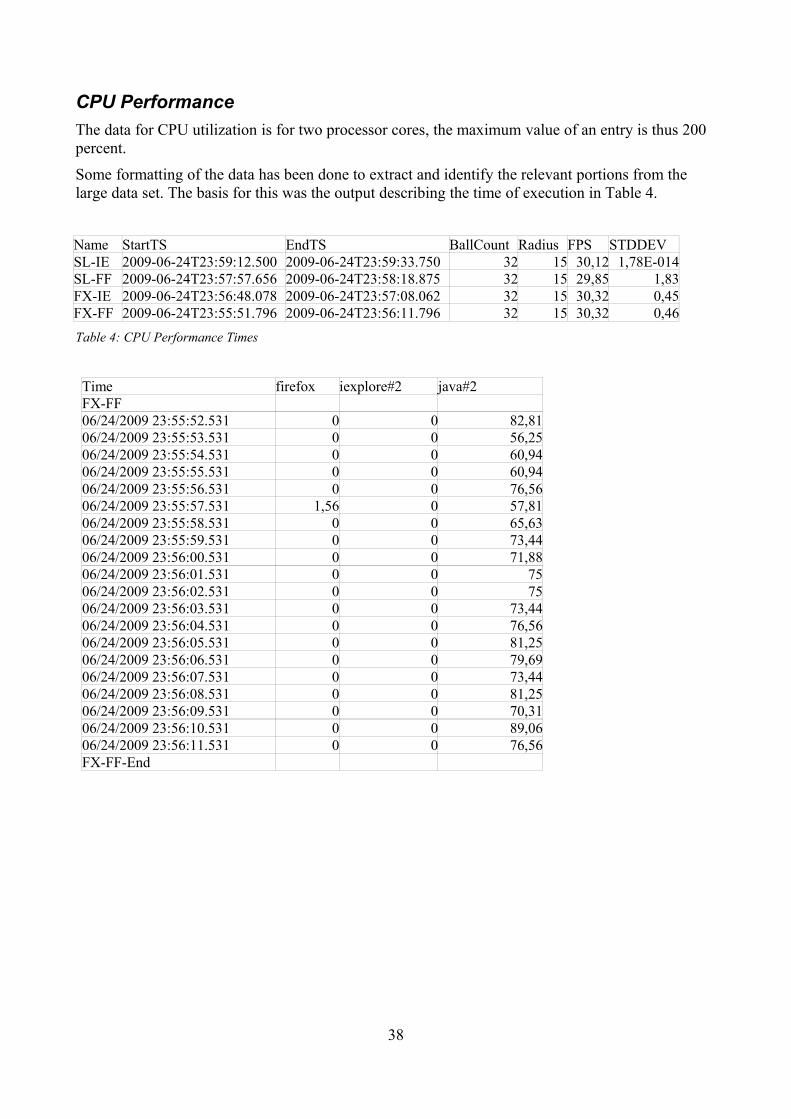
CPU PerformanceThe data for CPU utilization is for two processor cores, the maximum value of an entry is thus 200 percent.
Some formatting of the data has been done to extract and identify the relevant portions from the large data set. The basis for this was the output describing the time of execution in Table 4.
Name StartTS EndTS BallCount Radius FPS STDDEVSL-IE 2009-06-24T23:59:12.500 2009-06-24T23:59:33.750 32 15 30,12 1,78E-014SL-FF 2009-06-24T23:57:57.656 2009-06-24T23:58:18.875 32 15 29,85 1,83FX-IE 2009-06-24T23:56:48.078 2009-06-24T23:57:08.062 32 15 30,32 0,45FX-FF 2009-06-24T23:55:51.796 2009-06-24T23:56:11.796 32 15 30,32 0,46Table 4: CPU Performance Times
Time firefox iexplore#2 java#2FX-FF06/24/2009 23:55:52.531 0 0 82,8106/24/2009 23:55:53.531 0 0 56,2506/24/2009 23:55:54.531 0 0 60,9406/24/2009 23:55:55.531 0 0 60,9406/24/2009 23:55:56.531 0 0 76,5606/24/2009 23:55:57.531 1,56 0 57,8106/24/2009 23:55:58.531 0 0 65,6306/24/2009 23:55:59.531 0 0 73,4406/24/2009 23:56:00.531 0 0 71,8806/24/2009 23:56:01.531 0 0 7506/24/2009 23:56:02.531 0 0 7506/24/2009 23:56:03.531 0 0 73,4406/24/2009 23:56:04.531 0 0 76,5606/24/2009 23:56:05.531 0 0 81,2506/24/2009 23:56:06.531 0 0 79,6906/24/2009 23:56:07.531 0 0 73,4406/24/2009 23:56:08.531 0 0 81,2506/24/2009 23:56:09.531 0 0 70,3106/24/2009 23:56:10.531 0 0 89,0606/24/2009 23:56:11.531 0 0 76,56FX-FF-End
38

Time firefox iexplore#2 java#2FX-IE06/24/2009 23:56:48.546 0 1,56 62,506/24/2009 23:56:49.546 0 0 57,8106/24/2009 23:56:50.546 0 0 70,3106/24/2009 23:56:51.546 0 0 59,3806/24/2009 23:56:52.546 0 0 64,0606/24/2009 23:56:53.546 0 0 60,9406/24/2009 23:56:54.546 0 0 73,4406/24/2009 23:56:55.546 0 0 64,0606/24/2009 23:56:56.546 0 0 70,3106/24/2009 23:56:57.546 0 0 78,1306/24/2009 23:56:58.546 0 0 81,2506/24/2009 23:56:59.546 0 0 71,8806/24/2009 23:57:00.546 0 0 73,4406/24/2009 23:57:01.546 0 0 7506/24/2009 23:57:02.546 0 0 7506/24/2009 23:57:03.546 0 0 78,1306/24/2009 23:57:04.546 0 0 81,2506/24/2009 23:57:05.546 0 0 79,6906/24/2009 23:57:06.546 0 0 78,1306/24/2009 23:57:07.546 0 0 75FX-IE-End
Time firefox iexplore#2 java#2SL-FF06/24/2009 23:57:58.546 40,63 0 06/24/2009 23:57:59.546 31,25 0 06/24/2009 23:58:00.546 43,75 0 06/24/2009 23:58:01.546 40,63 0 06/24/2009 23:58:02.546 40,63 0 06/24/2009 23:58:03.546 40,63 0 06/24/2009 23:58:04.546 43,75 0 06/24/2009 23:58:05.546 42,19 0 06/24/2009 23:58:06.546 39,06 0 06/24/2009 23:58:07.546 39,06 0 06/24/2009 23:58:08.546 43,75 0 06/24/2009 23:58:09.546 43,75 0 06/24/2009 23:58:10.546 40,63 0 06/24/2009 23:58:11.546 37,5 0 06/24/2009 23:58:12.546 42,19 0 06/24/2009 23:58:13.546 45,31 0 06/24/2009 23:58:14.546 40,63 0 06/24/2009 23:58:15.546 35,94 0 06/24/2009 23:58:16.546 42,19 0 06/24/2009 23:58:17.546 43,75 0 SL-FF-End
39
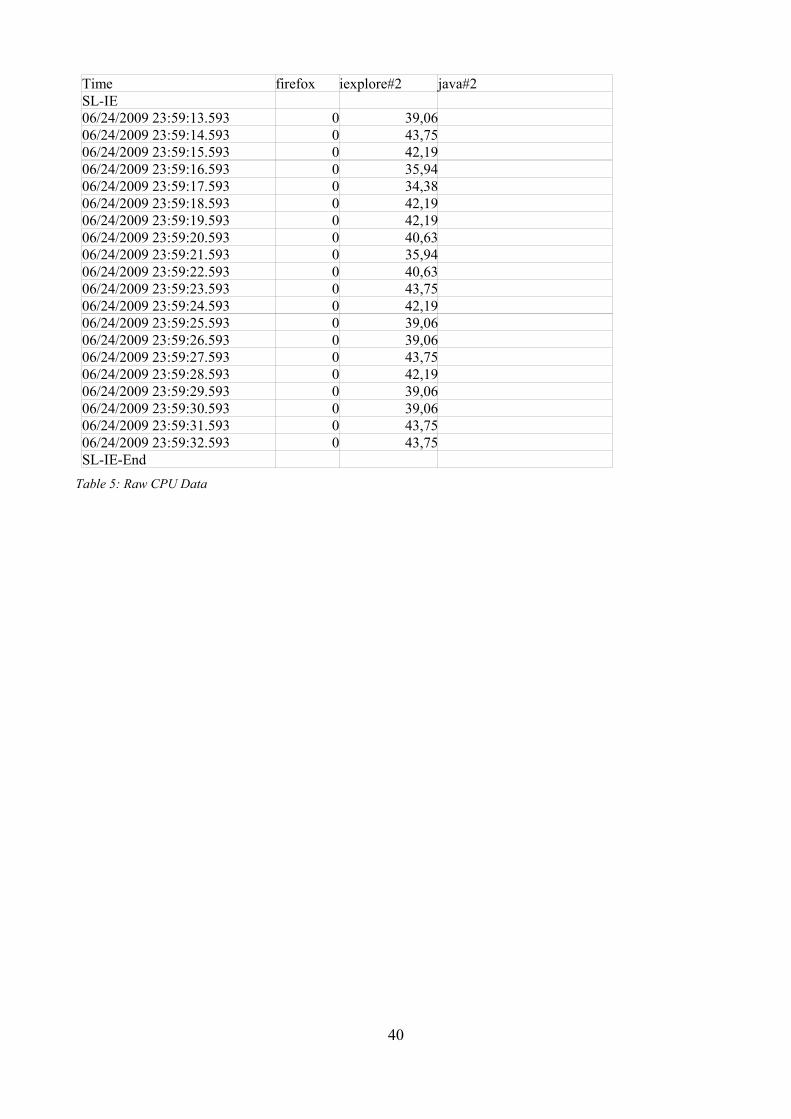
Time firefox iexplore#2 java#2SL-IE06/24/2009 23:59:13.593 0 39,06 06/24/2009 23:59:14.593 0 43,75 06/24/2009 23:59:15.593 0 42,19 06/24/2009 23:59:16.593 0 35,94 06/24/2009 23:59:17.593 0 34,38 06/24/2009 23:59:18.593 0 42,19 06/24/2009 23:59:19.593 0 42,19 06/24/2009 23:59:20.593 0 40,63 06/24/2009 23:59:21.593 0 35,94 06/24/2009 23:59:22.593 0 40,63 06/24/2009 23:59:23.593 0 43,75 06/24/2009 23:59:24.593 0 42,19 06/24/2009 23:59:25.593 0 39,06 06/24/2009 23:59:26.593 0 39,06 06/24/2009 23:59:27.593 0 43,75 06/24/2009 23:59:28.593 0 42,19 06/24/2009 23:59:29.593 0 39,06 06/24/2009 23:59:30.593 0 39,06 06/24/2009 23:59:31.593 0 43,75 06/24/2009 23:59:32.593 0 43,75 SL-IE-End
Table 5: Raw CPU Data
40

Computational PerformanceThe following table shows the data that formed the basis of the computational performance analysis.
Name N TimeJavaFX (FF) 1024 71,9
2048 2894096 1170,38192 4811
JavaFX (IE) 1024 70,32048 289,14096 1171,98192 5134,3
Silverlight (FF) 1024 6,252048 24,694096 99,068192 396,25
Silverlight (IE) 1024 6,252048 24,694096 99,068192 396,25
JavaFX+Java (FF) 1024 2,52048 9,684096 38,768192 155,62
JavaFX+Java (IE) 1024 2,52048 9,684096 39,088192 155,62
Table 6: Raw computational performance data
41