a comparative study of private housing price between hong
TRANSCRIPT

A comparative study of private housing price between Hong Kong and worldwide major countries
1
A comparative study of private housing price between Hong Kong and worldwide major countries
BY
Chan Hung, Huma
09000933
BBA, Applied Economics Concentration
An Honours Degree Project Submitted to the
School of Business in Partial Fulfillment
Of the Graduation Requirement for the Degree of
Bachelor of Business Administration (Honours)
Hong Kong Baptist University
Hong Kong
April 2012

A comparative study of private housing price between Hong Kong and worldwide major countries
2
Contents Abstract .............................................................................................................................. 4
Introduction ........................................................................................................................ 5
Statement of problem ..................................................................................................... 5
Literature review ............................................................................................................. 5
Objectives of the study .................................................................................................... 7
Statement of hypotheses ................................................................................................. 8
Procedures/methodology (Data and model) ....................................................................... 8
Primary Data (dependent variables) ................................................................................ 8
Control variables ............................................................................................................. 8
Regression model: ........................................................................................................... 9
Findings and analysis ........................................................................................................ 11
Sample selection ............................................................................................................ 11
Descriptive statistics ...................................................................................................... 12
Result interpretation: .................................................................................................... 14
Limitation of study ........................................................................................................... 16
Conclusion and Application ............................................................................................. 17
Relevant Data Sources: ..................................................................................................... 18
A comparative study of private housing price between Hong Kong and worldwide major countries
3
Bibliography ..................................................................................................................... 19
Appendix .......................................................................................................................... 21
Appendix 1 - Regression table of ADL (1.4) model of dstock ..................................... 21
Appendix 2 - Dicky-fuller test results after taking 1st difference ................................. 22
Appendix3 - Graph of predicted value of housing price index (phif) against actual
housing price index (phi) in Hong Kong 1996q1 – 2006q4 ......................................... 24
Appendix 4 - Size of house price bubbles of different countries (2007q1-2011q4) ...... 25
A comparative study of private housing price between Hong Kong and worldwide major countries
4
Abstract This study attempt to provide an empirical answer to a question that most Hong Kong citizen concerns: “Is the housing price in Hong Kong nowadays irrationally high?” The analytic model used in this study is the classic housing supply and demand model. At equilibrium stage, housing supply will equal to housing demand, the housing price can therefore be expressed in term of a function of various supply and demand factors. Economic indicators that relate to these factors are collected and then tested for stationary trend and Granger causality. Regression model is then modified and finalized and economic indicators from different countries, including China, Taiwan, Japan, Singapore, United Kingdom, United State and France are plugged in to estimate the size of housing price bubble between 2007q1 and 2011q4. It is founded that housing price bubble in Hong Kong is not exceptionally higher than sampled Asian countries except Singapore. Meanwhile, Western countries are found to have negative housing bubble in recent years. Overall speaking, the result of the regression is satisfied and most of the independent variables in the model are found to be significant. However, limitation of this model is that we cannot estimate the exact bubble size in different countries due to insufficient data source regarding the economic indicators. It is suggested that a more comprehensive conclusion can be drawn if city-scope data are available. The finding of this paper concludes that at present, there are insufficient evidences to suggest Hong Kong have an irrationally high housing price compare to other major countries worldwide, but there is a steady increasing trend for the housing price bubble size. Meanwhile, with similar economic position and market structure, Singapore is clearly more success in controlling the house price bubble than Hong Kong. Hong Kong government should learn form Singapore’s experience when formulating the future local housing policy.
A comparative study of private housing price between Hong Kong and worldwide major countries
5
Introduction Being one of the most densely populated areas in the world, Hong Kong has an overall population density of over 6145persons/km2, (Census and Statistics Department, 2007). There has been a raising concert in Hong Kong regarding the rationality of private housing price status. There are mainly two categories for Hong Kong housing market: private housing and public housing, with more than half of the housing units (55.3%) are produced by private housing sector (Census and Statistics Department, 2007). Some believe that housing price is so high that younger generation has no hope in owning their own apartment. Meanwhile, some believes the high housing price is an inevitable outcome in countries. The objective of this study is to find out whether there are enough evident to justify that private housing price in Hong Kong is really exceptionally and unreasonably high compare to worldwide countries. The proposed method will be to compare the size of housing price bubbles among countries.
Statement of problem Taken the housing price related macroeconomic factors into consideration, is the housing price in Hong Kong really higher than other major countries worldwide?
Literature review What are the factors affecting house price? There are lots of research done regards the determining factors of house price. Mankiw and Weil (1989) stated in their research that demographic demand variables are insignificantly related to the price of housing. Yet later studies re-examined this claim and find that demographic demand variables are actually significant and negatively related to price of housing Hensrud-Ellingson, S.(1998). Although there is no common consensus on the outcome, many scholars generally agree that demographic demand, GNP, real interest rate, price of non-housing goods and cost of construction are significant factors in determining. Some argues that these factors are insufficient to explain the housing price. Swan (1995) argues that real income per capita should also be included in determining housing price. G. Meen, M.

A comparative study of private housing price between Hong Kong and worldwide major countries
6
Andrew (1998) add that major determinants of house price dynamics should also include credit availability, tax structure and housing supply. An empirical study that includes 19 OECD countries done by Mihaljek, D. (2007) further confirm the important roles of the about factors in explaining house price. Ben-David, I. (2011) ‘s study review that property prices in areas with a high rate of past price inflation exhibited momentum and high volatility. Apart from studies in Europe, similar researches have been done in varies cities worldwide, such as in eight capital cities in Austria, Chyi Lin Lee (2009) and in US, Case and Shiller (1990).
A study has review that government regulations on urban land use can cause shortage of urban land and hence driving the price of private houses up. And the major factor is the rigid floor space ratio (Hui E, Lam M, Ho V., 2012). Therefore, when finding similar cities to compare, the city needs to have similar government regulations on urban land use.
There is some studies review that other micro factors can also affect housing price. Chan, E., So, H., Tang, B., & Wong, W. (2008) states that the available private space such as and some desirable form of communal space, such as clubhouse are positively correlated to housing price while other shared communal space, such as hallway process downward pressure on housing price. Moreover, through investigating the housing market in Mashad, Akbari, N., Emadzadeh, M., &Razavi, S. A. (2004)’s study concludes that housing price is related to area of land, security condition of respective locations, room numbers in the house, age of the building and expected increase in the land/property price.
How do we define whether housing price is high or not? Ratio rentals. (2010) use price to rent ratio to measure the size of housing price bubble, economic fundamentals that pushes up the housing price should also push up renting price, differences between the two prices can be considered as housing price bubble. It’s found that Hong Kong have a much higher ratio than other countries. DENNIS, H. (2003), investigate the housing markets in New Yok, New Jersey and Connecticut regions, with the home-price plunge

A comparative study of private housing price between Hong Kong and worldwide major countries
7
of the late 80s’ for comparison, it’s found single-family housing price in the past 5 years in the region have not change excessively. Schelkle, W. (2012) attempts to establish reasonable linkages between housing price bubbles and the credit market situation, homeownership scheme policy. WILLIAMSON, K. D. (2009). Finds that in the US market, there is a casual relationship between housing price bubble and estate agents commission. A relevant study done by Xiao, Q., & Liu, Y. (2010) compare Hong Kong’s housing price with Seoul and Singapore, yet there are insufficient evident to show whether the residential housing price in Hong Kong is irrationally or not. Watson, M. (2007) focus on the factors that affect the housing price bubble in United Kingdom, it was found that the bubble trend was affected by the bust and boom of financial market, change in structure of mortgage lending market, assets based welfare programs and tax break. One feasible practice is to analysis the rationality of housing price is to compare the size of housing price bubble, which means market fundamental value with the housing price. An early study defines bubble as relationship between land price and land value Noguchi (1994), yet the scope seems to be too narrow. An asset’s value usually consists of two parts: fundamental value and market fundamentals. The former one measure the discount rate, the terminal value of the asset at maturity, and cash received over time. (Peng& Hudson-Wilson, 2002). Yet it’s hard to include this into calculation since maturity period is hard to determine. Richardson, C. (2003)’s study focus on the economy of Australia, and outline the relationship between different economic factors and housing price bubble. Eddie C. M. HuiShenYue (2006) ‘s comparative study about housing price bubbles between Hong Kong, Beijing and Shanghai states that bubbles is the abnormal fluctuation between market fundamental and housing price. In another word, relationship between macroeconomic variables and housing price represent the existence and size of price bubbles. If macroeconomic variables show little variation with the prices, the bubble is small or insignificant, and vice versa.
Objectives of the study The objective of this study is to compare the size of housing price bubble between Hong Kong and other countries with living standard and international status. If the bubble size
A comparative study of private housing price between Hong Kong and worldwide major countries
8
is really larger in Hong Kong, we can say that Hong Kong’s housing price is indeed irrationally higher than the rest of the world.
Statement of hypotheses To determine the fundament market value of housing price, It is assumed that the housing market is efficient and only selected macroeconomic factors are significant, while other possible demand shifting factors are omitted due to insufficient data source are insignificant, cultural factors are also omitted because it’s hard to quantify. The study will focus only on the private housing sector, it is assumed that public housing price/rental and HOS houses have insignificant effect on private housing price.
Procedures/methodology (Data and model) The data required are expected to cover relating factors ranging from 1996q1 to 2011q4.The target countries for comparisons are Singapore, Taiwan, Japan, China, United Kingdom, United States and France.
Primary Data (dependent variables) Housing price in Hong Kong and other countries are expressed with housing price index (phi) by oxford economic, which is a weighted, repeat-sales index that it measures average price changes in repeat sales or refinancing on the same properties.
Control variables According to HM Treasury (2003), house price can be modeled in terms of changes in housing supply and demand. Key factors that needs to consider in the demand side are real GDP per capita (y), which is converted to USD using PPP rate; housing loan real interest rate (r), of which prime rate is used; wealth (nw), of which we use net wealth index of the private sector per person in local economy to calculate; wage (w), expressed in terms of nominal unitwage cost index. Stock index (stock), of which we will use main stock price index in the corresponding countries to calculate, eg: Hang Seng index for Hong Kong, Taiwan Weighted index for Taiwan, Straits Times Index for Singapore,

A comparative study of private housing price between Hong Kong and worldwide major countries
9
Nikkei 225 for Japan, FTSE 100 for United Kingdom, Standard and Poor's 500 Composite for United State, CAC 40 for France and Shanghai Composite for China;lastly is the demand shifter factor, residential rental price index (rent), that measure changes of value by referencingrent or price as factorsand divided by the subject properties’ratable value. Average rents and prices can then be complied using price and rental indices derived from the data.
DH =f (-phi, +y, -r, +nw, +/-w, +/-stock, +/-rent) ……………………(1)
On the supply side, determinants are real cost of construction (C), which is a function of price of the land (PL), cost of labor (labcost) and material cost (M).
SH= f (+phi, C ( PL, +labcost, M))……………………(2)
Due to insufficient data, we will only consider the labcost as the main determination factor in the supply size equation.
SH= f (+phi, +labcost)……………………(3)
Assume that the private housing market is efficient and in equilibrium, by equaling supply and demand functions, by equating (1) and (3), housing price (PH) can be expressed as the following reduced form function E.C.M. Hui, S. Yue(2006):
phi=f (+y, -r, +nw, +/-w, +/-stock, +/-rent, +labcost)……………………(4)
Regression model: The proposed regression form is as follow:
phi= f (phi(-1) y, r, nw, w, stock, rent, labcost)
Where phi(-1) perform as a lag operator. Data of each variable are collected in quarterly sequence from 1996q1 to 2011q4. Variables are then taken log respectively and check for the existence of unit root by dickey fuller test. The problem of non-stationary can then be eliminated by taking the first difference (Appendix 2). The regression model is then modified as follow:

A comparative study of private housing price between Hong Kong and worldwide major countries
10
dphi= f (dphi(-1) dy, dr, dnw, dw, dstock, drent, dlabcost).
In order to justify the causal relationship between the housing price index and these variables, a Ganger Causality test (1969) need to be done, so as to find out the degree of impacts for these factors to housing price. ADL (1,4) models between dphi and other variables are constructed; take dstock as an example (Appendix 1):
Dphi = f(dphi(-1), dstock(-1), dstock(-2), dstock(-3), dstock(-4))
After that, a walt-test is employed to test whether dstock (-1), dstock (-2), dstock (-3), dstock (-4) are jointly significant, the F statistic and p-value are examined to decide coefficients on the dstock variables are significant or not. If F statistic is larger enough and p-value is small enough, we can conclude that dstock variables granger causes dphi. The results are summarized in the following table:
Variables Test Statistic Value df Probability
dlabcost F-statistic 4.657594 (4, 53) 0.0027
Chi-square 18.63037 4 0.0009
dnw F-statistic 5.007074 (4, 53) 0.0017
Chi-square 20.0283 4 0.0005
dr F-statistic 2.918882 (4, 53) 0.0459
Chi-square 8.675528 4 0.0451
drent F-statistic 2.703029 (4, 53) 0.0593
Chi-square 9.812114 4 0.0589
dstock F-statistic 5.971268 (4, 53) 0.0005
Chi-square 23.88507 4 0.0001
dw F-statistic 2.729504 (4, 53) 0.0386
Chi-square 10.91801 4 0.0275
dy F-statistic 2.358152 (4, 53) 0.0652
Chi-square 9.43261 4 0.0512

A comparative study of private housing price between Hong Kong and worldwide major countries
11
All independent variables had passed the test and therefore significant in explaining dphi.
After observing the graphical trend of each variable, the regression result is found to be able to further improve if we consider the lagging effect of the independent variables (Appendix 3); the regression model is finally modified as follow:
dphi = f(dnw, dr, dy(-2), dphi(-1), dstock(-1), dw(-2), dlabcost, drent)……………………(5)
E.C.M. Hui, S. Yue(2006) suggests that bubble term in the i-th term can be defined as the difference between the predicted housing price index (phif) actual measured housing prices index (phi). The predicted housing price index is generated using the following forecasting method:
dphi=c+b1dnw+b2dr+b3dy(-2)+b4dphi(-1)+b5dstock(-1)+
b6dw(-2)+b7dlabcost+b8drent……………………(6)
dphi=phif-phi …………………………..(7)
Equating (6) and (7)
phif=c+b1dnw+b2dr+b3dy(-2)+b4dphi(-1)+b5dstock(-1)+
b6dw(-2)+b7dlabcost+b8drent+phi …………………………..(8)
Findings and analysis
Sample selection Data between 1996q1 to 2006q4 are used to run the regression model. Data between 2007q1 and 2011q4 are used to estimate the size of housing bubbles in each subject areas. Data are obtained through data stream of HKBU, World Bank database, Panel Study of Income Dynamics, OECD, IMF and statistic and census departments of respective countries.

A comparative study of private housing price between Hong Kong and worldwide major countries
12
Descriptive statistics Summarized regression resulting table of the key indicators is as follow:
Hong Kong
Taiwan Singapore Japan UK US France China
R2, p-value, Durbin-Watson stat
Model 0.82,
0,
1.732801
0.671456,
0.040075,
1.593792
0.779779,
0,
2.240206
0.580986,
0.033443,
1.901491
0.793604,
0.00001,
1.884351
0.878558,
0,
1.372584
0.648933,
0.060257,
2.222726
0.714755,
0.001961,
1.906876
Coefficient, p-value
C -0.00682,
0.0113
0.0035,
0.363
-0.00481,
0.0216
0.00109,
0.6108
0.005441,
0.0214
0.001086,
0.4231
-0.00793,
0.2055
0.006,
0.1899
Dnw 0.385062,
0.0024
-0.49197,
0.165
0.513562,
0.0007
-0.01538,
0.954
0.022721,
0.5796
-0.00852,
0.292
-0.21438,
0.0511
0.071081,
0.7036
Dr -0.23173,
0.0087
-0.05129,
0.4115
0.048655,
0.6681
0.060301,
0.0581
-0.04425,
0.045
-0.01774,
0.0159
-0.05045,
0.33
0.000414,
0.9949
Dy(-2) 0.450005,
0.0038
0.28999,
0.0036
0.155428,
0.03826
1.321402,
0.1047
0.183093,
0.0676
0.184597,
0.1211
1.383962,
0.1446
0.044086,
0.0017
Dphi(-1) 0.461026,
0.0003
0.003547,
0.9792
0.493813,
0.0024
-0.43411,
0.0037
0.455444,
0.0028
0.976344,
0
0.277099,
0.1367
-0.20364,
0.1701

A comparative study of private housing price between Hong Kong and worldwide major countries
13
Dstock(-1)
0.130567,
0.0062
0.03151,
0.3581
0.054279,
0.1122
0.021415,
0.533
-0.00879,
0.7191
0.003711,
0.436
0.030258,
0.2402
-0.02784,
0.2258
Dw(-2) 0.115256,
0.1842
-1.91553,
0.0289
0.140152,
0.0331
0.487664,
0.4061
-0.1337,
0.7418
-0.0442,
0.2828
0.575678,
0.4075
-0.09012,
0.7449
Dlabcost 0.114609,
0.097
0.013633,
0.5119
-0.03839,
0.3679
1.066704,
0.2196
-0.33716,
0.3297
0.109741,
0.0354
1.909521,
0.0365
-0.28991,
0.0582
Drent 0.695157,
0.0404
-5.17774,
0.1676
0.337027,
0.0861
-0.10999,
0.878
0.057977,
0.886
-0.3953,
0.147
2.201095,
0.0216
-0.10195,
0.5738
Table 1
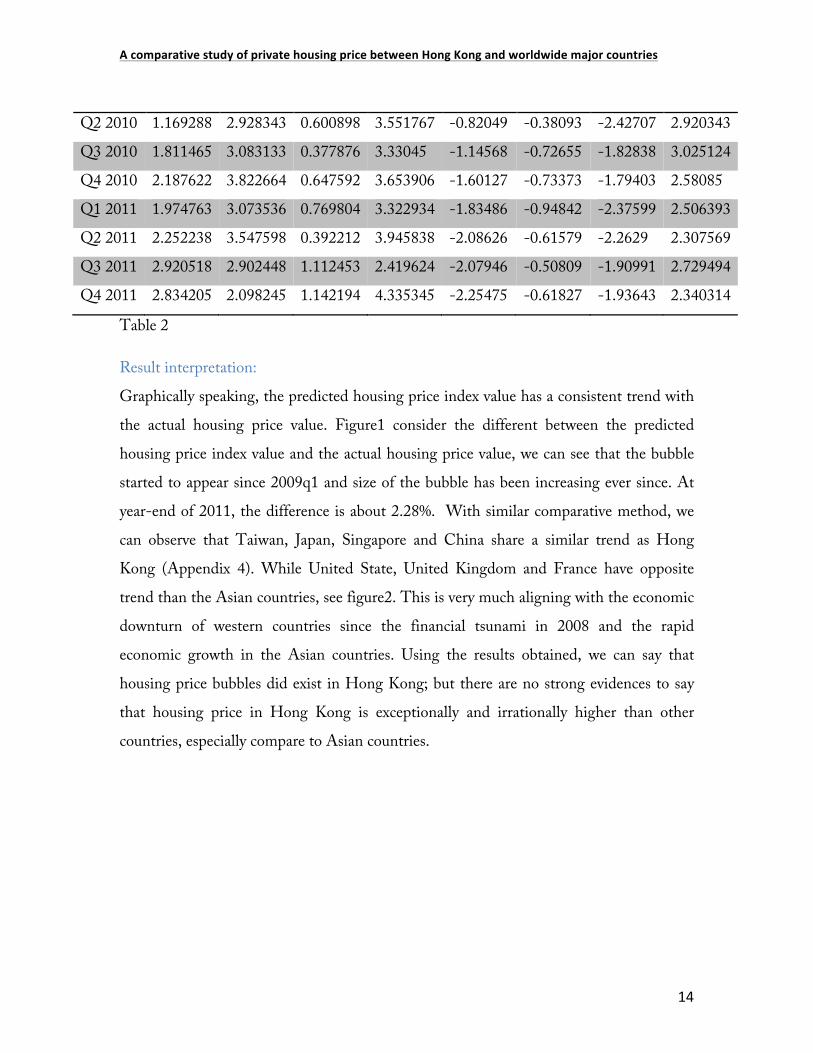
Summarized bubble size table of respective areas is as follow:
HK TW SING JP UK US FR CH
Q1 2007 -0.70049 -0.38557 -0.79432 -0.7166 0.230776 0.143217 -0.89697 -0.11414 Q2 2007 -1.08793 -0.54323 -0.43054 -0.3048 0.118474 -0.00829 -1.11744 0.101817 Q3 2007 -1.84503 -0.14009 -0.07807 -0.05521 0.13334 -0.18278 -0.85199 0.973354 Q4 2007 -1.32431 -0.45031 -0.45518 1.558897 0.049267 -0.40504 -1.4365 1.724848 Q1 2008 -0.79778 2.159122 -0.76625 0.810794 -0.23759 -0.56952 -2.04264 2.187183 Q2 2008 -0.88425 0.756816 -0.13448 1.685313 -0.51216 -0.66969 -2.35069 2.048808 Q3 2008 0.410492 0.604935 -0.19278 1.574281 -0.78918 -0.71135 -2.59366 2.302369 Q4 2008 -0.00324 -0.5087 -0.60979 0.875882 -0.6877 -0.90299 -3.44492 1.69116 Q1 2009 0.277493 -0.7613 -2.99914 1.363688 -1.14583 -0.32105 -4.15027 1.052328 Q2 2009 0.43163 1.91684 -2.16562 3.364638 -1.29292 -0.42654 -3.39416 0.60592 Q3 2009 1.406089 2.892168 1.573032 4.483598 -0.80323 -0.29064 -2.02652 1.310494 Q4 2009 1.448345 3.536978 0.814764 1.44267 -0.56068 -0.24277 -2.02317 1.822965 Q1 2010 1.307154 3.150487 0.372404 1.943109 -0.50206 -0.47522 -2.36782 2.622023
A comparative study of private housing price between Hong Kong and worldwide major countries
14
Q2 2010 1.169288 2.928343 0.600898 3.551767 -0.82049 -0.38093 -2.42707 2.920343 Q3 2010 1.811465 3.083133 0.377876 3.33045 -1.14568 -0.72655 -1.82838 3.025124 Q4 2010 2.187622 3.822664 0.647592 3.653906 -1.60127 -0.73373 -1.79403 2.58085 Q1 2011 1.974763 3.073536 0.769804 3.322934 -1.83486 -0.94842 -2.37599 2.506393 Q2 2011 2.252238 3.547598 0.392212 3.945838 -2.08626 -0.61579 -2.2629 2.307569 Q3 2011 2.920518 2.902448 1.112453 2.419624 -2.07946 -0.50809 -1.90991 2.729494 Q4 2011 2.834205 2.098245 1.142194 4.335345 -2.25475 -0.61827 -1.93643 2.340314
Table 2
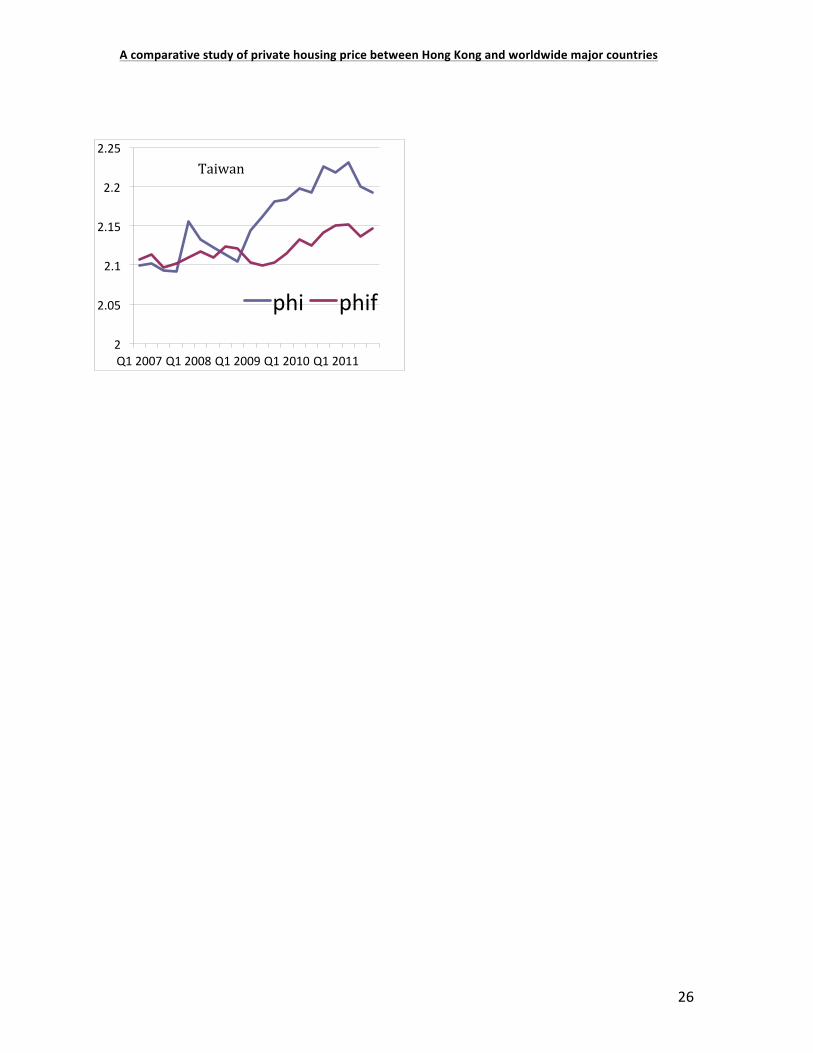
Result interpretation: Graphically speaking, the predicted housing price index value has a consistent trend with the actual housing price value. Figure1 consider the different between the predicted housing price index value and the actual housing price value, we can see that the bubble started to appear since 2009q1 and size of the bubble has been increasing ever since. At year-end of 2011, the difference is about 2.28%. With similar comparative method, we can observe that Taiwan, Japan, Singapore and China share a similar trend as Hong Kong (Appendix 4). While United State, United Kingdom and France have opposite trend than the Asian countries, see figure2. This is very much aligning with the economic downturn of western countries since the financial tsunami in 2008 and the rapid economic growth in the Asian countries. Using the results obtained, we can say that housing price bubbles did exist in Hong Kong; but there are no strong evidences to say that housing price in Hong Kong is exceptionally and irrationally higher than other countries, especially compare to Asian countries.

A comparative study of private housing price between Hong Kong and worldwide major countries
15
Figure 1
Figure2
House price bubbles in different markets 2007q1 - 2011q4 HK TW SING JP
A comparative study of private housing price between Hong Kong and worldwide major countries
16
Limitation of study There are three major limitations of the study, the significance of certain variables in some countries; the factors includes in the regression model; and the prediction power of the housing price index in the study.
Looking at the regression resulting table (table 1), p-value of overall regression is all lower than 0.1 therefore significant in 10% confidence interval. R2 for most countries are high enough except for Japan. When we look at the variables independently, we can observe that p-value of dnw for Japan and US are all exceptionally high. This maybe because the time lagging effect of net wealth. Dr value is significant in most countries except Taiwan, Singapore, France and China. This may be because most of the dr values between 1996q1 and 2006q4 are zero due to government intervention, therefore dr offer insignificant explanatory power in these countries. Dy(-2) and dphi(-1) have lower enough p-value in all countries, it’s proved to be universal significant factors. Dstock(-1) have high p-value in Taiwan, Japan, UK and US, this maybe due to insufficient stock index in order to measure the increase in private financial wealth. Dlabcost have high p- value in Taiwan and Singapore, this maybe due to time lag of construction cost relate to housing price, it takes years for houses to build and sell. Drent have high p-value in Japan and UK, this maybe due to the mature rental market developed in those countries. Overall speaking, regression results for all countries have 2-3 undesirable dependent variables among 8. For more accurate estimation, we might need to increase the number and variety of data source to estimate the dependent variables (EG: include more stock index for dstock) across different countries.
The regression model become unreasonable if demographic factors such as population change, unemployment rate and age structure are included, this may be due huge different between the demographic size of the countries. Other factor that doesn’t include in the model are the demand shifting factors such as housing vacancy rate, psychological perception, number of public houses available; the environmental factors; and the impact

A comparative study of private housing price between Hong Kong and worldwide major countries
17
of foreign capital. These factors are not included in the regression model either due to insufficient data source or it’s hard to quantify the factors.
The different between actual housing price index and forecasted housing price index merely having a comparative meaning across countries, it cannot help to measure the actual size of the housing price bubble.
Conclusion and Application There has always been a long debate about whether the housing price in Hong Kong is really exceptionally high (table 2). The regression model is able to help us establish the relationship between economic fundamentals and the housing price index. In this study, we find out that the compare to other Asian countries with similar economic bloom in recent years, Hong Kong’s housing price bubble is only larger than Singapore while lower than Japan, China and Taiwan. Meanwhile, housing price in the western countries is found to be undervalued. Although there at current stage, the housing price bubble in Hong Kong is not higher than most sampled Asian countries, there is a steady increasing trend in the housing price bubble in Hong Kong, the size of the bubble might soon become larger than other countries. Compare with Singapore, the two cities both have similar economic entity and market structure, yet Singapore is having a lower bubble size with a constant trend. This provide evident that the housing policy in Singapore is more effective than in Hong Kong in controlling the housing price. Hong Kong government should take serious consideration in formulating her future housing policy referencing to Singapore government.
If sufficient data are available, the regression model can be used to determine the actual size of the housing price bubble across worldwide major cities, the result can be more comprehensive due to similarly in demographic demand factors and other demand shifting factors. This can gives references for local governments to implement policy that lower the economic fundamentals, which significantly affect the housing bubble price.

A comparative study of private housing price between Hong Kong and worldwide major countries
18
Moreover, since western countries all have a negative housing bubble, especially in UK, it may be profitable to invest in the housing market in those counties.
Relevant Data Sources: Data Sources Availability Variables
Panel Study of Income Dynamics (PSID)
http://psidonline.isr.umich.edu/ Micro variables of individuals include health status, family background
Penn World Table
http://pwt.econ.upenn.edu/ Macro variables of various countries
World Bank http://www.worldbank.org/ Macro variables of various countries
OECD http://stats.oecd.org/Index.aspx?DataSetCode=CSE_2010
Macro variables of various countries
International Monetary Fund
http://www.imf.org/external/data.htm
Macro variables of various countries
International Financial Statistics
http://elibrary-data.imf.org/FindDataReports.aspx?d=33061&e=169393
Macro variables of various countries
China Statistics
http://www.stats.gov.cn/english/ Macro variables
Hong Kong Monthly Statistics
Hong Kong Monthly Digest of Statistics
Macro variables
HKBU Database in WLB 405 Micro and Macro variables
A comparative study of private housing price between Hong Kong and worldwide major countries
19
Datastream (Need registration)
WRDS https://wrds-web.wharton.upenn.edu/wrds/ (Need registration)
US firms’ stock prices and characteristics
Bibliography Chan, E., So, H., Tang, B., & Wong, W. (2008). Private space, shared space and private housing prices in Hong Kong: An exploratory study. Habitat International, 32(3), 336-348. doi:10.1016/j.habitatint.2007.11.004
Hui, E. M., Lam, M. M., & Ho, V. M. (2006). Market Disequilibrium and Urban Land Shortages: Analysis of Policy and Patterns in Hong Kong. Journal Of Urban Planning & Development, 132(2), 80-88.doi:10.1061/(ASCE)0733-9488(2006)132:2(80)
Mankiw, N.Gregory and David N.Weil, “The Baby Boom, the Baby Bust, and the Housing Market”, Regional Science and Urban Economics 19 (1989), p.235-258
Hensrud-Ellingson, S. (1998).A re-examination of the impact of demographics on the stock and price of housing.The University of Nebraska - Lincoln)
Swan, Craig, “Demography and the Demand for Housing: A Reinterpretation of the Mankiw-Weil Demand Variable”, Regional Science and Urban Economics 25(1) (1995), p. 41-58
G. Meen, M. Andrew, Modelling Regional House Prices: A review of the literature, prepared for Department of the environment, Transport and the Region, 1998
Ben-David, I. (2011). Financial constraints and inflated home prices during the real estate boom. American Economic Journal: Applied Economics, 3(3), 55-87.
A comparative study of private housing price between Hong Kong and worldwide major countries
20
Mihaljek, D. (2007). Determinants of house prices in central and eastern europe.Comparative Economic Studies, 49(3), 367-388. doi:10.1057/palgrave.ces.8100221
HM Treasury. (2003): Housing, consumption and EMU. HM Treasury: London. Im, KS, Pesaran, H and Shin, Y. 2003: Testing for unit roots in heterogeneous panels.JournalofEconometrics115: 53–74.
Case, K.E. and Shiller, R.J. (1990), "Forecasting prices and excess returns in the housing market", Journal of the American Real Estate & Urban Economics Association, Vol. 18 No. 3, pp. 253-73.
Xiao, Q., & Liu, Y. (2010). The residential market of hongkong: Rational or irrational?Applied Economics, 42(7-9), 923-933.
Housing price bubbles in hongkong, beijing and shanghai: A comparative study. (2006). Journal of Real Estate Finance and Economics, 33(4), 299-299.doi:10.1007/s11146-006-0335-2
Peng, R., & Hudson-Wilson, S. (2002). Testing real estate price bubbles: An application to Tokyo office market. Proceedings of 7th AsRES Conference in Seoul.
Ratio rentals. (2010). Economist, 394(8663), 54.
Schelkle, W. (2012). A Crisis of What? Mortgage Credit Markets and the Social Policy of Promoting Homeownership in the United States and in Europe*. Politics & Society, 40(1), 59-80. doi:10.1177/0032329211434690
Watson, M. (2007). Constituting Monetary Conservatives via the 'Savings Habit': The Sustainability of the Ongoing British Housing Market Bubble amidst the Shift towards a System of Asset-Based Welfare. Conference Papers -- International Studies Association, 1-28.

A comparative study of private housing price between Hong Kong and worldwide major countries
21
WILLIAMSON, K. D. (2009). The Committee to Reinflate the Bubble. National Review, 61(10), 19-22.
Richardson, C. (2003). Blow away those bubbles. Brw, 25(47), 24.
DENNIS, H. (2003, October 17). Residential Real Estate; No Price Bubble in Region's
Housing, Study Concludes. New York Times. p. 4.
Appendix
Appendix 1 - Regression table of ADL (1.4) model of dstock
Dependent Variable: DPHI Method: Least Squares Sample (adjusted): 1997Q2 2011Q4 Included observations: 59 after adjustments Variable Coefficient Std. Error t-Statistic Prob. C -8.94E-05 0.002387 -0.037464 0.9703 DPHI(-1) 0.592252 0.106743 5.548400 0.0000 DSTOCK(-1) 0.167949 0.041508 4.046146 0.0002 DSTOCK(-2) -0.061685 0.048731 -1.265828 0.2111 DSTOCK(-3) 0.024313 0.041943 0.579678 0.5646 DSTOCK(-4) -0.077726 0.041599 -1.868464 0.0672 R-squared 0.587711 Mean dependent var 0.001258 Adjusted R-squared 0.548816 S.D. dependent var 0.026985 S.E. of regression 0.018126 Akaike info criterion -5.086770 Sum squared resid 0.017414 Schwarz criterion -4.875495 Log likelihood 156.0597 Hannan-Quinn criter. -5.004297 F-statistic 15.11012 Durbin-Watson stat 1.748867 Prob(F-statistic) 0.000000

A comparative study of private housing price between Hong Kong and worldwide major countries
22
Appendix 2 - Dicky-fuller test results after taking 1st difference
Hong Kong dlabcost t-Statistic Prob.* Augmented Dickey-Fuller test statistic -3.152664 0.0281 Test critical values:
1% level -3.548208
5% level -2.912631 10%
level -2.594027
dnw t-Statistic Prob.* Augmented Dickey-Fuller test statistic -7.123096 0 Test critical values:
1% level -3.540198
5% level -2.909206 10%
level -2.592215
dphi t-Statistic Prob.* Augmented Dickey-Fuller test statistic -7.123096 0 Test critical values:
1% level -3.540198
5% level -2.909206 10%
level -2.592215
dr t-Statistic Prob.* Augmented Dickey-Fuller test statistic -3.397677 0.0147 Test critical values:
1% level -3.540198
5% level -2.909206 10%
level -2.592215
drent t-Statistic Prob.* Augmented Dickey-Fuller test statistic -3.792895 0.0049 Test critical values:
1% level -3.540198
5% level -2.909206 10% -2.592215

A comparative study of private housing price between Hong Kong and worldwide major countries
23
level dstock t-Statistic Prob.* Augmented Dickey-Fuller test statistic -7.256232 0 Test critical values:
1% level -3.540198
5% level -2.909206 10%
level -2.592215
dw t-Statistic Prob.* Augmented Dickey-Fuller test statistic -2.708979 0.0785 Test critical values:
1% level -3.546099
5% level -2.91173 10%
level -2.593551
dy t-Statistic Prob.* Augmented Dickey-Fuller test statistic -3.989088 0.0028 Test critical values:
1% level -3.550396
5% level -2.913549 10%
level -2.594521

A comparative study of private housing price between Hong Kong and worldwide major countries
24
Appendix3 - Graph of predicted value of housing price index (phif) against actual
housing price index (phi) in Hong Kong 1996q1 – 2006q4
0
0.5
1
1.5
2
2.5
3
Q1 1996 Q1 1997 Q1 1998 Q1 1999 Q1 2000 Q1 2001 Q1 2002 Q1 2003 Q1 2004 Q1 2005 Q1 2006
phi phif

A comparative study of private housing price between Hong Kong and worldwide major countries
25
2
2.05
2.1
2.15
2.2
2.25
2.3
2.35
Q1 2007 Q1 2008 Q1 2009 Q1 2010 Q1 2011
phi phif
Singapore
1.9
1.92
1.94
1.96
1.98
2
2.02
2.04
2.06
2.08
Q1 2007 Q1 2008 Q1 2009 Q1 2010 Q1 2011
phi phif
Japan
2.14
2.16
2.18
2.2
2.22
2.24
2.26
2.28
2.3
Q1 2007 Q1 2008 Q1 2009 Q1 2010 Q1 2011
phi phif
UK
2.2
2.22
2.24
2.26
2.28
2.3
2.32
2.34
2.36
Q1 2007 Q1 2008 Q1 2009 Q1 2010 Q1 2011
phi phif
US
1.92
1.94
1.96
1.98
2
2.02
2.04
2.06
2.08
2.1
Q1 2007 Q1 2008 Q1 2009 Q1 2010 Q1 2011
phi phif
France
1.98
2
2.02
2.04
2.06
2.08
2.1
2.12
2.14
2.16
Q1 2007 Q1 2008 Q1 2009 Q1 2010 Q1 2011
phi phif
China
Appendix 4 - Size of house price bubbles of different countries (2007q1-2011q4)
A comparative study of private housing price between Hong Kong and worldwide major countries
26
2
2.05
2.1
2.15
2.2
2.25
Q1 2007 Q1 2008 Q1 2009 Q1 2010 Q1 2011
phi phif
Taiwan