a comparative study of athletic apparel made from cotton
TRANSCRIPT

Eastern Michigan UniversityDigitalCommons@EMU
Master's Theses and Doctoral Dissertations Master's Theses, and Doctoral Dissertations, andGraduate Capstone Projects
6-30-2006
A comparative study of athletic apparel made fromcotton/flax, cotton/polyester, and polyester/flaxblendsElizabeth Skomra
Follow this and additional works at: https://commons.emich.edu/theses
Part of the Materials Science and Engineering Commons
This Open Access Thesis is brought to you for free and open access by the Master's Theses, and Doctoral Dissertations, and Graduate Capstone Projectsat DigitalCommons@EMU. It has been accepted for inclusion in Master's Theses and Doctoral Dissertations by an authorized administrator ofDigitalCommons@EMU. For more information, please contact [email protected].
Recommended CitationSkomra, Elizabeth, "A comparative study of athletic apparel made from cotton/flax, cotton/polyester, and polyester/flax blends"(2006). Master's Theses and Doctoral Dissertations. 21.https://commons.emich.edu/theses/21
A COMPARATIVE STUDY OF ATHLETIC APPAREL MADE FROM
COTTON/FLAX, COTTON/POLYESTER, AND POLYESTER/FLAX BLENDS
by
Elizabeth Skomra
Thesis
Submitted to the Department of School of Technology Studies
Eastern Michigan University
in partial fulfillment of the requirements
for the degree of
MASTER OF SCIENCE
in
Apparel, Textiles, and Merchandising
Thesis Committee:
Subhas Ghosh, Ph.D., Chair
Morell Boone, Ph.D.
Julie Becker
June 30, 2006
Ypsilanti, MI
ii
ACKNOWLEDGEMENTS
The author wishes to express her appreciation to the people and resources that
enabled the completion of this research. Sincere thanks to Dr. Subhas Ghosh, her advisor,
for his constant guidance through this research.
Appreciation is extended to David McAlister and Dr. Jonn Foulk, at the USDA
ARS Cotton Quality Research Station in South Carolina, for providing the yarn and
fabric processing. In addition, thank you to Dr. Foulk, for arranging testing with the
University of Georgia and ITT in Virginia. Thank you to those Institutes for providing
the testing and results that otherwise would have made this research impossible.
Thanks are also extended to Dr. Muralidharan Nair, for his time and patience
regarding assistance in the statistical analysis of the data. Without his kindness, the
research results would have been unexplainable.

iii
ABSTRACT
The desired attributes of sports apparel garments are to have durability
characteristics, such as tearing and tensile strength, and comfort characteristics, such as
wicking, vapor transmission, and air permeability. Currently, most sports apparel is made
from a blend of polyester or other synthetic fibers. Through examining the uniqueness of
natural fibers, such as cotton and flax, the advantages and benefits of using a higher
percentage of natural fibers when manufacturing comfortable and functional high
performance athletic wear can be obtained.
Results from this study, regarding durability, determined that for both tearing and
breaking strength, traditional sports apparel made with polyester/cotton blends are
comparable to the test polyester/flax blend fabric As well, traditional sports apparel
made with 100% cotton are comparable to the 75% cotton/25% flax test fabric.
Comfort results indicate that polyester/flax is superior to all other tested fabrics
for air permeability. In addition, cotton/flax fabric is highest in absorptive capacity. Last,
all five fiber blends tested for moisture vapor transmission are comparable since they are
not significantly different.

iv
TABLE OF CONTENTS
ACKNOWLEDGEMENTS.............................................................................................ii ABSTRACT ..................................................................................................................iii Chapter 1: Introduction ...................................................................................................1
Purpose and Objectives of the Study............................................................................ 2
Hypothesis .................................................................................................................. 2
Chapter 2: Literature Review...........................................................................................3
Flax ............................................................................................................................ 3
Cotton ......................................................................................................................... 8
Polyester ................................................................................................................... 10
Blends ....................................................................................................................... 13
Blending process ....................................................................................................... 13
Cotton/polyester ........................................................................................................ 15
Cotton/flax ................................................................................................................ 16
Comfort..................................................................................................................... 16
Wicking ..................................................................................................................... 17
Vapor and Air Permeability ...................................................................................... 18
Durability.................................................................................................................. 20
Tenacity .................................................................................................................... 20
Thickness .................................................................................................................. 21
Fabric Thread Count................................................................................................. 21
Chatper 3: Methods ....................................................................................................... 22
Research Design ....................................................................................................... 22

v
TABLE OF CONTENTS (continued)
Experimental Design ................................................................................................. 22
Test Methods ............................................................................................................. 24
Chapter 4: Results and Discussion................................................................................. 30
Durability Testing Results ......................................................................................... 30
Comfort Testing Results............................................................................................ 36
Chapter 5: Conclusions ................................................................................................. 42
REFERENCES ............................................................................................................. 43
APPENDIX A-1............................................................................................................ 45
APPENDIX B............................................................................................................... 55
APPENDIX C............................................................................................................... 56
APPENDIX D-1............................................................................................................ 57
APPENDIX E-1............................................................................................................ 64

vi
LIST OF TABLES
Experimental Design ..................................................................................................... 22
Description of lot number for fiber blends and letter for yarn count .............................. 30
LIST OF FIGURES
Stem of flax plant showing the bundle of fiber cells lying below the surface layer...........4
Processing steps of the cotton system ............................................................................ 15
Tongue tear results for yarn count 20............................................................................. 32
Tongue tear results for yarn count 24/1s ........................................................................ 32
Tongue tear results for yarn count 18/1s ........................................................................ 33
Grab test results for yarn count 20/1s............................................................................. 34
Grab test results for yarn count 24/1s............................................................................. 35
Grab test results for yarn count 18/1s............................................................................. 35
Air permeability results measured in cfm ...................................................................... 37
Air permeability results measured in m3/m2/min .......................................................... 37
Absorptive rate results for all fiber blends and yarn counts............................................ 38
Absorptive capacity rates for all fiber blends and yarn counts........................................ 39
Moisture vapor transmission rate for all fiber blends and yarn counts ............................ 40
Moisture vapor transmission rate for all fiber blends and yarn counts ............................ 40

1
Chapter 1: Introduction
Athletic wear is playing a larger role in the apparel industry due to the increasing
demand by the general consumer for comfortable, high performance athletic wear.
Athletic wear is used not only by professional athletes but also by the average consumer.
Currently, the public is able to purchase high performance athletic wear that offers a wide
variety of benefits, such as comfort, wicking properties, and dryness. Many of these
products are made from a percentage of synthetic fibers.
Most research done on athletic apparel fabric to date has concentrated on
analyzing the performance and comfort characteristics. Fesquet-Stanley (1998) examined
moisture wicking and evaporation properties in knit fabrics for athletic wear. Her
research showed that wicking was influenced by fabric cover or tightness. Her research
involved the use of Polypropylene, polyester, and Coolmax ®, all synthetic fibers. The
method necessary to make the high performance apparel items has not been a major
consideration. The consumer’s satisfaction with the end product is the focus and not other
aspects, such as pollution created in the environment during the manufacturing process.
Once the consumer has purchased the product and used it for its intent, there is also a
disposal issue that is also not considered. A modern movement by environmentalists is to
create a “cradle to cradle” product. A movement that focuses on creating a product that is
environmentally friendly from its raw materials through the production process and the
disposal of the product. This process creates no waste to the environment or the
surroundings (McDonough & Braungart, 2002). The higher the percentage of natural
fiber in the product, the more environmentally friendly it is. Natural fibers, such as cotton
2
and flax, are highly biodegradable and a renewable, natural resource as compared to
polyester, which is a synthetic fiber, used often in high performance athletic apparel.
While it is necessary to produce sports apparel that has high performance
characteristics such as strength, wicking ability and comfort, it is necessary to look at
alternate textiles than synthetics such as polyester. Looking into the future, it is beneficial
to seek natural fibers if they can provide comparable end products to the ones made of
synthetic fibers.
Purpose and Objectives of the Study
The purpose of this study is to demonstrate that natural fibers such as flax and
cotton can have similar performance characteristics to synthetic fibers, such as polyester,
in sports apparel. For this research, sports apparel is defined as a t-shirt made from a
knitted fabric composed of polyester, cotton, flax, or a blend of these fibers. Our main
objectives are to test and compare the wickability, air transfer, permeability, and strength
of polyester/cotton, polyester flax, and cotton/ flax blend fabrics. The following specific
objectives emerged from this goal:
1. Produce yarn using flax in blends with cotton and polyester.
2. Produce fabric from these blend yarns.
3. Investigate comparative properties for fabric containing flax against
polyester/cotton traditional fabric.
Hypothesis
Flax, being hygroscopic, is comfortable and has characteristics such as durability,
aesthetics, and appearance retention currently used t-shirts that include blends made up of
synthetic fibers but has the added advantage of being a renewable crop resource.
3
Chapter 2: Literature Review
Natural fibers have unique properties compared to synthetic fibers. The
manufacturing processes, the characteristics, and the blending traits are considered in
producing high performance athletic wear. Comfort properties, such as air transfer,
moisture transfer, and wickability, are essential when it comes to athletic wear. Through
examining the uniqueness of natural fibers, the advantages and benefits of using a higher
percentage of natural fibers when manufacturing comfortable and functional high
performance athletic wear can be obtained.
Flax
Flax is a bast fiber (Kadolph and Langford, 2002). The fiber is produced from the
stem and root of the annual plant, Linum usitatissimum. The plant is able to grow in many
temperate and sub-tropical regions of the world. Western Europe is a major producer of
flax due to its moist, temperate climates. The plants grow to reach 3-4 ft in height. They
are ready to be picked after they flower and the seeds are starting to ripen, usually in mid-
July/August. Hann (2005) states that harvesting by mechanical pullers is the preferred
method. Mechanical pullers are better than mowing since cutting the stem can lead to a
loss of up to 10% of the viable fiber. In the past, hand pulling was the method used but it
was both costly and labor intensive.
The fiber is found in one-quarter of the stem (Cook, 1964). The stem is
composed of five layers: (a) the epidermis, (b) the cortex, (c) the bast layer, (d) the
cambium layer, and (e) the interior woody tissue. The fiber strands are found within the
inner bark of the plant composed of longer, slender, and thick-walled cells. The outer
layer of the epidermis is covered with a layer of thin wax. This layer protects the plant
4
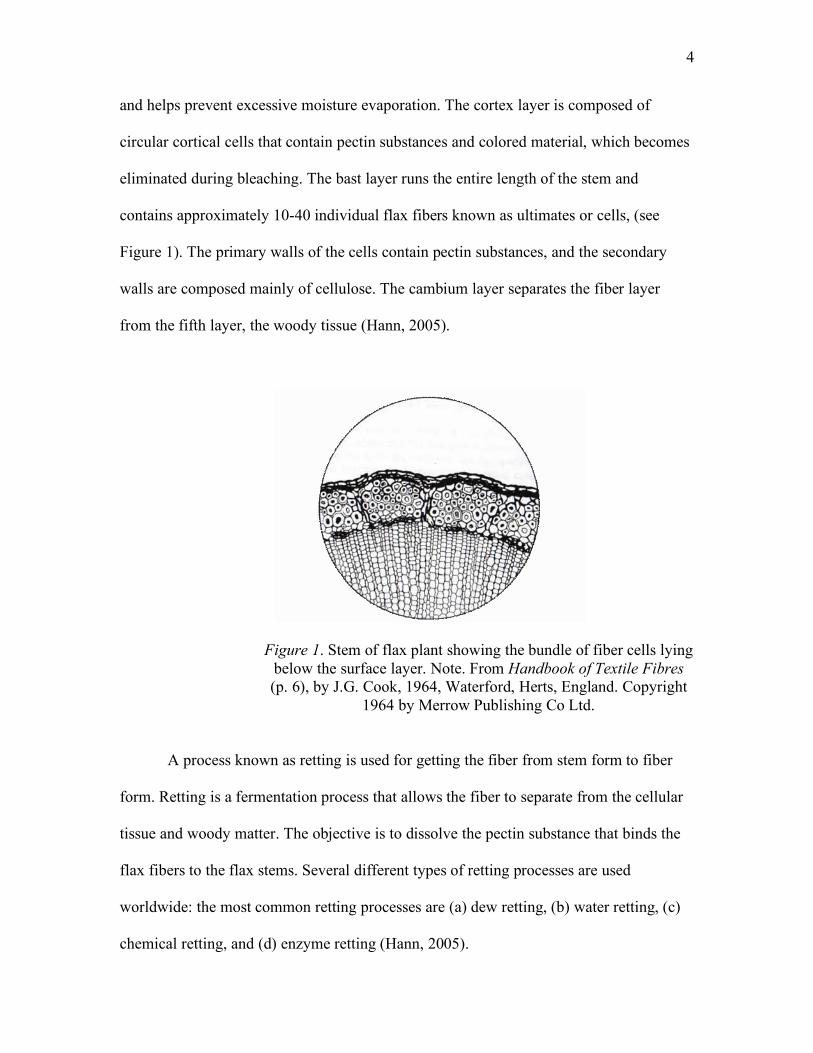
and helps prevent excessive moisture evaporation. The cortex layer is composed of
circular cortical cells that contain pectin substances and colored material, which becomes
eliminated during bleaching. The bast layer runs the entire length of the stem and
contains approximately 10-40 individual flax fibers known as ultimates or cells, (see
Figure 1). The primary walls of the cells contain pectin substances, and the secondary
walls are composed mainly of cellulose. The cambium layer separates the fiber layer
from the fifth layer, the woody tissue (Hann, 2005).
Figure 1. Stem of flax plant showing the bundle of fiber cells lying below the surface layer. Note. From Handbook of Textile Fibres (p. 6), by J.G. Cook, 1964, Waterford, Herts, England. Copyright
1964 by Merrow Publishing Co Ltd.
A process known as retting is used for getting the fiber from stem form to fiber
form. Retting is a fermentation process that allows the fiber to separate from the cellular
tissue and woody matter. The objective is to dissolve the pectin substance that binds the
flax fibers to the flax stems. Several different types of retting processes are used
worldwide: the most common retting processes are (a) dew retting, (b) water retting, (c)
chemical retting, and (d) enzyme retting (Hann, 2005).

5
Dew retting occurs after mechanical pulling and deseeding. The crop is spread on
the ground for 3-7 weeks, during which time microorganisms from the environment
secrete enzymes that break down the pectin, allowing the fibers to be free from the
cellular tissue. Dew retting is the most common type of retting practice and results in
high quality linen. Disadvantages of this method include limitations in geographical
locations due to appropriate temperature and moisture conditions, and the fibers are
coarser and of lower quality than water retting. The advantages of dew retting include the
ease of method and energy conversation (Hann, 2005).
Water retting traditionally was practiced by holding the flax stalks below water
level of dams, ditches, streams or rivers, but in recent times uses tank retting. The process
takes from 8-14 days in an open or closed tank. A cascade tank design may also be used,
with three or four interconnected tanks with flowing water. Generally speaking, water
retting produces a finer fiber than dew retting but tends to be more costly. High water
consumption can be reduced by introducing aerobic bacilli and aerating the tanks. This
allows for a more alkaline solution with a lower concentration of acids and offensive
odors. This way the water can be reused. Dew retting has mostly replaced water retting in
European countries to eliminate the pollution and cost of drying (Hann, 2005).
Chemical retting occurs by treating the flax with solutions such as caustic soda,
sodium carbonate, soaps, and dilute mineral acids. The results to date have not been
favorable and research in creating new treatments is continuous. Chemical retting tends
to be more costly, and the fiber produced is not superior to that produced by biological
retting (Cook, 1964).
6
Enzyme retting is in the research stage. There are high expectations that enzyme
retting will produce water retted quality fibers but with much less pollution. The focus is
to replace the anaerobic bacteria with enzymes in tanks. Enzyme retting would be a
controlled environment by using commercially produced enzyme mixtures. Foulk et al.
states, “With enzyme retting, field dew retting is not required and the time of land
occupation is shorter so farms can be assured of the availability of the land for planting
other crops” (cited in Hann, 2005). The major advantages of enzyme retting will be (a) a
time saving of four to five days, (b) an increased yield of around 2 per cent compared to
water retting, and (c) a desirable field consistency (Hann).
Following the retting process, the next step of producing flax fiber is breaking and
scutching. During the breaking process, the dried bundles are taken through a mechanical
beating process so the rotted woody matter is broken and loosened. The straw is passed
through fluted rollers in the breaking machine so the woody matter is broken into pieces
but the fibers are not damaged. Scutching is done by beating the straw with blunt wooden
or metal blades, mostly by mechanized machines. The woody material that is removed is
called shive and can be burnt as fuel. Scutching further removes the woody tissue that
retting and breaking has loosened. After breaking and scutching, the next step is called
hacking. Hacking is the process where the fibers are combed by being drawn through a
set of pins, each succession of pins is finer than the previous one. The course and fine
fibers are separated from each other during this step. The long, fine fibers are known as
line and are used in the spinning of very fine yarns. The shorter fibers are known as tow
and are spun into fibers of lower quality. The spinning process is completed usually dry
for the coarse yarns and wet for the finer yarns (Cook, 1964).

7
Structurally, Kadolph and Langford state, “Flax averages 5.0 to 21.5 inches in
length and 12 to 16 micrometers in diameter.” Strands of commercial flax consist of
many individual fibers and average in length between ¼ inch and 2 ½ inch with a
diameter of about 1/1200th of an inch. The fiber cells are long, transparent, cylindrical
tubes, which can be either smooth or striated in length. The width of the fibers can vary
several times along the length, in addition to having nodes. The flax cell has a clearly
defined and regular width lumen or canal running through the center (see Figure 1). The
lumen disappears towards the end of the fiber. Besides being one the of oldest textile
fibers, flax has highly desirable characteristics such as “body, strength, durability, low
pilling and linting tendencies, pleasant hand, and thick-and-thin texture.” The negative
attributes of flax are mainly low resiliency and lack of elasticity. In regards to comfort,
flax tends to be used often in warm weather apparel being a good conductor of heat. The
moisture regain is a high 12 percent, with linen being approximately 20 percent stronger
wet than dry, which helps with withstanding mechanical treatment during laundering
(Cook, 1964).
In regards to research showing flax as a comfort fabric, research performed at the
ARS Cotton Quality Research Station in Clemson, SC, has been testing flax in a cotton-
flax denim blend. The lab has been spinning cotton with flax at a ratio that provides for
better moisture management in denim fabric. Blending the flax with the cotton helps to
improve moisture wicking and increase air permeability, which allows fabric to dry
quickly. McAlister states, “This natural flax fiber blend can enhance cotton’s utilization
and can compete with specialty moisture-management synthetic fibers on the market.”
(Bliss, 2005).

8
Flax is a renewable resource that has potential in a variety of disciplines. Most
recent research has concentrated on improving the retting process to reduce
environmental problems. Current issues with processing flax include soil erosion and
disposal of chemicals and contaminated water. Dew retting and enzyme retting are being
used as an alternative to reduce these environmental issues (Kadolph & Langford, 2002).
Other research is concentrating on using flax as replacement for glass fiber composites
for the automotive industry to short-fiber flax to be used for cotton spinning in high value
textiles. Flax as a natural fiber is being recognized due to low energy requirements during
manufacture and ease of recyling (“New Uses,” 2003).
Cotton
Cotton is a seed fiber that grows within a pod from a developing seed. As with
flax, cotton is cellulosic but differs in physical structure and percentage of cellulose
present. Cotton is best grown in climates that have a long growing season, temperate to
hot with plenty of rainfall and irrigation. Temperatures below 70° degrees are
unfavorable to cotton growth. In the United States, cotton is grown from Virginia to
central California and south of that line. At this time, China is the largest producer of
cotton worldwide, with the United States at second place. India, Eastern Europe,
Pakistan, Turkey, and Brazil, are also all producers of cotton (Kadolph & Langford,
2002).
Cotton grows on bushes 3 to 6 feet high. Once the blossoms fall off, the boll or
seedpod begins to grow. A boll contains seven to eight seeds, which, in turn, has as many
as 20,000 fibers. The boll will split open when it is ripe with the fluffy white fibers. Most
cotton is picked by machine and then sent to a gin for cleaning the fibers from the seeds.
9
The fibers are then pressed into bales and sold to spinning mills. Cotton is made up of a
cuticle, primary wall, secondary wall and lumen. The length of the fibers relates to the
fiber fineness and tensile strength; the longer the staple fibers, the finer and stronger the
yarn (Kadolph & Langford, 2002).
Cotton is a highly demanded fiber due to its properties. Aesthetically, it has a
matte appearance and low luster. The long-staple fibers contribute luster to the fabrics
and may be blended easily for both apparel and furnishings. Drape, luster, texture and
hand are affected by choice of yarn size and type, fabric structure, and finish. The
strength of cotton is medium with a dry breaking tenacity of 3.5 to 4.0 g/d, being stronger
when wet. Longer staple cotton produces stronger yarns because there are more contact
points between fibers when they are twisted. Abrasion resistance is good and fiber
elongation is low (3 percent), with low elasticity. Cotton is a comfortable fabric because
it is highly absorbent, has soft hand and good heat and electrical conductivity. The
moisture regain of cotton is 7 to 11 percent. There is a point with cotton when it becomes
wet that it begins to feel wet or clammy, which makes it uncomfortable. The overall
appearance retention of cotton is moderate. The resiliency is low, which is why it is not
often used in pile rugs or carpets. Cotton will shrink unless treated with a durable-press or
shrink-resistant finish. Elastic recovery is moderate. It recovers 75 percent from a 2 to 5
percent stretch. In regards to care, cotton can be washed with strong detergents and
requires no special care during washing and drying (Kadolph & Langford, 2002).
Due to the high comfort level of cotton, much research on sports apparel involves
trying to achieve that high level of comfort but with an increased amount of performance.
Products such as Dri-release with FreshGuard ® are examples of fabrics that contain little
10
or no amounts of natural fibers but feel like they do. In addition, companies that produce
these products promote them as having enhanced performance capabilities such as high
wicking characteristics (Egli, 2005).
Polyester
Polyester is produced by reacting dicarboxylic acid with dihydric alcohol. The
first polyester fiber known was Terylene and was produced in England. In 1951, the
United States was introduced to polyester by DuPont under the trade name Dacron.
Polyester is defined as “long-chain polymers chemically composed of at least 85 percent
by weight of an ester and a di-hyric alcohol and a terephthalic acid”. Polyethylene
terephthalate (PET) and poly-1,4, cyclohexylene dimethylene (PCDT) are two common
variations of polyester fiber (Polyester).
Most polyester is made from petroleum, from which the acids and alcohols are
derived. Polyester is manufactured in a general method with each individual
manufacturer having slight variances. Generally, the steps to processing of polyester
include 1) polymerization, 2) spinning, and 3) drawing (Polyester).
Polymerization occurs when acid and alcohol react in a vacuum at high
temperatures. The polymerized material is extruded in the form of a ribbon onto a casting
trough or cooling wheel. After hardening, it is cut into chips (Polyester).
During the spinning process, the chips are dried and put into a hopper for melting.
This is considered a melt spun process, which means the fiber is heated, and then
extruded through spinnerets and cools once it hits the air. From there, the fiber is wound
through cylinders (Polyester).

11
Drawing is the final stage of the manufacturing process. The fibers are hot
stretched until they are approximately five times the original length in order to decrease
the width. The drawing helps in orientation of the molecules inside the fiber, so optimal
strength is achieved (Polyester).
Polyester fibers are versatile and can be produced in many types. Physically, the
structure of polyester can be engineered to be high or regular tenacity, delustered or
bright, or solution dyed or white. There is also a variety of cross-sectional shapes,
including round, oval, trilobal, octolobal, hollow, voided, hexalobal, and star-shaped.
Polyester is able to blend very well with other fibers to maintain a natural fiber look and
texture with the added quality of easy care in apparel and furnishings (Kadolph &
Langford, 2002).
Polyester fibers are durable in regards to abrasion resistance and strength. High
strength is due to high crystallinity and molecular weight developed during the hot
drawing process. POY, partially oriented yarn, has a lower strength than staple yarns but
with an elongation of 120 to 150 percent higher than other yarns, making them a good
candidate for textured yarns. In addition, polyester has good sunlight resistance (Kadolph
& Langford, 2002).
Polyester fiber does not have high comfort in warm climate because of its low
absorbency, 0.4 to 0.8 percent. Woven polyester fabric does not allow moisture to escape
from between the skin and fabric, in turn, making the fabric feel slick and clammy. This
can be remedied with blending the fiber with a more absorbent fiber, using spun rather
than filament yarns and trilobal rather than round fibers, and adding a finish that absorbs,
wicks, or increases moisture comfort. Blending polyester with cotton increases the

12
comfort by allowing more wicking action along the outer surface of the fibers so it can
evaporate. In addition, polyester fibers tend to have static problems because of their low
absorbency. The static problems can be partially alleviated by adding water-absorbing
compounds in the spinning solution prior to extrusion, adding finishes or modifying the
fiber’s cross section (Kadolph & Langford, 2002).
Polyester has a high resiliency when elongation is low. It resists wrinkles and
recovers well, both wet and dry. It has high dimensional stability and, when properly
heat-set, retains its size. Polyester is easy to care for. The low absorbency of polyester
means it resists waterborne stains and quickly dries. Polyester is oleophilic, which means
the fabric can hold onto oily soil. In addition, bacteria odor can tend to build up and smell
on the fabric. Hot water and/or the proper detergents can alleviate these problems
(Kadolph & Langford, 2002).
Polyester research frequently involves attempts to produce the synthetic fiber with
the end goal of making it feel more like cotton. Recent research has developed a process
that integrates air texturing with air jet yarn formation to manufacture elastane and
partially oriented yarn (POY) blends. This process results in a yarn with cotton-like
qualities. Knit fabrics manufactured from the elastane and POY blends have a three
dimensional surface effect due to the elastane not being fixed to the yarn core. The
hairiness of the yarn causes a moss-like surface effect. This research has been linked for
use in the sports apparel industry (Furderer, Gries, & Satlow, 2002).

13
Blends
Kadolph and Langford (2002) explain, “A blend is an intimate mixture of fibers
of different generic type, composition, length, diameter, or color spun together into one
yarn.” There are several reasons for blending fibers. They are as follows:
1. Produce fibers with a better combination of performance characteristics.
Blends help compensate for poor performance although they will never
perform as well as the positive performance characteristics of one fiber type.
2. Improve spinning, weaving, and finishing efficiency and improve uniformity.
3. To obtain better texture, hand, or fabric appearance.
4. To minimize fiber cost. Expensive fibers can be extended by blending with
less expensive fibers.
5. To obtain cross-dyed or unique color effects.
Blending is complicated and can be expensive, but the positive attributes it creates
are permanent. Blends create improved appearance and hand while offering better
serviceability (Kandolph & Langford, 2002).
The objective in determining the correct blend level is to create a blend that gives
a more satisfactory all-around performance than a fabric made from 100 percent of one
fiber. Research by manufacturers determines the percentage of each fiber necessary in
specific products. It is not possible to generalize about percentages since they vary with
fiber type, fabric construction, and performance (Kandolph & Langford, 2002).
Blending process
There are differences in blending natural fibers with other natural fibers and
blending man-made fibers with natural fibers. In their original state, manufactured fibers

14
are solids. In order to be extruded into fibers, the fiber-forming substance must be
converted into a liquid state. Usually, the fibers are dissolved in solvent or melted. Once
they are in a liquid state, they are forced through a spinneret, which resembles a large
shower head, with varying hole sizes depending on the type of fiber being used.
Manufactured fibers have the ability to be extruded into different deniers based on their
end use (Fiber, 1999).
The long continuous filament fiber can not be used for blending as they are too
long. So the man-made fiber must first be cut into staple fibers before blending. The
staple fibers can be more easily twisted with shorter natural fibers. The man-made staple
fibers are created by extruding many continuous filaments of specific denier from the
spinneret and collecting them in a large bundle called the “tow”. The tow bundle is then
crimped and mechanically cut into staple fibers (Fiber, 1999).
Blending of staple can be done at any stage prior to the spinning operation,
including opening-picking, drawing, or roving. The general rule is the earlier the fibers
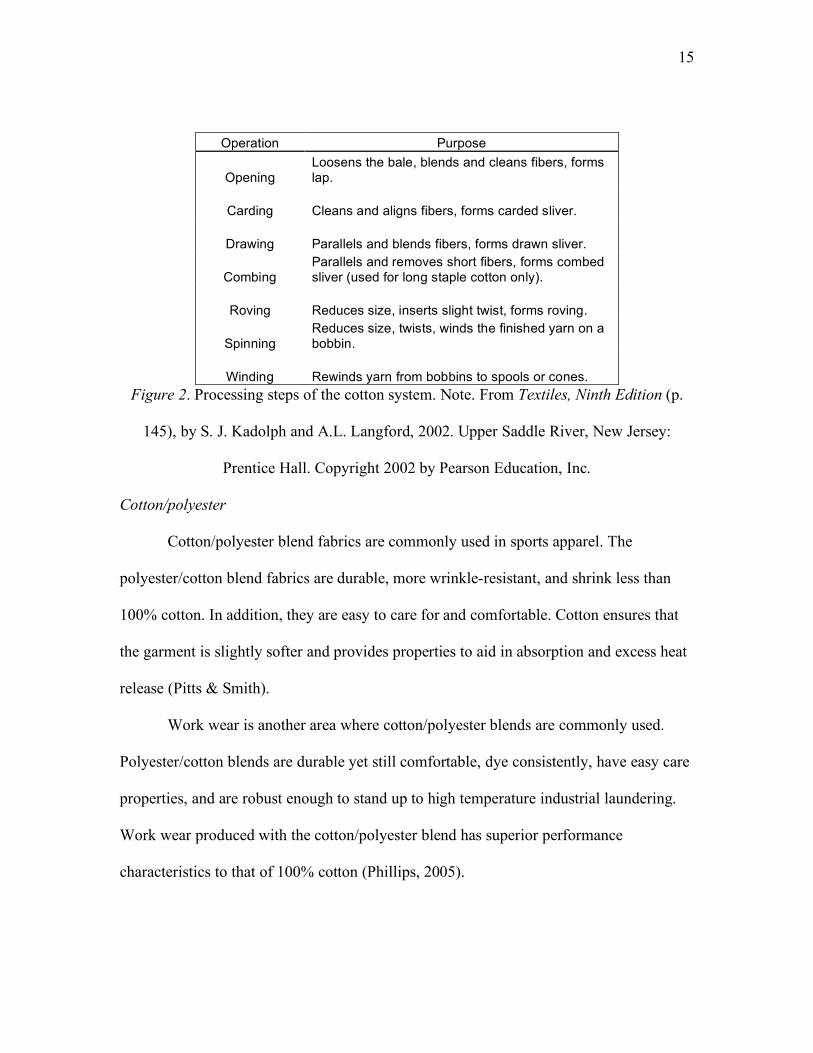
are blended in processing, the better the blend (Kandolph & Langford, 2002). Figure 2
shows the processing steps of the cotton system.
15
Operation Purpose
Opening Loosens the bale, blends and cleans fibers, forms lap.
Carding Cleans and aligns fibers, forms carded sliver.
Drawing Parallels and blends fibers, forms drawn sliver.
Combing Parallels and removes short fibers, forms combed sliver (used for long staple cotton only).
Roving Reduces size, inserts slight twist, forms roving.
Spinning Reduces size, twists, winds the finished yarn on a bobbin.
Winding Rewinds yarn from bobbins to spools or cones. Figure 2. Processing steps of the cotton system. Note. From Textiles, Ninth Edition (p.
145), by S. J. Kadolph and A.L. Langford, 2002. Upper Saddle River, New Jersey:
Prentice Hall. Copyright 2002 by Pearson Education, Inc.
Cotton/polyester
Cotton/polyester blend fabrics are commonly used in sports apparel. The
polyester/cotton blend fabrics are durable, more wrinkle-resistant, and shrink less than
100% cotton. In addition, they are easy to care for and comfortable. Cotton ensures that
the garment is slightly softer and provides properties to aid in absorption and excess heat
release (Pitts & Smith).
Work wear is another area where cotton/polyester blends are commonly used.
Polyester/cotton blends are durable yet still comfortable, dye consistently, have easy care
properties, and are robust enough to stand up to high temperature industrial laundering.
Work wear produced with the cotton/polyester blend has superior performance
characteristics to that of 100% cotton (Phillips, 2005).

16
Cotton/flax
Recent research into flax has focused on blending cotton with flax. Cotton/flax
blends naturally absorb and transfer moisture away from the body. Not only is flax two to
three times stronger than cotton, allowing for durable clothing, but it also keeps skin cool
by improving moisture wicking. Wearing 100% cotton clothing during exercise can make
skin feel clammy since it does not dry quickly. Adding flax to the blend allows for better
moisture management with high air permeability, which allows fabric to dry more
quickly (Bliss, 2005).
The ARS Cotton Quality Research Station has been spinning cotton with flax and
producing denim with improved moisture management. Through this research, a more
comfortable denim jean is being produced to be worn even in the hot summer months
(Bliss, 2005).
Comfort
Comfort is both a matter of personal perception and measurable characteristics.
Comfort of a fabric depends on attributes such as absorbency, heat retention, density, and
elongation. Absorbency is a fabric’s ability to take up moisture from the body or the
environment. Hydrophilic fibers absorb moisture readily where hydrophobic fibers have
little or no absorbency. Hygroscopic fibers are defined as fibers that absorb moisture
without feeling wet (Kandolph & Langford, 2002).
Comfort in clothing is impacted by uncomfortable feelings of wetness when the
body of the wearer begins to sweat in order to release body heat. Garments that absorb
body fluid, which are mainly water and water vapor, can reduce the level of discomfort.
Cheung and Cheng (1995) state, “The main factors governing the differences in
17
absorbency of garments are fiber type, yarn type, type of fabric construction and garment
construction.”
Cotton fibers are hydrophilic due to their hydroxyl groups, which have hydrogen
bonds that attract and bond with water molecules. Polyester, on the other hand, does not
contain hydroxyl or polar groups that bond with water. Fabric finishing can adjust these
levels of absorption, though (Cheung & Cheng, 1995).
Wicking
Fabrics will differ in their ability to wick moisture away from the skin surface and
allow perspiration to pass through (water vapor permeability). These factors depend on
fabric porosity. Fiber crimp, fiber surface smoothness, yarn type (spun versus filament),
and fabric construction are all factors that impact porosity. The loss of moisture vapor or
liquid through clothing is important for heat balance and comfort. If this water passage is
restricted in anyway, the wearer will experience some level of discomfort. There are four
methods through which water can pass through a textile material (Cheung & Cheng,
1995):
1. Penetration through the space between fibers according to the laws of
diffusion.
2. Absorption by the fiber material as a result of transfer within fibers and
desorption.
3. Transfer of liquid through capillary interstices in yarns.
4. Migration of water on fiber surfaces.
The two common wicking tests are the Vertical wicking test and the (horizontal)
Gravimetric Absorbency Testing System (GATs). The vertical wicking test is conducted
18
by measuring water transport rate according to a vertical strip wicking test. One end of a
strip is clamped vertically, with a dangling end immersed to about 3 mm in water. The
height to which the water is transported along the strip is measured at timed intervals. A
higher wicking value shows greater liquid water transport ability. In the GATs system,
the fluid is absorbed radially outward along the plane of the sample from a single point of
1/4 inch diameter in the bottom of a test plate. The GATS is interfaced with a recorder,
which provides a plot of the amount of fluid absorbed as a function of time (“Textile
Protection,” 2006).
Vapor and Air Permeability
Vapor resistance of textile materials is fundamental to thermophysiological
comfort. Vapor resistance of textile materials is what governs the loss of metabolic heat
by the body. When an individual is exercising at a high rate or when in a warm
environment, the evaporation of sweat from the skin becomes the main means of
metabolic heat loss and vapor resistance becomes the main factor in clothing comfort
(“Innovations,” 2006).
Vapor resistance is also roughly related to fabric thickness. A lightweight cotton
t-shirt will have a vapor resistance of approximately 2-3 units. Vapor resistance is
measured in units of meters squared Pascal/Watt (m2 Pa/W). In summary, the lower the
vapor resistance of a product, the greater the wearer comfort (“Innovations,” 2006).
ASTM E 96-90 is used to determine the water vapor transmission (WVT) of the material.
The air permeability of a textile fabric describes the degree to which a fabric is penetrable
by air. Air flow occurs when air pressure is different on the two sides of the fabric. It is
related to convective heat transfer and moisture transfer by diffusion. The higher amount
19
of porosity a fabric has, the higher amount of air permeability (Collier & Epps, 1999).
ASTM D 737-04 test methods are used to measure the air permeability of the
fabrics. This test measures the rate of air flow passing perpendicularly through a known
area of fabric. The rate of air flow is adjusted to obtain a prescribed air pressure
differential between the two fabric surfaces. The air permeability is then determined.
Past research on comfort has compared cotton to cotton/polyester blends fabrics.
Research conducted by Hes looked into the optimization of shirt fabrics’ composition
from the point of view of their appearance and thermal comfort. Hes states, “Many
people prefer to wear 100 percent cotton shirts, because they consider their thermal and
sensorial comfort better, especially on hot days, in spite of the common experience, that
shirts containing even a small portion of PES fibres exhibit few wrinkles, show a smooth
surface and can be easily ironed.” The thermal comfort of a suddenly wetted shirt and
some mechanical parameters were measured with the aim of determining the effect of
their composition on the quality level. The results of his study showed that shirts
(woven) “containing 25-40 per cent of classical PES fibres blended with cotton,
compared with non-treated pure cotton shirts, have shown similar or even better water
vapour permeability, fairly warmer feeling in dry state, better shear, fairly better ability to
keep the form and a bit lower moisture absorptivity (worse thermal contact comfort
feeling in the case of superficial wetting)” (Hes,1999).
Measuring comfort properties is not a straight forward equation. Multiple
properties and measurements must be tested, compared, and analyzed. Even with
sufficient testing, the results are not always in agreement with practical experience. Much
of past research has concentrated on comparing cotton to polyester when testing for
20
comfort. This study will help open the door to introducing flax as another candidate for
further research in regards to a performance comfort fabric.
Durability
Textiles must be durable in order to be sold as apparel. A textile product without
durability will be useless to the consumer if it falls apart after a single use. The durability
of sports apparel is even more important than the average apparel item as it is exposed to
extreme wear and tear by the consumer.
Tenacity
The tensile strength or tenacity of a fabric is the ability to withstand a pulling
force. Fabric strength depends a great deal on fiber strength but, in addition, yarn and
fabric structure also play a part affecting fabric strength. The tearing strength is the force
needed to rip a fabric (Kandolph & Langford, 2002). The tearing strength is determined
on the CRE (Constant Rate Extension) machine by the Tongue Tear Test (ASTM 2261).
In this test, a rectangular specimen is cut halfway through the long dimension and the two
“tongues” are placed in the clamps of the tester. The tongues are then pulled apart and
individual yarns are broken, either one or two at a time. The resistance to the force is
recorded (Collier & Epps, 1999).
The Grab Test (ASTM Standard D 5034) is used to determine the breaking
strength of the fabric. The specimen is cut wider than the jaws of the CRE and gripped in
the middle. The reason is to measure the strength of the fabric and not the strength of the
yarns actually gripped between the clamps (Collier & Epps, 1999).

21
Thickness
Fabric thickness is important in terms of determining thermal insulation, which, in
turn, determines thermal comfort. A thicker fabric will have a higher resistance to heat
transfer than a thin fabric. The ratio of thickness to weight is important in determining
comfort. In sports apparel, the fabric must be lightweight in order to be considered
comfortable. ASTM D 1777 - Standard Test Method for Thickness of Textile Materials is
used to determine thickness. The fabric is weighed as ounces per square yard and
recorded (Collier & Epps, 1999).
Fabric Thread Count
Fabric thread count is measured by counting the number of wales and courses in a
specified area of the fabric. They are recorded as yarns per inch. ASTM Standard D 3775
is followed for this procedure (Collier & Epps, 1999). Fabric thread count is an indication
of the quality of the fabric. Generally speaking, the higher the count, the better quality of
the fabric. Higher count may also indicate less shrinkage in the fabric (Kandolph &
Langford, 2002).
Summary
With an increasing demand for more comfortable sports apparel, there is a need to
look at alternates to the traditional fabrics, such as polyester and cotton blends, that are
used today. Flax is an excellent candidate as an alternative. Flax is a renewable crop
resource that has several desirable performance and comfort characteristics. In addition,
with the advancements made in the retting processes of flax, there may be additional
economic benefits to flax.

22
Chatper 3: Methods
Research Design
The research design paradigm was quantitative. A classical factorial design was
used to study the effects of independent variables, such as fiber blend and yarn count on
various fabric properties including comfort. The dependent variables (responses) were
wicking, air permeability, and vapor permeability, which relate to comfort, and tensile
strength, tearing strength, fabric thread count, and thickness, which relate to fabric
durability. The experiment also allowed the study of the effect of first order interaction.
Five different fiber blends were used in addition to three different yarn counts of each
blend, which resulted in 15 experimental conditions.
Yarn Count
Poly/Cotton (88/12%)
Poly/Flax (88/12%)
Cotton/Flax (75/25%)
Cotton (100%)
Polyester (100%)
18/1 X X X X X 20/1 X X X X X 24/1 X X X X X
Table 1. Experimental Design
x = responses such as wicking, vapor permeability, tensile strength, tearing strength, air
permeability, fabric density, and thickness.
Once the significant variables that affect the above mentioned responses were
identified, both the main effect and interaction effects were analyzed. Analysis of
confidence bands were determined to identify significant changes in the responses due to
a change in independent variables. All statistical analysis was processed using SPSS
software.

23
The Yarn and Fabric Processing Parameters
All fibers used during this research and all yarn and fabric processing were
performed by USDA ARS Cotton Quality Research Station in South Carolina. Additional
yarn and processing parameters are presented in Appendixes A-1 through A-5.
Raw materials
The raw materials used are as follows:
• Cotton (MQ-376 Fibermax 966 MS 5122677)
• Flax (Temafa)
• Polyester (T472 manufactured by Wellman, Inc.)
Carding and Drawing
Each fiber such as cotton, flax, and PET was opened and cleaned separately. The
cotton and flax fibers were fed into the hoppers. Fibers were also carded separately on a
Truetzschler DK 740 flat cotton-card machine. Carded sliver was blended on a draw
frame using three passes. They were as follows:
• Drawing 1st pass Rieter SB951
• Drawing 2nd pass Rieter SB951
• Drawing 3rd pass Ingolstadt RSB51
Spinning
Three yarn counts were spun on a commercial level Muratec Murata Machinery Ltd.
851 vortex spinning machine:
• 25lbs 18/1’s at 380 meters/minute
• 25lbs 20/1’s at 380 meters/minute
• 25lbs 24/1’s at 380 meters/minute

24
Knitting
The fabric was knit on a 10” diameter MJ 24653 Supreme Machine Singer
Supreme Co. Inc. knitting frame.
Finishing
The chemicals used on the fabrics were a 1% (w/w) nonionic wetting agent and
4% (w/w) caustic soda. The procedures for the finishing of the fabric included the
following steps:
• Raise temperature to 90°C and run fabric through a loop for 1 hour in chemical
solution
• Drain-Refill with fresh water
• Three Rinses, 5 minutes each
• Add 0.125% (or 0.5 g/L) Acetic Acid on third rinse to neutralize
Test Methods
The following are the tests used to characterize the experimental fabric. Tensile,
tearing strength, and fabric density testing was performed at Eastern Michigan
University. Mass per unit area, thickness of materials, air permeability, and GATS testing
was performed at the University of Georgia. Moisture vapor transmission rate testing was
performed at ITT in Virginia.
Durability Tests
Dependent Test Characteristic Test Method
Tearing strength of the fabrics ASTM D 2261-96 Tensile strength of the fabrics ASTM D 5034
For the durability tests, ASTM D 2261-96 and ASTM D 5034, the tests were
conducted at Eastern Michigan University’s textiles lab. A CRE (Constant Rate of

25
Extension) machine was used to determine peak load of the fabrics. For each test, five
specimens were tested per sample.
For the Tongue Tear Test, ASTM D 2261-96, five specimens per sample were cut
into 3”X 8” strips: a 3-inch cut was made on one side in the center of the fabric. The
clamps were set 3 inches apart. The testing machine was set to run 2 inches per minute.
The specimens were secured in the clamp jaws so that one leg of the cut was in the upper
jaw and the other leg of the cut in the lower jar.
For the Grab Test, ASTM D 5034-95, five specimens per sample were cut into 4”
X 6” samples. The fabric was placed in the clamps, which were set 3 inches apart. A
weight was used to insure that the same amount of tension was put on each of the
samples while securing the clamps. The testing machine was set to run 12 inches per
minute.
In use and care of textile products, especially sports apparel, fabrics will be
subjected to stretching, twisting, bending, shearing, and compression. It is important to
know that the fabric will have the expected minimum level of fabric strength.
Comfort Testing
Dependent Test Characteristic Test Method Absorption capacity and rate (GATS) ASTM D 5802-95 Water vapor transmission ASTM E 96-80 Air permeability of textile materials ASTM D 737-04
Testing for absorption capacity, ASTM D 5802-95, and air permeability, ASTM
D 737-04, was conducted at the University of Georgia. For each test, 10 specimens were
tested per sample. Water vapor transmission, ASTM E 96-80 was conducted at ITT.
ASTM D 737-04, standard test method for air permeability of textile fabrics, used
an air permeability testing apparatus consisting of a test head, clamping system, pressure
26
gauge, flowmeter, calibration plate, and templates. The test measured the rate of air flow
passing perpendicularly through a specific area of fabric that is set to obtain a prescribed
air pressure differential between the two fabric surfaces. Air permeability testing
measures the degree to which the material is penetrable by air. This is important for
comfort in sports apparel as it is necessary for proper air flow in order to keep the body
cool.
The absorption rate and capacity tests, GATs method, Gravimetric Absorbency
Testing System, ASTM D 5802-95, are necessary for determining comfort levels in
sports apparel because they allow for measuring the amount and rate at which moisture is
wicked away from the skin. The GATs method uses a vertical strip method where a
single hole supplies fluid to the fabric to simulate sweated skin. See Appendix B for
photographs of GATs testing procedure performed at University of Georgia. Ten
specimens per sample were tested. A person wearing sports apparel tends to sweat; once
the user sweats, the fabric should take the moisture away from the wearer so they do not
feel clammy. The comfort level of the fabric increases with absorption capacity and rate.
ASTM 96-80 test methods were used to determine moisture vapor transmission
rate. The rate of moisture vapor diffusion through the fabric is determined according to
the Simple Dish Method, similar to ASTM E96-80 (see Appendix C). A sample was
placed on a water dish (82 mm in diameter and 19 mm in depth) allowing a 9 mm air
space between the water surface and specimen. A vibration-free turntable carrying 8
dishes rotate uniformly at 5 meters per minute, insuring that all dishes were exposed to
the same average ambient conditions during the test. The assembled specimen dishes
were allowed to stabilize for two hours before taking the initial weight. They were

27
weighed again after a 24-hour interval. Then the rate of moisture vapor loss (MVTR)
was calculated in units of g/m2-24 hours. A higher MVTR value indicates there is a
greater passage of moisture vapor through the material.
The more active the wearer is, the more perspiration is produced. Moisture vapor
transport rate helps determine the comfort level of the fabric by measuring how quickly
moisture vapor, such as perspiration, moves from the interior side of the fabric, next to
the body, to the exterior side. A comfortable fabric will have a high moisture vapor
transport rate (MVTR).
Fabric Properties
Dependent Test Characteristic Test Method Fabric density ASTM D 3775 Mass per unit area of textile materials ASTM D 3776 Thickness of textile materials ASTMD1777-96(02) Stiffness of fabric ASTM D 6828-02 Bursting Strength of textile fabrics ASTM D 3786-01
Testing performed for other fabric properties helps determine other characteristics
that can lead to comfort and durability or other attributes of the fabric. Fabric density,
ASTM D 3775, was performed at Eastern Michigan University’s textiles lab. A pick
glass, rule, and pointer were used to count the loops in the course and wales direction for
one inch specimens of each sample. Two specimens per sample were tested. This test can
indicate the quality of the fabric. The higher the count, the higher quality the fabric.
ASTM D 3776 was the standard used to determine weight of the fabric. Five
samples with an area, 4" x 4", were cut and weighed to within +/-0.1% of mass on a
balance. The following equations were used for determining the weight:
g/m2 = 103M/LW oz/yd2 = 576 M/LW

28
where: M = mass of fabric, in pounds L= length of fabric, in yards, and W = width of fabric, in inches Fabric weight is significant in determining both end use and quality. For use in
sports apparel, the wearer will prefer a lighter weight fabric to a heavier fabric. On the
other hand, a heavier weight fabric will be more durable than a lightweight fabric. The
right fabric weight will be durable enough to withstand wear and tear but light enough to
be comfortable.
Ten specimens of each sample were tested for thickness of material;
ASTMD1777-96(02) method was used. The specimen was placed on the base of a
thickness gage and a weighted presser foot was lowered. The displacement between the
base and the presser foot was measured as the thickness of the material. The thickness
was measured in millimeters. Testing thickness is one of the basic physical properties of
textile materials. Bulk and warmth properties of textile materials are often estimated from
their thickness values. For use in sports apparel, the fabric should not be too thick.
Stiffness was measured using 5 specimens per each sample. ASTM D 6828-02
was the test method used. Fabric, cut into 4” X 4” samples, rested on two flat plate
supports separated by a fixed distance. A slot width of 5 mm was used. A force was
applied to the swatches halfway between the supports by way of a blade attached to a
motor-driven beam. This test used a 100g beam. The maximum force needed to push the
fabric through the supports was measured as the resistance to the bending of the fabric.
The stiffness of fabric relates to its resistance to bending or creasing of a fabric. Although
wearers of sports apparel may not be overly concerned with creasing of a fabric, it is still
a standard by which textiles are measured.

29
Ten specimens per each sample were tested for bursting strength. ASTM D 3786-
01 was used. This test method measured the resistance of the fabric to bursting. Bursting
strength testing is a multidirectional strength test that is commonly applied to knit fabrics.
During this test, the fabric was clamped over an expandable diaphragm. It was
then expanded by fluid pressure to the point of fabric rupture. The bursting strength was
measured by the difference between the total pressure required to rupture the specimen
and the pressure required to inflate the diaphragm. For the tests conducted for these test
fabrics, the Burst Tester settings were set to 50cm2 dome, 1.5 mm diaphragms, and
pressure rate 8.56 psi.
30
Chapter 4: Results and Discussion
The results of this investigation will be discussed in two sections. The first section
addresses the durability testing and compares flax blend fabrics (88% polyester/12% flax
and 75% cotton/25% flax) to the other three fabric blends (100% polyester, 100% cotton,
88% polyester/12% cotton). The second section addresses the results of the comfort
testing and compares flax blend fabrics to the other blend fabrics. Appendix D shows
results for all other fabric properties tested.
All statistical methods used to determine significant effects of the variables were
performed at a 95% level of confidence. The test data for durability and comfort testing
are presented with their appropriate graphs in each section. The ANOVA tables are listed
in Appendix E.
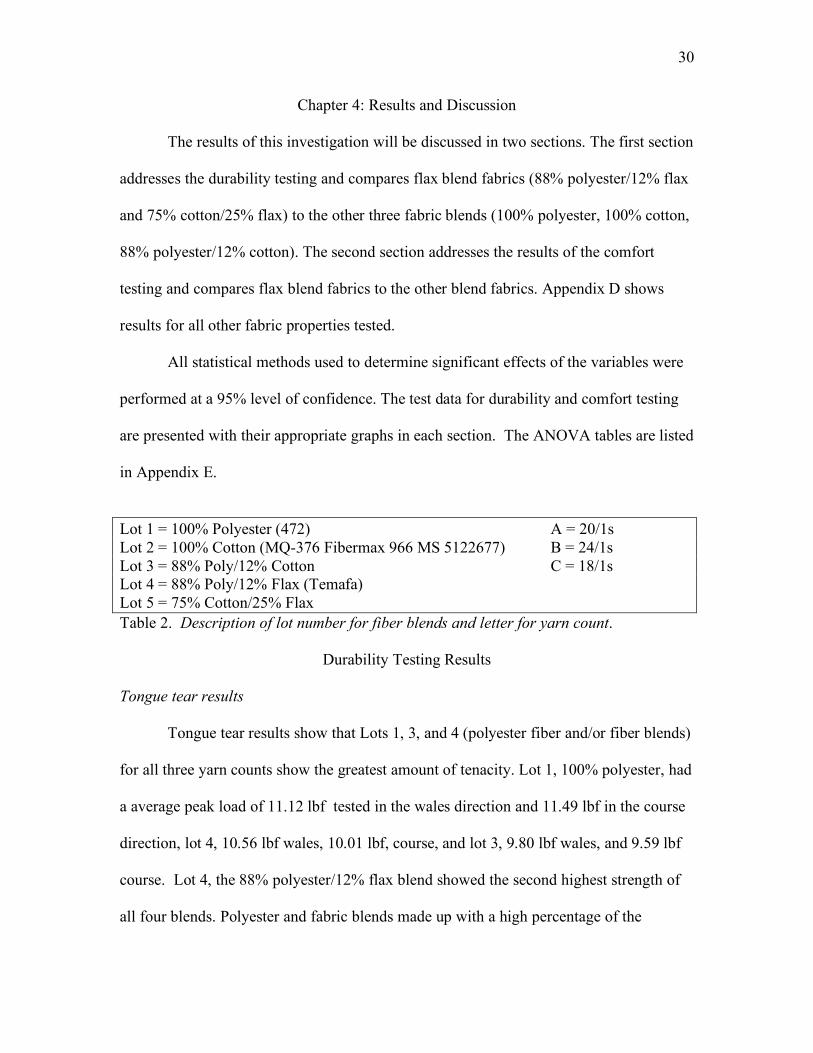
Lot 1 = 100% Polyester (472) A = 20/1s Lot 2 = 100% Cotton (MQ-376 Fibermax 966 MS 5122677) B = 24/1s Lot 3 = 88% Poly/12% Cotton C = 18/1s Lot 4 = 88% Poly/12% Flax (Temafa) Lot 5 = 75% Cotton/25% Flax Table 2. Description of lot number for fiber blends and letter for yarn count.
Durability Testing Results
Tongue tear results
Tongue tear results show that Lots 1, 3, and 4 (polyester fiber and/or fiber blends)
for all three yarn counts show the greatest amount of tenacity. Lot 1, 100% polyester, had
a average peak load of 11.12 lbf tested in the wales direction and 11.49 lbf in the course
direction, lot 4, 10.56 lbf wales, 10.01 lbf, course, and lot 3, 9.80 lbf wales, and 9.59 lbf
course. Lot 4, the 88% polyester/12% flax blend showed the second highest strength of
all four blends. Polyester and fabric blends made up with a high percentage of the
31
polyester fiber will demonstrate higher breaking elongation than fabric made with natural
fibers, which is inherent to the fiber tensile property. The polyester fabrics have a higher
shear resistance due to their higher elongation that yields to the bending deformation. In
tear testing, the fabric was subjected to a shear deformation. The polyester fibers used in
the investigation had higher elongation to yield to the shear stress during the tear test,
which resulted in higher tear strength of polyester and polyester containing fibers as
compared to cotton/flax fabric, which is stiffer with much lower elongation. The lowest
tenacity results were with 100% cotton, 24/1s yarn count at 2.530 lbf. The ANOVA
tables in Appendix E-1 show that there is no significant difference between lot 3, 88%
polyester/12% cotton and lot 4, 88% polyester/12% flax for testing done for both the
course and wales direction. In addition, there is no significant difference between Lot 2,
100% cotton, and lot 5, 75% cotton/25% flax, for testing done in both the course and
wales direction.
This indicates that traditional sports apparel made with polyester/cotton blends are
comparable to the test polyester/flax blend fabric in tearing strength. As well, traditional
sports apparel made with 100% cotton is comparable to the 75% cotton/25% flax test
fabric in tearing strength.

32
Course CI =0.179 and Wales CI = .228
Tongue Tear
0.000
2.000
4.000
6.000
8.000
10.000
12.000
14.000
1A 2A 3A 4A 5A
Fiber Blends and Yarn Count
Pe
ak
Lo
ad
lb
f
Course
Wales
Figure 3. Tongue tear results for yarn count 20/1s.
Course CI =0.179 and Wales CI = .228
Tongue Tear
0.000
2.000
4.000
6.000
8.000
10.000
12.000
1B 2B 3B 4B 5B
Fiber Blends and Yarn Count
Pe
ak
Lo
ad
lb
f
Course
Wales
Figure 4. Tongue tear results for yarn count 24/1s.

33
Course CI =0.179 and Wales CI = .228
Tongue Tear
0.000
2.000
4.000
6.000
8.000
10.000
12.000
14.000
1C 2C 3C 4C 5C
Fabric Blends and Yarn Count
Pe
ak
Lo
ad
lb
f
Course
Wales
Figure 5. Tongue tear results for yarn count 18/1s.
Grab Test Results Testing results from the grab test, which determines the breaking strength of the
fabric, show that lot 3, 88% polyester/12% cotton, has the highest peak load for the wales
direction at 87.99 lbf, where lot 1, 100% polyester, has the highest peak load for the
course direction at 56.13 lbf. Polyester inherently has a higher tensile strength than the
natural fibers, which is demonstrated in these results. For the course and wales direction,
lot 5, 75% cotton/25% flax, has the lowest peak load at 40.31 lbf wales and 28.18 lbf
course.
As indicated in the ANOVA tables, Appendix E-2, lot 5, 75% cotton/25% flax,
and lot 2, 100% cotton, are not significantly different. In addition, lot 1, 100% polyester,
lot 3, 88% polyester/12% cotton, and lot 4, 88% polyester/12% flax are not significantly
different.

34
This indicates that traditional sports apparel made with polyester/cotton blends are
comparable to the test polyester/flax blend fabric in breaking strength. As well,
traditional sports apparel made with 100% cotton are comparable to the 75% cotton/25%
flax fabric in breaking strength.
Course CI = 1.522 and Wales CI = 2.340
Grab Test
0.000
20.000
40.000
60.000
80.000
100.000
120.000
1A 2A 3A 4A 5A
Fiber Blends and Yarn Count
Pe
ak
L
oa
d lb
f
Course
Wales
Figure 6. Grab test results for yarn count 20/1s.

35
Course CI = 1.522 and Wales CI = 2.340
Grab Test
0.000
20.000
40.000
60.000
80.000
100.000
1B 2B 3B 4B 5B
Fiber Blends and Yarn Count
Pe
ak
L
oa
d lb
f
Course
Wales
Figure 7. Grab test results for yarn count 24/1s.
Course CI = 1.522 and Wales CI = 2.340
Grab Test
0.000
20.000
40.000
60.000
80.000
100.000
120.000
1C 2C 3C 4C 5C
Fabric Blends and Yarn Count
Pe
ak
Lo
ad
lb
f
Course
Wales
Figure 8. Grab test results for yarn count 18/1s.

36
Comfort Testing Results Air permeability results Results from air permeability show that lot 4, 88% polyester/12% flax, has the
greatest air permeability with an overall average of 113.05 m3/m2/min and 371.53 cfm.
This is followed by lot 1, 100% polyester; lot 3, 88% polyester/12% cotton; lot 5, 75%
cotton/25% flax; and lot 2, 100% cotton. Appendix E-3 indicates all results are
significantly different.
These results indicate that lot 4, 88% polyester/12% flax, is superior in regards to
air permeability than all other 4 blends. This phenomenon may be attributed to the fact
that natural staple fibers have high variation in length, which causes hair yarn and thus
translates into fabric containing more protruding fibers. This may cause higher apparent
thickness of the fabric. These protruding fibers can be referred to as “fuzz,” which creates
air pockets and ultimately reduces the air permeability of the fabric. Also, a property air
permeability is dependent on is thickness (Vigo, 1994). The polyester and polyester/flax
blend fabrics were the least thick of the five fabrics (see Appendix D-4); this could
contribute to the higher air permeability.
In addition, lot 5, 75% cotton/25% flax, is greater than 100% cotton. The results
support work done by the ARS Cotton Quality Research Station in Clemson, SC, that
blending flax with cotton helps to increase air permeability (Bliss, 2005).

37
CI = 3.021
Air Permeability
0
100
200
300
400
500
1 2 3 4 5
Fiber Blend and Yarn Count
cfm
A
B
C
Figure 9. Air permeability results measured in cfm.
CI = .004
Air Permeability
0
50
100
150
1 2 3 4 5
Fiber Blend and Yarn Count
m3
/m2
/min A
B
C
Figure 10. Air permeability results measured in m3/m2/min.
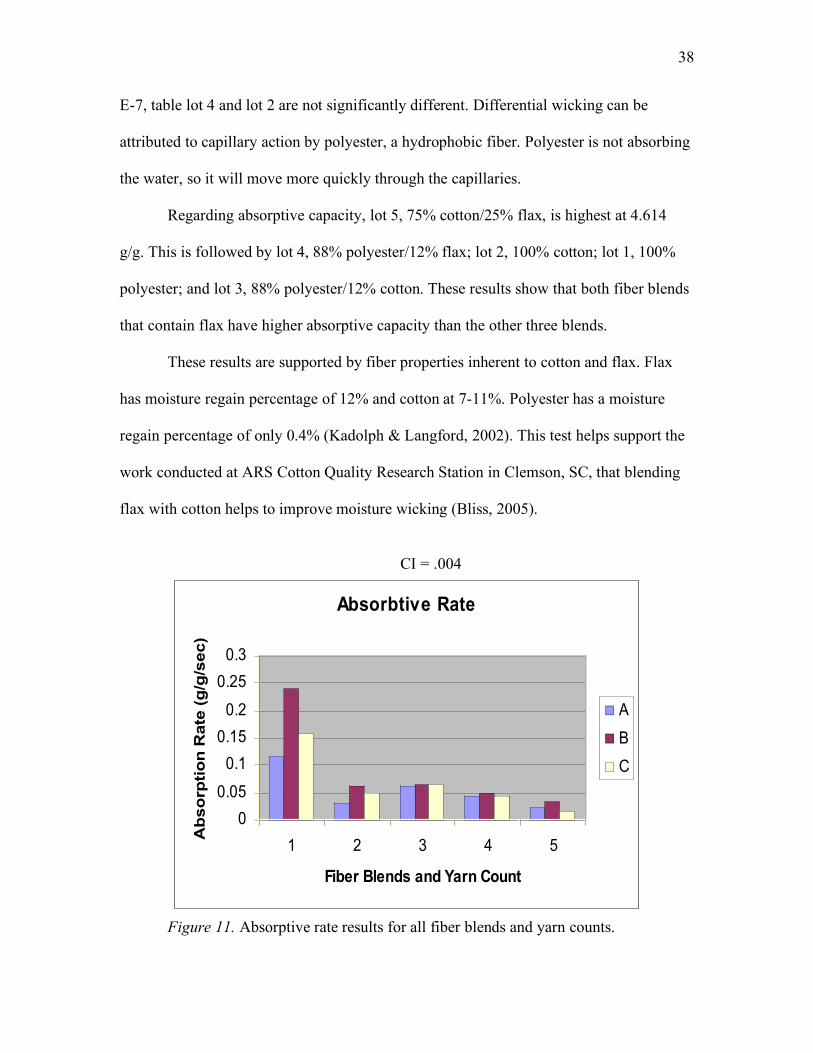
Wicking
Wicking results show that for absorptive rate, lot 1, 100% polyester, is quickest at
.18331 g/g/sec. This is followed by lot 3, 88% polyester/12% cotton; lot 2 100% cotton;
lot 4, 88% polyester/12% flax; and lot 5, 75% cotton/25% flax. As indicated in Appendix
38
E-7, table lot 4 and lot 2 are not significantly different. Differential wicking can be
attributed to capillary action by polyester, a hydrophobic fiber. Polyester is not absorbing
the water, so it will move more quickly through the capillaries.
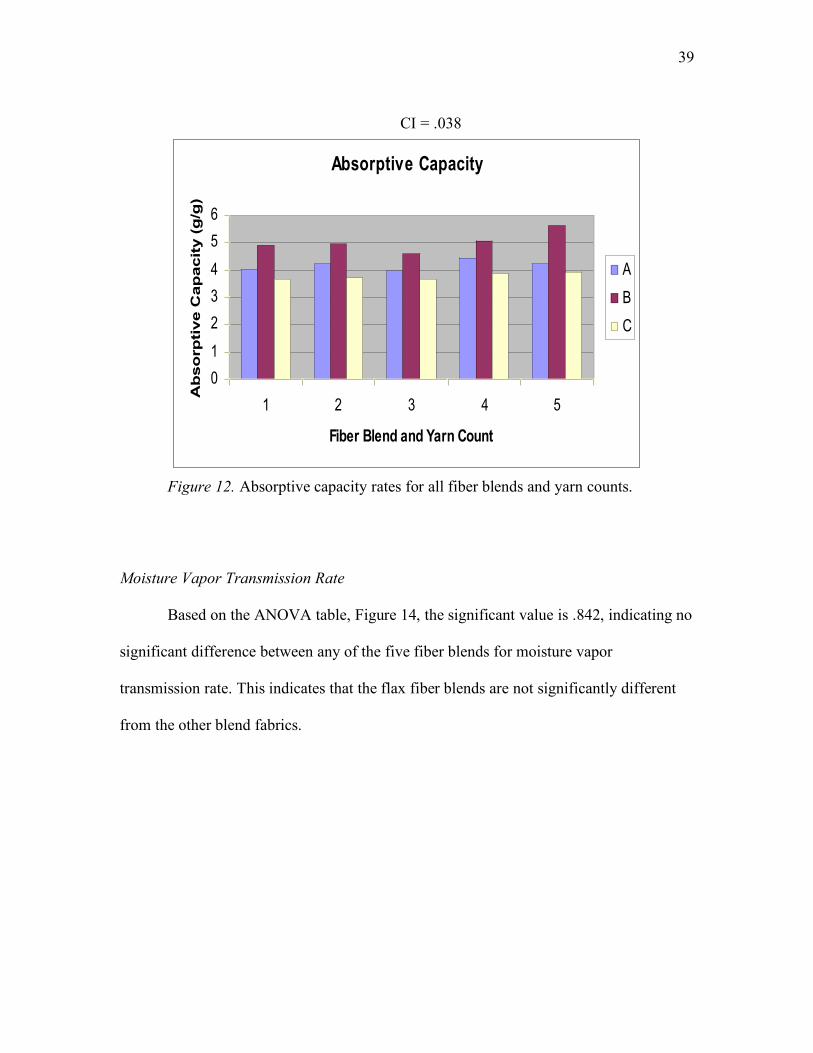
Regarding absorptive capacity, lot 5, 75% cotton/25% flax, is highest at 4.614
g/g. This is followed by lot 4, 88% polyester/12% flax; lot 2, 100% cotton; lot 1, 100%
polyester; and lot 3, 88% polyester/12% cotton. These results show that both fiber blends
that contain flax have higher absorptive capacity than the other three blends.
These results are supported by fiber properties inherent to cotton and flax. Flax
has moisture regain percentage of 12% and cotton at 7-11%. Polyester has a moisture
regain percentage of only 0.4% (Kadolph & Langford, 2002). This test helps support the
work conducted at ARS Cotton Quality Research Station in Clemson, SC, that blending
flax with cotton helps to improve moisture wicking (Bliss, 2005).
CI = .004
Absorbtive Rate
0
0.05
0.1
0.15
0.2
0.25
0.3
1 2 3 4 5
Fiber Blends and Yarn Count
Ab
so
rpti
on
Rate
(g
/g/s
ec)
A
B
C
Figure 11. Absorptive rate results for all fiber blends and yarn counts.
39
CI = .038
Absorptive Capacity
0
1
2
3
4
5
6
1 2 3 4 5
Fiber Blend and Yarn Count
Ab
so
rp
tive C
ap
acit
y (
g/g
)
A
B
C
Figure 12. Absorptive capacity rates for all fiber blends and yarn counts.
Moisture Vapor Transmission Rate
Based on the ANOVA table, Figure 14, the significant value is .842, indicating no
significant difference between any of the five fiber blends for moisture vapor
transmission rate. This indicates that the flax fiber blends are not significantly different
from the other blend fabrics.

40
CI = 11.121
Moisture Vapor Transmission Rate
800.00
820.00
840.00
860.00
880.00
900.00
920.00
940.00
960.00
1 2 3 4 5
Fabric Blends and Yarn Count
Av
era
ge
Pe
rme
ab
ilit
y
A
B
C
Figure 13. Moisture vapor transmission rate for all fiber blends and yarn counts.
Tests of Between-Subjects Effects Dependent Variable: MVTR
Source Type III Sum of
Squares df Mean Square F Sig. Partial Eta Squared
Noncent. Parameter
Observed Power(a)
Corrected Model 37920.178(b) 14 2708.584 2.030 .051 .486 28.416 .84
3 Intercept 36848719.033 1 36848719.03
3 27612.
802 .000 .999 27612.802 1.000
blend 5386.550 4 1346.638 1.009 .418 .119 4.036 .279
size 27124.326 2 13562.163 10.163 .000 .404 20.326 .977
blend * size 5409.303 8 676.163 .507 .842 .119 4.053 .19
3 Error 40034.386 30 1334.480 Total 36926673.598 45 Corrected Total 77954.565 44
a Computed using alpha = .05 b R Squared = .486 (Adjusted R Squared = .247) Figure 14. Moisture vapor transmission rate for all fiber blends and yarn counts. .
41
Fabric Properties Bursting strength and thickness were two other tests run on the fabrics but not
analyzed as dependent variables. The results (see Appendix D-1) of bursting strength
indicate that Lot 1, 100% polyester, at 49.51 psi, and Lot 3, 88% polyester/12% cotton, at
47.28 psi, are not significantly different (see Appendix E-14) but have the highest
bursting strength of the five fabrics. This is followed by lot 4 and then lot 5 and lot 2,
which are not significantly different.
Stiffness results show (see Appendix D-3) lot 2, 100% cotton, measured the
highest average stiffness, at 93.28 g. Lot 5 and lot 3 follow next, with lot 1 and lot 4
having the least amount of stiffness but also not being significantly different (see
Appendix E-13).

42
Chapter 5: Conclusions
The objective of producing yarn using flax in blends with cotton and polyester
were met. In addition, fabrics were produced from these blend yarns. The main objective
of this thesis was to determine if flax, a natural and renewable crop resource, is
comparable to fabrics, such as cotton and polyester/cotton blends, traditionally used in
sports apparel. The following conclusions are derived from the experimental data within
the scope the parameters of the experiment:
• Regarding durability, for tongue tear results, polyester/flax fabric is superior to all
other fabric blends excluding polyester. In addition, statistically speaking, cotton
and cotton/flax blend fabrics are not significantly different.
• Regarding durability, for grab test results, there is no significant difference
between polyester/flax blend fabrics and polyester and polyester/cotton blend
fabrics. In addition, there is no significant difference in strength between cotton
and cotton/flax blend fabrics.
• Regarding comfort, for air permeability results, polyester/flax fabric is superior to
all other fabric blends. In addition, cotton/flax has better air permeability than
cotton fabric.
• Regarding comfort, for wicking results, polyester has the quickest wicking rate,
followed by polyester/cotton. Cotton/flax has the highest absorptive capacity
followed by polyester/flax. Cotton/polyester has the lowest absorptive capacity.
• There is no significant difference between all five fiber blends relating to moisture
vapor transmission rate. They are all comparable fabrics.
43
REFERENCES
Bliss, R. M. (2005, November). Flax fiber offers cotton cool comfort. Agricultural
Research, 12-13.
Cheung, Y. K. & Cheng, K. P. S., (1995). Comfort in clothing. Textile
Asia, 26(2), 20-25.
Collier, B. J. & Epps, H.H., (1999). Textile Testing and Analysis. Upper Saddle River,
NJ: Merrill, an imprint of Prentice Hall.
Cook, J. G., (1964). Handbook of Textile Fibres. Waterford, Herts, England: Merrow
Publishing Co. LTD.
Egli, U. (2005, September/October). Synthetic function, natural feel. Future Materials,
2005(5), 28-28.
Fesquet-Stanley, E. (1992). The effect of fiber type, yarn structure, and fabric cover on
Moisture wicking and evaporation properties in single-jersey knit fabrics for
Athletic wear garments. Virginia Commonwealth University, Charlottesville.
Furderer, T., Gries, T., Satlow, G. (2002, November). Elastic improvements. Textile Asia,
33(11), 42-44.
Fiber and fabric education program. (1999). Retrieved January 3, 2006 from,
http://www.fabriclink.com/RF-ED-Production.html.
Hann, M. A. (2005). Innovation in linen manufacture. Textile Progress, (37)3, 1-42.
Hes, L. (1999). Optimisation of shirt fabrics’ composition from the point of view of their
Appearance and thermal comfort. International Journal of Clothing Science and
Technology, 11(2/3), 105-115.

44
“Innovations”, Hohenstein skin model. Retrieved January 30, 2006, from
http://www.tft.csiro.au/servicesskinmodel.html.
Kadolph, S. J., & Langford, A.L., (2002). Textiles. Upper Saddle River, NJ:
Person Education, Inc.
McDonough, W., & Braungart, M. (2002). Cradle to Cradle. New York, NY:
North Point.
New uses for traditional fibres. (2003, Nov/Dec) Textile Horizons, 5.
Phillips, P. Profile of Klopman International: European leader in polyester/cotton
Workwear. Textile Outlook International, 115, 14-31.
Pitts, N., & Smith, J. A. Selecting sweatsuits, fleece separates and warm-up. Retrieved
January 3, 2006 from http://ohioline.osu.edu/hyg-fact/5000/5542.html.
Polyester (PET). Retrieved November 18, 2005, from http://www.swicofil.com/pes.html.
Textile protection and comfort center. Retrieved January 30, 2006 from http://tx.ncsu.edu
/tpacc/comfort/horizontal_wicking_gats.html.
Vigo, T. L. (1994). Textiles Processing and Properties: Preparation, Dyeing, Finsihing,
and, Performance. Amsterdram: Elsevier.

45
APPENDIX A-1
Processing and Yarn Quality Details for Lot 1
PROCESSING/YARN QUALITY
USDA-ARS Test No.MQ-419 Date 1/25/06 Clemson, South Carolina
Vortex Lot 1A Lot 1B Lot 1C
WASTE Opening & Cleaning 0.63 0.63 0.63 Total Card Waste (w/o front) 1.53 1.53 1.53
SPINNING Spindle Speed (MM) 380 380 380 Spindle Hours Tested 11.52 15.12 10.80 Actual Ends Down 7 5 7 Cal. Ends Down/M 72 Sp. Hrs. 44 24 47
Slubs 2 4 3
Trash 0 0 0
Other 5 1 4 Yarn Size Desired 20/1 24/1 18/1 Yarn Size Obtained 19.7 23.3 17.5 SINGLE STRAND DATA (Statimat) Strength (Grams/tex) 22.79 22.74 21.50
Elongation (%) 9.62 9.87 9.52
Strength C.V. (%) 12.00 14.79 15.27 EVENNESS DATA (ILE DS 65) Neps/1000 yds. 18 37 7

46
Thick Places/1000 yds. 64 126 26 Thin Places/1000 yds. 13 56 4 Irregularity C.V. (%) 13.5 15.1 12.4
CLASSIMAT
Major Faults 0 1 0
Minor Faults 43 78 16
Long Thicks 6 4 3
Long Thins 10 79 33 YARN APPEARANCE C+(103) B+(117) B(113)
Note Size Lot 1 = 100% Polyester (472) A = 20/1s Lot 2 = 100% Cotton (MQ-376 Fibermax 966 MS 5122677) B = 24/1s Lot 3 = 88% Poly/12% Cotton C = 18/1s Lot 4 = 88% Poly/12% Flax (Temafa) Lot 5 = 75% Cotton/25% Flax

47
APPENDIX A-2
Processing and Yarn Quality Details for Lot 2 ROCESSING/YARN QUALITY
USDA-ARS Test No.MQ-419 Date 1/25/06 Clemson, South Carolina
Vortex Lot 2A Lot 2B Lot 2C
WASTE Opening & Cleaning 1.33 1.33 1.33 Total Card Waste (w/o front) 3.30 3.30 3.30
SPINNING Spindle Speed (MM) 380 380 380 Spindle Hours Tested 16.32 13.20 10.08 Actual Ends Down 36 19 29 Cal. Ends Down/M 72 Sp. Hrs. 159 104 207
Slubs 0 0 2
Trash 33 18 26
Other 3 1 1 Yarn Size Desired 20/1 24/1 18/1 Yarn Size Obtained 20.2 24.2 18.4 SINGLE STRAND DATA (Statimat) Strength (Grams/tex) 14.70 15.20 14.05
Elongation (%) 4.55 4.50 4.32
Strength C.V. (%) 7.01 10.39 8.83 EVENNESS DATA (ILE DS 65) Neps/1000 yds. 211 310 169

48
Thick Places/1000 yds. 98 202 71 Thin Places/1000 yds. 4 31 1 Irregularity C.V. (%) 14.0 15.6 13.2
CLASSIMAT
Major Faults 4 5 3
Minor Faults 293 628 329
Long Thicks 10 11 18
Long Thins 9 5 11 YARN APPEARANCE D(70) D(70) D(73) PROCESSING/YARN QUALITY Page 3 of 5 Note Size Lot 1 = 100% Polyester (472) A = 20/1s Lot 2 = 100% Cotton (MQ-376 Fibermax 966 MS 5122677) B = 24/1s Lot 3 = 88% Poly/12% Cotton C = 18/1s Lot 4 = 88% Poly/12% Flax (Temafa) Lot 5 = 75% Cotton/25% Flax

49
APPENDIX A-3
Processing and Yarn Quality Details for Lot 3
USDA-ARS Test No.MQ-419 Clemson, South Carolina
Vortex Lot 3A Lot 3B Lot 3C
WASTE Opening & Cleaning 1.03 1.03 1.03 Total Card Waste (w/o front) 1.60 1.60 1.60
SPINNING Spindle Speed (MM) 380 380 380 Spindle Hours Tested 11.28 15.12 11.28 Actual Ends Down 16 9 10 Cal. Ends Down/M 72 Sp. Hrs. 102 43 64
Slubs 0 3 0
Trash 10 1 8
Other 6 5 2 Yarn Size Desired 20/1 24/1 18/1 Yarn Size Obtained 19.6 23.4 17.7 SINGLE STRAND DATA (Statimat) Strength (Grams/tex) 21.26 22.16 21.28
Elongation (%) 9.41 9.69 9.61
Strength C.V. (%) 18.51 9.96 10.88 EVENNESS DATA (ILE DS 65) Neps/1000 yds. 72 134 52 Thick Places/1000 yds. 109 274 67

50
Thin Places/1000 yds. 10 58 3 Irregularity C.V. (%) 13.3 15.4 12.5
CLASSIMAT
Major Faults 0 1 0
Minor Faults 217 406 190
Long Thicks 4 2 10
Long Thins 5 7 2 YARN APPEARANCE C+(103) B(113) B(110)
Note Size Lot 1 = 100% Polyester (472) A = 20/1s Lot 2 = 100% Cotton (MQ-376 Fibermax 966 MS 5122677) B = 24/1s Lot 3 = 88% Poly/12% Cotton C = 18/1s Lot 4 = 88% Poly/12% Flax (Temafa) Lot 5 = 75% Cotton/25% Flax

51
APPENDIX A-4
Processing and Yarn Quality Details for Lot 4 PROCESSING/YARN QUALITY
USDA-ARS Test No.MQ-419 Date 1/25/06 Clemson, South Carolina
Vortex Lot 4A Lot 4B Lot 4C
WASTE Opening & Cleaning 0.94 0.94 0.94 Total Card Waste (w/o front) 2.89 2.89 2.89
SPINNING Spindle Speed (MM) 380 380 380 Spindle Hours Tested 11.28 14.40 11.28 Actual Ends Down 31 29 26 Cal. Ends Down/M 72 Sp. Hrs. 198 145 166
Slubs 0 0 0
Trash 24 20 17
Other 7 9 9 Yarn Size Desired 20/1 24/1 18/1 Yarn Size Obtained 19.9 23.6 17.9 SINGLE STRAND DATA (Statimat) Strength (Grams/tex) 21.33 21.07 20.35
Elongation (%) 9.76 9.80 9.61
Strength C.V. (%) 12.50 14.50 15.75 EVENNESS DATA (ILE DS 65) Neps/1000 yds. 1043 1380 853

52
Thick Places/1000 yds. 1309 1704 1095 Thin Places/1000 yds. 121 401 50 Irregularity C.V. (%) 20.9 24.4 19.5
CLASSIMAT
Major Faults 113 201 59
Minor Faults 15624 21787 12764
Long Thicks 19 29 70
Long Thins 64 133 209 YARN APPEARANCE C(87) C+(100) C(93)
Note Size Lot 1 = 100% Polyester (472) A = 20/1s Lot 2 = 100% Cotton (MQ-376 Fibermax 966 MS 5122677) B = 24/1s Lot 3 = 88% Poly/12% Cotton C = 18/1s Lot 4 = 88% Poly/12% Flax (Temafa) Lot 5 = 75% Cotton/25% Flax

53
APPENDIX A-5
Processing and Yarn Quality Details for Lot 5
PROCESSING/YARN QUALITY
USDA-ARS Test No.MQ-419 Date 1/25/06 Clemson, South Carolina
Vortex Lot 5A Lot 5B Lot 5C
WASTE Opening & Cleaning 2.69 2.69 2.69 Total Card Waste (w/o front) 6.11 6.11 6.11
SPINNING Spindle Speed (MM) 380 380 380 Spindle Hours Tested 14.40 16.08 11.28 Actual Ends Down 22 23 15 Cal. Ends Down/M 72 Sp. Hrs. 110 103 96
Slubs 0 0 1
Trash 16 20 11
Other 6 3 3 Yarn Size Desired 20/1 24/1 18/1 Yarn Size Obtained 20.1 24.1 18.2 SINGLE STRAND DATA (Statimat) Strength (Grams/tex) 12.96 13.04 12.50
Elongation (%) 4.05 3.89 4.06
Strength C.V. (%) 9.64 10.69 8.92 EVENNESS DATA (ILE DS 65) Neps/1000 yds. 999 1348 835

54
Thick Places/1000 yds. 940 1347 774 Thin Places/1000 yds. 95 329 42 Irregularity C.V. (%) 19.6 21.7 18.6
CLASSIMAT
Major Faults 5 7 6
Minor Faults 5727 8937 3834
Long Thicks 4 6 7
Long Thins 402 441 98 YARN APPEARANCE BG(60) BG(60) BG(60)
Note Size Lot 1 = 100% Polyester (472) A = 20/1s Lot 2 = 100% Cotton (MQ-376 Fibermax 966 MS 5122677) B = 24/1s Lot 3 = 88% Poly/12% Cotton C = 18/1s Lot 4 = 88% Poly/12% Flax (Temafa) Lot 5 = 75% Cotton/25% Flax
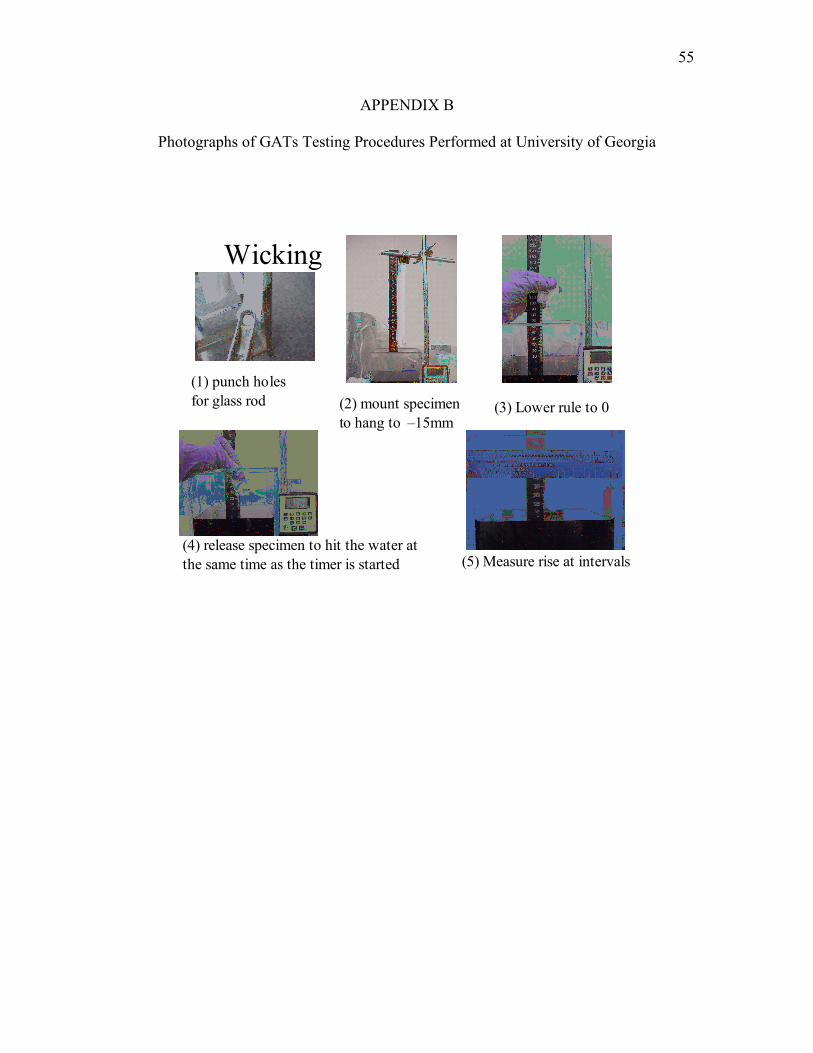
55
APPENDIX B
Photographs of GATs Testing Procedures Performed at University of Georgia
Wicking
(1) punch holes for glass rod (2) mount specimen
to hang to –15mm(3) Lower rule to 0
(4) release specimen to hit the water at the same time as the timer is started (5) Measure rise at intervals

56
MVTR Test Apparatus.
APPENDIX C
Test Method for Moisture Vapor Transport Rate as Conducted by ITT The sample specimens were conditioned and measurements made in the standard atmosphere laboratory (70 + 2°F and 65 + 5% RH). The rate of moisture vapor diffusion through the fabric is determined according to the Simple Dish Method, similar to ASTM E96-80. As pictured, a sample is placed on a water dish (82 mm in diameter and 19 mm in depth) allowing a 9 mm air space between the water surface and specimen. A vibration free turntable carrying 8 dishes rotates uniformly at 5 meters per minute to insure that all dishes are exposed to the same average ambient conditions during the test. The assembled specimen dishes are allowed to stabilize for two hours before taking the initial weight. They are weighed again after a 24 hour interval. Then the rate of moisture vapor loss (MVTR) is calculated in units of g/m2-24 hours. A higher MVTR value indicates there is a greater passage of moisture vapor through the material.
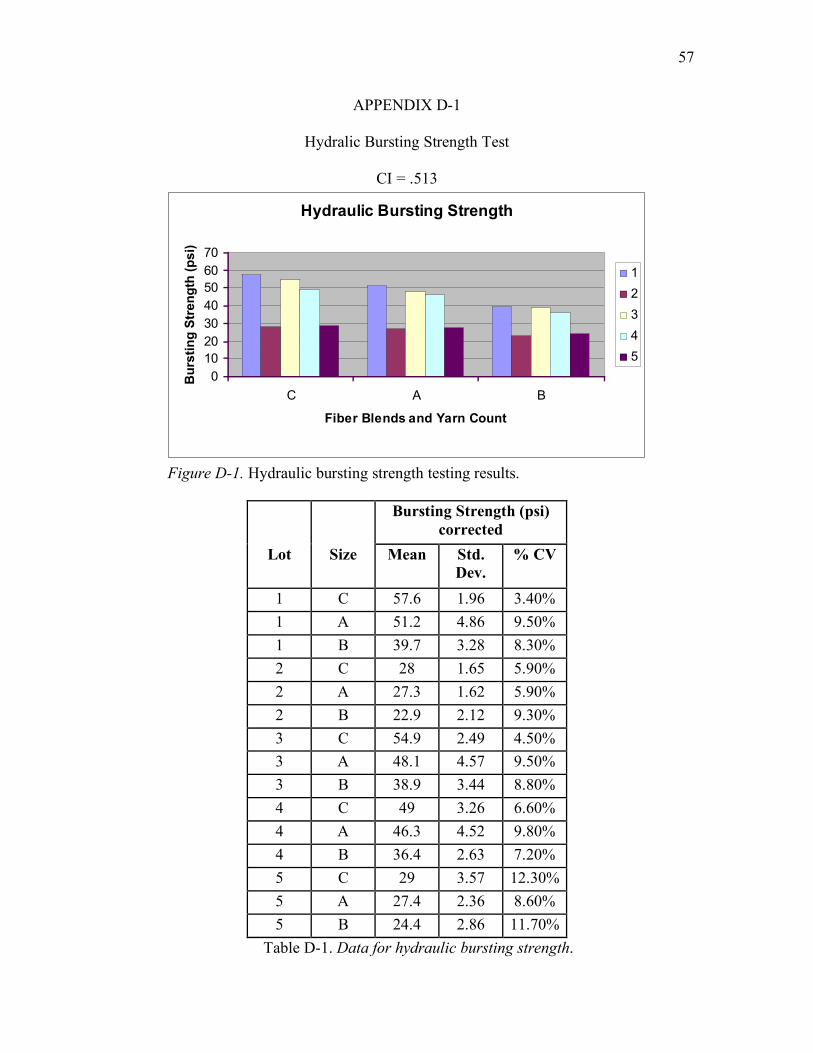
57
APPENDIX D-1
Hydralic Bursting Strength Test
CI = .513
Hydraulic Bursting Strength
0
10
20
30
40
50
60
70
C A B
Fiber Blends and Yarn Count
Bu
rsti
ng
Str
en
gth
(p
si)
1
2
3
4
5
Figure D-1. Hydraulic bursting strength testing results.
Bursting Strength (psi)
corrected Lot Size Mean Std.
Dev. % CV
1 C 57.6 1.96 3.40% 1 A 51.2 4.86 9.50% 1 B 39.7 3.28 8.30% 2 C 28 1.65 5.90% 2 A 27.3 1.62 5.90% 2 B 22.9 2.12 9.30% 3 C 54.9 2.49 4.50% 3 A 48.1 4.57 9.50% 3 B 38.9 3.44 8.80% 4 C 49 3.26 6.60% 4 A 46.3 4.52 9.80% 4 B 36.4 2.63 7.20% 5 C 29 3.57 12.30% 5 A 27.4 2.36 8.60% 5 B 24.4 2.86 11.70%
Table D-1. Data for hydraulic bursting strength.
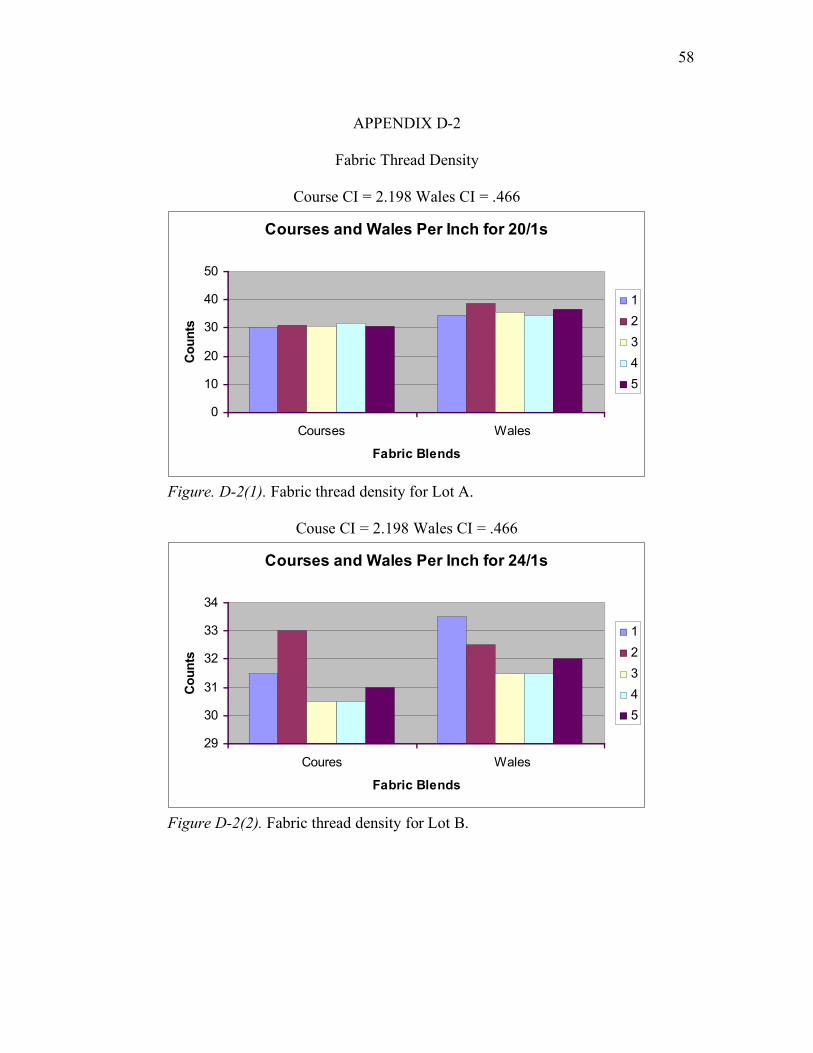
58
APPENDIX D-2
Fabric Thread Density
Course CI = 2.198 Wales CI = .466
Courses and Wales Per Inch for 20/1s
0
10
20
30
40
50
Courses Wales
Fabric Blends
Co
un
ts
1
2
3
4
5
Figure. D-2(1). Fabric thread density for Lot A.
Couse CI = 2.198 Wales CI = .466
Courses and Wales Per Inch for 24/1s
29
30
31
32
33
34
Coures Wales
Fabric Blends
Co
un
ts
1
2
3
4
5
Figure D-2(2). Fabric thread density for Lot B.

59
Course CI = 2.198 Wales CI = .466
Courses and Wales Per Inch for 18/1s
0
10
20
30
40
50
Courses Wales
Fabric Blends
Co
un
ts
1
2
3
4
5
Figure D-2(3). Fabric thread density for Lot C.
Courses Wales Lot Size C A B C A B
1 31 31 31 35 34 33 1 31 29 32 34 35 34 Average 31 30 31.5 34.5 34.5 33.5 2 31 30 33 40 37 32
2 30 32 33 38 40 33 Average 30.5 31 33 39 38.5 32.5 3 29 31 30 38 35 31
3 30 30 31 35 36 32 Average 29.5 30.5 30.5 36.5 35.5 31.5 4 32 31 31 31 34 32
4 31 32 30 32 35 31 Average 31.5 31.5 30.5 31.5 34.5 31.5
5 33 30 31 37 37 32 5 32 31 31 39 36 32
Average 32.5 30.5 31 38 36.5 32 Table D-2. Data for fabric thread density.
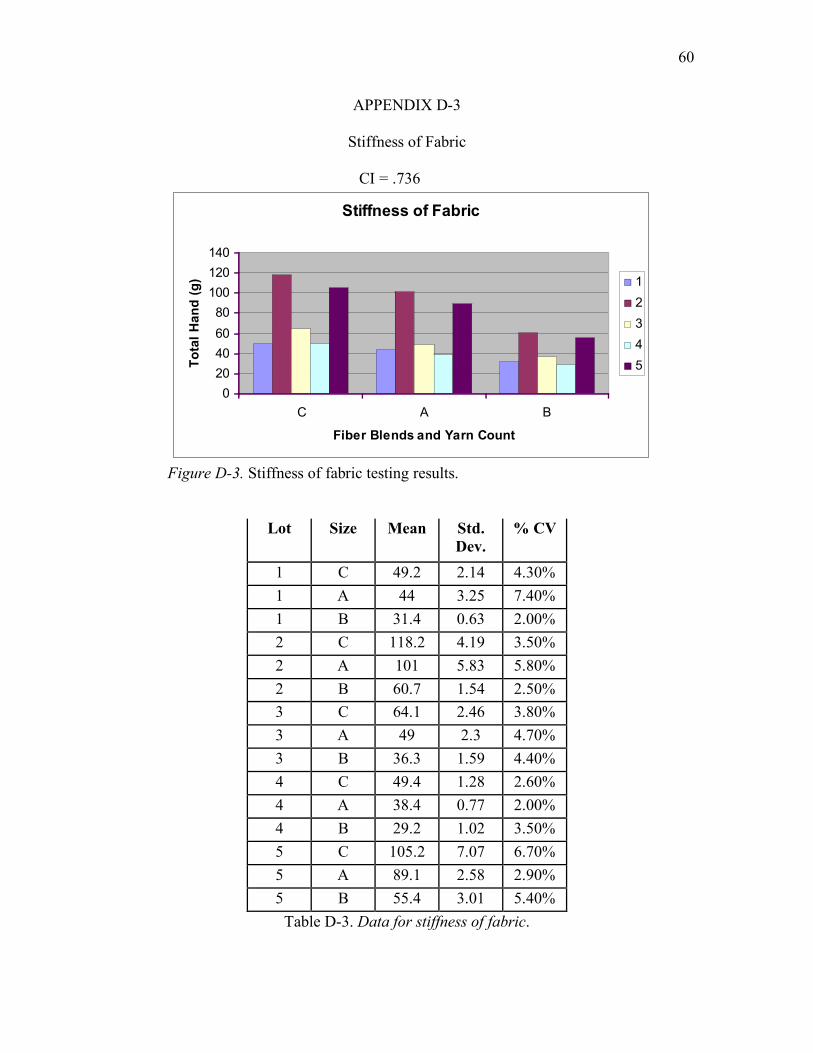
60
APPENDIX D-3
Stiffness of Fabric
CI = .736
Stiffness of Fabric
0
20
40
60
80
100
120
140
C A B
Fiber Blends and Yarn Count
To
tal
Ha
nd
(g
) 1
2
3
4
5
Figure D-3. Stiffness of fabric testing results.
Lot Size Mean Std. Dev.
% CV
1 C 49.2 2.14 4.30% 1 A 44 3.25 7.40% 1 B 31.4 0.63 2.00% 2 C 118.2 4.19 3.50% 2 A 101 5.83 5.80% 2 B 60.7 1.54 2.50% 3 C 64.1 2.46 3.80% 3 A 49 2.3 4.70% 3 B 36.3 1.59 4.40% 4 C 49.4 1.28 2.60% 4 A 38.4 0.77 2.00% 4 B 29.2 1.02 3.50% 5 C 105.2 7.07 6.70% 5 A 89.1 2.58 2.90% 5 B 55.4 3.01 5.40%
Table D-3. Data for stiffness of fabric.
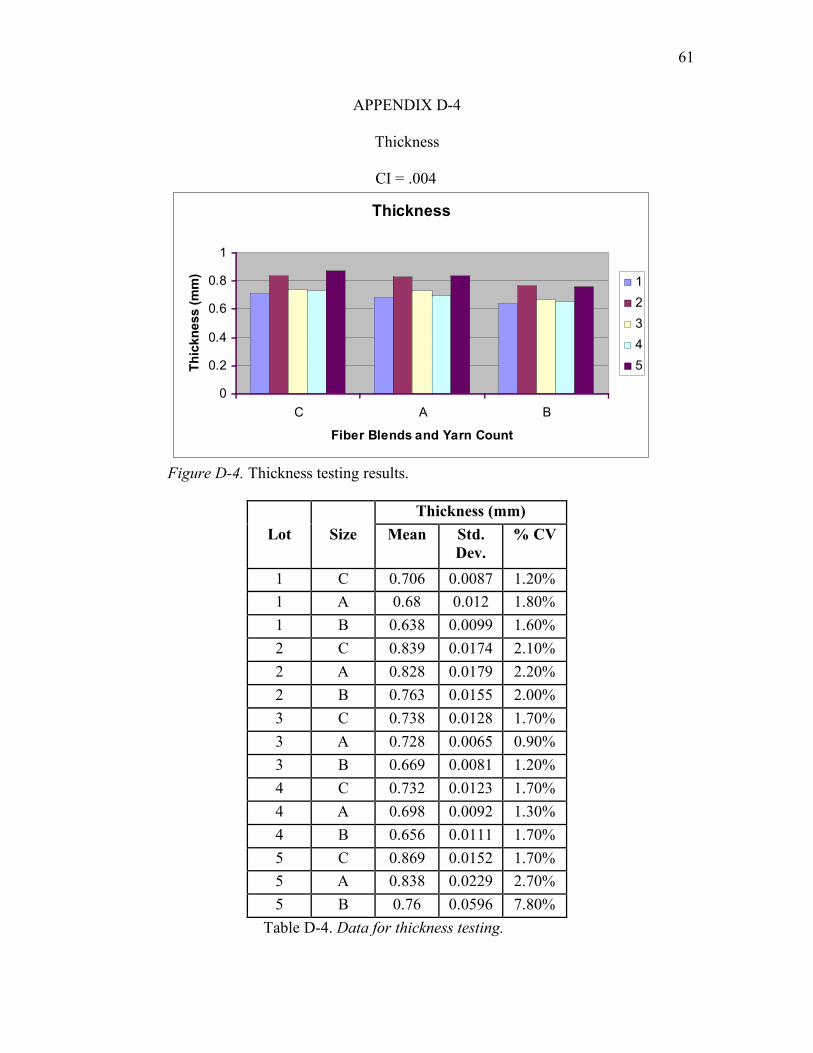
61
APPENDIX D-4
Thickness
CI = .004
Thickness
0
0.2
0.4
0.6
0.8
1
C A B
Fiber Blends and Yarn Count
Th
ickn
ess (
mm
)
1
2
3
4
5
Figure D-4. Thickness testing results.
Thickness (mm)
Lot Size Mean Std. Dev.
% CV
1 C 0.706 0.0087 1.20% 1 A 0.68 0.012 1.80% 1 B 0.638 0.0099 1.60% 2 C 0.839 0.0174 2.10% 2 A 0.828 0.0179 2.20% 2 B 0.763 0.0155 2.00% 3 C 0.738 0.0128 1.70% 3 A 0.728 0.0065 0.90% 3 B 0.669 0.0081 1.20% 4 C 0.732 0.0123 1.70% 4 A 0.698 0.0092 1.30% 4 B 0.656 0.0111 1.70% 5 C 0.869 0.0152 1.70% 5 A 0.838 0.0229 2.70% 5 B 0.76 0.0596 7.80%
Table D-4. Data for thickness testing.

62
APPENDIX D-5
Weight
Weight
0
50
100
150
200
250
C A B
Fiber Blends and Yarn Count
We
igh
t (g
/m2
) 1
2
3
4
5
Figure D-5(1). Weight of fabric in g/m2.
Weight
0
1
2
3
4
5
6
7
C A B
Fiber Blends and Yarn Count
We
igh
t (o
z/y
d2
)
1
2
3
4
5
Figure D-5(2). Weight of fabric in oz/yd2.
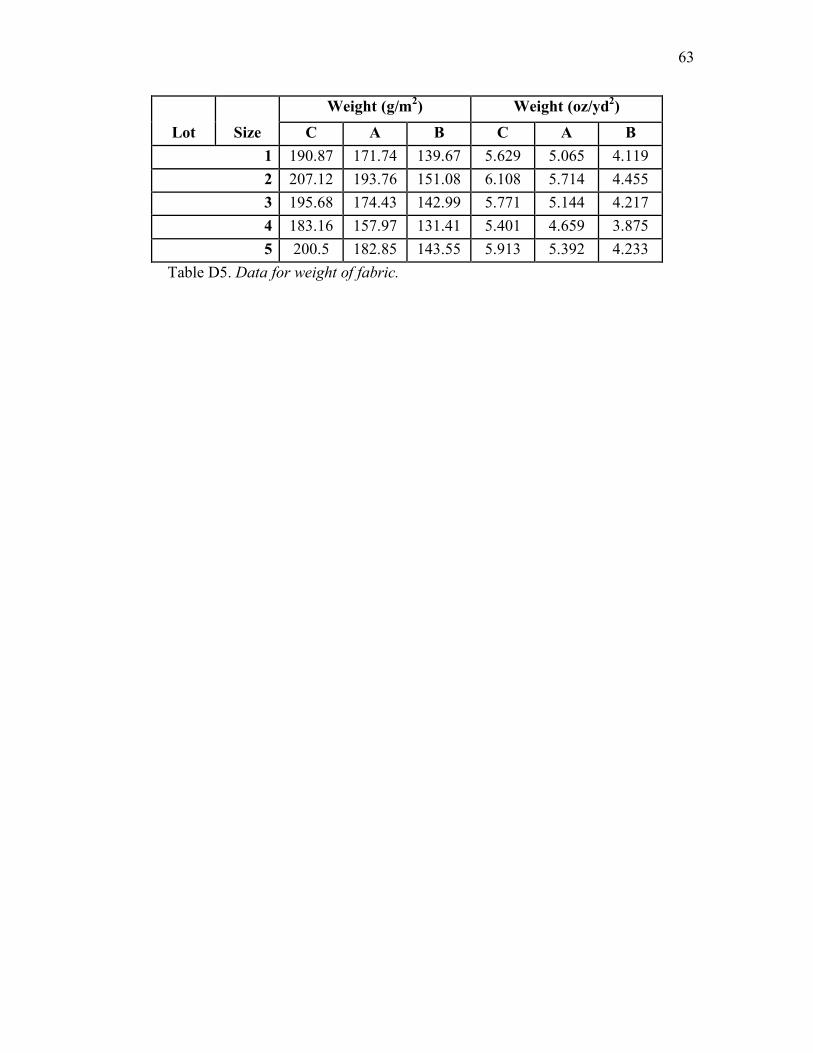
63
Weight (g/m2) Weight (oz/yd2) Lot Size C A B C A B
1 190.87 171.74 139.67 5.629 5.065 4.119 2 207.12 193.76 151.08 6.108 5.714 4.455 3 195.68 174.43 142.99 5.771 5.144 4.217 4 183.16 157.97 131.41 5.401 4.659 3.875 5 200.5 182.85 143.55 5.913 5.392 4.233
Table D5. Data for weight of fabric.

64
APPENDIX E-1
ANOVA for Tongue Tear Test in Course Direction
Tests of Between-Subjects Effects
Dependent Variable: Tongue Tear Course
Source
Type III Sum of
Squares df Mean
Square F Sig. Partial Eta Squared
Noncent. Parameter
Observed Power(a)
Corrected Model
1026.010(b) 14 73.286 119.367 .000 .963 1671.144 1.000
Intercept
4364.937 1 4364.937 7109.52
3 .000 .991 7109.523 1.000
blend 911.216 4 227.804 371.043 .000 .959 1484.171 1.000 size 52.143 2 26.071 42.465 .000 .570 84.929 1.000 blend * size 21.347 8 2.668 4.346 .000 .352 34.770 .991
Error 39.293 64 .614 Total 5903.24
2 79
Corrected Total
1065.303 78
a Computed using alpha = .05 b R Squared = .963 (Adjusted R Squared = .955)
Tongue Tear Course
Tukey HSD
Subset blend N 1 2 3 5.00 15 3.33300 2.00 15 3.60147 3.00 14 9.58514 4.00 15 10.00767 1.00 20 11.49485 Sig. .874 .564 1.000
Means for groups in homogeneous subsets are displayed. Based on Type III Sum of Squares
The error term is Mean Square(Error) = .614. a Uses Harmonic Mean Sample Size = 15.556.
b The group sizes are unequal. The harmonic mean of the group sizes is used. Type I error levels are not guaranteed.
c Alpha = .05.

65
APPENDIX E-2
ANOVA for Tongue Tear Test in Wales Direction
Tests of Between-Subjects Effects Dependent Variable: Tongue Tear Wales
Source Type III Sum of Squares df
Mean Square F Sig.
Partial Eta
Squared Noncent.
Parameter
Observed
Power(a)
Corrected Model 1124.722(b) 14 80.337 82.57
3 .000 .948 1156.025 1.000
Intercept 4165.344 1 4165.344
4281.272 .000 .985 4281.272 1.000
blend 1081.457 4 270.364 277.889 .000 .946 1111.556 1.000
size 11.663 2 5.832 5.994 .004 .160 11.988 .866 blend * size 12.850 8 1.606 1.651 .128 .173 13.208 .672 Error 61.294 63 .973 Total 5708.778 78 Corrected Total 1186.016 77
a Computed using alpha = .05 b R Squared = .948 (Adjusted R Squared = .937)
Tongue Tear Wales
Tukey HSD
Subset blend N 1 2 3 2.00 15 2.81607 5.00 15 2.96820 3.00 14 9.79721 4.00 14 10.56479 10.56479 1.00 20 11.10585 Sig. .993 .211 .554
Means for groups in homogeneous subsets are displayed. Based on Type III Sum of Squares
The error term is Mean Square(Error) = .973. a Uses Harmonic Mean Sample Size = 15.328.
b The group sizes are unequal. The harmonic mean of the group sizes is used. Type I error levels are not guaranteed.
c Alpha = .05.
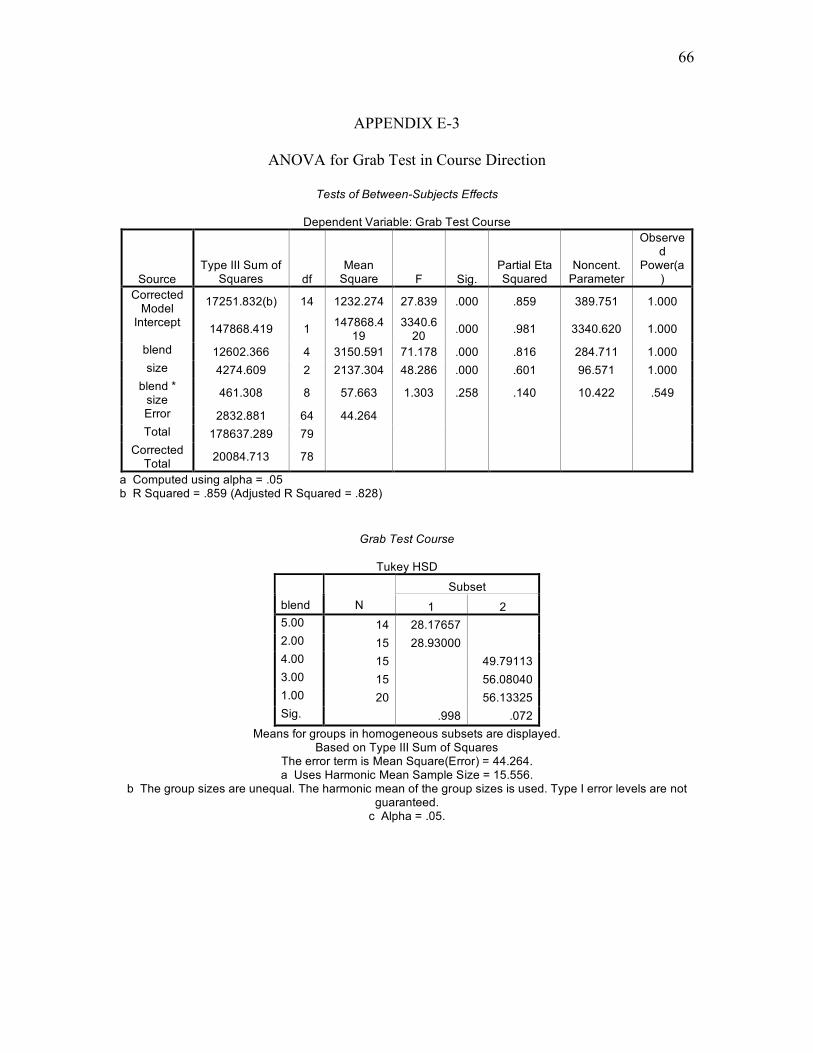
66
APPENDIX E-3
ANOVA for Grab Test in Course Direction
Tests of Between-Subjects Effects
Dependent Variable: Grab Test Course
Source Type III Sum of
Squares df Mean
Square F Sig. Partial Eta Squared
Noncent. Parameter
Observed
Power(a)
Corrected Model 17251.832(b) 14 1232.274 27.839 .000 .859 389.751 1.000
Intercept 147868.419 1 147868.419
3340.620 .000 .981 3340.620 1.000
blend 12602.366 4 3150.591 71.178 .000 .816 284.711 1.000 size 4274.609 2 2137.304 48.286 .000 .601 96.571 1.000
blend * size 461.308 8 57.663 1.303 .258 .140 10.422 .549
Error 2832.881 64 44.264 Total 178637.289 79
Corrected Total 20084.713 78
a Computed using alpha = .05 b R Squared = .859 (Adjusted R Squared = .828)
Grab Test Course
Tukey HSD
Subset blend N 1 2 5.00 14 28.17657 2.00 15 28.93000 4.00 15 49.79113 3.00 15 56.08040 1.00 20 56.13325 Sig. .998 .072
Means for groups in homogeneous subsets are displayed. Based on Type III Sum of Squares
The error term is Mean Square(Error) = 44.264. a Uses Harmonic Mean Sample Size = 15.556.
b The group sizes are unequal. The harmonic mean of the group sizes is used. Type I error levels are not guaranteed.
c Alpha = .05.

67
APPENDIX E-4
ANOVA for Grab Test in Wales Direction
Tests of Between-Subjects Effects
Dependent Variable: Grab Test Wales
Source Type III Sum of Squares df
Mean Square F Sig.
Partial Eta
Squared
Noncent. Parameter
Observed Power(a)
Corrected Model 50125.653(b) 14 3580.404 33.606 .000 .879 470.486 1.000
Intercept 363189.875 1 363189.875
3408.947 .000 .981 3408.947 1.000
blend 33941.504 4 8485.376 79.645 .000 .831 318.579 1.000 size 8555.674 2 4277.837 40.152 .000 .553 80.305 1.000 blend * size 4940.485 8 617.561 5.797 .000 .416 46.372 .999 Error 6925.113 65 106.540 Total 451430.026 80 Corrected Total 57050.767 79
a Computed using alpha = .05 b R Squared = .879 (Adjusted R Squared = .852)
Grab Test Wales
Tukey HSD
Subset blend N 1 2 5.00 15 40.31100 2.00 15 45.25320 4.00 15 83.94227 1.00 20 87.72570 3.00 15 87.99053 Sig. .664 .805
Means for groups in homogeneous subsets are displayed. Based on Type III Sum of Squares
The error term is Mean Square(Error) = 106.540. a Uses Harmonic Mean Sample Size = 15.789.
b The group sizes are unequal. The harmonic mean of the group sizes is used. Type I error levels are not guaranteed.
c Alpha = .05.
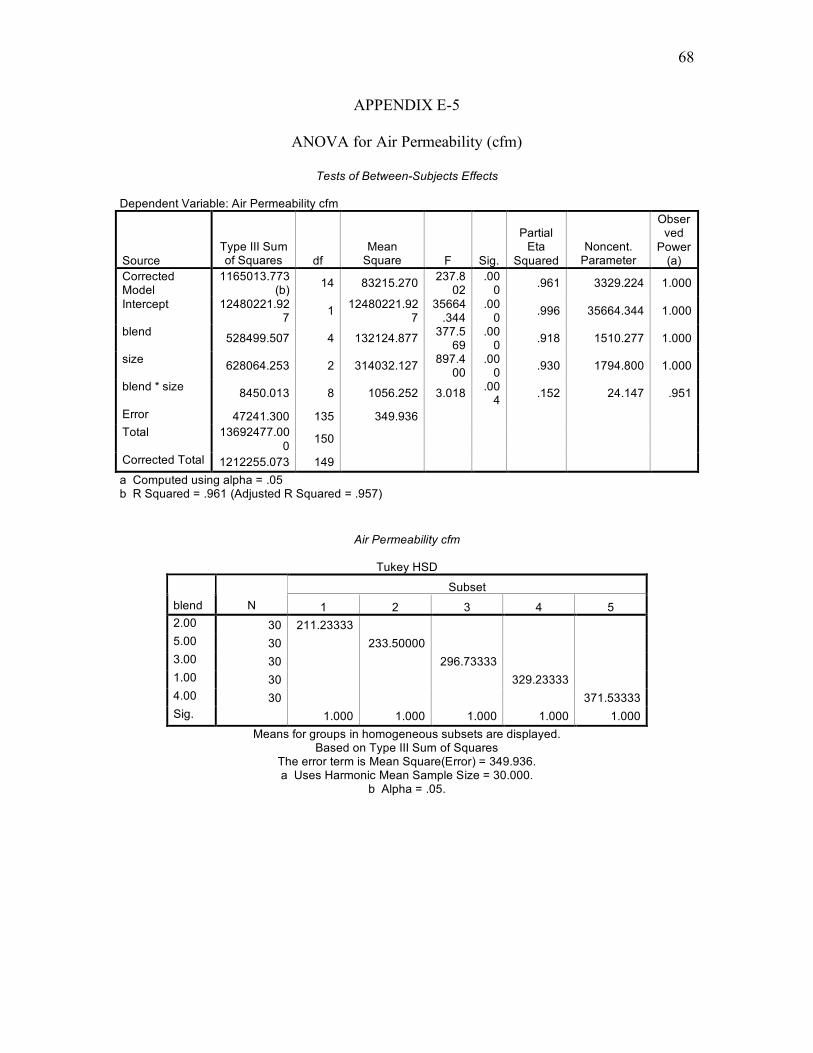
68
APPENDIX E-5
ANOVA for Air Permeability (cfm)
Tests of Between-Subjects Effects Dependent Variable: Air Permeability cfm
Source Type III Sum of Squares df
Mean Square F Sig.
Partial Eta
Squared Noncent.
Parameter
Observed
Power(a)
Corrected Model
1165013.773(b) 14 83215.270 237.8
02 .00
0 .961 3329.224 1.000
Intercept 12480221.927 1 12480221.92
7 35664
.344 .00
0 .996 35664.344 1.000
blend 528499.507 4 132124.877 377.569
.000 .918 1510.277 1.000
size 628064.253 2 314032.127 897.400
.000 .930 1794.800 1.000
blend * size 8450.013 8 1056.252 3.018 .004 .152 24.147 .951
Error 47241.300 135 349.936 Total 13692477.00
0 150
Corrected Total 1212255.073 149 a Computed using alpha = .05 b R Squared = .961 (Adjusted R Squared = .957)
Air Permeability cfm
Tukey HSD
Subset blend N 1 2 3 4 5 2.00 30 211.23333 5.00 30 233.50000 3.00 30 296.73333 1.00 30 329.23333 4.00 30 371.53333 Sig. 1.000 1.000 1.000 1.000 1.000
Means for groups in homogeneous subsets are displayed. Based on Type III Sum of Squares
The error term is Mean Square(Error) = 349.936. a Uses Harmonic Mean Sample Size = 30.000.
b Alpha = .05.
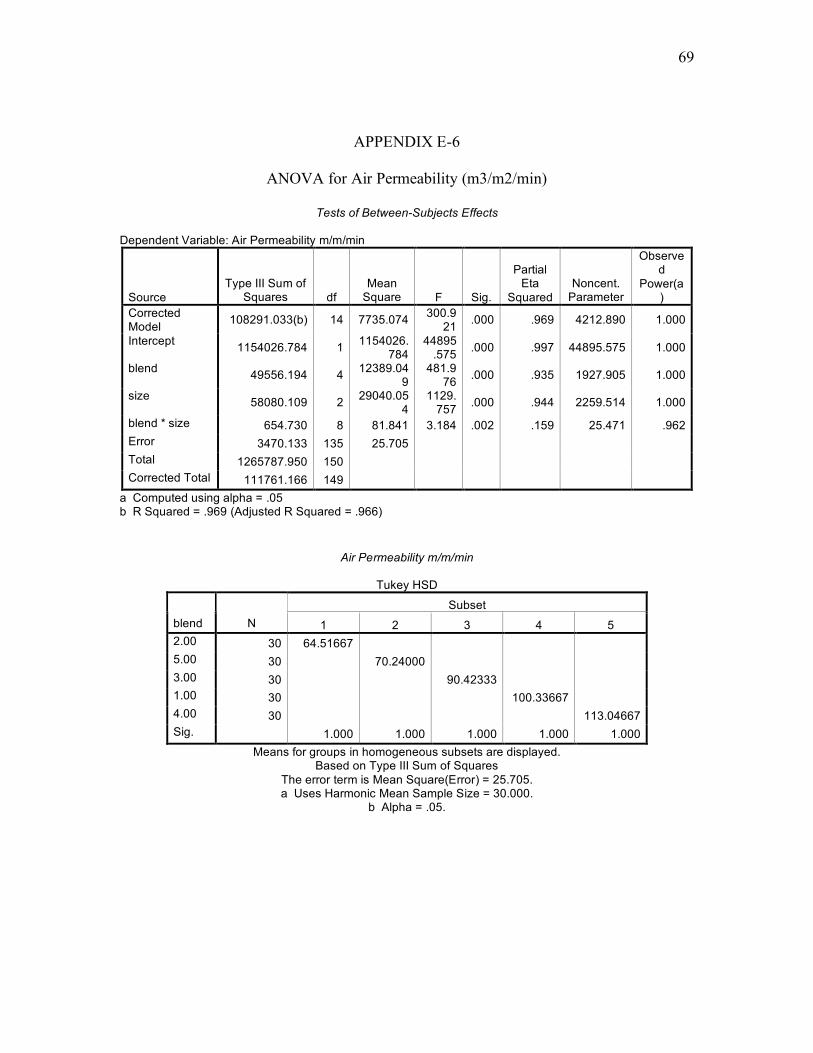
69
APPENDIX E-6
ANOVA for Air Permeability (m3/m2/min)
Tests of Between-Subjects Effects Dependent Variable: Air Permeability m/m/min
Source Type III Sum of
Squares df Mean
Square F Sig.
Partial Eta
Squared Noncent.
Parameter
Observed
Power(a)
Corrected Model 108291.033(b) 14 7735.074 300.9
21 .000 .969 4212.890 1.000
Intercept 1154026.784 1 1154026.784
44895.575 .000 .997 44895.575 1.000
blend 49556.194 4 12389.049
481.976 .000 .935 1927.905 1.000
size 58080.109 2 29040.054
1129.757 .000 .944 2259.514 1.000
blend * size 654.730 8 81.841 3.184 .002 .159 25.471 .962 Error 3470.133 135 25.705 Total 1265787.950 150 Corrected Total 111761.166 149
a Computed using alpha = .05 b R Squared = .969 (Adjusted R Squared = .966)
Air Permeability m/m/min
Tukey HSD
Subset blend N 1 2 3 4 5 2.00 30 64.51667 5.00 30 70.24000 3.00 30 90.42333 1.00 30 100.33667 4.00 30 113.04667 Sig. 1.000 1.000 1.000 1.000 1.000
Means for groups in homogeneous subsets are displayed. Based on Type III Sum of Squares
The error term is Mean Square(Error) = 25.705. a Uses Harmonic Mean Sample Size = 30.000.
b Alpha = .05.

70
APPENDIX E-7
ANOVA for Absorptive Rate (g/g/sec)
Tests of Between-Subjects Effects Dependent Variable: Absorption rate g/g/sec
Source
Type III Sum of
Squares df Mean
Square F Sig.
Partial Eta
Squared
Noncent. Parameter
Observed
Power(a)
Corrected Model .536(b) 14 .038 72.469 .000 .883 1014.572 1.000
Intercept .795 1 .795 1504.059 .000 .918 1504.059 1.000
blend .480 4 .120 227.193 .000 .871 908.773 1.000
size .022 2 .011 20.821 .000 .236 41.642 1.000
blend * size .034 8 .004 8.020 .000 .322 64.158 1.000 Error .071 135 .001 Total 1.403 150 Corrected Total .608 149
a Computed using alpha = .05 b R Squared = .883 (Adjusted R Squared = .870)
Absorption rate g/g/sec
Tukey HSD
Subset blend N 1 2 3 4 5.00 30 .02474 4.00 30 .04596 2.00 30 .04679 3.00 30 .06320 1.00 30 .18331 Sig. 1.000 1.000 1.000 1.000
Means for groups in homogeneous subsets are displayed. Based on Type III Sum of Squares
The error term is Mean Square(Error) = .001. a Uses Harmonic Mean Sample Size = 30.000.
b Alpha = .05.
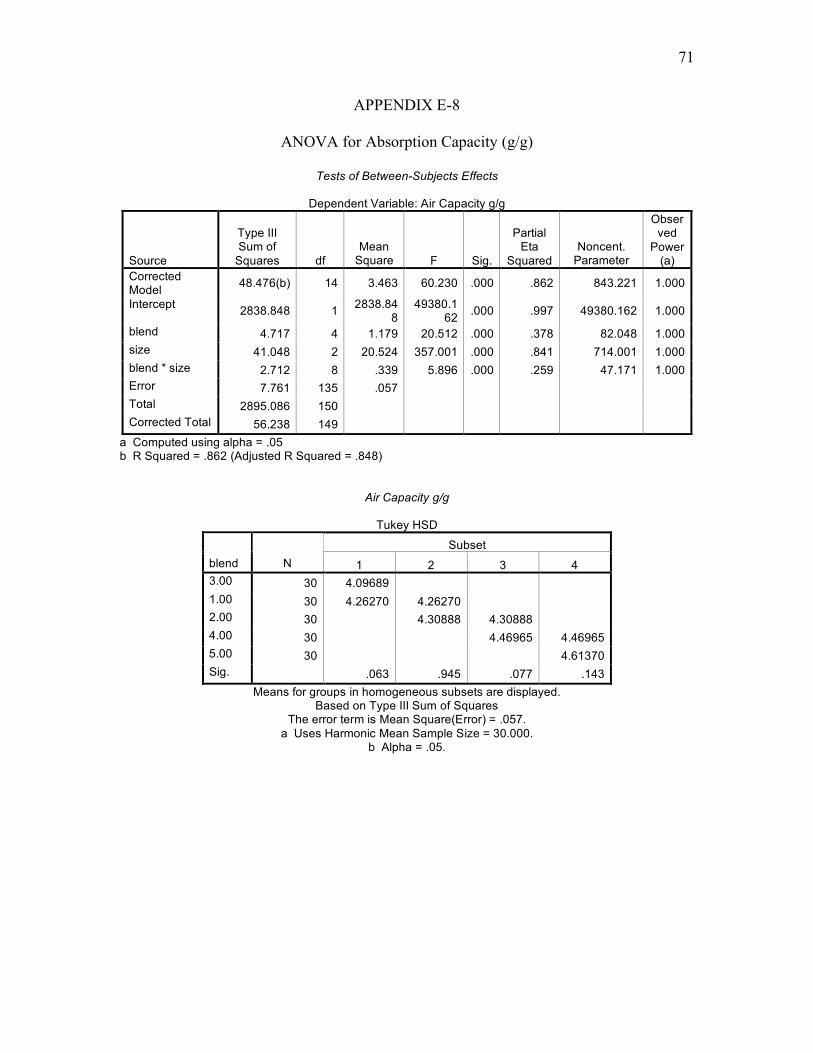
71
APPENDIX E-8
ANOVA for Absorption Capacity (g/g)
Tests of Between-Subjects Effects
Dependent Variable: Air Capacity g/g
Source
Type III Sum of
Squares df Mean
Square F Sig.
Partial Eta
Squared Noncent.
Parameter
Observed
Power(a)
Corrected Model 48.476(b) 14 3.463 60.230 .000 .862 843.221 1.000
Intercept 2838.848 1 2838.848
49380.162 .000 .997 49380.162 1.000
blend 4.717 4 1.179 20.512 .000 .378 82.048 1.000 size 41.048 2 20.524 357.001 .000 .841 714.001 1.000 blend * size 2.712 8 .339 5.896 .000 .259 47.171 1.000 Error 7.761 135 .057 Total 2895.086 150 Corrected Total 56.238 149
a Computed using alpha = .05 b R Squared = .862 (Adjusted R Squared = .848)
Air Capacity g/g
Tukey HSD
Subset blend N 1 2 3 4 3.00 30 4.09689 1.00 30 4.26270 4.26270 2.00 30 4.30888 4.30888 4.00 30 4.46965 4.46965 5.00 30 4.61370 Sig. .063 .945 .077 .143
Means for groups in homogeneous subsets are displayed. Based on Type III Sum of Squares
The error term is Mean Square(Error) = .057. a Uses Harmonic Mean Sample Size = 30.000.
b Alpha = .05.

72
APPENDIX E-9
ANOVA for Moisture Vapor Transmission Rate
Tests of Between-Subjects Effects
Dependent Variable: MVTR
Source Type III Sum of Squares df
Mean Square F Sig.
Partial Eta Squared
Noncent. Parameter
Observed
Power(a)
Corrected Model 37920.178(b) 14 2708.584 2.030 .051 .486 28.416 .843
Intercept 36848719.033 1 36848719.
033 27612
.802 .000 .999 27612.802 1.000
blend 5386.550 4 1346.638 1.009 .418 .119 4.036 .279 size 27124.326 2 13562.163 10.16
3 .000 .404 20.326 .977
blend * size 5409.303 8 676.163 .507 .842 .119 4.053 .193 Error 40034.386 30 1334.480 Total 36926673.59
8 45
Corrected Total 77954.565 44
a Computed using alpha = .05 b R Squared = .486 (Adjusted R Squared = .247)
MVTR
Tukey HSD
Subset blend N 1 5.00 9 888.1922 2.00 9 900.1944 3.00 9 904.1933 1.00 9 910.9298 4.00 9 921.0356 Sig. .335
Means for groups in homogeneous subsets are displayed. Based on Type III Sum of Squares
The error term is Mean Square(Error) = 1334.480. a Uses Harmonic Mean Sample Size = 9.000.
b Alpha = .05.
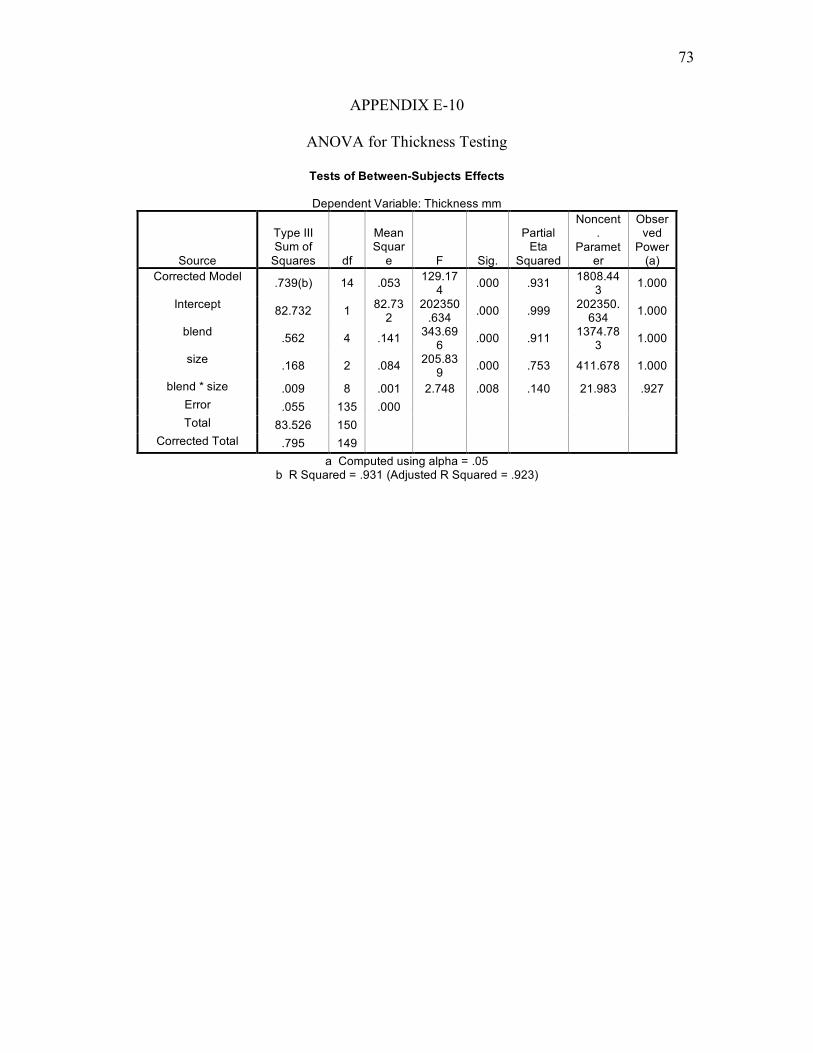
73
APPENDIX E-10
ANOVA for Thickness Testing
Tests of Between-Subjects Effects
Dependent Variable: Thickness mm
Source
Type III Sum of
Squares df
Mean Squar
e F Sig.
Partial Eta
Squared
Noncent.
Parameter
Observed
Power(a)
Corrected Model .739(b) 14 .053 129.174 .000 .931 1808.44
3 1.000
Intercept 82.732 1 82.732
202350.634 .000 .999 202350.
634 1.000
blend .562 4 .141 343.696 .000 .911 1374.78
3 1.000
size .168 2 .084 205.839 .000 .753 411.678 1.000
blend * size .009 8 .001 2.748 .008 .140 21.983 .927 Error .055 135 .000 Total 83.526 150
Corrected Total .795 149 a Computed using alpha = .05
b R Squared = .931 (Adjusted R Squared = .923)

74
APPENDIX E-11
ANOVA for Courses per Inch
Tests of Between-Subjects Effects Dependent Variable: Coures Per Inch
Source Type III Sum of Squares df
Mean Square F Sig.
Partial Eta
Squared
Noncent. Parameter
Observed
Power(a)
Corrected Model 465.077(b) 14 33.220 1.041 .467 .493 14.578 .373 Intercept 27077.455 1 27077.45
5 848.7
31 .000 .983 848.731 1.000
blend 126.139 4 31.535 .988 .444 .209 3.954 .240 size 73.977 2 36.988 1.159 .340 .134 2.319 .216 blend * size 264.961 8 33.120 1.038 .451 .356 8.305 .317 Error 478.552 15 31.903 Total 28021.084 30 Corrected Total 943.629 29
a Computed using alpha = .05 b R Squared = .493 (Adjusted R Squared = .020)
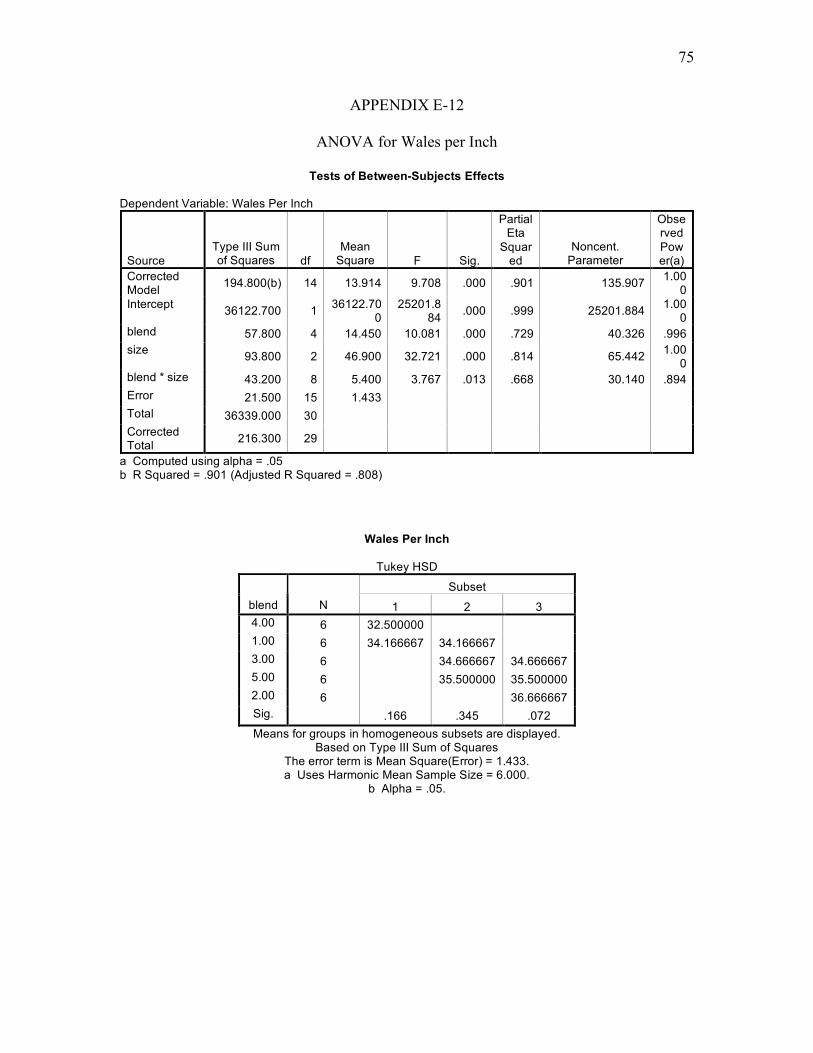
75
APPENDIX E-12
ANOVA for Wales per Inch
Tests of Between-Subjects Effects Dependent Variable: Wales Per Inch
Source Type III Sum of Squares df
Mean Square F Sig.
Partial Eta
Squared
Noncent. Parameter
Observed Power(a)
Corrected Model 194.800(b) 14 13.914 9.708 .000 .901 135.907 1.00
0 Intercept 36122.700 1 36122.70
0 25201.8
84 .000 .999 25201.884 1.000
blend 57.800 4 14.450 10.081 .000 .729 40.326 .996 size 93.800 2 46.900 32.721 .000 .814 65.442 1.00
0 blend * size 43.200 8 5.400 3.767 .013 .668 30.140 .894 Error 21.500 15 1.433 Total 36339.000 30 Corrected Total 216.300 29
a Computed using alpha = .05 b R Squared = .901 (Adjusted R Squared = .808)
Wales Per Inch
Tukey HSD
Subset blend N 1 2 3 4.00 6 32.500000 1.00 6 34.166667 34.166667 3.00 6 34.666667 34.666667 5.00 6 35.500000 35.500000 2.00 6 36.666667 Sig. .166 .345 .072 Means for groups in homogeneous subsets are displayed.
Based on Type III Sum of Squares The error term is Mean Square(Error) = 1.433. a Uses Harmonic Mean Sample Size = 6.000.
b Alpha = .05.

76
APPENDIX E-13
ANOVA for Stiffness
Tests of Between-Subjects Effects Dependent Variable: Total Hand (g)
Source Type III Sum of Squares df
Mean Square F Sig.
Partial Eta Squared
Noncent. Parameter
Observed
Power(a)
Corrected Model 56798.739(b) 14 4057.053 399.571 .000 .989 5593.988 1.000
Intercept 282489.179 1 282489.179
27821.761 .000 .998 27821.761 1.000
blend 37843.542 4 9460.885 931.783 .000 .984 3727.130 1.000 size 15285.994 2 7642.997 752.743 .000 .962 1505.485 1.000 blend * size 3669.203 8 458.650 45.172 .000 .858 361.372 1.000 Error 609.212 60 10.154 Total 339897.130 75 Corrected Total 57407.951 74
a Computed using alpha = .05 b R Squared = .989 (Adjusted R Squared = .987)

77
APPENDIX E-14
ANOVA for Bursting Strength
Tests of Between-Subjects Effects
Dependent Variable: Bursting Strength psi
Source
Type III Sum of
Squares df Mean
Square F Sig.
Partial Eta
Squared Noncent.
Parameter
Observed
Power(a)
Corrected Model
19559.883(b) 14 1397.134 138.3
08 .000 .935 1936.317 1.000
Intercept 224970.952 1 224970.952
22270.840 .000 .994 22270.840 1.000
blend 15473.995 4 3868.499 382.959 .000 .919 1531.837 1.000
size 3295.814 2 1647.907 163.133 .000 .707 326.267 1.000
blend * size 790.074 8 98.759 9.777 .000 .367 78.213 1.000 Error 1363.715 135 10.102 Total 245894.550 150 Corrected Total 20923.598 149 a Computed using alpha = .05 b R Squared = .935 (Adjusted R Squared = .928)