a community college perspective on implementing a student success system: what worked, what...
TRANSCRIPT


A Community College Perspective on Implementing a Student Success System: What
Worked, What Didn’t, and Measuring Results

Starfish Implementation: A Tale of Two Cities
Ebony Caldwell, Project DirectorDr. Larry Dugan, Director Elearning
7/28/2015

College Overview

Monroe/Finger Lakes Community College
FALL 2014 STATISTICS MCC FLCCStudent Enrollment 15,335 6,800
Minority 37% 16%
Male 47% 43%
Female 53% 57%
Average Age 21 20
Part Time 39% 45%
Full Time 61% 55%
150% Graduation Rate 2011 Cohort
• Graduated 23.9% 26%
• Still Attending 13.6% 7%
• Transfer Without Graduating 19.9% 23%

Starfish Implementation
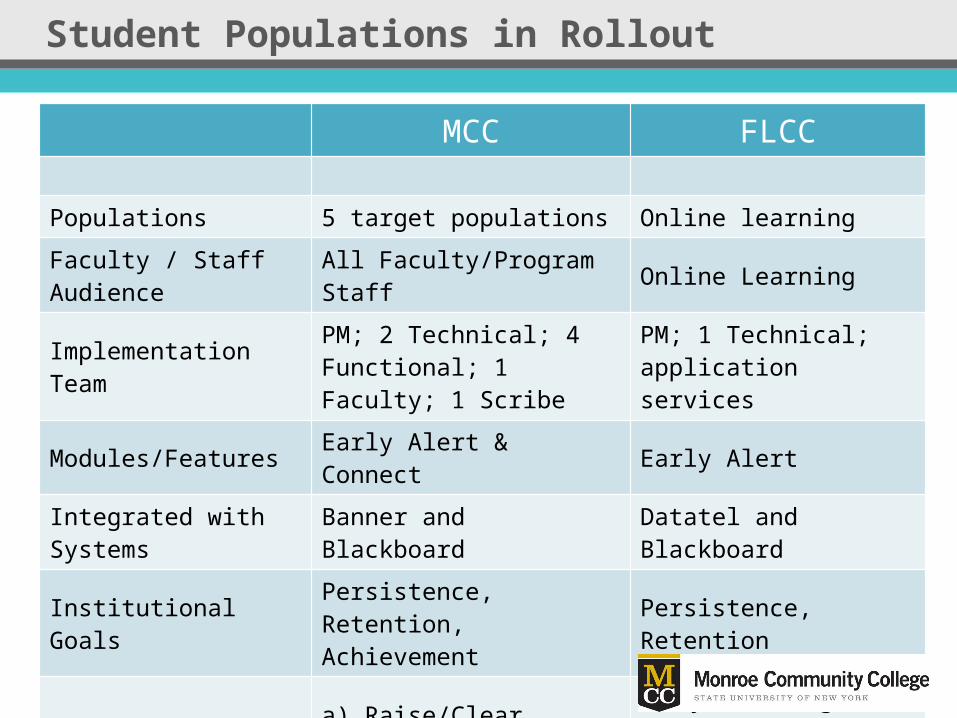
Student Populations in Rollout
MCC FLCC
Populations 5 target populations Online learning
Faculty / Staff Audience All Faculty/Program Staff Online Learning
Implementation TeamPM; 2 Technical; 4 Functional; 1 Faculty; 1 Scribe
PM; 1 Technical; application services
Modules/Features Early Alert & Connect Early Alert
Integrated with Systems
Banner and Blackboard Datatel and Blackboard
Institutional GoalsPersistence, Retention, Achievement
Persistence, Retention
Roll Out Strategya) Raise/Clear b) New Enrollment/Advising Model
a) System flags for non-participation
b) Student concierge

Progress and Results

Progress and Results
Spring 2015 MCC FLCC
Adoption RatesActive vs. PassiveStudent ResponseAdvisor Clear Rate
Adjunct adoptionsTargeted Content Interventions and Triage
System Activity4904 flags raised in pilot 3/1/15-3/31/15
4671 Flags Raised1027 Cleared
Outcome DataOnline System Flags 85%
Instructor RaisedManual Flags – 57%

Lessons Learned
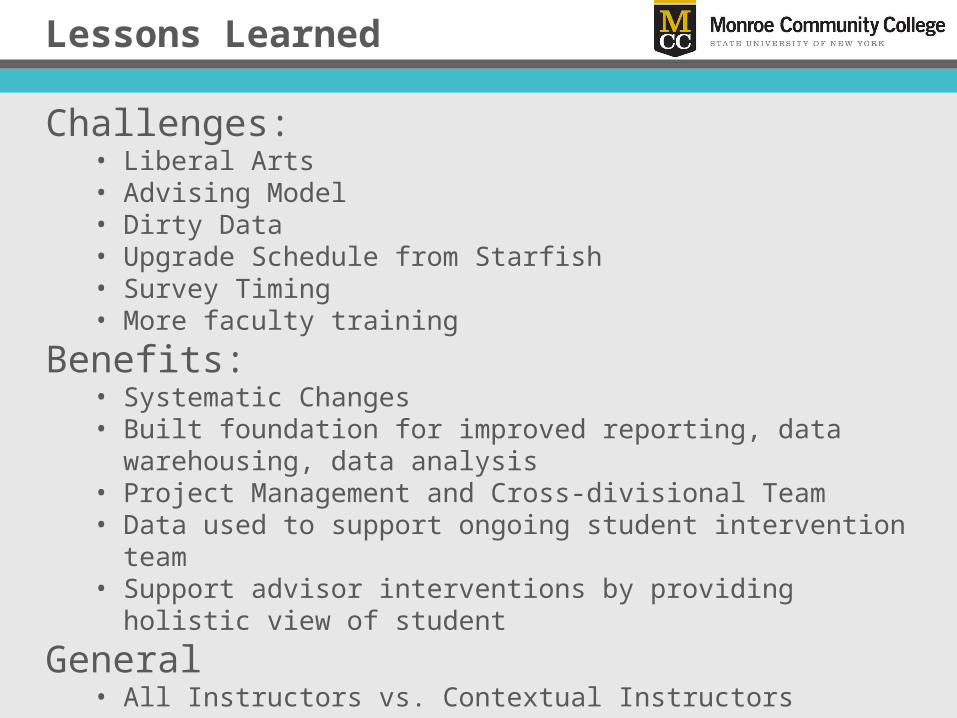
Lessons Learned
Challenges:• Liberal Arts• Advising Model• Dirty Data • Upgrade Schedule from Starfish• Survey Timing• More faculty training
Benefits:• Systematic Changes• Built foundation for improved reporting, data warehousing, data
analysis• Project Management and Cross-divisional Team• Data used to support ongoing student intervention team• Support advisor interventions by providing holistic view of student
General• All Instructors vs. Contextual Instructors• Intentionality of team buy-in early. Assignments, hands-on
navigation of system, etc.

Future Plans
• Expand; full rollout to align with new enrollment model (Academies)
• Move the needle on faculty buy-in from required to desired
• Implement cohorts for stronger reporting• Consume data for predictive analytics • Cultivate continuous assessment as a stimulus
for culture change.• Integrate service areas

• 2 yr public community college – HSI• Campuses in Haverhill and Lawrence, MA (12 mi apart)• Half hour north of Boston; “Immigrant City” one of poorest in
MA• Fall 2014 Head Count 6963 / 4127 FTEs• 33% FT and 67% PT students• 61.5% Female/38.5% Male; Average age: 25• 50.9% non-Hispanic white; 36.9% Hispanic (Lawrence campus
is 56.4% Hispanic)
NECC at a Glance
Northern Essex Community College

Implementation Team
Executive Sponsor – VP, Academic & Student Affairs
Project Manager/Functional Lead – Dean, Student Success
Technical Lead – Project Manager/Sr. Systems Analyst, MIS
Team Members:Athletic Director AdvisingPACE Director AdmissionsTitle V Director Student EngagementSuccess Coaches (who are staff and also adjuncts)Faculty (primarily via forums)

Modules, Features and Integration Early Alert only
Flags, Kudos, GPA system flag and 3-Flag Rule, Student-raised flags
SIS Integration (Banner), LMS (Blackboard)Companion, but not integrated:DegreeWorksTutorTrac

GOALS

GOALS
1) Quicker, easier way for faculty to alert for early struggle, report progress
2) More efficient system for support services to respond to alerts
3) More face time with students who need intervention
4) Greater Student Success as measured by higher retention rates, better course completion rates, fewer Fs, drops and withdrawals.
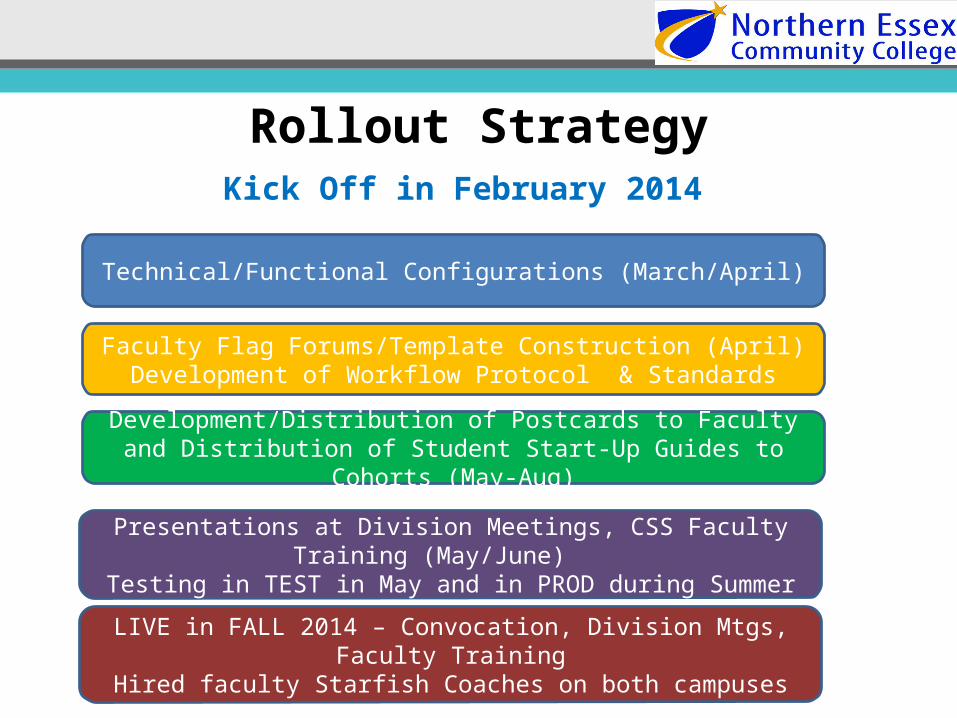
Rollout StrategyKick Off in February 2014
Technical/Functional Configurations (March/April)
Faculty Flag Forums/Template Construction (April)Development of Workflow Protocol & Standards
Development/Distribution of Postcards to Faculty and Distribution of Student Start-Up Guides to Cohorts (May-Aug)
Presentations at Division Meetings, CSS Faculty Training (May/June)
Testing in TEST in May and in PROD during Summer
LIVE in FALL 2014 – Convocation, Division Mtgs, Faculty TrainingHired faculty Starfish Coaches on both campuses
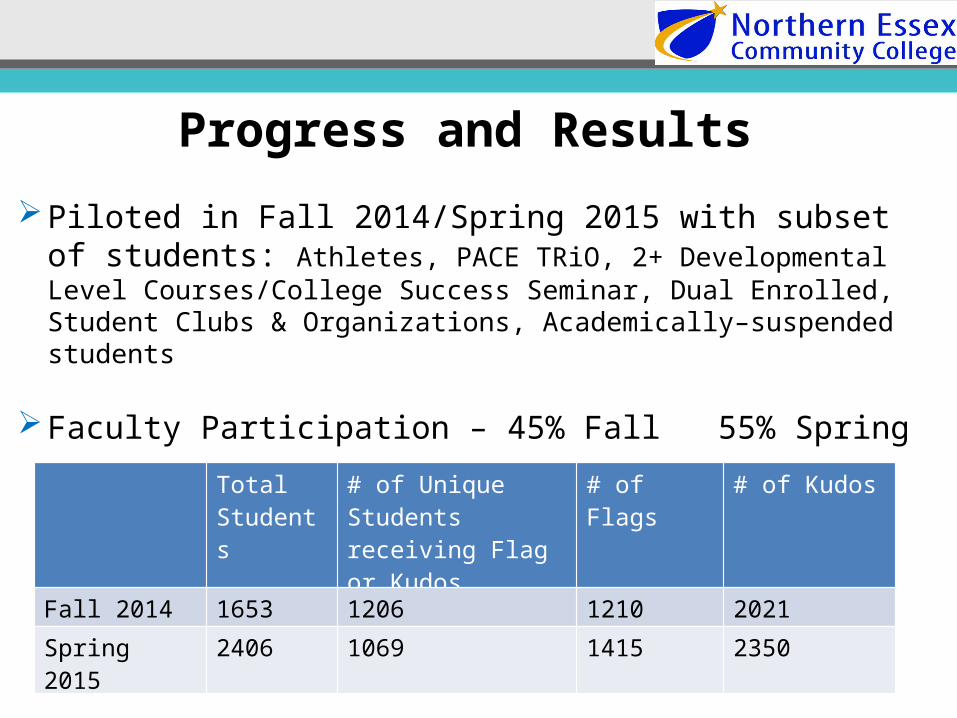
Progress and Results
Piloted in Fall 2014/Spring 2015 with subset of students: Athletes, PACE TRiO, 2+ Developmental Level Courses/College Success Seminar, Dual Enrolled, Student Clubs & Organizations, Academically–suspended students
Faculty Participation – 45% Fall 55% Spring
Total Students
# of Unique Students receiving Flag or Kudos
# of Flags # of Kudos
Fall 2014 1653 1206 1210 2021
Spring 2015 2406 1069 1415 2350

SSC Outcome Data
As a sampling of data, the Student Success Center tracks Latino student success for our Title V grant. We compared Latino students in our cohort who came in to the Center for services vs. those who were flagged but did not.
FALL 2014
Latino students using services showed an 11.3% higher CCR and a 19% higher retention rate than Latinos not using services.

What Went Well
Marketing to Faculty
Training
Collaboration
Participation
Support

Timing of Implementation – Faculty were wrapping up spring semester
Duplication of courses in Starfish in Fall 2014
Student Flag Notifications coming “From” Faculty email addresses
Small, pocketed groups of students involved made marketing/outreach tough
Coaching faculty on Notes, and Comments
Challenges

Start small Build Bridges/Seek Partners Engage Faculty Early in the process Promote SF - multiple/different
venues Set clear expectations Communicate, Communicate……
LESSONS LEARNED

ALL Students are Included
Increased Marketing
New Users are Joining In
Greater Need for Managing Expectations
Implementation Team Converted to a Strategy Team with More Faculty Involvement
What’s Different in Year 2

Add additional functionality as possible
Bring more users online and streamline workflowFA, Admissions, Tutoring
Create additional useful system flags
Analyze data and present more of it, more widespread, action-oriented
Future Plans

For more information, please contact:
Dawna M. Perez, Ph.D., Dean, Student Success [email protected]
Gisela Ramirez Nash, Director Title V/Student Success Programs [email protected]

STARFISH EARLY ALERT INTERVENTION
AT QUEENSBOROUGH COMMUNITY COLLEGE

MARGOT EDLIN, Ed.D
Interim Assistant Dean, Office of Academic Affairs
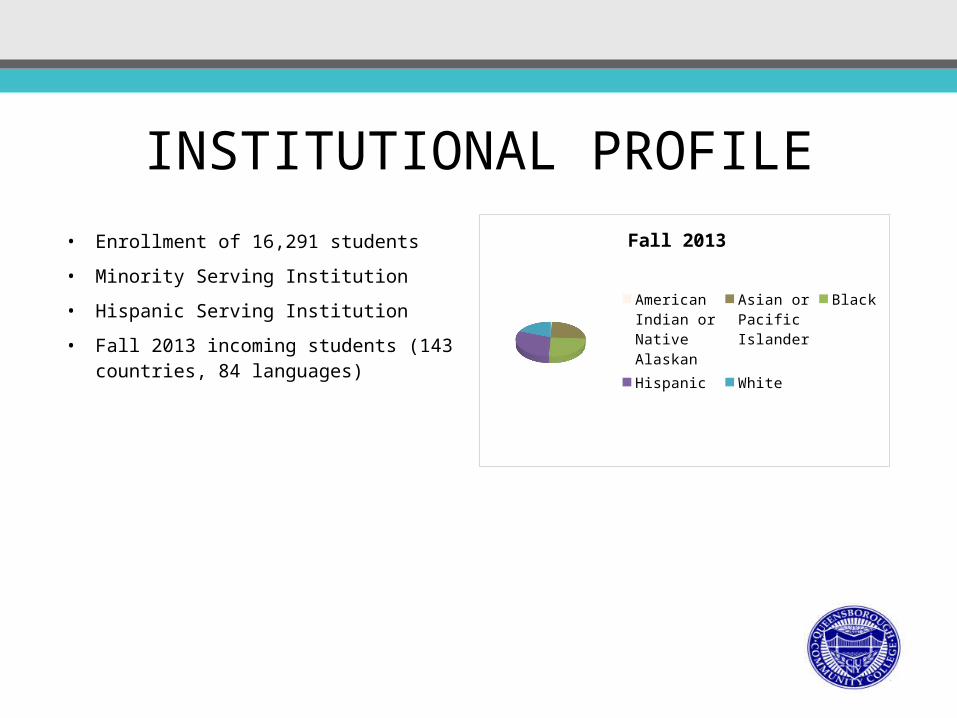
INSTITUTIONAL PROFILE• Enrollment of 16,291 students
• Minority Serving Institution
• Hispanic Serving Institution
• Fall 2013 incoming students (143 countries, 84 languages)
1%25%
25%30%
19%American Indian or Native Alaskan
Asian or Pacific Is-lander
Black
Hispanic
White
Fall 2013
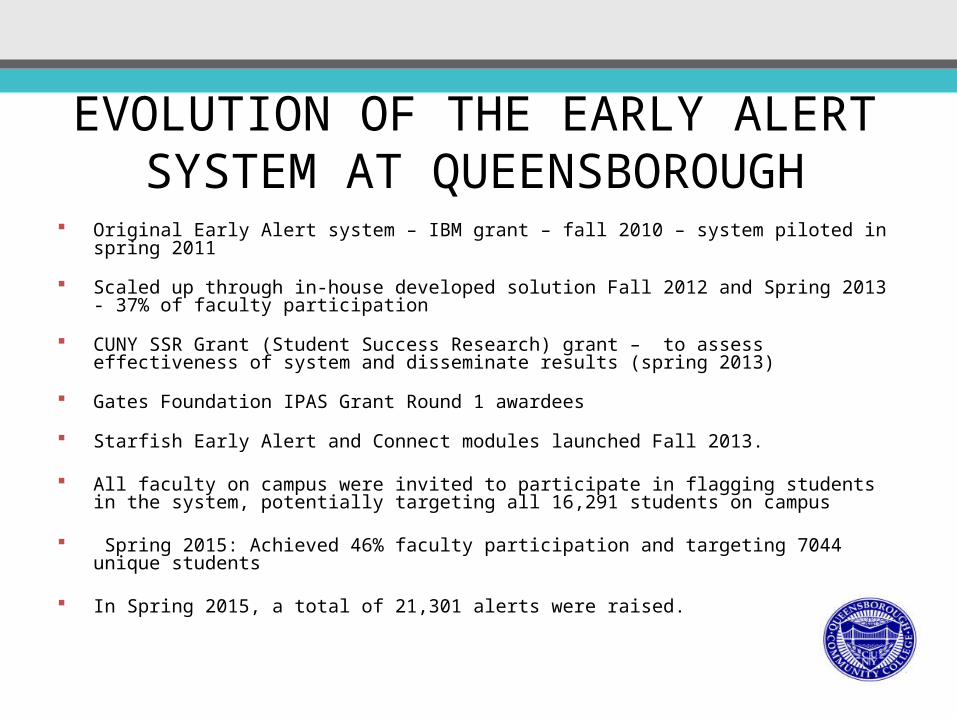
EVOLUTION OF THE EARLY ALERT SYSTEM AT QUEENSBOROUGH
Original Early Alert system – IBM grant – fall 2010 – system piloted in spring 2011
Scaled up through in-house developed solution Fall 2012 and Spring 2013 - 37% of faculty participation
CUNY SSR Grant (Student Success Research) grant – to assess effectiveness of system and disseminate results (spring 2013)
Gates Foundation IPAS Grant Round 1 awardees
Starfish Early Alert and Connect modules launched Fall 2013.
All faculty on campus were invited to participate in flagging students in the system, potentially targeting all 16,291 students on campus
Spring 2015: Achieved 46% faculty participation and targeting 7044 unique students
In Spring 2015, a total of 21,301 alerts were raised.

Summative Assessment Outcome Measures
Course Completion Rates
Course Pass Rates for Developmental Courses
Rates of C or higher for Credit Bearing Courses
Unofficial Withdrawal Rates
Student Semester GPA

At Risk Freshmen (triple remedial):
Fall 12, Spring 13, Fall 13 combined
1.72
1.57
Semester Average GPA
20%16%
Passed At Least 75% of Completed Cour-
ses in Semester
Flag & tutoring
Semester Hours Passed >= 5
Withdrawal credits - yes
24.6%29.7%
17.5%
35.4%
Semester Remedial Credits Passed => 5
Summative Results

At Risk Continuing Degree Students (Cum GPA <2.0):
Fall 12, Spring 13, Fall 13 combined
SUMMATIVE
31% 28%
Passed At Least 75% of Completed Courses
in Semester
Flag & tutoring
Flag but no tutoring
Semes
ter GPA >
= 2
Cumula
tive
GPA >
=2
37.6%44.5%
23.1%24.5%
50.3%
12.5%
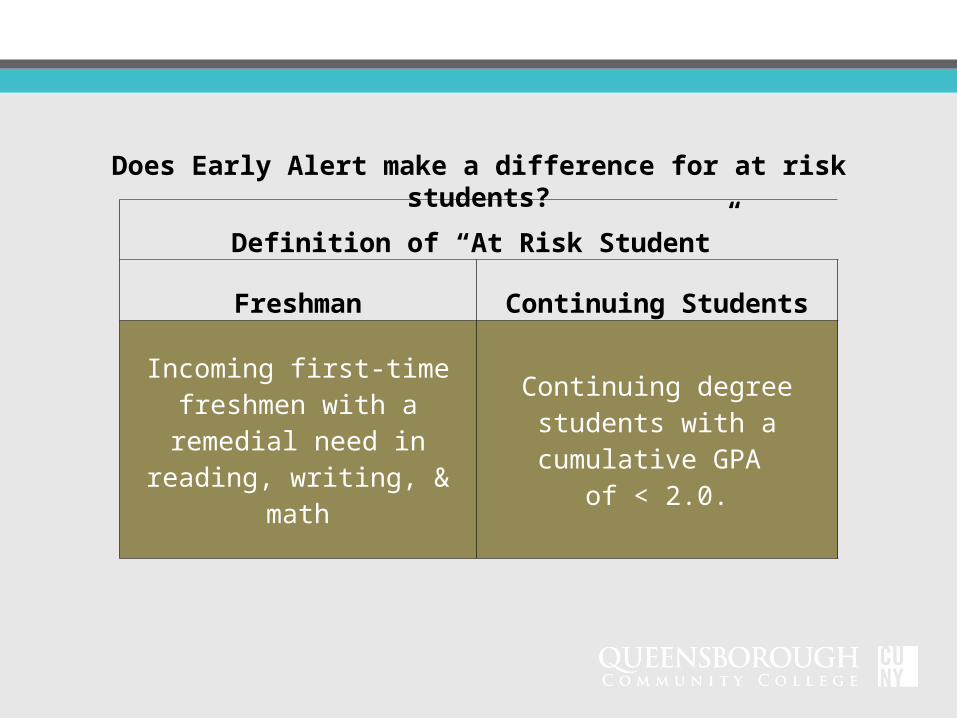
Does Early Alert make a difference for at risk students?
Definition of “At Risk Student”
Freshman Continuing Students
Incoming first-time freshmen with a remedial need in reading, writing,
& math
Continuing degree students with a cumulative GPA
of < 2.0.

Assessment Challenges
1. The early-alert and support system was upgraded midway through the assessment period.
2. The intervention was a campus-wide intervention not limited to a particular (controllable) sub-set of students.
3. The intervention by nature targets weaker students and a simple pre-post effects study is not that simple.
4. The intervention is based on the voluntary participation of faculty and students and thus selection bias plays a significant role.

Summary of Formative Findings
1. The intervention targets weaker students.
2. Referrals to actual resources, in particular, to tutoring centers have not been utilized heavily.
3. Less than 60% of the students with referrals actually did seek help from a tutoring center.
4. Students don’t reliably read college email messages.
5. The implementation of Starfish in fall 2013 increased the successful contact of students.
6. Students were contacted more often about their academic performance than they had expected at the start of school.
7. Faculty and advisers both reported that the system enhances their work and ability to serve the needs of students.

In Conclusion
Formative Summative
• Campus wide use of the system.
• Positive outcomes for at risk students.
• More referrals might increase effectiveness and allow for a more targeted student support.
• Early Alert in the form of “flags” alone is not a “treatment.”
• Customization of the system ongoing.
• Long term effects to be observed.
We are still analyzing ….

Questions?