a chemically specific burning rate predictor model for energetic materials
TRANSCRIPT

Army Research Laboratory Aberdeen Proving Ground, MD 21005-5066
ARL-TR-2390 February 2001
A Chemically Specific Burning Rate Predictor Model for Energetic Materials
Martin S. Miller and William R. Anderson Weapons and Materials Research Directorate, ARL
Approved for public release; distribution is unlimited.

Abstract .
The application of complex networks of elementary chemical reactions to the gas phase of burning energetic materials has increased markedly over the last decade. The exquisite complexity of these gas-phase reaction networks, coupled with available high-rigor treatments of transport, is not matched by an equivalent level of sophistication in descriptions of the condensed-phase and interfacial phenomena. Owing to the vastly more complicated, many-body nature of the condensed phase, this condition is not likely to be relieved soon. In response to these difficulties, a new semi-empirical approach to burning-rate calculation has been developed and applied to frozen ozone, cyclotrimethylenetrinitramine (RDX), and nitroglycerine. The new approach hypothesizes a single overall reaction linking the unreacted material to the net products of condensed-phase decomposition and characterizes their rate of formation according to an empirically derived pyrolysis law. These condensed-phase products become the reactants for the gas phase, which are treated in full elementary-reaction detail. Using this new semi-empirical model, a methodology for computing the relative effects of several additives on the burning rate of nitroglycerine is developed and demonstrated. Hopefully this approach will enable more rapid progress in modeling multi-ingredient propellants than did previous approaches attempting to model the condensed-phase processes in detail.
ii

Table of Contents
1.
2.
3.
4.
5.
6.
7.
8.
9.
10.
List of Figures ...........................................................................................................
List of Tables ...........................................................................................................
Introduction ..............................................................................................................
Conceptual Framework.. .........................................................................................
Mathematical Framework .......................................................................................
Example: Frozen Ozone .........................................................................................
Example: RDX ........................................................................................................
Example: Nitroglycerine ........................................................................................
Effect of Chemical Additives on the Burning Rate.. ......................... . ...................
V
vii
1
3
5
12
13
18
27
Speculations on Practical Burning-Rate Modifiers ..............................................
Conclusions ...............................................................................................................
References ........ .I .......................................................................................................
Appendix: Reaction Mechanism (DBll) for Nitroglycerine.. .............................
3 1
32
35
41
Distribution List.. ..................................................................................................... 5 1
Report Documentation Page ................................................................................... 53
. . . 111

h”IEN’TTONALLY LEFT BLANK.
List of Figures
Fieure Page
b 1.
2.
3.
4.
5.
6.
7.
8.
9.
10.
11.
12.
Demonsuation of the Universality of the Pyrolysis Law for Double-Base Pro+lants Based on the Work of Zenin [28] . . . . . . . . . . ..~..*.1~...f.*....*..................**.~.~...
Quality of Fit of a Pyrolysis Law to an Evaporative Regression Mechanism Calculated From a First Principles Treatment of Frozen Ozone D&lag&on [21] . .
Pyrolysis IAW for RDX Derived From Zenin’s [28] Experimental Data . . . . . . . . . . . . . . . . .
Comparison of the Burning Rates for Frozen Ozone Computed by the New Model Developed in This Report and the Previously Published First-Principles Model . . . . .
Linear Least-Squares Fit of the Speci%Heat Data of Shoemaker et al. [30] and Miller [31] for Solid RDX Over a Range of Initial Temperatures . *....~..~..I...*.***.*..*~
Comparison of Burning Rates for RDX Computed by the New Model to Those Computed by That of Liau [ 151 and to Experimental Data .**.*....*.**..***........*****.......
Temperature Profiles for RDX at 1 atm and 293 K, as Computed by the New Model, Compared With That of Liau [ 15 ] . . . . ..~~~..~~....~.*.~~.~.~.~..~..~~.~..~~*.......~~~~..~~~~..
Species Pro&s for RDX at 1 atm and 293 K, as Computed by the Present Model (Solid Lines), Compared With That of Liau [ 151 . . . . . . . . . ..*..*.~.f...~..**........**...~*~~........
Mechanism for Condensed-Phase Decomposition of NG Proposed by Levy [39] . . .
Computed NG Burning Rates at 298 K for Different Decomposition Paths Using a New Semi-Empirical Model Compared With Experimentally Measured Rates of Andreev [40,41] and Andreev et aL [42] . . . . . . ..f...f.................. . ..*f.......**...***............
IdentiEcation of Dominant Chemical Pathways for NG at 10 atm and 298 K Using the MSM4 Product Set ..f..**~.~~...~~...~...~......f*...**.*...*..*..*. . ..~~~.ff.~~.~~..~~~..........~~.....~.~~
The Effect of Two Additives, NH3 and N2, on the Flame Structure of NG at 10 atm and 298 K Using Levy’s [39] Decomposition Product Set . ..***......*..*..........
10
11
11
13
14
15
16
17
21
22
23
28
V

INTENTIONALLY LERBLANK.
Vi

List of Tables
Table N
1. Liquid-Phase Reactions in Deflagrating RDX Adopted by Various Models . . . . . . . . . . . . 4
2. Values of Condensed-Phase Parameters Used in RDX Calculations . . . . . . . . . . . . . . . . . . . . . . . 14
3. Values of Condensed-Phase Parameters Used in NG Calculations . . . . . . . . ..*........*.*.... 19
4. NG Condensed-Phase Decomposition Paths Considered l****.......~~~~~..........*.......~.~.. 19
5. Relative Sensitivity Coefkients of the Temperature Gradient at the Surface to the Most Sensitive Reactions (in Rank Order) for NG, With MSM4 Product Set at 10 atm and 298-K Initial Temperature . ..~~*....t..l.....***..*.......~.* . . ..~...~~~~.....~....~~...~*.~.~ 26
6. Effect of Different Chemical Additives on the Burning Rate of NG at 10 atm and 298 K Assuming the Levy [39] Decomposition Product Set . ..*~*~..f..*~..f..*..**.....~..... 30
7. Effect of Different Chemical Additives on the Burning Rate of NG at 10 atm and 298 K Assuming the MSM4 Decomposition Product Set . . ..~.*.~.~f...*.....**.*........~..~~.. 30
Vii

INTENTIONALLY LEFTBLANK.
. . . Vlll

1. Introduction
The last 10 years have seen an important paradigm shift in the modeling of energetic material
combustion. Models using chemically nonspecific reaction formalisms have given way to models
that promise to explain the detailed chemical nature of combustion through their explicit elementary-
reaction mechanisms. The seminal prototypes for the chemically nonspecific models were
developed during wwll by Parr and Crawford [l] and Rice and Ginell[2]. Typically these models
considered a gasification reaction at the surface of the condensed phase and a single overall reaction
in the gas phase; burning rates were computed by imposing the energy and species conservation
equations in each phase and at the burning surface. ‘A conceptual review of many of these models
was given by Miller [3], and a review of their application to composite propellants was provided by
Ramohti [4]* These early models elucidate the interplay ‘between the chemical and physical
phenomena that produce the observed patterns of burning rate dependence on pressure and initial
temperature and provided guidance in the choice of some physical features of composite-propellant
formulation, such as oxidizer particle size. By their nature, however, these models cannot give
guidance for chemical formulation and the effects of chemical additives on performance. This role
had to await the development of chemically specific descriptions of the combustion. Models with
explicit chemical mechanisms now dominate new development activities and are the subject of this
article. We will confine ourselves in this report to steady-state combustion, although some recent
work [5, 61 has addressed the role of elementary reactions in ignition.
The transition from overall reactions to detailed elementary reactions in the modeling of
energetic material combustion did not occur suddenly and, in fact, is not yet complete. Thus far, the
use of elementary reactions has been limited to the gas phase; our fundamental understanding of the
condensed phase. processes is not allowing more sophistication at present. In the interim,
condensed phase reactions have been treated as one or more overall reactions. Reaction mechanisms
for the gas phase were East developed apart from any attempt to compute the burning rate. As early
as 1965, Sotter [7] assembled a mechanism consisting of 12 species reacting by 17 reversible
reactions to describe the secondary reaction zone of double-base propellants. He numerically
integrated this mechanism, neglecting transport processes, and found order-of-magnitude agreement
1

with experimentally determined induction times for the visible flame. In the
early-to-mid 198Os, Errnolin et al. (81 worked out elementary-reaction mechanisms for ammonium
perchlorate and cyclotrimethylenetrinitramine (RDX) [9], guided by mass spectrometric
measurements in the flames of these condensed systems.
Attempts to compute the burning rate of an energetic material using realistic chemistry probably
began with the Guirao and Williams’ [lo] treatment of ammonium perchlorate in 197 1 e Though the
chemical mechanism consisted of 14 species and 10 irreversible reactions, a small problem by
today’s standards, computational tools at that time did not permit the simultaneous solution of the
kinetics and transport. A simplified simultaneous solution of kinetics and transport for a larger
mechanism of 19 species and 60 reversible reactions was reported by Hatch [ 1 l] in 1986 for
nitroglycerine. A significant advance in the computational tools available for work of this type
occurred in 1985 with the publication and availability of the PREMIX code [ 121, a user-friendly,
well-documented, one-dimensional (l-D), premixed, laminar flame code. This code and its later
improvements provide a high level of rigor to the description of gas-phase transport, allowing for
such subtle effects as thermal difhrsion and multicomponent transport to be conveniently treated.
Moreover, the description of thermodynamic functions, transport parameters, reactions, and reaction
rates in this code is also very general, allowing a wide scope of kinetic representations and
convenient updating. Melius [ 131 was the first to utilize the PREMIX code in a calculation of
energetic-material burning rate, addressing the case of RDX, In the United States, as a result of
several Office of Naval Research and U.S. Army Research Office workshops starting in about 1987,
a concerted effort was directed at understanding the physics and chemistry of RDX as a prototypical
system. This focus resulted in a number of further refmements of RDX modeling [14-173.
Extensions of these general methods have been made to include cyclotetramethylenetetranitramine
(HMX) [18, 191 and glycidyl azide polymer (GAP) [20]. In order to study the physical aspects of
three-phase combustion, Miller [21] described a detailed chemical model applied to the combustion
of frozen ozone as a prototypical energetic material for which very reliable kinetic and
thermophysical data exist.

This report focuses on models that compute the burning rate based on &tailed elementary
reaction mechanisms in the gas phase. However, it is worth mentioning a few models that are
chemically specific to some degree and utilize overall reactions to dcscril~ the gas phase. An early
example of this type of m&l comes from BenReuven et al. [22] and BenRcuven [23]. Their model
treated the combustion of RDX using one overall reaction in the liquid phase, evaporation as the
surface-gasification mechanism, and two overall reactions in the gas phase. Another example was
advanced by Bizot and Be&stead [24], who considered double-base propellant combustion using
three overall reactions in the con&nsed phase and two overall reactions in the gas phase. A recent
model attempting to simplify the very complex chemistry involved in double-base propellants is that
by Song and Yang 1251. Like the Bizot and Beckstead model, Song and Yang lump species into
categories such as al&hy&s and oxidizers. Yet another approach in this vein was taken by Li and
Williams [26], who argued for the dissociation of HONO as the rate limiting step in the primary
gas-phase mechanism of RDX and then applied an asymptotic analysis to compute the burning rate
based on this one reaction. The relative simplicity of these models is appealing, but it will take time
to determine the extent to which generality and even understanding is sacrificed.
2. Conceptual Framework
As previously stated,bur primary interest here is in that class of models which sttive to describe
the gas-phase reactions as true elementary reactions, the rate cc&?cients for which arc determined
from independent kinetics experiments, reaction-rate theory, or therm&emical estimation methods.
This restriction narrOws the number of models to only four [ 14,16,17,21]. In this report, we will
describe a fifth approach. In developing this new approach, we will apply it to RDX. It will be
helpful, therefore, to review some of the details of the other RDX models [ 14,16,17] (i.e., those in
our restricted subset of model types).
All three models [ 14,16,17] defer to the experimental work of Brill et al. [27] for a description
of the condensed-phase reactions in RDX. Brill et al. [27] found that RDX decomposes by two
competing channels, Rl and R2 (see Table 1). Unfortunately, his experiment was unable to
distinguish between several possible R2 paths, R2a, R2b, and R2c. Both Prasad et al. [16]
3

Table 1. Liquid-Phase Reactions in Deflagrating RDX Adopted by Various Models
Reaction Number Reaction
Heat of Reaction at 570 K” Model
Rl RDX+3CH20+3N20 (kcal/mole)
-47 All [14,16,17] R2a RDX+3HzCN+3N@ 179 P&S [16],
D&B [ 171 R2b RDX+3HCN+3HONO 19 -
RDX+3HCN+3NOz+3H 257 -
RDX+3HCN+3/2NO+3/2N~+3j2Hz0 34 L&Y [14]
’ This is the completed surface temperature at 1 atin.
and Davidson and Beckstead [17] elected to use R2a for the second path. Liau and Yang [14]
suggested and used in their model another interpretation of Brill’s measurements, R2d. The table
shows that the degree of endothermicity among the different R2 paths varies dramatically. Unless
condensed-phase reactions are unimportant to the deflagration of RDX, one would expect such
differences to have a significant effect on the computed burning rate. Because the three, models
being considered differ in many details other than the condensed-phase reactions just discussed and
the burning rates computed by each of the models agree quite well with experimental burning rates,
it is impossible to see theeffects of the different liquid-phase reactions in isolation. Nonetheless, it
may be significant that the amounts of RDX decomposition reported to occur in the condensed phase
vary among these models from 40% [ 161 to 25% [ 171 to a “limited” amount [ 141.
Even though the computational power now exists to treat condensed-phase reactions, our current
knowledge of these reactions (even at the level of overall descriptions, let alone an elementaty-
reaction description) is very limited. This uncertainty is not confined simply to the rate c&Ticients,
but extends to the very identities of both the reactants and products involved in these reactions. We
believe that these difficulties will not soon be resolved, and it is with this prospect in mind that we
propose the following new and more practical approach. i
4

A key difficulty with chemically specific models is dete rmining the identity and information
rates of mole fractions of chemical species which fmt emerge from the condensed phase into the gas
phase. We wiU show that given this knowledge and a reaction mechanism for the gas phase, the
burning rate can be computed. One additional requirement is an expression relating the burning rate
to the surface temperature; this will be discussed in this report. Though there is speculation required
in identifying the chemical species emerging from the condensed phase, it is much reduced from
having to speculate on the reactions occurring in the condensed phase and the rate coefficients of
those reactions. Techniques to measure or calculate those condensed-phase processes are not likely
to be realized soon; thus, the semi-empirical approach described here can be thought of as a
practical, interim strategy pending the development of definitive tools for investigating the
condensed phase. With these enabling simplifications, the model can be readily adapted to many
worthwhile purposes, including experimental testing of gas-phase reaction mechanisms, computing
the burning rate of multi-ingredient propellant formulations, and predicting the effect of chemical
additives on the burning rate.
3. Mathematical Framework
We consider the 1 -D, steady-state deflagration of a condensed substance, which is oriented in a
coordinate system moving with the linear regression velocity such that the umzacted material at an
initial temperature of To extends to x = - -, the regressing surface is always at x = 0 with
temperature T,, and the fmal gaseous combustion products at temperature Tf are found at x = + m.
The mass conservation equation can be integrated simply to give
rit = pu= p*r, (1)
where rit is the mass burning rate or mass flux, p and u are the mass density and mixture mass
velocity at any point in the interval, respectively, ps is the mass density of the unreacted material at
its initial temperature, and P is the linear regression rate of the surface. The continuity equation for
each chemical species i is
5

(2)
Here Yi is the mass fraction of the ith species, Vi is the diffusion velocity of the ith species, @ is the
molar production rate by reactions of the ith species per unit volume, and Wi is the molecular weight
of the ith species. Finally, the equation of energy conservation for this system is
(3)
where h. is the mixture thermal conductivity, FP is ‘the mixture specific heat, cpi is the specific heat
of the ith speck, hi is the enthalpy of the ith species, and N is the total number of species being
considered.
These equations are to be solved in the condensed and gas phases and their solutions matched
through appropriate boundary conditions at the surface. In the condensed phase, the energy
boundary conditions are
T = TX at x = 0,
and the species boundary conditions are
Yi = Yi- at x = -00
‘ i =Yi4atx=-0.
(4)
(5)
In the gas phase, the energy-equation boundary conditions are
6

T =T,atx=+O
dT -=Oatx=i-=, dx
(6)
and the gas-phase boundary condition on each species is
Yi =Y;&atx=+O
dY. A=Oatx=f=. dx
(7)
At the surface between these two regions, the continuity of species and energy flux is guaranteed by
the following two boundary conditions. Continuity of species flux at the surface is expressed by
litYi” + p,Y,“Vi” = rizYi” + PlYi’ov,~ ) (8)
where the superscripts -0 and +0 and subscripts c and g refer to the condensed and gas sides of the
surface, respectively. Continuity of the energy flux across the surface boundary is expressed by
These general equations are the starting point for our simplifications. In the gas phase, these
conservation equations are solved numerically using the PREMIX [ 121 code as a subroutine; thus,
the gas phase is treated with full rigor in our model. In the condensed phase, we assume that
(1) there are no in-depth chemical reactions, and (2) molecular diffusion is negligible. With these
assumptions, the energy equation in the condensed phase reduces to

$(A$) - ti$$Y$,) = 0..
Integrating this equation from x = --~3 to x = -0 results in
Substituting equation 11 and equation 8 into equation 9 yields
(10)
Equation 12 is the form of the energy-flux boundary condition used in the model developed in
this report. Notice that one does not need to know the enthalpies of the species on the condensed
phase side of the surface at T,, only their mass fractions there. This is important since heats of
desorption of the nascent gas-phase species may be difficult to estimate. We are unaware of
previously published material on this form of the energy-flux boundary condition, perhaps because
of the novelty of the present context of a single overall condensed-phase reaction being coupled to a
full elementary-reaction description of the gas phase. This equation enables our treatment. Notice
also that neither the thermal conductivity, the mass density, nor the specific heat of the condensed
phase at temperatures near the surface are required; the values of all these quantities are very
uncertain. Only the specific heat and mass density of the unreacted material over the range of initial
temperatures are required, at least for purposes of computing the burning rate. Of course, if the
temperature profile through the condensed phase is needed, then a further integration using values
for these parameters over the full condensed-phase temperature range will be required.

In order to compute a burning rate, the following information must be suppliech the enthalpy and
mass density of the unreacted energetic material over the range of initial tern-s, a set of
products (species and mole fractions) of the condensed-phase decomposition, arate of appearance of
these decomposition products as a function of surface temperature, and an elementary reaction
mechanism through which these decomposition products react in the gas phase. The condensed-
phase decomposition prc&cts become the initial or nascent gas-phase reactants.
As pointed out in our conceptual framework discussion, the identities of the condensed-phase
reaction products are not known completely, even for the relatively well-studied case of RDX. For
most other energetic materials, the situation is worse still. The only clear constraint we have in
constructing this species set is elemental balance. Therefore, from the universe of possible product
sets (i.e., those leading to a balanced overall reaction), plausible products must be selected b&on
either experimental knowledge of these product identities and concentrations (if available) or
theoretical consideration of likely reaction paths. In general, multiplicity of such plausible product
sets may occur. In this case, that which best reproduces the experimental burning rate should be
chosen. Or, an average of the product sets can be taken based on the assumption of equal apriori
probabilities of occurrence. In any case, the decomposition set chosen can be improved as new
experimental data or theoretical insights become available.
The final type of information required to compute a burning rate is the rate of appearance of the
condensed-phase decomposition products. For this, we appeal to the very old notion of an
Arrhenius-like expression [2] relating the burning rate to the surface temperature, such as
Such an expression has often been termed a ‘byrolysis law” in the propellant-combustion lip.
There are other forms of this expression in use [28,29], but the above form preserves the dominant
functionality without additional (probably uncertain) data. In fact, Zenin [28] prefers equation 13 to
represent his experimental determination of surface temperatures vs. burning rates for a range of
double-base propellants. Zenin found that this form provides a universal representation for
9

double-base propellants of different ingredient proportions (see Figure 1). It is this universality for a
given class of propellants that impels us to adopt it here as a formalism for the rate of appearance of
the condensed-phase decomposition products. In the case of double-base propellants, the
mechanism for surface regression is likely to be reactive in nature because of the polymeric character
of the nitrocellulose molecules. Figure 2 shows that the pyrolysis law in equation 13 also proves
appropriate to a purely evaporative surface regression mechanism. Here, the surface temperature for
the three-phase deflagration of frozen ozone was computed based on nonequilibrium evaporation
driven by heat feedback from gas-phase reactions [21]. The steady deflagration of RDX is also
believed to be predominately the result of evaporation [ 141. Figure 3 shows a best-fit pyrolysis law
(in the least-squares sense) for RDX using the surface-temperature and burning-rate data of Zenin
[28]. Again the fit is quite reasonable.
10
1
0.1
I I I
- fenin Pyrolysis Law I e Zenin D&a- a
1.0 1.2 1.4 1.6 1.8 2.0 2.2
1 O3 x 1 /T&K)
Figure 1. Demonstration of the Universality of the Pyrolysis Law for Double-Base Propellants Based on the Work of Zenin [28].
10

‘f\l .: m = 2.341~10~ exp(-1720.1Q
t L 0 First-Principles Model
- Least-Squares Fit
1 I
i 4 5 6 7
103x1/Ts(K) . . . Figure 2. Quality of Fit of a Pyrolysis Law to an Evaporative Regression Mechanism
Calculated From a First Principles Treatment of Frozen Ozone Deflagration [21].
IO
,,-,, . ..*. .y . Zen in RDX Data .,. - Least-Squares Fit
,. ,
1.1 1.2 1.3 1.4 1.5 1.6 1.7 1.8 1.9
lo3 x l/T,(K)
Figure 3. Pyrolysis Law for RDX Derived From Zenin’s [28] Experimental Data.
11

4. Example: Frozen Ozone
Our fmt example of the application of this new model is that of the self-sustained deflagtzion of
frozen ozone. Using the pyrolysis law previously determined from a fast-principles model [21] to
test for consistency, the burning rate is computed by the new model and compared with the burning
rate computed by the first-principles model. Such a test is not as trivial as it might seem. The
calculational details involving the evaporative surface-regression mechanism of the first-principles
model is considerably more complicated than that involved in the new model. However, the
evaporation process is characterized by an energy barrier (heat of vaporization), and the assumption
of local thermodynamic equilibrium introduces a Boltzmann factor this suggests that the process
may be controlled by an Arrhenius-like term. On the other hand, the evaporation-mechanism
equations [21] do not lead to such a simple expression, though an Arrhenius-like dependence on
temperature evidently does have an implicit relevance given the excellent fit of the pyrolysis law
observed in Figure 2.
Since any condensed-phase reactions in liquid ozone are too slow to influence the deflagration
rate, the mechanism of surface regression is the following: evaporation driven by heat, released in
gas-phase reactions, and conducted back to the surface. In this situation, the nascent gas-phase
species is evaporated ozone (i.e., Yz = 1). Coupling this with the fitted pyrolysis law just clcscribed
and the reaction mechanism consisting of three reversible reactions [21], we have computed the
frozen ozone burning rate by our new model. It will be compared to the rate computed by the fnst-
principles model [21]. Figure 4 shows that the agreement is excellent. The first-principles model in
this case includes thermal diffusion and multicomponent transport, and the numerical grid spacing is
fme enough that the burning rates are computed to an accuracy within a few tenths of a percent.
Also, the central differencing option was selected. Thus, the success both of the pyrolysis law and
the new model is based on a high level of computational rigor. The dominant chemical steps
occurring in the gas phase for the ozone case are thoroughly discussed in Miller [21).
12

0 First-Principles Model + Present Model
0.1 L / # LIIII
1 10
Pressure ( atm ) Figure 4. Comparison of the Burning Rates for Frozen Ozone Computed by the New Model
Developed in This Report and the Previously Published First-Principles Model [21].
5. Example: RDX
As previously discussed, the condensed-phase decomposition paths for RDX are uncertain.
Evaporation was determined to be the overwhelmingly dominant mechanism by Melius [13], Liau
and Yang [ 143, and Liau [ 151, and at least predominant by Davidson and Beckstead [ 171 and FVasad
et al. [ 16). We therefore examine the consequences of assuming in our model that the surface-
regression mechanism is purely evaporative. Thus, by analogy to the ozone case above, vapor-phase
RDX is assumed to he the sole species emerging from the surface; mathematically.this is expressed
as Y& = 1. The pyrolysis law is obtained by a linearized least-squares fit to the experimental data
of Zenin [ZS] and is illustrated in Figure 3.
The enthalpy of the solid at the initial temperature is determined as follows: the specific heat of solid RDX is obtained by a least-squares fit of a linear temperature function to the data of
13

Shoemaker et al [30] and Miller [3 11. The fit is shown in Figure 5 and its parameters are in Table 2.
This functional form of the specific heat is integrated over temperature to determine the enthalpy of
solid RDX using the value of the heat of formation at 298 K to obtain the integration constant. This
treatment differs from that of Liau and Yang [ 141 and Liau [15], in that their model assumes a
constant value of specik heat.
240 260 280 300 320 340 360 380 400-420
Temperature (K)
Figure 5. Linear Least-Squares Fit of the Specific-Heat Data of Shoemaker et al. [30] and Miller [31] for Solid RDX Over a Range of Initial Temperatures.
Table 2. Value of Condensed-Phase Parameters Used in RDX Calculations
[ Value As = 6.134 x 10’ g/cm*+
ES = 18,539 Cal/m01
ps = 1.66 G/CM3
Wmx = 222.118 g/mol AHF = 14,590 ca.l/mol
Description Exponential prefactor in pyrolysis law (see text) Activation energy in Pyrolysis law (see text) Mass density of pressed solid used in experiments [28] RDX molecular weight RTDX heat of formation at 298 K
CP solid = 0.03604 + (7.105 x ~o-~)T cal/g-K Specific heat of solid RDX over temperature range 260 K (see text)
14

The reaction mechanism (Yet&s second model [ 16]), thermodynamic data, and transport data
for this case is taken from the work of Liau [ 151. The burning rate (Figure 6), temperature
(Figure 7), and species profiles (Figure 8) computed by the present model at an initial temperature of
293 K agrees very closely to that computed by the Liau modeL (Dr. Y.-C. Liau kindly made his
code available to us. All calculations in this article attributed to the Liau model [15] were made
using the code version dated 13 February 1997.) We emphasize that the gas-phase reaction
mechanisms, species thermodynamics, and transport parameters in both models are identical; only
the treatment of the condensed phase and surface-gas&a&I mechanism are Merent. The model
burning rates shown iu Figure 6 also compare favorably with the experimental data of Miller [32],
Zenin [28],Ulas et al. [33], Homan et al [34], and Atwood et al. [35].
10
A
E
5 - 1
g!
2
F _ F ‘i
m b 0.1
E .1 J
0.01 f
I
0 Miller Experimental Data 0 Zenln Experimental Data ,. ,,
P Ulas, et al. Experimental Data A Home et al. Expe~men~l Dam ,,,,,, ,,_,,,_,,........ _ ..,..... 0 Atwood, et al. Experimental Data
- - Llau & Yang Model
1 10
Pressure ( atm )
Figure 6. Comparison of Burning Rates for RDX Computed by the New Model to Those Computed by That of Liau [15] and to Experimental Data. (See Teti for Experimental Data Referenccs)
15

I- 500
0 0 500 1000 1500 2000
Distance from Surface (microns) Figure 7. Temperature Profiles for RDX at 1 atm and 293 K, as Computed by the New
Model, Compared With That of Liau [lS].
In the RDX case, we have sought to minimize nongermane computational differences between
the new semi-empirical model and that of Liau and Yang [14]. Their cl-mice of the
windward differencing option, numerical grid options, and suppression of the thermal difFusion and
multicomponent transport options in PREMIX were selected for our calculations as well
The dominant reaction paths for RDX flames have been discussed previously [13], andwhile the
reaction mechanism has been expanded and refined since that study, we believe that the conclusions
have not changed significantly. Hence, no new dominant-path analysis for RDX is given here.
However, a brief explanation is now given for the slight rise in temperature above the adiabatic
equilibrium value late in the flame zone, as shown in Figure 7. This behavior is surprising compared
to 02/fuel combustion in which the temperature rise is monotonic; however, it is quite typical of
flames oxidized by NzO and NOz. In 02 flames, there is typically an overshoot of H, 0, and OH
concentrations late in the flame zone, above their eventual equilibrium values. In hydrocarbon/@
flames, this overshoot is caused by the following radical chain-branching reactions:
16

0.20
c 0 -cI 0 g 0.15
a,
8
0.10
0.05
0 500 1000
, ._--- cc--
,----
: *--L-
j :
; !
1500 2000
Distance from Surface (microns)
Figure 8. Species Profiles for RDX at 1 atm aid 293 K, as Computed by the Present Model (Solid Lines), Compared With That of Liau [15] (Dashed Lines).
17

and
H+&+OH+O
As this excess of radicals recombine in the burnt-gas region, heat is released and the tern-
continues to rise to the adiabatic equilibrium value. For NzO- and NOZ-oxidized flames, these
chain branching reactions are absent. Towards the end of the flame zone, the radical concentrations
are usually somewhat below their eventual equilibrium values. To reach the final equilibrium
concentrations of radicals, stable species slowly decompose in the burnt gas region, absorbing heat
in the process, and lowering the final temperature to the equilibrium value. For the case in
Figure 7, our calculations show that H, 0, and OH concentrations rise by factors of 2 to 5 between
800 and 2,ooO p.m. Over this same region, the temperature drops by about 100 K. A similar result
was observed in computations for a low-pressure HfizO/Ar flame [36].
6. Example: Nitroglycerine
Relatively little information is available on the thermal decomposition pathways of
nitroglycerine (NG). We examine it here in the context of the new semi-empirical burning rate
model because it represents a case of intermediate chemical complexity, it continues to play an
important iole in gun propellants, and it is a substance for which experimental burning rate data
exists. Vital also is the fact that we could assemble a gas-phase reaction mechanism with relatively
few changes from that previously developed for the dark zone of nitrate-ester and &amine
propellants [37,38]. This was accomplished by adding only one additional species, C&O, and its
associated reactions. The resulting mechanism (labeled DE31 1 here) is given in the Appendix and
consists of 35 species and 178 reversible reactions. Other parameters are given in Table 3.
For the pyrolysis law, we simply use the universal double-base law determined by Zenin [28]
and shown in Figure 1. Double-base propellants, of course, consist primarily of different propordons
of NG and nimellulose. Though NG is therefore one limiting case of a double-base propellant,
there is not necessarily reason to suppose the double-base pyrolysis law to be applicable to NG
18

Table 3. Values of Condensed-Phase Parameters Used in NG Calculations
Value
As = 1.8 x lo3 g/cm2-s
I ES = 9935 cal/mole
ps = 1.59 g/cm3 WNG = 227.087 g/mole ~&JpK=- 88,600 cal/mole
CT = 0.2975 d/g-K
Description
Exponential prefactor in pyrolysis law
Activation energy in pyrolysis law
Mass density of liquid NG NG molecular weight
NG heat of formation at 298 K
Specific heat of liquid NG
solely on this account. However, both NG and nitrocellulose are nitrate esters whose likely first step
in decomposition is an N& scission; if this were a rate limiting step, then the decomposition rates
for NG and nitrocellulose might be expected to be similar. This argument may, in fact, be the
underlying reason for the apparent universality of the double-base pyrolysis law. In any case, we
will have to let the results be the ultimate justification for this assumption.
A major source of ambiguity in applying the new m&l to NG is the identification and
quantification of the condensed-phase decomposition products, which are the nascent gas-phase
species. As suggested previously, this is a situation in which a number of possibilities (consistent
with a balanced reaction) must be examined and, ideally, arbitrated by broad theoretical reasoning.
Again, the results must be the ultimate justification for this choice. We have examined the use of
three sets of condensed-phase decomposition products for the NG case. The first is motivated by the
only other elementary reaction treatment of NG of which we are aware. Hatch [ 1 l] assumed,
without attempting justification, that NG decomposed by the path, as indicated in Table 4.
Table 4. NG Condensed-Phase Decomposition Paths Considered
Overall NG Decomposition Path Reaction Path Label NG (C&N309) II 3 NO2 + 2 CJit20 + HCO Hatch [ 111 NGO2N~+HONO+2CH~O+CO Levy [39] NGlJ3HONO+2HCO+CO MSM4
19

We have not found a way to rationalize this path theoreticalIy, but deem it worthwhile to
consider it anyway based on its previous use. A second path, given in Table 4, was hypothesized by
J. B. Levy [39] based on theoretical considerations. The steps in NG decomposition proposed by
Levy are illustrated in Figure 9. A third set (MSM4) of decomposition products is also given in
Table 4 and is used to compute burning rates. No thcorctical justification based on a detailed
sequence of paths is offered for this set, but it does lead to good agreement with experimental rates
(as will be shown). One of our aims in considering a number of condensed-phase reaction paths is to
gauge the sensitivity of the computed burning rate to the choice of path.
Figure 10 shows the results of the burning rate calculations using each of the above sets of
condensed-phase decomposition products at,an initial temperature of 298 K. The Qure also shows
experimental burning rates measured by Andreev [40,413 and Andreev et al. [42]. The MSM4
decomposition product set leads to very good agreement with the experimental burning rates over a
wide range of pressure. It is also of interest to note that the burning rate can vary by as much as an
order of magnitude among the possible decomposition product sets that we have considered. This
finding could be considerably important to tailoring the propellant burning rate for specific purposes
if a way could be found to actively influence the decomposition pathways in the condensed phase.
In ail of the calculations presented here involving NG (including those of the next section), the
windward, differencing option and suppression of the thermal diffusion and multicomponent
transport options were selected. The numerical grid options were such that the burning rates
presented are numerically accurate to about 2% or better.
Since this is the most extensive, detailed chemical modeling of NG combustion ever perfarmed,
a detailed analysis of the gas phase flame for one condition is presented. The case chosen is for pure
NG at 10 atm at an initial temperature of 298 K, with the assumed MSM4 product set
(3HONO+2HCO+CO). This is the product set which yields the best agreement between predicted
burning rates and experiment (see Figure 10). Pathway diagrams, shown in Figure 11, have been
constructed for this case using a postprocessor code, PREAD, written at ARL for the PREMIX c&.
To obtain these diagrams, the rates were first integrated over distance from the propellant surface to
20

CH20N02
I CHONOP
CHO
I
CHO
I CH20N02
co
0 verall:
+ NO2
CH20N02
CHO
CHO
I CH20N0g
co - I
CHPONOz
+ NO2
CO + NO2 + CHiO
+ NO2 + CHzO
+ HONO
NG -> 2 NO2 + HONO + 2 CHpO + CO
Figure 9. Mechanism for Condensed-Phase Decomposition of NG Proposed by Levy [39].
0.030 cm. This region, which we term the primary reaction zone, includes all of the near surface
flame up to the leading edge of the dark zone, as determined by plateaus in temperature and key
species (e.g. NO and concentration profiles [not shown]). Using the integrated rates gives a concise
global picture of the chemistry in this region. The flame is quite structured in this region, however,
having five separate peaks in the heat-release profile. A complete discussion of this structure is
outside the scope of report, but some remarks about the structure are contained in the following
discussion- The chemistry of the dark zone of NG, the region of low gradients in species
concentration and temperature between the primary flame and the secondary tlarne (visible flame), is
similar to that for double-base propellants. That case has been discussed elsewhere [37,3X].
21

+ Calculation with Levy .Products
I iii-
0,
Pressure (MPa)
Figure 10. Computed NG Burning Rates at 298 K for Different Decomposition Paths Using a New Semi-Empirical Model Compared With Experimentally Measured Rates of Andreev [40,41] and Andreev et al. [42].
22

(a) Carbon-Chemistry Dominant Pathways.
+OH (205) q +H (18) A +HCO (3
+H (137) L +HNO (28)
+HCO (26) -co (19)
,NO HONO _ ~ A
.- +HCO (
‘+NOz (28)
r +HCO (22)
HNO (b) Nitrogen-Chemistry Dominant Pathways.
Figure 11. Identification of Dominant Chemical Pathways for NG at 10 at-m and 298 K Using the MSM4 Product Set. Numbers in Parentheses Are the Relative Rates of Each Reaction Value of 100 in Relative Units, Which Equals 8.817 x low3 moYcm’-s. Line Thickness Is Proportional to the Total, Relative, and Integrated Rates for Each Path.
23

The conversion of HCO to other species is very rapid, which is not surprising considering its
radical nature. This conversion takes place very close to the surface, occurring within the first
0.001 cm. As shown in Figure 1 la, most of the HCO is converted to CO by unimolecular
decomposition or by reaction with NO, H, or NOz. However, a portion of the HCO is temporarily
converted to CH20, primarily by reacting with I-lNO. The CH20, being much less reactive than
HCO, survives further into the primary flame. Later in the primary reaction zone, the CHZO is
converted back into HCO by reacting with OH and H; the HCO formed in this way never builds to
an appreciable concentration, but is instead converted to CO or CO2 first stage products.
The nitrogen chemistry is considered in Figure 1,l b. As with HCO, the conversion of HONO to
other species begins rapidly near the surface because of its direct reaction with a portion of the HCO,
which forms NO2 and CH20. However, only a small portion of the available HONO reacts prior to
the depletion of the HCO. Instead, most of the HONO conversion is delayed, occurring mainly
between 0.001 and 0.015 cm. A portion of the HONO is converted directly to NO via unimolecular
decomposition. However, much of it is first converted to NO2 via reaction with OH, H, or HCO.
Curiously, the conversion of NO2 to NO takes place mainly after the burnout of the HONO.
Ordinarily, in combustion involving NO2 as a major species, it is found that NO2 converting to NO
by reacting with H atoms is so fast that it occurs at a very early point, and it controls the radical pool
concentrations: But here, the HONO+M = NO+OH+M reaction is the major radical source, the
HONO concentration in the region is large, and the HONO+OH rate constant is also large. This
leads to HONO+M=NO+OH+M and HONO+OH = HzO+N02 as the major nitrogen pathways close
to the surface, rather than NOz+H = NOtOH. The NO2 formed early in the flame from HONO
reacts higher in the flame after the HONO is gone. NO? is converted to NO primarily by an H atom
reaction, but there are also important contributions from HNO, HCO and CO reactions. NO, the
only nitrogenous species surviving into the dark zone, may be viewed as the nitrogenous ‘>roduct”
of the first stage combustion- The concentration of HNO is small, except very close to the surface.
It appears that although their concentrations are small, HNO and NO play important roles in a
catalytic cycle for the near-surface HCO conversion.
24

.
More information concerning the importance of the various reactions to the predicted burning
rate may be obtained from a sensitivity analysis. The sensitivity coefficient of the temperature at a
given spatial grid point to a particular reaction rate is defined as
si (14)
where Ai is the A-factor of the ith reaction, T is the temperature at the point of interest, and T,,, is the
maximum temperature observed in the entire solution. The second grid point in the solution is
chosen as the point of interest because this-one has special significance. The burning rate is strongly
controlled by the amount of heat feedback from the gas-phase reactions to the propellant. The heat
feedback rate is in turn primarily controlled by the temperature gradient at the propellant surface.
Thus, the magnitude of rate constants for reactions that have a high temperature sensitivity at the
second grid point in the solution must have a strong influence on the computed burning rate. In fact,
to a good approximation, the sensitivity coefficient of the heat feedback is. proportional to the
sensitivity c&frcient of the second grid point. Table 5 shows the fmt-order temperature
sensitivities for the second gas-phase grid point of the solution (and the heat feedback) for reactions
with relative values above three. For the coefficient of the second grid point, a relative value of 100
equals an absolute value of 7.769 x 10q4. A positive temperature sensitivity c&fi&nt indicates that
an increase in the rate coefficient of the reaction will result in an increase in temperature at point
two; such an increase is expected to increase the burning rate. Note that the largest sensitivity is for
HCO+M = H+CO+M. This is not surprising since the reaction not only converts HCO to a fmal
product, but produces the highly reactive H atom. Sensitivities of most of the other reactions can
also be rationalized by their effects on the radical pool or formation of fmal products with release of
heat. The only one whose high, positive sensitivity has been difficult to rationalize is the secondone
on the list, H2+N& = HONO+H. This reaction is reversed throughout the entire calculational
domain (e.g., Figure 1 lb). Its reversal is not surprising since HONO is initially in the MSM4
tiomposition product set. Ordinarily, since this reversed reaction converts a highly reactive H
atom to comparatively unreactive species, one would expect the corresponding sensitivity would be
negative. It seems likely that the explanation for the positive sensitivity is the formation of Na,
25
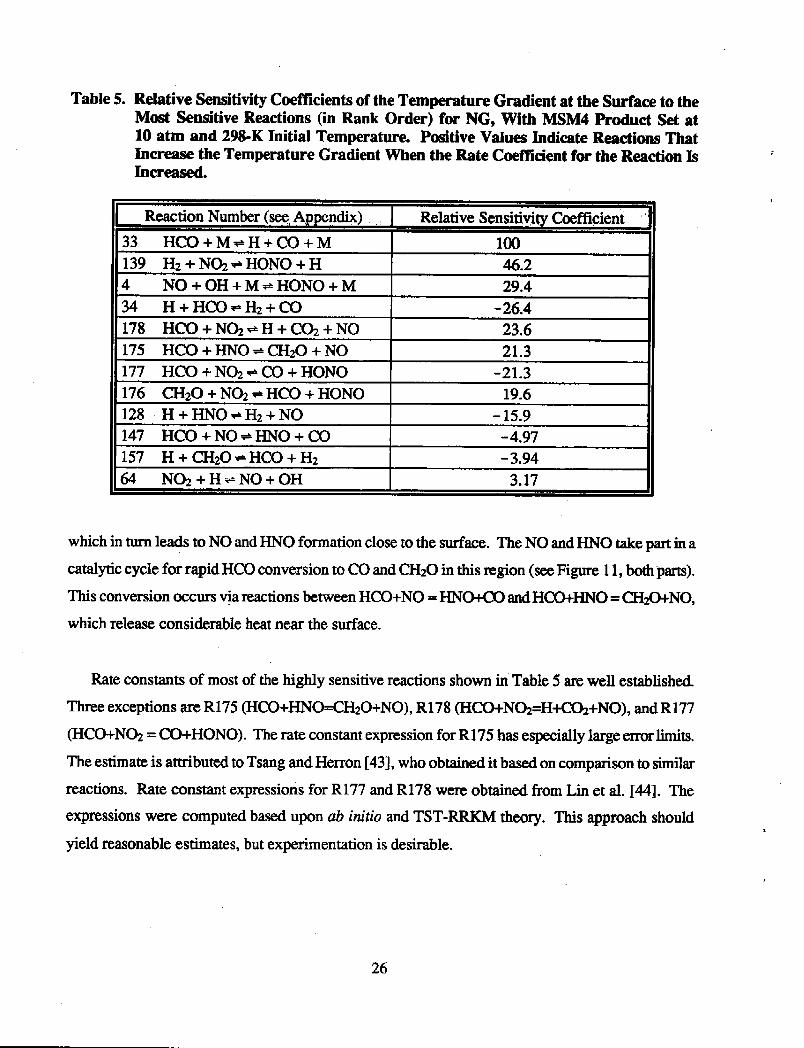
Table 5. Relative Sensitivity Coefficients of the Temperature Gradient at the Surface to the Most Sensitive Reactions (in Rank Order) for NG, With MSM4 Product Set at 10 atm and 298-K Initial Temperature. Positive Values Indicate Reactions That Increase the Temperature Gradient When the Rate Coefficient for the Reaction Is Increased.
Reaction Number (see,, Appendix) I Relative Sensitivity Coefficient
33 HCO+M=+H+CO+M 100 139 Hz+NOz*HONO+H 46.2 4 NO+OH+M*HONO+M 29.4 34 H+HCO*Hz+CO - 26.4 178 HCO+N~~H+C&+NO 23.6 175 HCO+HNO*CH20+N0 21.3 177 HCO+NOz+CO+HONO -21.3 176 C&O + NOZ * HCO + HONO 19.6 128 H+HNO*Hz+NO - 15.9 147 HCO+NO--HNO+CO -4.97 157 H+CHzO*HCO+H2 -3.94 fd N@+H-fNO+OH 3.17
which in turn leads to NO and HNO formation close to the surface. The NO and HNO take part in a
catalytic cycle for rapid HCO conversion to CO and C&O in this region (see Figure 11, both parts).
This conversion occurs vja reactions between HCO+NO = HNW andHmHN0 = C&O+NO,
which release considerable heat near the surface.
Rate constants of most of the highly sensitive reactions shown in Table 5 are well established.
Three exceptions are R175 (HCO+HNO=CH~O+NO), R178 (HCO+N~=H+C@+NO), and R177
(HCO+N@ = CO+HONO). The rate constant expression for R175 has especially large errs limits.
The estimate is attributed to Tsang and Herron [43 3, who obtained it based on comparison to similat
reactions. Rate constant expressions for R177 and R178 were obtained from Lin et al. [44]. The
expressions were computed based upon ab initio and TST-RRKM theory. This approach should
yield reasonable estimates, but experimentation is desirable.
26

7. Effect of Chemical Additives on the Burning Rate
It has always been hoped that theoretical modeling might some day contribute to a solution for
the problem of the effects of chemical additives on the burning rate of propellants. However, only
with the relatively recent advent of chemically specific modeling with elementary reactions was
there any real prospect for realizing these hopes. In this section we demonstrate that theoretical
guidance useful to the propellant formulator, namely the effect of additives on the burning rate, is
becoming feasible.
As a first demonstration of the effects of additives on propellant flames, we took the converged
values of burning rate (0.394 cm/s) and surface temperature (628 K), obtained in a calculation ofNG
at 10 atm using the Levy decomposition product set and the DBl 1 reaction mechanism, as our
starting conditions for a series of steady premixed flames with several different additives. A 10%
mole fraction of NH3 was then added to the Levy product set (reducing the original product mole
fractions proportionately). The flame structure was then computed and compared to the pure NG
case-the result is shown in Figure 12. The two-stage flame structure is known to occur because of
the reduction of HONO and NO2 to NO in the primary reaction zone (next to the surface) and the
subsequent, slower reduction of NO to Nz in the secondary reaction zone (at the end of the dark
zone). The secondary reaction zone is also known as the secondary flame or the visible flame. In
that figure, the secondary gas flame for the pure NG case stands off from the surface by about a
centimeter. (Notice that the distance scale is logarithmic.) This is typical of the dark zone length of
double-base propellants. When the NH3 is added, the dark zone collapses by about a factor of five.
Also, the heat feedback increases by 3 1%. Normally, when the heat feedback increases, one
can expect the burning rate to increase as well. The effect NH3 has on the dark zone length may
explain why M30 (29O/, nitrocellulose, 22% nitroglycerine, 47% nitroguanidine, 2% stabilizer) burns
with no apparent dark zone, unlike any other gun propellant. A major ingredient in M30 is
nitroguanidine, which may be expected to supply NH, upon decomposition. The chemical rationale
for this effect will be discussed later in this report. A case with 10% N2 added is shown in Figure 12
for comparison. The N; has its expected diluent effect, lowering the heat feedback by 28%, but has
27

No Additive 10% NH, Additive 10% N, Additive
0.0001 0.001 0.01 0.1 1
Distance from Surface (cm)
Figure 12. The Effect of Two Additives, NH3 and Na, on the Flame Structure of NG at 10 atm and 298 K Using Levy’s [39] Decomposition Product Set. Surface Temperature and Mass Flux Are Fixed at 628 K and 0.626 g/cm*-s, Respectively, for All Cases.
relatively little effect on the dark zone length. Liau [ 151 performed a similar study of the effect of
various additives on the dark zone of RDX.
A more systematic approach is needed to compare the effects of one additive to another in a
quantitative sense. Adopting the propellant formulation strategy of using enough additive to bring
the mixture to a zero oxygen balance affords a rational method of determining the amount of each
additive appropriate for comparison purposes. The oxygen balance is defined as that amount of
oxygen one must add or subtract to have all oxygen appear in either Hz0 or COz. NG has a positive
balance of 3.5% (i.e., it has an oxygen surplus). Thus, we compute that one third of a mole ofNH3
must be added to effect a neutral oxygen balance for each mole of NG. For comparison, we examine
two other potential additives, CH20 and HZ. We are, of course, limited here to those fuel molecules
that are already in our reaction mechanism.
28

c
Additional assumptions arc required in order to model the effects of condensed-phase mixtures
of ingredients. The mass density of the mixture is computed by the methodof additivcpartialmolar
volumes, such as
Pmk = wadg I
Cxivi 9 i
il5)
where W,, is the average molecular weight, Xi is the mole fraction of ingredient i, and Vi is the
molar volume of ingredient i. This quantity is important in calculating the linear burning rate from
the mass burning rate. Secondly, we assume that the starting mixture enthalpy is given by the
weighted sum of the ingredient enthalpies. This.is a reasonable approximation to make, but it
ignores any enthalpy of mixing or solution contributions; there is also some ambiguity as to what
state is best to use for the additive enthalpy. Finally, we must, of course, assume that the pyrolysis
law is unchanged as a result of these additives. This assumption is reasonable in view of the small
amount of each additive.
The results of the additive computations are given in Table 6 for the Levy decomposition product
set and Table 7 for the MSM4 decomposition product set. The enthalpies of all of the additives in
Table 6 and Table 7 at 298 K are taken as that for the gas phase. It should be noted that this
assumption could have important consequences for the computed burning rate. For example, if the
enthalpy for NH3 liquid at 298 K is used, the linear burning rate increases by only 12%. This smaller
increase reflects the additional energy requirement of the heat of vaporization. Clearly, the
calculation of the unreacted mixture enthalpy may require a more sophisticated theoretical treatment
In interpreting the small percentage differences shown in these tables, bear in mind that the
numerical accuracy of these calculations is no worse than 2%; thus, some of the smaller effects
found may not be sign&ant.
Through sensitivity and rate analysis, we were able to identify the chemical mechanism for the
burning-rate enhancement of NG by NH5 Essentially, NH2 reduces NO to fmal product N2 by the
following two most important paths,
29

Table 6. Effect of Different Chemical Additives on the Burning Rate of NG at 10 atm and 298 K Assuming the Levy [39] Decomposition Product Set
Additive Weight % Linear Burning Rate Mass Burning Rate Heat Feedback (“h increase) (% increase) (% increase)
NH3 2.4 19 15 19 CH20 3.2 1 -1 -5 HZ 0.44 1 -8 -6
Table 7. Effect of Different Chemical Additives on the Burning Rate of NG at 10 atm and 298 K Assuming the MSM4 Decomposition Product Set
Additive Weight % Linear Burning Rate Mass Burning Rate Heat Feedback (% increase) (% increase) (% increase)
NH3 2.4 16 12 14 CR20 3.2 7 5 2 H2 0.44 2 -7 -6
NH2+NO+ NNH+OH
+ N2 +HzO.
The NNH thus formed rapidly decomposes to N2 + H. The reaction therefore leads to chain
branching, which may be important to the burning rate enhancement, in addition to the increased NO
conversion rate to Nz. The NH2 is formed from NH3, predominately by the following reaction:
NH3+OH-,NHIz+H20.
This mechanism reinforces our speculation that M30 forms no dark zone due to the presence of an
amino group on the nitroguanidine.
30

8. Speculations on Practical Burning-Rate Modifiers
The mechanism of NH3 action invites a further discussion of the M30 case. With
NI&modified NG, we found both a collapse in the dark-zone length and a significant boost in the
burning rate. M30 has no dark zone, consistent with our NI&modified NG case, but it burns no
faster than a single-base propellant and slower than a double-base propellant, a fact which appears to
be inconsistent with our model calculation. This apparent inconsistency might be explained as
follows. It is likely that the large percentage of nitroguanidine (NQ) present in M30 is responsible
for the lack of burning-rate enhancement since it acts .to lower the flame temperature of the
propellant. Hence, the cooling effect might outweigh the rate acceleration effect for such major
proportions of NQ. We would expect that if a small amount of NQ, say 2-5%, was added to either a
single or double-base propellant, then the burning rate would be increased and the dark-zone length
diminished. Of course, some of the benefit of the NH2 from NQ could be hindered by the energy
required to either break down its parent molecule or to get it into the gas phase, as could be seen in
our model calculation’s sensitivity to the NH3 starting enthalpy state. Nonetheless, here is a
concrete, theoretically inspired idea that could easily be tested. Thus, though the model needs to be
further refined and expanded, it can already provide insights of potential worth to the propellant
formulator.
The propellant formulator may find it expedient to tailor decreases in the burning rate as well as
increases. For example,..it has been found [45] that for layered propellants, at least a three-to-one
ratio in the rates of the two layer materials must be attained in order to achieve desired performance
enhancements. We have conducted preliminary calculations [463 showing HNCO as an additive that
both decreases the heat feedback (and therefore presumably the burning rate) and decreases the
visible flame standoff. As NH2 proved to be the active molecule in increasing the heat feedback
resulting from the addition of NH3 to NG, NCO. appears to be the active molecule for the HNCO
additive. One factor leading to the reduced heat feedback may be that the radical NC0 combines
with NO and NO2 near the surface to form relatively stable molecules such as N2, N20, CO, and
COZ, thereby diminishing the rate of radical growth. Reduction in the visible flame standoff (dark
zone length) may be due to the tmimolecular decomposition in the dark zone of the NzO which is
31

formed in the near surface region via the NC0 reactions. This decomposition, NzO 4 N2 f 0,
increases the radical growth rate in the dark zone, causing acceleration of the reactions leading to the
visible flame. In fact, a decrease in the visible flame standoff may be a desirable effect in that it
might reduce gun ignition delays, delays attributable to the slowness of the reactions leading to the
substantial heat release of the visible flame [473. Of course, to realize the benefits of these
provocative ideas, much work is yet to be done both in searching for suitable active molecules and in
finding practical substances that can release these active molecules. Now, the way is clear for a new
and productive partnership between the theoreticians and the formulation chemists.
9. Conclusions
Models of energetic material combustion have increased enormously in their sophistication and
complexity in recent years. Treatments of the gas phase involving dozens of species and hundreds of
elementary reactions are now common. On the other hand, chemically specific descriptions of the
condensed phase have not kept pace, largely because of the lack of definitive exp’eriments and theory
relating to the reaction paths there. All existing treatments of the condensed phase consider several
overall reactions at most, and even these suffer from uncertainties in the identities and concentrations
of the reactants and products. In the face of these intractabilities, we have developed a new semi-
empirical model, one which requires as input a single overall reaction representing the conversion of
unreacted energetic material to the nascent gas-phase species and a pyrolysis law expressing the
relationship of surface temperature to burning rate. This approach, where the pyrolysis law is
universal over some class of materials, makes the most sense; the existence of such a relation has
been previously verified for double-base propellants. We have demonstrated that the simplest form
of the pyrolysis law also well describes surface regression due to evaporative and reactive
mechanisms. The capability of this model in describing the burning rate as a function of pressure
and even species profiles (where available) was illustrated for frozen ozone, RDX, and
nitroglycerine.
Key uncertainties in applying this model to energetic materials include the identity and
concentrations of the products of the condensed-phase decomposition. By examining a number of
32

possible product sets, we found that the computed burning rate could vary by as much as an order of
magnitude among these sets. This finding suggests that it might be possible to influence the burning
rate of a material by stimulating decomposition along normally less favored paths.
One of the long-held hopes for chemically specific combustion modeling is the capability to
compute the effects of chemical additives on the burning rate, in order to rationalize the performance
tailoring of propellants. We believe that progress is rapidly being made towards fi.Jfilling that
promise. As a demonstration of this budding capability, we determined the relative effect of three
additives on the burning rate of nitroglycerine where the amounts of each additive were computed to
achieve a neutral oxygen balance for each mixture.
33

34

10. References
1. Parr, R. G., and B. L. Crawford. ‘A Physical Theory of Burning of Double-Base Rocket Propellants." Journal of Physical and Colloid Chemhy, vol. 54, pp. 92%952, 1950.
2. Rice, 0. K., and R. Ginell. ‘The Theory of the Burning of Double-Base R&et Powders.” Journal of Physical and Colloid Chemistry, vol. 54, pp. 88S-917, 1950.
3. Miller, M. s. ‘In Search of an Idealized Model of Homogeneous Solid propellant Combustion.” Combustion und Flame, vol. 46, pp. Sl-73,1982.
4. Ramohalli, K. N. R. “Steady-State Buming of Composite Propellants Under Zero Cross-Flow Situation.” Funhmentals of Solid-Propel&t Combustion, edited by K. K. Kuo and M. Sumerfield, Progress in Astronautics and Aeronautics Series, AIM, vol. 90, pp. -77, 1984.
5. Liau, Y. -C., and V. Yang. “A Time-Accurate Analysis of RDX Monopropellant Combustion With Detailed Chemistry.” Proceedings of the 32nd .TAiM’VAF Combustion Subcommittee and 1995 Propulsion System Hazards Subcommittee Meeting, CPIA Publication 638, vol. I, pp. 5747, 1995.
6. Liau, Y. -C., and V. Yang. “An Improved Model of Laser-Induced Ignition of RDX Monopropellant.” Proceedirigs of the 33rd JAhNAF Combllstion Meeting, CKA Publication 653, vol. II, pp. 529-545,1996.
7. Sotter, J. ,G. “Chemical Kinetics of the Cordite Explosion Zone.” Proceedings of the 10th Symposium (Interniuoml) on Combustion, The Combustion Institute, Pittsburgh, PA, pp. 14OS-1411,196s.
8. Ermolin, N. E., 0; P. Kurobeinichev, A. G. Tereschenko, and V. M. Fomin. “Kinetic Calculations and Mechanism Definition for Reactions in an Ammonium Perchlorate Flame.” Fiziku Goreniya i Vzryva,’ vol. 18, pp. 61-70, 1982.
9. Ermolin, N. E., 0. P. Korobinichev, L. V. Kuibida, and V. M. Fomin. ‘Study of the Kinetics and Mechanism of Chemical Reactions in Hexogen Flames.” Fizikra Goreniya i Vzryvu, vol. 22, pp. 544-553, 1986.
10. Guirao, C., and F. A. Williams. “A Model for Ammonium Perchlorate Deflagration Between 20 and 100 atm.” AIAA Journal, vol. 9, pp. 134S-1356,197l.
11. Hatch, R. L. ‘%hemicaI Kinetics Combustion Model of the NG/Binder System.” Pruceebgs of the 23rd JANNAF Combustion Meeting, vol. I, pp. 157-165, October 1986.
35

12. Kee, R. J., J. F. Grcar, M. D. Smooke, and 5. A. Miller. “‘A Fortran Program for Modeling Steady Laminar One-Dimensional Premixed Flames.” Report SAND85-8240, Sandia National Laboratories, December 1985, reprinted March 199 1.
13. Melius, C. F. “Thermochemical Modeling: II. Application to Ignition and Combustion of Energetic Materials.” Chemistry and Physics of Energetic Materials, edited by S. Bulusu, NATO AS1 309, pp. 51-78,199O.
14. Liau, Y. -C., and V. Yang. ‘Analysis of RDX Monopropellant Combustion With Two-Phase Subsurface Reactions.” Journal of Propulsion and Power, vol. 11, pp. 729-739,1995.
15. Liau, Y. -C. “A Comprehensive Analysis of RDX Propellant Combustion and Ignition With Two-Phase Subsurface Reactions.” Ph.D. dissertation, Department of Mechanical Engineering, The Pennsylvania State University, University Park, PA, May 1997.
16. Prasad, K., R. A. Yetter, and M. D. Smooke. “‘An Eigenvalue Method for Computing the Burning Rates of RDX Propellants.” Combustion Science and Technology, vol. 124, pp. 35-82, 1997.
17. Davidson, J. E., and M. W. Beckstead. “Improvements to Steady-State Combustion Modeling of Cyclotrimethylenetrinitramine.” Journal of Propulsion and Power, vol. 13, pp. 375-383, 1997.
18. Davidson, J. E., and M. W. Beckstead. “A Three-Phase Model of HMX Combustion-” Proceedings of the 26th Symposium (International) on Combustion, The Combustion Institute, Pittsburgh, PA, pp. 1989-l 996,1996.
19. Prasad, K., R. A. Yetter, and M. D. Smooke. “An Eigenvalue Method for Computing the Burning Rate of HMX Propellants.” Combustion and Flame, vol. 115, pp. 406-416, 1998.
20. Davidson, J. E., and M. W. Beckstead. ‘A Mechanism and Model for GAP Combustion.” Proceedings of the 33rd JANNAF Combustion Meeting, CPIA Publication 653, vol. II, pp. 91-100,1996.
21. Miller, M. S. “Three-Phase Combustion Modelling: Frozen Ozone, a Prototype System.” Proceedings of the Materials Research Society Symposium: Decomposition, Combustion and Detonation Chemistry of Energetic Materials, edited by T. B. Brill, T. P. Russell, W. C. Tao, and R. B. Wardle, Materials Research Society, Pittsburgh, PA, pp- 169-l 80, 1996.
22. BenReuven, M., L. H. Caveny, R. J. Vichnevetsky, and M. Sumrnerfreld. “‘Flame Zone and Sub-Surface Reaction Model for Deflagrating RDX.” Proceedings of the 16th Symposium (International) on Combustion, The Combustion Institute, Pittsburgh, PA, pp. 1223-1233,1977.
36

23. BenReuven, M. “Nitramine Monopro@lant Deflagration and Non-Steady, Reacting Rocket Chamber Flows.” Ph.D dissertation, Department of Mechanical and Aerospace Engineering, Princeton University, Princeton, NJ, January 1980.
24. Bizot, A., and M. W. Beckstead “A Model for Double Base Ropellant Combustion.” Proceedings of the 22nd Symposium (International) on Combustion, The Combustion Institute, Pittsburgh, PA, pp. 1827-1834,1989.
25. Song, H., and D. Yang. ‘%lc&l for predicting the Burning Rate of Double Base Propellants From Ingredients.” Proceedings of the 28th International Annual Conference of Iff, Karlsruhe, Federal Republic of Germany, pp. 84-l-84-12,24-27 June 1997.
26. Li, S. C., and F. A. Williams. “‘N&amine Deflagration: Reduced Chemical Mechanism for Primary Flame Facilitating Simplified Asymptotic Analysis.” Journal of Propulsion and Power, vol. 12, pp. 302-309, 1996.
27. Brill, T. B., H. Arisawa, P. J. Brush, P. E. Gongwer, and G. K. Williams. “Surface Chemisuy of Burning Explosives and Propellants.” Journal of Physical Chemistry, vol. 99, pp. 13&l-1392,1995.
28. Zenin, A. ‘HMX and RDX: Combustion Mechanism and Influence on Modern Double-Base Propellant Combustion.” Journal of Propulsion and Power, vol. 11, pp. 752-758, 1995.
29. Ward, M. J., S. F. Son, and M. Q. Brewster. “Steady Deflagration of HMX With Simple Kinetics: A Gas Phase Chain Reaction Model.” Combustion and Flame, vol. 114, pp. 55&568, 1998.
30. Shmmaker, R. L., J.-A. Stark, and R. E. Taylor. ‘Theimophysical Properties of Pro@lants.” High Temperatures - High Pressures, vol. 17, pp. 42w35, 1985.
31. Miller, M. S. ‘Themqhysical Properties of Cyclotrimethylenettiniuamine.” Jour& of Thermophysics and-Heat Transfer, vol. 8, pp. 80>805, 1994.
32. Miller, M. S. U.S. Army Research Latwrratory, Aberdeen Proving Ground, MD, unpublished data.
33. UIas, A., Y. C. Lu, K. K. Kuo, and T. Freyman. ‘Measurement of Temperahue and NO and OH Concentmtions of Solid Propellant Fhunes Using Absorption Spectroscopy.” Proceedngs of the 32nd JANNAF Combustion Meeting, CPIA Publication 631, vol. I, pp. 46149,1995.
34. Homan, B. E., M. S. Miller, W. R. Anderson, and J. A. Vandcrhoff. “Detail&l Chemistry of RDX Combustion: Experiments and Models.” Proceedings of the 35th JAhrNAF Combustion Meeting, Tucson, AZ, 1998, in press.
37

35. Atwood, A., P. 0. Curran, C. F. Price, and J. Wiknich. “Burning Rate, Radiant Ignition, and Global Kinetics of Cyclotrimethylene Trinitramine (RDX).” Proceedings ofthe 32ndJAMVAF Combustion Meeting, CPIA Publication 638, vol. I, pp. 149-159, 1995.
36. Sausa, R. C., W. R. Anderson, D. C. Dayton, C. M. Faust, and S. L. Howard. “‘Detailed Structure Study of a Low Pressure, Stoichiometric Hz/NzO/Ar Flame.” Combustion and Flame, vol. 94, pp. 407+25,1993.
37. Anderson, W. R., N. Ilincic, N. E. Meagher, K. Seshadri, and J. A. Vanderhoff. “‘Detailed and Reduced Chemical Kinetic Mechanisms for the Dark Zones of Double-Base and Nitrarnine Propellants in the Intermediate Temperature Regime.” Proceedings of the 32nd JANNM Combustion Subcommittee Meeting and 1995 Propulsion Systems Hazards Subcommittee Meeting, CPIA Publication 638, vol. I, pp. 197-114, 1995.
38. Ilincic, N., W. R. Anderson, K. Seshadri, and N. Meagher. “Simplified Chemical-Kinetic Mechanisms for Characterizing the Structure of the Dark Zones of Double-Base and Nitramine Propellants.” Proceedings of the 26th Symposium (International) on Combustion, The Combustion Institute, Pittsburgh, PA, pp. 1997-2006, 1996.
39. Levy, J. B. Personal communication with E. Freedman. U.S. Army Research Laboratory, Aberdeen Proving Ground, MD.
40. Andreev, R. K. “Experimental Investigation on Combustion of Explosives.” Collection of Articles on i%eory of Explosives, Oborongiz, Moscow, pp. 39-65, 1940.
41. Andreev, K. K. “Thermal Decomposition and Combustion of Explosives.” Gosenergoizdat,, Moscow-Leningrad, 1957.
42. Andreev, K. K., A. P. Glazkova, and I. A. Tereshkin. “&Investigation of Pressure, Temperature, and Density Influence on Combustion, Explosives, and Some Composites.” Report of Chemical Physics Institute, MOSCOW, 1959-l 960.
43. Tsang, W., and J. T. Herron. “Chemical-Kinetic Data Base for Propellant Combustion I Reactions Involving NO, N02, HNO, HNO2, HCN, and N20.” Journal of Physica and Chemical Reference Data, vol. 20, pp. 6Ow63,199l.
44. Lin, C. Y., 8. T. Wang, M. C. Lin, and C. F. Melius. “A Shock Tube Study of the CHzO + NO2 Reaction at High Temperatures.” International Journal of Chemical Kinetics, vol. 22, pp. 455-482,1990.
45. Robbins, F. W., and D. A. Worrell. “Fastcore Layered Propellant Study.” Proceedings of the 29th JANNAF Combustion Meeting, CPIA Publication 593, vol. 1, pp. 91-98, 1992.
38

46. Miller, M. S., and W. R. Anderson. “Detailed Combustion Modeling as an Aid to Propellant Formulation: Two New Strategies.” U.S. Army Research Laboratory Memorandum Report, 1999, in press.
47. Kooker, D. E., S. L. Howard, and L. -M. Chang. “Flamespreading in Granular Solid Propellant: Initial Results.” Proceedings of the 30th JANNAF Combustion Meeting, CPIAPublication 606, ~01s I, pp. 241-258,1993.
39

40

Appendix:
Reaction Mechanism (DBll) for Nitroglycerine
41

INI-ENTIONALLYWTKAIW.
.
42

CHEMKIN INTERPRETER OUTPUT: CHEMKIN-II Version 3.6 Apr. 1994 DOUBLE PRECTSION
-_-_-_f___---f-f____ ELEMENTS ATOMIC CONSIDERED WEIGHT _--_______----I----_
1. H 1.00797 2. c 12.0112 3. 0 15.9994 4. N 14.0067
-__--_t----_---_____l_____l_____________--------
SPECIES CONSIDERED --_-_---__-_-_
1. H 2. HZ 3. 02 4. H20 5. co2 6. CO 7. N2 8. NO2 9. N20
10. NO 11. HONO 12. OH 13. 0 14. HO2 15. H202 16. CH20 17. CH30 18. CH2 OH 19. CH30H 20. CH 21. c 22. HCO 23. NH3 24. NH2 25. NH 26. N 27. N-NH 28. HNO 29. HOC0 30. Em-No 31. N2H2 32. N2H3 33. NZH4 34. NO3 35. NC0
C PH HA AR S G MOLECULAR TEMPERATURE E E WEIGHT LOW HIGH
ELEMENT COUNT H C 0 N
__*--f_--*_-----___*_ GO 1.00797 G 0 2.01594 G 0 31.99880 G 0 18.01534 G 0 44.00995 G 0 28.01055 G 0 28.01340 G 0 46.00550 G 0 44.01280 G 0 iO.00610 G 0 47.01347 GO 17.00737 G 0 15.99940 G 0 33.00677 G 0 34.01474
+ G 0 30.02649 GO 31.03446 G 0 31.03446 G 0 32.04243 G 0 13.01912 GO 12.01115 G 0 29.01852 G 0 17.03061 GO 16.02264 G 0 15.01467 G 0 14.00670 G 0 29.02137 G 0 31.01407 G 0 45.01792 G 0 45.02077 G 0 30.02934 G 0 31.03731 G 0 32.04528 G 0 62.00490 GO 42.01725
------------------------------------------ 300.0 5000.0 1 0 0 0 300.0 5000.0 2 0 0 0 300.0 5000.0 0 0 2 0 300.0 5000.0 2 0 1 0 300.0 5000.0 0 1 2 0 300.0 5000.0 0 1 1 0 300.0 5000.0 0 0 0 2 300.0 5000.0 0 0 2 1 300.0 5000.0 0 012' 200.0 6000.0 0 0 1 1 300.0 5000.0 1 0 2 1 300.0 5000.0 1 0 1 0 300.0 5000.0 0 0 1 0 300.0 5000.0 1 0 2 0 300.0 5000.0 2 0 2 0 200.0 6000.0 2 1 1 0 300.0 3000.0 3 110 250.0 4000.0 3 1 1 0 300.0 5000.0 4 1 1 0 300.0 5000.0 1 1 0 0 300.0 5000.0 010 0 300.0 5000.0 1 1 1 0 300.0 5000.0 3 0 0 1 200.0 6000.0 2 0 0 1 200.0 6000.0 1 0 0 1 300.0 5000.0 0 0 0 1 250.0 4000.0 1 0 0 2 200.0 6000.0 1 0 1 1 300.0 4000.0 1 1 2 0 300.0 5000.0 1 0 1 2 300.0 5000.0 2 0 0 2 300.0 5000.0 3 0 0 2 300.0 5000.0 4 0 0 2 300.0 5000.0 0 0 3 1 200.0 6000.0 0 111

(k = A T**b exp(-E/RT)) REACTIONS CONSIDERED A b
1. N02(+M)=NO+O(+M) 7.6003+18 -1.27 Low pressure limit: 0.247003+29 -O-337003+01 0.748003+05 T&H VALUES 0.95000E+OO -O.lOOOOE-03
N20 Enhanced by 1.500E+OO H20 Enhanced by 4.400E+OO N2 Enhanced by 1.000E+00 co2 Enhanced by 2.300E+OO
2. N20(+M)=N2+O(+M) .' 1.2603+12 0.00 Low pressure limit: O-597003+15 0.00000E400 O-566403+05
N20 Enhanced by 5.000E+OO H20 Enhanced by 7.500E+OO N2 Enhanced by 1.000E+00 co2 Enhanced by 3.200E+OO 02 Enhanced by 8.200E-01
3. H+NO(+M)=HNO(+M) 1.520E+15 -0.41 Low pressure limit: 0.40000E+21 -0.175003+01 0.00000E+00
N20 Enhanced by 5.000E+OO H20 Enhanced by S.OOOE+OO N2 Enhanced by l.OOOE+OO co2 Enhanced by 1.300E+OO
4. NO+OH(+M)=HONO(+M) 1.9883+12 -0.05 Low pressure limit: 0.508003+24 -0.25100E+Ol -0.676003+02 T&H VALUE 0.62000E+OO
5.
6. 7. 8. 9.
10. 11. 12. 13. 14. 15. 16. 17. 18. 19. 20. 21. 22. 23. 24. 25. 26.
N20 Enhanced by 5.000E+OO H20 Enhanced by 8.300E+OO N2 Enhanced by l.OOOE+OO co2 Enhanced by 1.500E+00
NO+M=N+O+M 1.400E+15 N2 Enhanced by l.OOOE+OO H2 Enhanced by 2.200E+OO H20 Enhanced by 6.700E+OO co2 Enhanced by 3.000E+OO N20 Enhanced by 2.200E+OO
N~+M=N+N+M 3.710E+21 N20+N=N2+NO l.OOOE+13 N02+N=N20+0 S.OlOE+12 N02+N=NO+NO 3.980Et12 N02+N02=NO+N0+02 l-6303+12 NOZ+N02=NO+N03 9.6403+09 N02+N03=NO+N02+02 1.400E+ll HNO+NO=N2O+OH 8.5103+12 HNO+OZ=H02+NO l.OOOE+13 HNO+N02=HONO+NO 6.000E+11 HONO+O=OH+N02 1.200E+13 HONO+OH=H20+N02 1.270E+lO HONO+NH2=N02+NH3 l.OOOE+lO HNO+O=OH+NO 3.6103+13 NH+O=NO+H 5.5003+13 NH+O=N+OH 3.7203+13 NH+NH=N2+H+H S.lOOE+13 NH+M=N+H+M 2.6503+14 NH2+NO=NZO+H2 5.000E+13 CH+02=HCO+O 3.3003+13 CH+O=CO+H 5.7003+13
0.00 148430.0
1.60 225000.0 0.00 19870.0 0.00 0.0 0.00 0.0 0.00 26120.0 0.73 20920 .o 0.00 3180.0 0.00 29590 .o 0.00 25000.0 0.00 1987.0 0.00 5961.0 1.00 135.0 1.00 0.0 0.00 0.0 0.00 0.0 0.00 0.0 0.00 0.0 0.00 75510.0 0.00 24640.0 0.00 0.0 0.00 0.0
E
73290.0
62620.0
0.0
-721.0
44

27. CH+OH=HCO+H 28. CH+C02=HCO+CO 29. CH+H=C+H2 30. c+o2=co+o 31. C+OH=CO+H 32. OH+HCOc=>HZO+CO 33. HCO+M<=>H+CO+M
H2 Enhanced by H20 Enhanced by co Enhanced by co2 Enhanced by
34. H+HCOc=>H2+CO 35. HCO+O=CO+OH 36. HCO+O=C02+H 37. HC0+02<=>H02+CO 38. CO+O(+M)=C02(tM)
Low pressure limit: O-135003+25 T&H VALUE 0.10000E+01
H20 H2 co co2 N20
39. CO+OH=C02+H 40. c0+02=c02+0 43. H02+CO=C02+OH 42. H2+02=20H 43. OH+H2=H2O+H 44. 02+H=O+OH 45. O+HZ=OH+H 46. H+02+M=H02+M
H20 co2 H2 co N2
47. OH+HOZ=H20+02 48. H+H02=20H 49. O+H02=02+OH 50. 20H=O+H20 51. 2H+M=H2+M
H2 H20 co2
52. 2H+H2=2H2 53. 2H+H20=H2+H20 54. 2H+C02=H2+C02 55. H+OH+M=H20+M
H20 56. H+O+M=OH+M
H20 57. O+O+M=02+M 58. H+H02=H2+02 59. 2H02=H202+02 60. H202+M=20H+M 61. H202+H=H02+H2 62. H202+OH=H20+H02 63. NO+H02=N02+OH
Enhanced by Enhanced by Enhanced by Enhanced by Enhanced by
Enhanced by Enhanced by Enhanced by Enhanced by Enhanced by
Enhanced by Enhanced by Enhanced by
Enhanced by
Enhanced by
3.000E+13 0.00 3.4003+12 0.00 1.500E+14 0.00 2.000E+13 0.00 5.000E+13 0.00 5.000E+13 0.00 1.8703+17 -1.00
2.000E+OO 1.200E+Ol 1.500E+OO 2.000E+OO
7.3403+13 0.00 3.000E+13 0.00 3.000E+13 0.00 7.600E+12 0.00 1.800E+lO 0.00
-0.279003+01 0.419003+04
1.200E+Ol 2.5OOE+OO 1.900E+OO 3.800E+OO 5.000E+OO
1.510E+OY 2.5303+12 5.8003+13 1.700E+13 2.1603+08 3.5203+16 5.0603+04 3.6103+17
1.860E+01 4.200E+OO 2.900E+OO 2.100E+OO 1.300E+OO
7.5003+12 l-6903+14 1.400E+13 6.000E+08 l.OOOE+l8
O.OOOE+OO O.OOOE+OO O.OOOE+OO
9.2003+16 6.000E+19 5.4903+20 l-6003+22
5.000E+OO 6.2003+16
5.000E+OO l-8903+13 6.6303+13 1.800Et12 1.300E+17 4.8203+13 l-7503+12 2.110E+12
1.30 -758.0 0.00 47688.0 0.00 22934.0 0.00 47780.0 1.50 3430.0
-0.70 17070.0 2.67 6290.0
-0.72 0.0
0.00 0.0 0.00 874.0 0.00 1073.0 1.30 0.0
-1.00 0.0
-0.60 0.0 -1.25 0.0 -2.00 0.0 -2.00 0.0
-0.60 0.0
0.00 -1788.0 0.00 2126.0 0.00 0.0 0.00 45500.0 0.00 7948.0 0.00 318.0 0.00 -479.0
0.0 690.0
0.0 0.0 0.0 0.0
17000.0
0.0 0.0 0.0
400.0 2380.0
45

64. 65. 66. 67. 68. 69. 70.
71. 72. 73. 74. 75. 76. 77. 78. 79.
N02+H=NO+OH N02+0=N0+02 NCOtH=NH+CO NCO+O=NO+CO NCO+N=N2+CO NCO+OH=NO+CO+H NCO+M=N+CO+M
N20 H20 N2 co2
NCO+NO=NZO+CO NCO+NO=C02+N2 NCO+N02=C02+N20 NCO+N02=CO+NO+NO Iw+o2=HNo+o NH+02=NO+OH NH+NO=N2O+H NH+NO=N2+OH N20+H=N2+OH Declared duplicate
80. N20+H=N2+OH Declared duplicate
81. NNH+O=N20+H 82. NN'H+O=NO+NH 83. N20+0=N2+02 84. N20+0=NO+NO 85. H+KNO=NH+OH 86. NH+OH=N+HZO 87. NH+N=NZ+H 88. N+H2=NH+H 89. HNO+H=NH2+0 90. NH2+O=NH+OH 91. NH2+OH=NH+H20 92. NH2tH=NH+H2 93. N-H2+NH=N2H2+H - 94. NH2+N=N2+H+H 95. IW2+02=HNO+OH 96. NH2+NH2=N2H2+H2 97. NHZ+NH2.+iH+NH3 98. NH2+NH2=N2H3+H 99. NH2+NH2+M=N2H4+M
100. NH2+N02=N2O+H20 101. NH+N02=N2O+OH 102. N2H4+H=N2H3+H2 103. NZH4+OH=N2H3+H20 104. N2H4+0=N2H3+OH 105. N2H3=N2H2+H 106. N2H3+H=N2H2+H2 107. N2H3+OH=N2H2+H20 108. N2H3+0=N2H2+OH 109. N2H2+M=NNH+H+M
H20 02 N2 H2
110. N2H2+H=NNH+H2 111. NZHZ+O=NH2+NO
1.300E+14 3.900E+12 5.4003+13 4.5203+13 2.00OE+13 2.000E+13 1.1403+23
Enhanced by 5.000E+OO Enhanced by 5.000E+OO Enhanced by l.OOOE+OO Enhanced by 1.500E+OO
8.8003+17 l.l30E+18 1.9503+13 1.7703+12 4.6103+05 1.2803+06 3.5003+14 2.1603+13 2.5303+10
reaction... 2.230E+14
reaction... 1.400E+14 3.3003+14 3.6543+12 9.985E+13 3.000E+14 5.000E+ll 3.000E+13 1.600E+14 3.5003+15 6.7503+12 4.000E+06 4.000E+13 1.500E+15 7.2003+13 4.5003+12 5 .OOOE+ll 5.000E+13 1.7903+13 2.9803+47 2.8403+18 l.OOOE+13 1.000E+12 3.000E+lO 2.000E+13 1.200E+l.3 l.OOOE+12 3.000E+lO 2.000E+13 5.000E+16
Enhanced by 1.500E+Ol Enhanced by 2.000E+OO Enhanced by 2.000E+OO Enhanced by 2.000E+OO
5.000E+13 l.OOOE+13
0.00 361.0 0.00 -238.0 0.00 0.0 0.00 0.0 0.00 0.0 0.00 7500.0
-1.95 59930 .o
-1.78 790.0 -1.78 790.0 -0.26 -620.0 -0.26 -620.0
2.00 6500.0 1.50 100.0
-0.46 16.1 -0.23 0.0
0.00 4550.0
6.00 16750.0
-6.40 477.0 -0.23 -1013.0
6.00 15900.0 d.00 28040.0 d.00 18000.0
.d.so 2000.0 d.00 0.0 d.00 25140.0
-6.30 28200.0 0.00 0.0 2.00 1000.0 d-00 3650.0
-d-50 0.0 d.00 0.0 0.00 25000.0 0.00 0.0 0.00 10000.0
-d.35 11320.0 -d-44 9680.0 -2.20 0.0
0.00 0.0 d-50 2000.0 6.68 1290.0 0.00 1000 .o 0.00 58000.0 0.50 2000.0 0.68 1290 - 0 0.00 1000.0 0.00 50000.0
0.00 0.00
1000.0 0.0
46

112. N2H2+0=NNH+OH 113. N2H2+OH=NNH'+H20 114. N2H2+NH=NNH+NH2 115. N2H2+NH2=NH3+NNH 116. NH2+NO=NNH+OH 117. NH2+NO=N2+H20 118. NH3+OH=NH2+H20 119. NH3+H=NH2+H2 120. NH3+0=NH2+OH 121. NH3+M=NH2+H+M 122. NNH+NO=N2+HNO 123. NNH+H=N2+H2 124. NNH+OH=N2+H20 125. NNH+NH2=N2+NH3 126. NNH+IWf=N2+NH2 127. HNO+OH=NO+H20 128. H+HNO=H2+NO 129. HNO+NH2=NH3+NO 130. N+NO=N2+0 131. O+NO=N+OZ 132. NO+H=N+OH 133. HNO+HNO=N20+H20 134. N20+NO=N2+N02 135. NO+NO+NO=N20+N02 136. HOCO+M=OH+CO+M 137. CO+NO2=NO+CO2 138. CH+N02=HCO+NO 139. H2+N02=HONO+H 140. NNH=N2+H
Declared duplicate reaction... 141. NNH+M=N2+H+M
Declared duplicate reaction... 142. KNO+NO+NO=KNNO+N02 143. HNNO+NO=NNH+N02 144. HNNO+NO=NZ+HONO 145. HNNO+Ei=H+N20+M- 146. HNNO+M=N2+OH+M 147. HCO+NO=HNO+CO 148. O+CH20<=>OH+HCO 149. O+CH20H<=>OH+CH20 150. O+CH30<=>OH+CH20 151. O+CH30Hc=>OH+CH20H 152. O+CH30Hc=>OH+CH30 153. 02+CH20c=>H02+HCO 154. H+HCO(+M)<=>CH20(+M)
2.000E+13 1.000E+l3 l.OOOE+13 1.000E+13 9.300E+ll 2.000E+20 2.040E+06 5.4203+05 9.4003+06 2.2003+16 2.000E+13 1.000E+14 5.000E+13 S.OOOE+13 5.000E+13 1.2953+07 4.4603+11 2.000E+13 3.2703+12 3.8003+09 1.700E+14 3.6303-03 4.2903+13 1.070E+lO 2.1903+23 9.0403+13 l.OlOE+14 3.210E+12 3.000E+08
0.00 1000.0 0.00 1000.0 0.00 1000.0 0.00 1000.0 0.00 0.0 2.60 924.0 2.04 566.0 2.40 9917.0 1.94 6460.0 0.00 93470.0 0.00 0.0 0.00 0.0 0.00 0.0 0.00 0.0 0.00 0.0 1.88 -958.0 0.72 655.0 0.00 1000.0 0.30 0.0 1.00 41375.0 0.00 48800.0 3.98 1190.0 0.00 47130.0 0.00 26800.0 1.89 35270.0 0.00 33780.0 0.00 0.0 0.00 28810.0 0.00 0.0
l.OOOE+13 0.50 3060.0
1.700E+ll 3.2003+12 2.600E+ll 2.2003+15 l.OOOE+X 7.2303+12 3.9003+13 l.OOOE+13 l.OOOE+13 3.880E+OS 1.300E+05 l.OOOE+14 l.O90E+12
0.00 2100.0 0.00 270.0 0.00 810.0 0.00 21600.0 0.00 25600.0 0.00 0.0 0.00 3540.0 0.00 0.0 0.00 0.0 2.50 3100.0 2.50 5000.0 0.00 40000.0 0.48 -260.0
Low pressure limit: O.l3500E+25 -0.257003+01 O-142503+04 TROE centering: 0.782403+00 0.271003+03 0.275503+04. 0.65700E+04
H2 Enhanced by 2.000E+OO H20 Enhanced by 6.000E+00 co Enhanced by 1.500E+OO co2 Enhanced by 2.000E+OO
155. H+CH20(+M)c=>CH20H(+M) 5.400E+ll 0.45 3600.0
47

Low pressure limit: 0.127003+33 -0.482003+01 0.653003+04 TROE centering: O-718703+00 O.l0300E+03 0.129103+04 O-416003+04
H2 Enhanced by 2.000E+OO H20 Enhanced by 6.000E400 co Enhanced by 1.500E+OO co2 Enhanced by 2.000E+OO
156. H+CH20(+M)<=>CH30(+M) 5.400E+ll 0.45 2600.0 Low pressure limit: 0.220003+31 -0.48000E+Ol 0.556003+04 TROE centering: 0.758003+00 0.940003+02 0.155503+04 O-420003+04
H2 Enhanced by 2.000E+OO H20 " Enhanced by 6.000E+00 co Enhanced by 1.500E+OO co2 Enhanced by 2.000E+OO
157. H+CH20c=>HCO+H2 2.300E+lO 1.05 3275.0 158. H+CH20H(+M)c=>CH30H(+M) 1.800E+13 0.00 0.0
Low pressure limit: 0.300003+32 -0.48000E+Ol 0.330003+04 TROE centering: 0.767903+00 0.338003+03 0.181203+04 0.508103+04
H2 Enhanced by 2.000E+OO H20 Enhanced by 6*000E+00 co Enhanced by l.SOOE+OO co2 Enhanced by 2.000E+OO
159. H+CH20H<=>H2+CH20 2.000E+13 0.00 0.0 160. H+CH30(+M)c=>CH30H(+M) 5.000E+13 0.00 0.0
Low pressure limit: 0.860003+29 -0.40000E+Ol O-302503+04 TROE centering: O-890203+00 O-144003+03 0.283803+04 0.455693+05
H2 Enhanced by 2.000E+OO H20 Enhanced by 6.000E+00 co Enhanced by 1.500E+OO co2 Enhanced by 2.000E+OO
161. H+CH30<=>H+CH20H 3.4003+06 1.60 0.0 162. H+CH30<=>H2+CH20 2.000E+13 0.00 0.0 163. H+CH30Hc=>CH20H+H2 1.700E+07 2.10 4870.0 164. H+CH30H<=>CH30+H2 4.2003+06 2.10 4870.0 165. H2+CO(+M)<=>CH20(+M) 4.3003+07 1.50 79600.0
Low pressure limit: 0.507003+28 -0.342003+01 O-843503+05 TROE centering: O-932003+00 O-197003+03 O-154003+04 0.10300E+05
H2 Enhanced by 2.000E+OO H20 Enhanced by 6.000E+00 co Enhanced by 1.500E+OO co2 .~ Enhanced by 2.000E-tOO
166. OH+CH20<=rHCO+H20 3.4303+09 1.18 -447.0 167. OH+CH20H<=>H20+CH20 f.OOOE+12 0.00 0.0 168. OH+CH30<=>H20+CH20 5.000E+12 0.00 0.0 169. OH+CH30Hc=>CH20H+H20 1.4403+06 2.00 -840.0 170. OH+CH30H<=>CH30+H20 6.3003+06 2.00 1500.0 171. H02+CH20c=>HCO+H202 l.OOOE+12 0.00 8000.0 172. CH+H20c=>H+CH20 1.7133+13 0.00 -755.0 173. CH20H+02<=>HOZ+CH20 1.800E+13 0.00 900.0 174. CH30+02c=>H02+CH20 4.2803-13 7.60 -3530.0 1'75. HCO+HNO=CH20+NO 6 .OOOE+ll 0.00 2000.0 176. CH20+N02=HCO+HONO 8.0203+02 2.77 13730.0 177. HCO+N02=CO+HONO 1.2403+23 -3.29 2355.0 178. HCO+N02=H+C02+NO 8.3903+15 -0.75 1930.0
4x

Note: Units for the rate parameters are centimeter, second, and mole, and for E, Cal/mole. For
reactions followed by three numerical parameters, the rate-coefficient expression is
k = ATbexp(-ERT). For reactions which appear twice with the phrase “declared duplicate
reaction . . ..‘I the rate coefficient is computed as the sum of the two three-parameter expressions- For
reactions involving a generalized collider species, M, collider efficiencies other than 1.0 are
specified. For reactions involving pressure-dependent rate expressions (those with a collider species
specified as [+M]), three types of expression are used. If “T&H VALUE” occurs in the output, the
Tsang and Herron form was used (as described in Tsang and Herron*‘), with constants a~ and ai (if
the latter is used) appearing, respectively, on the same line. A version of CHEMKIN, modified at
ARL, was used for this computation. If “TROE centering:” occurs, the TROE form was used with
the appropriate parameters specified on that line. If neither of these is mentioned, the Lindemann
form was assumed. Descriptions of the TROE and Lindemann expressions may be found in the
CHEMKIN manual2
T Note that the log expressions used in this source are for base 10 (W. Tsang, private communication). Tsang, W., and J. T. Herron. “Chemical Kinetic Data Base for Propellant Combustion I Reactions Involving NO, NOZ, HIJO, HN02, HCN, and NzO.” Journal ofPhysical and Chemical Refirence Data, vol. 20, p. 609-663, 1991.
’ Kee, R. J., F. M. Rupley, and J. A. Miller. “Chemkin-II: A Fortran Chemical Kinetics Package for the Analysis of Gas-Phase Chemical Kinetics.” Sandia National Laboratories Report SAND89-8009, September 1989.
49

INTJSTIONALLYLEFTBLANK.
50

NO. OF ORGANIZATION COPIES
NO. OF COPIES ORGANIZATION
2 DEFENSE TECHNICAL INFORMATION CENTER DTIC DDA 8725 JOHN J KINGMAN RD STE 0944 FT BELVOIR VA 22060-62 18
1 HQDA DAM0 FDT 400 ARMY PENTAGON WASHINGTON DC 203 1 O-0460
1 OSD OUSD(A&T)/ODDDR&E(R) RJTREW THE PENTAGON WASHINGTON DC 20301-7100
1 DPTY CG FOR RDA US ARMY MATERIEL CMD AMCRDA 5001 EISENHOWER AVE ALEXANDRIA VA 22333-0001
1 JNST FOR ADVNCD TCHNLGY THE UNIV OF TEXAS AT AUSTIN PO BOX 202797 AUSTIN TX 78720-2797
1 DARPA BKASPAR * 3701 N FAIRFAX DR ARLINGTON VA 22203-1714
1 US MILITARY ACADEMY MATH SC1 C-JR OF EXCELLENCE MADNMATH MAJ HUBER THAYERHALL WEST POINT NY 10996-1786.
1 DIRECTOR US ARMY RESEARCH LAB AMSRL DD 2800 POWDER MILL RD ADELPHI MD 20783- 1197
1 DIRECTOR US ARMY RESEARCH LAB AMSRL CI AI R (RECORDS MGMT) 2800 POWDER MILL RD ADELPHI MD 20783-l 145
3 DIRECTOR US ARMY RESEARCH LAB AMSRL CI LL 2800 POWDER MILL RD ADELPHI MD 20783-l 145
1 DIRECTOR US ARMY RESEARCH LAB AMSRL CI Ap 2 800 POWDER MILL RD ADELPHI MD 20783-l 197
ABERDEEN PROVING GROUND
4 DlRUSARL AMSRL CI LP (BLDG 305)
1 DIRECTOR US ARMY RESEARCH LAB AMSRL D DRSMITH 2800 POWDER MILL R.D ADELPHI MD 20783-l 197
51

NO. OF COPIES ORGANIZATION
ABERDEEN PROVING GROUND
20 DIR USARL AMSRL WM BD
B E FORCH W R ANDERSON SWBUNTE C F CHABALOWSKI A COHEN R DANIEL D DEVYNCK R A FIFER BEHOMAN A J KOTLAR K L MCNESBY M MCQUAID M S MILLER A W MIZIOLEK J B MORRIS R A PESCE-RODRIGUEZ BMRICE R C SAUSA M A SCHROEDER J A VANDERHOFF
52

Approved for public release; diseibution is unlimited.
19. ABsrRAcrfMRdu4m 0oD-m The application of complex networks of elementary chemical reactions to the gas phase of burning energetic
mater& has increased mark@ly over the last decade. The exquisite complexity of these gas-phase reaction networks xx~pled with available high-rigor treapnents of msport, is not matched by an equivalent level of sophistication im aesaiptions 0f the condensed-phase and interfacial phenomena Owing to the vastly more complicated, many-l@ nature of the condensed phase, this condition is not likely to be relieved soon. In response to these difkulties, a neu semi-empirical approach to burning-rate calculation has ken developed and applied to frozen ozone zyclo&imethyl~tramine (RDX), and nitroglycerine. The new approach hypothesizes a single ovemll nztctiom linking the ururzted mat&al to the net products of condensed-phase decomposition and characterizes their rate 01 formation acEording to an empirically derived pyrolysis law. These condensed-phase products become the reactanti for the gas phase, which are treated in full elementary-reaction detail. Using this new semi-empirical mcukl, e methodology for computing the relative effects of several additives on the burning rate of nitroglyckne is developec and demonstrated. Hopefuuy this approach will enable more rapid pro-s in modeling multi-ingredient propellantr than did previous approaches attempting to model the condensed-phase processes in detail.
14. SuBJEcrTERm
modeling, energetic mate&Is, propellant, combustion 16. NUMBER W PAQEB
49 16. PRlcE COEIE
17. SECURllv cusauwAllcN 16. SEUJRlTY ClAsslFlcATlON 19. sEcuRrrY cus6JFlcAnoN 20. UYITATION OF ABSTRACT OFREPORT OFTH18PAoE OFA-
UNCLASSIFIED UNCLASSIFIED UNCLASSIFIED UL

INTENTIONALLYLEFTBLANK.
54

USER EVALUATION SHEET/CHANGE OF ADDRESS
This Laboratory undertakes a continuing effort to improve the quality of the reports it publishes. Your comments/answers to the items/questions below will aid us in our efforts.
1. ARL Report Number/Author ARL-TR-2390 (Miller) Date of Report February 2001
2. Date Report Received
.t 3. Does this report satisfy a need? (Comment on purpose, related project, or other area of interest for which the report will be
used.)
4. Specifically, how is the report being used? (Information source, design data, procedure, source of ideas, etc.)
5. Has the information in this report led to any quantitative savings as far as man-hours or dollars saved, operating costs avoided, or efficiencies achieved, etc? If so, please elaborate.
6. General Commenti. What do you think should be changed to improve future reports? (Indicate changes to organization, technical content, format, etc.)
CURRENT ADDRESS
Organization
Name E-mail Name
Street or P.O. Box No.
City, State, Zip Code
7. If indicating a Change of Address or Address Correction, please provide the Current or Correct address above and the Old or
Incorrect address below.
m OLD
Organization
Name ADDRESS
Street or P.O. Box No.
City, State, Zip Code
(Remove this sheet, fold as indicated, tape closed, and mail.) (DO NOT STAPLE)

DEPARTMENT OFTHE ARMY
OFFlClAL BUSINESS
MAIL FIRST CLASS PERMIT NO 0001 ,APG,MD I POSTAGE WILL BE PAID BY ADDRESSEE
DIRECTOR US-ARMY RESEARCH LABORATORY ATTN AMSRL WM BD ABERDEEN PROVING GROUND MD 210054066
NO POSTAGE NECESSARY r IF MAILED
IN THE UNITED STATES