a big data mapreduce framework for fault diagnosis … university institutional repository a big...
TRANSCRIPT
Loughborough UniversityInstitutional Repository
A big data MapReduceframework for fault
diagnosis in cloud-basedmanufacturing
This item was submitted to Loughborough University's Institutional Repositoryby the/an author.
Citation: KUMAR, A. ...et al., 2016. A big data MapReduce framework forfault diagnosis in cloud-based manufacturing. International Journal of Produc-tion Research, 54(23), pp. 7060-7073.
Additional Information:
• This is an Accepted Manuscript of an article publishedby Taylor & Francis in International Journal of Pro-duction Research on 4th March 2016, available online:http://www.tandfonline.com/10.1080/00207543.2016.1153166.
Metadata Record: https://dspace.lboro.ac.uk/2134/23087
Version: Accepted for publication
Publisher: c© Taylor & Francis
Rights: This work is made available according to the conditions of the Cre-ative Commons Attribution-NonCommercial-NoDerivatives 4.0 International(CC BY-NC-ND 4.0) licence. Full details of this licence are available at:https://creativecommons.org/licenses/by-nc-nd/4.0/
Please cite the published version.
A Big Data MapReduce Framework for Fault Diagnosis in Cloud-based Manufacturing
Ajay Kumara, Ravi Shankarb* , Alok Choudharyc ,Lakshman S. Thakurd
Abstract
This research develops a MapReduce framework for automatic pattern recognition based on fault
diagnosis by solving data imbalance problem in a cloud-based manufacturing (CBM). Fault diagnosis
in a CBM system significantly contributes to reduce the product testing cost and enhances
manufacturing quality. One of the major challenges facing the big data analytics in cloud-based
manufacturing is handling of datasets, which are highly imbalanced in nature due to poor
classification result when machine learning techniques are applied on such datasets. The framework
proposed in this research uses a hybrid approach to deal with big dataset for smarter decisions.
Furthermore, we compare the performance of radial basis function based Support Vector Machine
classifier with standard techniques. Our findings suggest that the most important task in cloud-based
manufacturing, is to predict the effect of data errors on quality due to highly imbalance unstructured
dataset. The proposed framework is an original contribution to the body of literature, where our
proposed MapReduce framework has been used for fault detection by managing data imbalance
problem appropriately and relating it to firm’s profit function. The experimental results are validated
using a case study of steel plate manufacturing fault diagnosis, with crucial performance matrices
such as accuracy, specificity and sensitivity. A comparative study shows that the methods used in the
proposed framework outperform the traditional ones.
Keywords- big data analytics, class imbalance problem, radial basis function, support vector machine
(SVM), fault diagnosis and cloud-based manufacturing.
aBharti School of Telecommunication Technology & Management, Indian Institute of Technology Delhi, India bDepartment of Management Studies, Indian Institute of Technology Delhi, India cManagement Science and Operations Management Group, School of Business and Economics, Loughborough University, Leicestershire, UK dOperations and Information Management Department, School of Business, University of Connecticut, Storrs, CT, USA *Communicating author: [email protected]
1. Introduction
The growing implementation of lean and six sigma programs has made a significant impact
on the manufacturing industries in the last two decades. The manufacturers have witnessed
tremendous improvements in the product quality and yield, in addition to reduction in product
variability and waste through these programs. However, some variability is inevitable despite
the implementation of lean techniques in most of the processing environments such as
chemicals, pharmaceuticals, telecommunication and manufacturing of heavy equipment. In
manufacturing environment, the Internet of Things (IOT) describes a virtual world where our
day-to-day objects are embedded with sensors and radio tags, which make these objects
accessible via a network as well as via transmitting of real-time data using internet. Although
RFID tags are most favoured among the wireless transfer techniques, however several other
tagging technologies such as barcodes, QR codes, Near Field Communication (NFC) and
digital watermarking are extensively used in manufacturing. The implementation of such
techniques in product and process identification generate large amount of data on a daily
basis, resulting in large data sets. These data sets have a huge potential for generating
knowledge to help in manufacturing decision making. For example Andreadis (2015)
proposed a framework, which combines social media data with live streaming process to
optimize the computer aided design process of a product. His framework used the opinions of
potential customers and Computer-Aided Manufacturing (CAM) for the selection of cutting
conditions while learning from the experience of external expert technicians at the same time.
Fault diagnosis in a manufacturing process is a practical and prevalent situation- in which the
issue of class-imbalance is highly applicable. Condition-based maintenance techniques on
such datasets do not work properly and as a result it is difficult to build reliable models for
accurate fault diagnosis. Generally, most traditional machine learning algorithms would
produce poor classification when applied to such highly imbalanced datasets. Owing to
intricacies involved in the production activities in manufacturing industries, manufacturers
have to resort to more granular methods, such as advanced analytics to critically examine and
correct process flows to improve product yield.
Advanced analytics deals with the application of statistical and other mathematical tools to
scrutinize available business data leading to improved manufacturing practices that may
significantly enhance productivity. In the context of the use of data mining techniques in
manufacturing industry, pattern recognition and automated inspection come under the
inspection category (Tiwari and Vidyarthi 2000; Lee and Lapira 2013; Lee et al. 2013;
Choudhury et al. 2014; Tsai and Huang 2015). Analysis of Variance (ANOVA), regression
analysis, classification and clustering have been frequently used for analysis of quality
control data in manufacturing sector. Statistical process control charts and principal
component analysis are used for quality monitoring, replacement analysis and clustering of
customer warranty data. However, one of the major emerging problems is the growing size
and types of data in manufacturing environment and the inability of typical database tools to
analyse these large data sets. It is generally not possible to analyse the big datasets with the
help of simple traditional database tools and techniques.
One of the major challenges of large datasets is how to handle data imbalance problem. Most
of the existing machine learning techniques work best when many instances of each classes
are approximately equal. When a number of instances of one class far exceed the other class
the problem arises in classification due to this data imbalance. Data imbalance problem arises
when the total number of instances of positive classes of data is far less than the total number
of instances of negative classes of data. To solve this problem, a solution would be needed to
identify patterns and relationships among different steps during the manufacturing process
with which we can optimize the set of factors that have the utmost effect on the yield. Big
data and advanced analytics have now allowed manufacturers to monitor product quality as
well as delivery accuracy in real-time, enabling them to prioritize time sensitive orders for
improved delivery (Rajagopal and Anand, 1999; Choudhury, Shankar and Tiwari 2006). Real
time monitoring using machine based sensors allows manufacturers to better understand
product usage, routine maintenance requirements and even assess product’s life. The three
main areas where the use of big data can drastically benefit manufacturing industry include
better forecasts of product demand, valuable information about plant performance across
diverse metrics and quicker service and operational support to customers.
Cloud-based Manufacturing (CBM) is a recent development in manufacturing system
which is developed from existing manufacturing models and enterprise
information system under the support of cloud computing, virtualization and Internet of
Things (IoT). IoT works towards improving manufacturing process, customer experience and
energy efficiency (Li et al. 2010). Manufacturing companies have started using this paradigm
for reconfiguring the production lines for enhancing the efficiency, reducing the product
lifecycle costs and facilitating optimal resource allocation. CBM refers to a decentralized and
networked manufacturing model based on enabling technologies such as cloud computing
(software as a service (SAS), platform as a service (PAS) and technology as a service (TAS)),
IoT and service-oriented architecture (SOA). All of these are the backbone of this new
paradigm (Xu 2012; Wu et al. 2015).
In most of the above mentioned applications, IoT offers practical solutions to the related
manufacturing industry problems (Kumar et al. 2005; Ravi, Shankar and Tiwari 2005;
Khilwani et al. 2007). Dutta et al. (2013) identified a set of 39 cloud computing risks, which
concentrated around diverse operational, organisational, technical, and legal areas. These
risks can be used by business managers and IT experts, as a checklist for risk exploration,
management and their control or prevention in cloud adoption. Various real-life areas such as
health care, pharmaceuticals, telecommunications and financial trades generate enormous
amounts of data. The foremost challenge for big data analytics in cloud manufacturing or
virtual manufacturing is the smart handling of the vast amount of data that is highly
asymmetric in nature.
The class imbalance problem is recognized as an important topic in machine learning
research. Several methods such as resizing the training set that involves oversampling of
minority class samples and downsizing the majority class samples have been used to deal
with imbalanced dataset problems. To deal with the issue of classification of imbalanced
datasets, several approaches have been proposed. These approaches can be categorized into
two groups: Data sampling solutions that modify the original training set, and algorithmic
modifications that modify the algorithms (Wang and Japkowicz 2008; Fernandes et al. 2013).
Several methodologies have been suggested to deal with the problems of standard learning as
well as for ensemble techniques such as data sampling, algorithmic modification, cost-
sensitive learning etc., in the existing body of literature (He and Garcia 2009; Larose 2005).
Major weaknesses of these methodologies are difficulty in finding an optimal separating
hyperplane that correctly classifies data points as much as possible and separates the points of
two classes as far as possible, by minimizing the risk of misclassifying the training samples.
While these methods work with highly imbalanced datasets having ratios of 100 to 1 or more,
the hyperplane classifies every instance as negative and all positive instances can be ignored
completely by the classifier due to treated as noise.
In this research, we propose a framework for automatic pattern recognition based fault
diagnosis by meeting the challenge posed by data imbalance problem that exists in big
datasets using RHadoop programming environment. Fault diagnosis in a manufacturing
process is a practical instance in which issue of class-imbalance is highly applicable. Majority
of the collected data from system will exhibit the normal operating behaviour while faulty
operating behaviour is limited. Condition-based maintenance techniques on such datasets do
not work properly and as a result it is difficult to build reliable models for the accurate fault
diagnosis. To solve this problem, in the first phase of our proposed framework, we analyse
several techniques to deal with data imbalance problem and then a combined radial basis
kernel SVM and Synthetic Minority Over-sampling TEchnique (SMOTE) classifier is used to
solve the big data imbalance problem. Furthermore, performance of this method is compared
with traditional data imbalance solver techniques like under-sampling, SMOTE and over-
sampling. In second phase of this framework, target value of dataset is replaced by SVM
classifier output leading the dataset then to become balanced in nature. In third and last
phase, the modified dataset is used to train the logistic regression for automatic pattern
recognition and to predict the faults using a steel plate manufacturing dataset in RHadoop
programming environment.
This paper is organized as follows: Section 2 discusses the data imbalance handling
techniques and identifies existing research gaps by reviewing relevant literature in addition to
the motivation for the proposed framework. Section 3 provides the description of radial basis
kernel SVM based classifier, MapReduce programming and alternative measures of data
imbalance, which have been adapted in our proposed framework. Section 4 presents the
proposed framework, selection of input/output, datasets for logistic regression using
RHadoop integration. Results are presented in Section 5. The final section discusses the
implications of this study and provides concluding remarks.
2. Literature Review A trustworthy data is very essential for delivering the high quality manufactured products. In
a cloud-based manufacturing environment, any delay or mistake in production process due to
great data interconnectivity could lead to major problems in other areas of manufacturing.
CBM requires an infrastructure for their adequate transmission between different
workstations at all time during manufacturing process which needs assurance for reliable and
correct data. Lee, Bagheri and Kao (2015) have proposed a concept of transforming
manufacturing industry to the next generation using Cyber-Physical Systems (CPS) in which
the requirements of information from all perspectives is closely monitored and then
synchronized between physical factory floor and cyber computational space. Simani and
Fantuzzi (2000) proposed a neural network based automatic faults diagnosis method to test a
power plant dataset. Lo et al. (2002) used the qualitative bond graphs method integrated with
genetic algorithm for solving the problem of fault diagnosis.
Kumar et al. (2006) used the SVM method for quality control by using kernel distance in
SVM. Result showed when quality characteristics are not multivariate normal then
hyperplane is less sensitive to the noise and outliers for designing the quality control charts.
Dong et al. (2008) proposed a method based on rough set theory and wavelet neural network
to predict the power transformers’ faults. Mishra et al. (2009) proposed a probabilistic casual
model for predicting the automatic fault diagnosis. In this research, rollout strategy-based
probabilistic causal model (RSPCM) has been proposed to solve the graph-based multiple
fault diagnosis problems but the main drawback of the proposed algorithm is that it is able to
diagnose only those faults in dataset which have prior probabilistic knowledge. Lau et al.
(2010) developed a neuro–fuzzy inference system in gas phase polypropylene manufacturing
process for predicting the online faults using ANN. Deng, Lin and Chang (2011) have used
the multiclass SVM for fault diagnosis in the field of air defence gun. Eslamloueyan (2011)
proposed a neural network based method for predicting the faults of Tennessee–Eastman
process. Wang et al. (2015) proposed an approach for predicting the failure time with
degradation sequence of mechanical devices by combining exponential regression method
and parametric empirical Bayesian (PEB) technique. However, all these researchers have
used the traditional data mining techniques for predicting the faults on small and balanced
datasets. They did not apply any approach, which deals with the issue of classification of
imbalanced dataset. With an explosive growth of data and emergence of big data in the
current manufacturing environment, extraction of interesting knowledge from the vast
amounts of data has become a challenge since the traditional data mining techniques are not
suitably adaptable to the new space and time constraints. The scope of this research is to
focus on training the machine learning algorithm for automatic pattern recognition and fault
diagnosis by managing the imbalance data set problem.
Kubat and Matwin (1997) developed a concept based on selective under-sampling, which did
not consider the minority samples. They introduced a data cleaning procedure and removed
borderline majority samples using Tomek-Links theory for under-sampling. Chawla et al.
(2002) proposed another popular re-sampling approach: SMOTE (Synthetic Minority Over-
sampling TEchnique), in which rather than over-sampling by replacement, artificial samples
are generated. This approach creates a new sample for each minority class sample, on the line
joining it to its nearest minority class neighbour. To compensate the imbalance in training
samples, Barendela et al. (2003) proposed a weighted distance function in the classification
phase of k-NN (K-Nearest Neighbour). Batista, Monard and Bazzan (2004) proposed two
hybrid sampling techniques 1) SMOTE and Tomek-Links and 2) SMOTE and ENN (Edited
Nearest Neighbour). Japkowicz and Jo (2004) put forward a clusters based over-sampling
approach, in which the majority and the minority class samples are first clustered and then
majority class clusters are over-sampled for obtaining the largest cluster. Guo and Viktor
(2004) proposed a boosting method with several over-sampling techniques and concluded
that the boosting approach enhances the prediction accuracy of the classifier. Huang et al.
(2004) also presented a Biases Minimax Probability Machine to resolve the class imbalance
problem. Han, Wang and Mao (2005) proposed a borderline SMOTE, only technique that
involves over-sampling the borderline minority samples prior to the application of SMOTE.
Wang and Japkowicz (2008) also proposed a boosting algorithm in conjunction with SVM,
which increased minority class prediction in comparison to traditional SVM. Other widely
used methods for solving the imbalanced data problems include bagging and boosting based
ensemble methods (Chawla et al. 2004; Hido, Kashima and Takahashi 2009; Batuwita and
Palade 2012). Liu, Wu and Zhou (2009) also proposed a double ensemble classifier that
involves bagging and boosting. In their study, EasyEnsemble and BalanceCascade used
bagging in the first ensemble and later on for each bag AdaBoost was also used. To improve
the classification performance in imbalanced datasets, Seiffert et al. (2010) combined
sampling and ensemble techniques, RUSBoost (Random Under Sampling with Boosting).
Nonetheless, they concluded that making the dataset completely balanced results in inferior
performance than having the imbalanced one. Farquad and Bose (2012) proposed a support
vector machine (SVM) based approach to deal with class imbalance problem and proved that
SVM can be used for reducing the noise in training data.
All above methods produce some unexpected problems when dealing with class imbalance
problems. For example, under-sampling may eliminate some minority class data which is
potentially very important for learning process. Over-sampling method may increase the
probability of overfitting while dealing the imbalanced dataset. Furthermore, all ensemble
methods based on Boosting and Bagging might abandon some useful data because they use
sampling methods to obtain the balanced data in each iteration so they might suffer from
overfitting as well. All these methods would perturb original class distribution of this data
either adding the minority class or deleting the majority class instances. For the cost-sensitive
learning methods like EasyEnsemble, BalanceCascade and RUSBoost it is very difficult to
get the accurate misclassification cost. If classification results are not stable then different
misclassification cost gives different induction results.
Farquad, Ravi and Raju (2014) used a hybrid approach based on balanced data for churn
prediction using Naive bayesian classifier. Barua et al. (2014) proposed a novel over-
sampling method for hard to classify samples that involved identification of the most
informative minority class samples. In this method, weights were assigned to each minority
sample in accordance with their distance from the majority class samples, and then using
these, weighted samples synthetic samples were generated. However, the above-mentioned
methods may not deliver desired performance while dealing with class imbalance problems.
For example, methods involving under-sampling may omit some valuable data that could be
crucial for a learning process, whereas methods involving over-sampling may enhance the
likelihood of over-fitting during the induction process. Moreover, ensemble methods
involving bagging and boosting might also exclude some useful data during sampling in
order to acquire balance data else may lead to over-fitting in the training process. Hence,
these two kinds of methods would perturb the original class distribution of the imbalanced
data either by deleting the majority class instances or by adding the minority class instances.
Rio et al. (2014) analyse the performance of different techniques to deal with imbalanced
dataset using random forest classifier and MapReduce programming environment.
Previously we have discussed that separating hyperplane of a SVM model, which is
developed with the imbalanced dataset can be skewed towards minority class and generally
this skewness can play an important role for degrading the performance of this model. When
we want to apply highly effective detection ability on the objective function of SVM for only
one class such as credit card fraud detection problem or diagnosing a disease, we are not able
to give a measure of the detection ability of a separating hyperplane. The standard algorithms,
e.g. Adaboost, BalanceCascade and RUSBoost increase the weights of misclassified
instances and decrease correctly classified using the same proportion, without considering the
imbalance of the dataset. Thus, traditional boosting algorithms do not perform well on the
minority class. Our proposed hybrid approach SMOTE+ SVM is quite different from all
conventional data imbalance methods because it handles the class imbalance problems by
converting imbalanced binary learning process into multiple balanced learning processes and
does not change the original data class distribution. The first part of this hybrid approach
focuses on maximizing the margin and the second part attempts to minimize the penalty term
which corresponds to misclassifications.
The proposed method is based on hybrid SMOTE and radial basis function based kernel
SVM approach, which is further modified using R-Hadoop integration especially to deal with
imbalanced datasets and to make it applicable to big data analytics simultaneously.
3. Approaches to deal with imbalance problem
This section discusses different approaches adopted in this research to deal with imbalance
problem. In addition, it also provides some contextual information regarding Big Data and
Hadoop MapReduce Programming Framework environment.
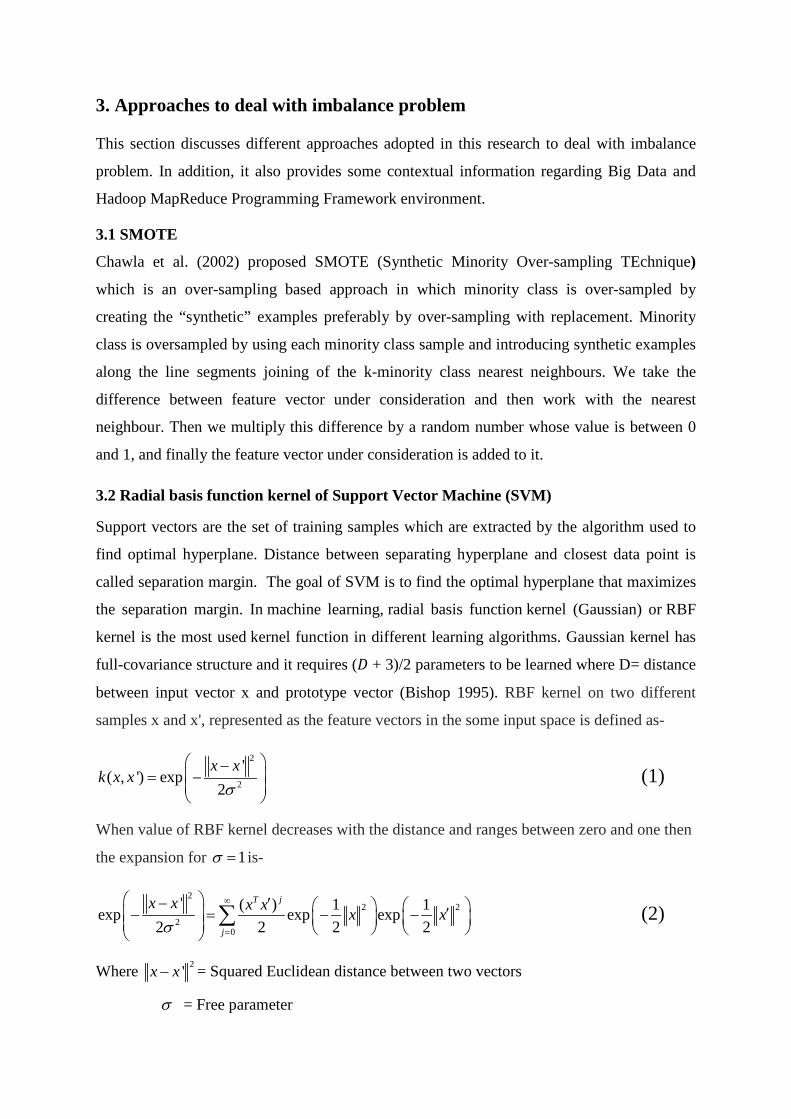
3.1 SMOTE
Chawla et al. (2002) proposed SMOTE (Synthetic Minority Over-sampling TEchnique)
which is an over-sampling based approach in which minority class is over-sampled by
creating the “synthetic” examples preferably by over-sampling with replacement. Minority
class is oversampled by using each minority class sample and introducing synthetic examples
along the line segments joining of the k-minority class nearest neighbours. We take the
difference between feature vector under consideration and then work with the nearest
neighbour. Then we multiply this difference by a random number whose value is between 0
and 1, and finally the feature vector under consideration is added to it.
3.2 Radial basis function kernel of Support Vector Machine (SVM)
Support vectors are the set of training samples which are extracted by the algorithm used to
find optimal hyperplane. Distance between separating hyperplane and closest data point is
called separation margin. The goal of SVM is to find the optimal hyperplane that maximizes
the separation margin. In machine learning, radial basis function kernel (Gaussian) or RBF
kernel is the most used kernel function in different learning algorithms. Gaussian kernel has
full-covariance structure and it requires (𝐷𝐷 + 3)/2 parameters to be learned where D= distance
between input vector x and prototype vector (Bishop 1995). RBF kernel on two different
samples x and x', represented as the feature vectors in the some input space is defined as-
2
2
'( , ') exp
2x x
k x xσ
−= −
(1)
When value of RBF kernel decreases with the distance and ranges between zero and one then
the expansion for 1σ = is-
22 2
20
' ( ) 1 1exp exp exp2 2 2 2
T j
j
x x x x x xσ
∞
=
− ′ ′ − = − − ∑ (2)
Where 2'x x− = Squared Euclidean distance between two vectors
σ = Free parameter

3.3 Big Data, Hadoop MapReduce Programming Framework
3.3.1 Big Data
When a dataset becomes so large that there is no possibility to analyse, process and visualize
this dataset with the help of simple database tools then the dataset becomes big data. Big data
can be characterized by the following 5Vs of data: Volume, Variety, Velocity, Variability and
Veracity.
Volume is the size of data which determines the value and potential of the data in Exabyte,
Yottabyte and Zettabyte.
Variety can be either structured, semi-structured or unstructured in nature depending upon
collection of datasets.
Velocity - Velocity refers to the speed of generation of data or how fast datasets are
generated and processed to meet the challenges and demands of the environment.
Variability - Variability refers to inconsistency which may be exhibited by the data at times
requiring more care in handling and managing data effectively.
Veracity – Veracity refers to the correctness/quality of data. The quality of the data being
captured can vary greatly. Accuracy of analysis depends on the veracity of the source data.
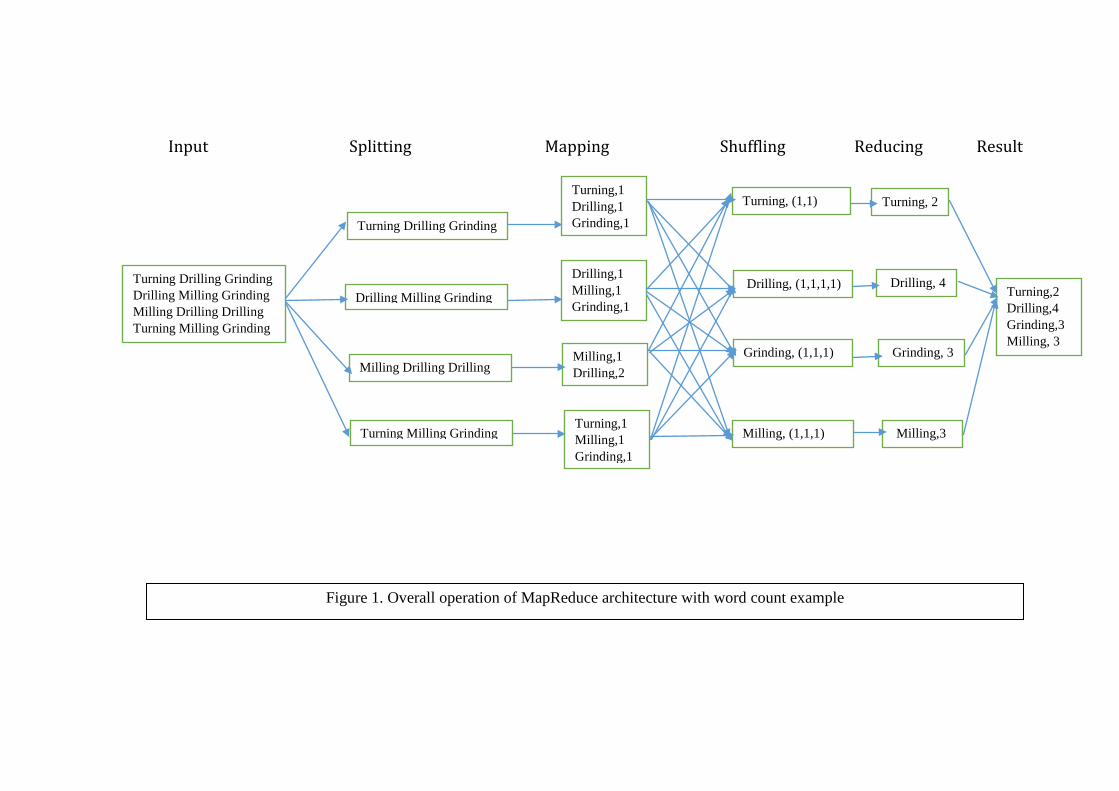
3.3.2 MapReduce framework for training
In this section, we describe MapReduce framework for taking a simple example of word
count big data classification. Figure 1 shows, the MapReduce framework based on word
count classification system, which consists of six important functions: input, splitting,
mapping, shuffling reducing and result. The overall operation of map-reduce architecture is
given by
Datasets → Splitting → Mapping → Shuffling → Reducing → Result
A big dataset is firstly divided into number of subsets which contains many attributes.
Generally, map phase is written by the user. It takes an input pair and generates the set of
intermediate key/value pairs. From the logic perspective, all data is treated as a Key (K) and
Value (V) pair. A Hadoop cluster is specifically designed for storing and analysing large
amount of unstructured data. A Hadoop cluster distributes the data analysis workload across

multiple cluster nodes that work to process the data in parallel way. The reason why Hadoop
is well suited to this type of data is because Hadoop works by breaking the data into pieces
and assigning each "piece" to a specific cluster node for analysis. Another benefit to Hadoop
clusters is scalability and cost. When a piece of data is sent to a node for analysis, the data is
also replicated to other cluster nodes. That way, if a node fails, additional copies of the node's
data exist elsewhere in the cluster, and the data can still be analysed. We can understand the
MapReduce process of word count program as shown in figure 1.
Input Splitting Mapping Shuffling Reducing Result
Figure 1. Overall operation of MapReduce architecture with word count example
Drilling Milling Grinding
Milling Drilling Drilling
Drilling,1 Milling,1 Grinding,1
Milling,1 Drilling,2
Drilling, (1,1,1,1)
Grinding, (1,1,1)
Drilling, 4
Grinding, 3
Turning Drilling Grinding Drilling Milling Grinding Milling Drilling Drilling Turning Milling Grinding
Turning Drilling Grinding
Turning Milling Grinding
Turning,1 Drilling,1 Grinding,1
Turning,1 Milling,1 Grinding,1
Turning, (1,1)
Milling, (1,1,1)
Turning, 2
Milling,3
Turning,2 Drilling,4 Grinding,3 Milling, 3
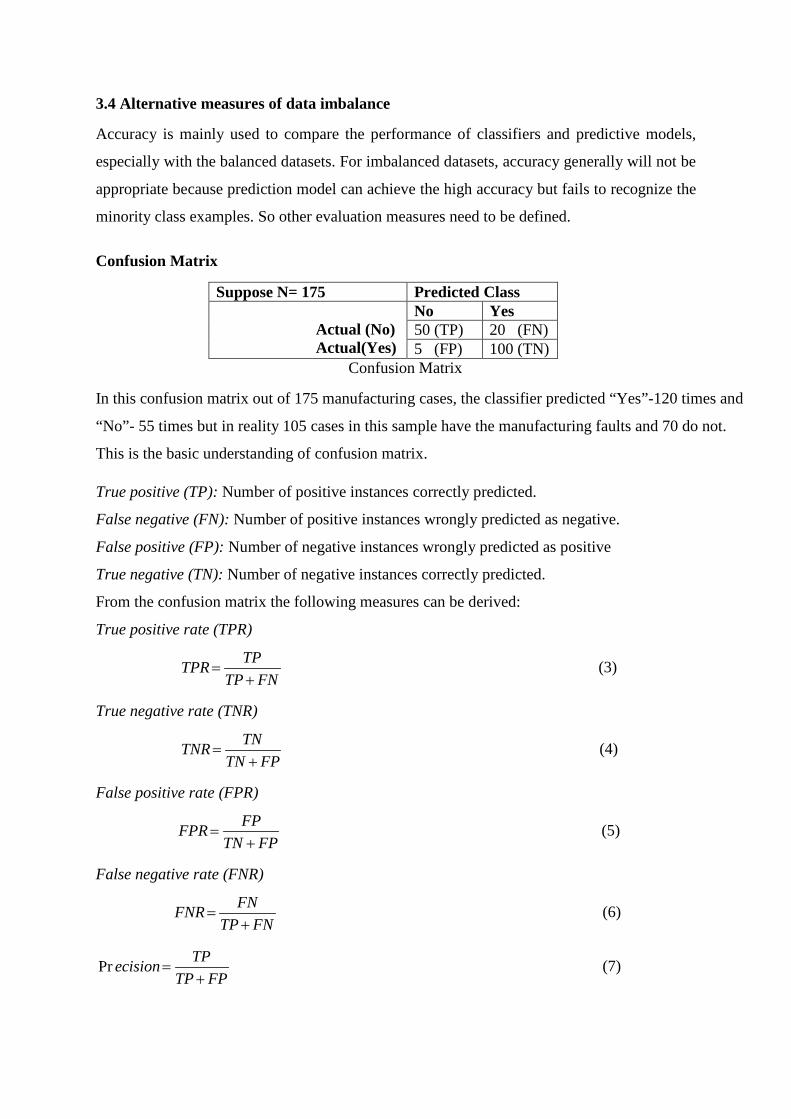
3.4 Alternative measures of data imbalance
Accuracy is mainly used to compare the performance of classifiers and predictive models,
especially with the balanced datasets. For imbalanced datasets, accuracy generally will not be
appropriate because prediction model can achieve the high accuracy but fails to recognize the
minority class examples. So other evaluation measures need to be defined.
Confusion Matrix
Suppose N= 175 Predicted Class Actual (No) Actual(Yes)
No Yes 50 (TP) 20 (FN) 5 (FP) 100 (TN)
Confusion Matrix
In this confusion matrix out of 175 manufacturing cases, the classifier predicted “Yes”-120 times and
“No”- 55 times but in reality 105 cases in this sample have the manufacturing faults and 70 do not.
This is the basic understanding of confusion matrix.
True positive (TP): Number of positive instances correctly predicted.
False negative (FN): Number of positive instances wrongly predicted as negative.
False positive (FP): Number of negative instances wrongly predicted as positive
True negative (TN): Number of negative instances correctly predicted.
From the confusion matrix the following measures can be derived:
True positive rate (TPR)
TPTPRTP FN
=+
(3)
True negative rate (TNR)
TNTNRTN FP
=+
(4)
False positive rate (FPR)
FPFPRTN FP
=+
(5)
False negative rate (FNR)
FNFNRTP FN
=+
(6)
Pr TPecisionTP FP
=+
(7)
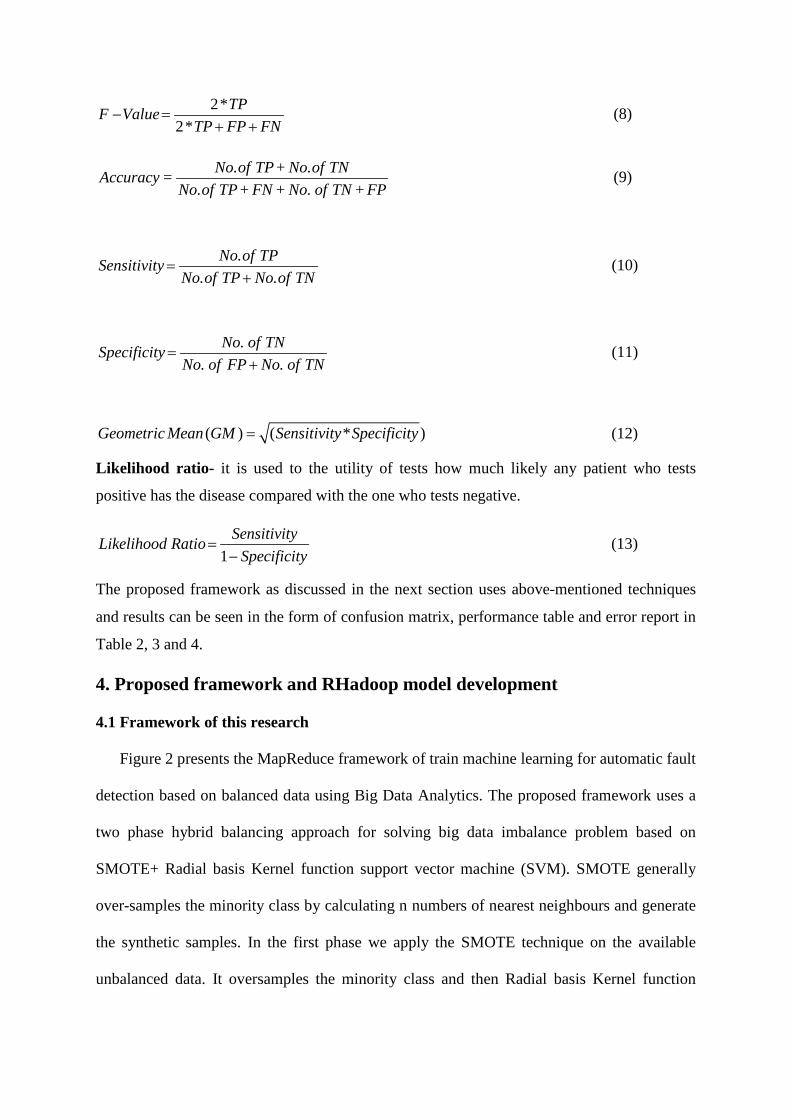
2*2*
TPF ValueTP FP FN
− =+ +
(8)
No.of TP+ No.of TNAccuracy =
No.of TP+ FN + No. of TN +FP (9)
.. .
No of TPSensitivityNo of TP No of TN
=+
(10)
.. .
No of TNSpecificityNo of FP No of TN
=+
(11)
( ) ( * )Geometric Mean GM Sensitivity Specificity= (12)
Likelihood ratio- it is used to the utility of tests how much likely any patient who tests
positive has the disease compared with the one who tests negative.
1SensitivityLikelihood Ratio
Specificity=
− (13)
The proposed framework as discussed in the next section uses above-mentioned techniques
and results can be seen in the form of confusion matrix, performance table and error report in
Table 2, 3 and 4.
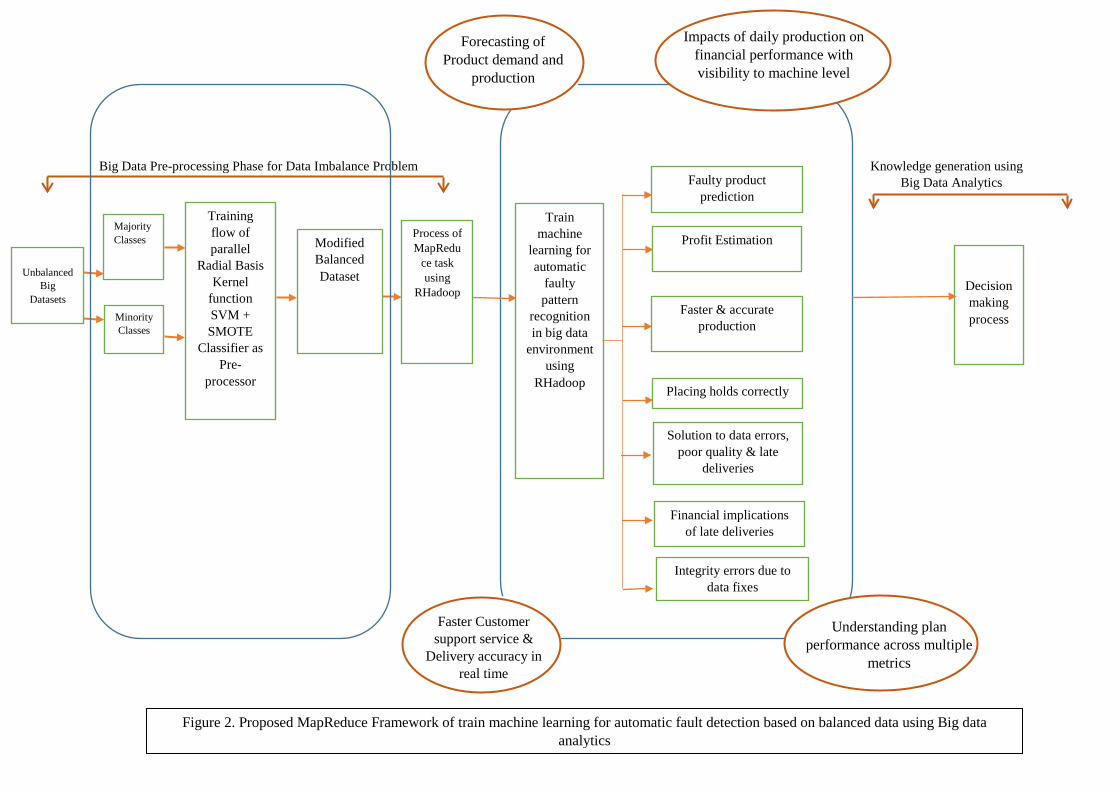
4. Proposed framework and RHadoop model development 4.1 Framework of this research Figure 2 presents the MapReduce framework of train machine learning for automatic fault
detection based on balanced data using Big Data Analytics. The proposed framework uses a
two phase hybrid balancing approach for solving big data imbalance problem based on
SMOTE+ Radial basis Kernel function support vector machine (SVM). SMOTE generally
over-samples the minority class by calculating n numbers of nearest neighbours and generate
the synthetic samples. In the first phase we apply the SMOTE technique on the available
unbalanced data. It oversamples the minority class and then Radial basis Kernel function

support vector machine (SVM) is trained with best prediction accuracy. In the second phase
we replace the target value in the unbalanced dataset by the predicted value of trained Radial
basis Kernel function SVM then available unbalanced data is modified and we obtain the
balanced data. Now we use this balanced data to train the machine learning for automatic
fault pattern recognition on a case study based on steel plate manufacturing dataset.
According to the existing situation analytics manager can add some more needed dimensions
in the balanced dataset and then manufacturing industries can use this dataset for making
better forecasts of product demand and supply, valuable information about plant performance
across diverse metrics and providing quicker service and operational support to customers.
4.2 Benefits of Big Data Analytics framework
LNS Research and MESA International completed a survey in 2014 to see the role of big data
for improving the manufacturing performance. The findings of this survey are- Better
forecasting of production and product demand, faster after sales service and support to
customers and better understanding of plant performance across multiple metrics- these
constitute the top three areas where the big data analytics can improve the performance of
manufacturing process (Goodwin 2014). Demand forecasting is the prediction process of
what will be the level of company's existing product sales. If we have a large historical
dataset then it would be best to determine the demand forecast using quantitative approach
like time series models. The inputs from sales and marketing, finance, and production should
be considered for these models. In this model, forecasting is based only on past values and we
assume that factors that influence the past, the present and the future sales of products will
continue. Now a days the majority of businesses realize that the new goal is to deliver
performance and responsiveness as quickly as possible because companies want clean and
balanced dataset to make enhanced business decisions in real time but also want to lower cost
and improve operational efficiency. They are focusing on the speed of real-time business by
using big data and predictive analytics. Big data analytics is playing an important role to
solve the problems like data integration, performance, scalability and quality. Using big data
analytics manufacturing companies are able to unify the daily production activities to the
financial performance of the manufacturer. Manufacturers are able to make trade-offs on
which suppliers receive the most time-sensitive orders. Using sensors collected data on all
machines in a production unit provides immediate visibility into how each is operating.
Manufacturers can monitor quality, training variances and performance by each machine and
each operator in real time. By converting daily/hourly production to financial metrics,
manufacturing companies can maximize their profitability by using big data and advance
analytics.
4.3 Dataset description and Model Validation Steel plate’s faults dataset: Buscema, Terzi and Tastle (2010) used this data for making a
new meta-classifier and then Frank and Asuncion (2010) uploaded this data on UCI Machine
Learning Repository. Steel Plates Faults Data Set classifies the steel plates’ faults into 7
different categories: Pastry, Z_Scratch, K_Scatch, Stains, Dirtiness, Bumps and Other Faults.
The goal of this job was to train the machine learning for automatic pattern recognition. The
dataset have 1941 instances labelled by different fault types. Each instance of the dataset has
27 independent variables and one fault type.
Big Data Pre-processing Phase for Data Imbalance Problem Knowledge generation using Big Data Analytics
Train machine
learning for automatic
faulty pattern
recognition in big data
environment using
RHadoop
Impacts of daily production on financial performance with visibility to machine level
Forecasting of Product demand and
production
Faster Customer support service &
Delivery accuracy in real time
Understanding plan performance across multiple
metrics
Unbalanced
Big Datasets
Majority Classes
Minority Classes
Training flow of parallel
Radial Basis Kernel
function SVM + SMOTE
Classifier as Pre-
processor
Modified Balanced Dataset
Process of MapRedu
ce task using
RHadoop
Figure 2. Proposed MapReduce Framework of train machine learning for automatic fault detection based on balanced data using Big data analytics
Faulty product prediction
Profit Estimation
Faster & accurate production
Placing holds correctly
Solution to data errors, poor quality & late
deliveries
Financial implications of late deliveries
Decision making process
Integrity errors due to data fixes

5. RHadoop Integration Program Result & Discussion
We propose a two phase hybrid balancing method for solving big data imbalance problem
based on SMOTE and radial basis function (RBF) kernel based SVM. SMOTE generally
over-samples the minority class by calculating n numbers of nearest neighbours and generates
the synthetic samples. In this case, we used 50 nearest neighbours. In the first phase, SMOTE
technique has been applied on the available imbalanced data. It oversamples the minority
class and then RBF based SVM is trained with best prediction accuracy. In the second phase,
we replace the target value in the imbalanced dataset by the predicted value of trained SVM.
Now available imbalanced data is modified and as a result the balanced dataset is obtained.
To illustrate the effectiveness of the proposed approach, we use a steel plate manufacturing
dataset, which is highly imbalanced in nature and has (90:10) ratio for the class distribution..
After applying the MapReduce code of RHadoop integration program on required dataset,
our research framework will be able to answers some of the following questions:
- What are the main causes of late deliveries?
- What at areas for knowledge gaps in the production process?
- How to best predict breakdowns and breakouts?
- When is the high delay period during production?
- What are the financial implications of late deliveries?
- What are the effects of data errors on quality and late deliveries?
Table-1 presents the result of distribution ratio of classes before and after pre-processing
using this two phase hybrid SMOTE and RBF based SVM. Column 5 and 6 in Table 1
present the distribution ratio of majority and minority class instances before and after pre-
processing using the hybrid approach. Table 2 presents the results when the best hybrid
method is selected and then it trained by SVM and we show the results in terms of sensitivity,
specificity, accuracy, geometric mean and likelihood ratio. It is observed from the results that
pre-processing of data using the hybrid SMOTO+ Radial SVM gives the better prediction of
minority class instances in terms of accuracy and GM. In last phase, this modified data is
used for training the different machine learning algorithms on a case study of steel plate
manufacturing dataset for predicting the faults and automatic patterns in “Yes” or “No” form
by RHadoop integration.
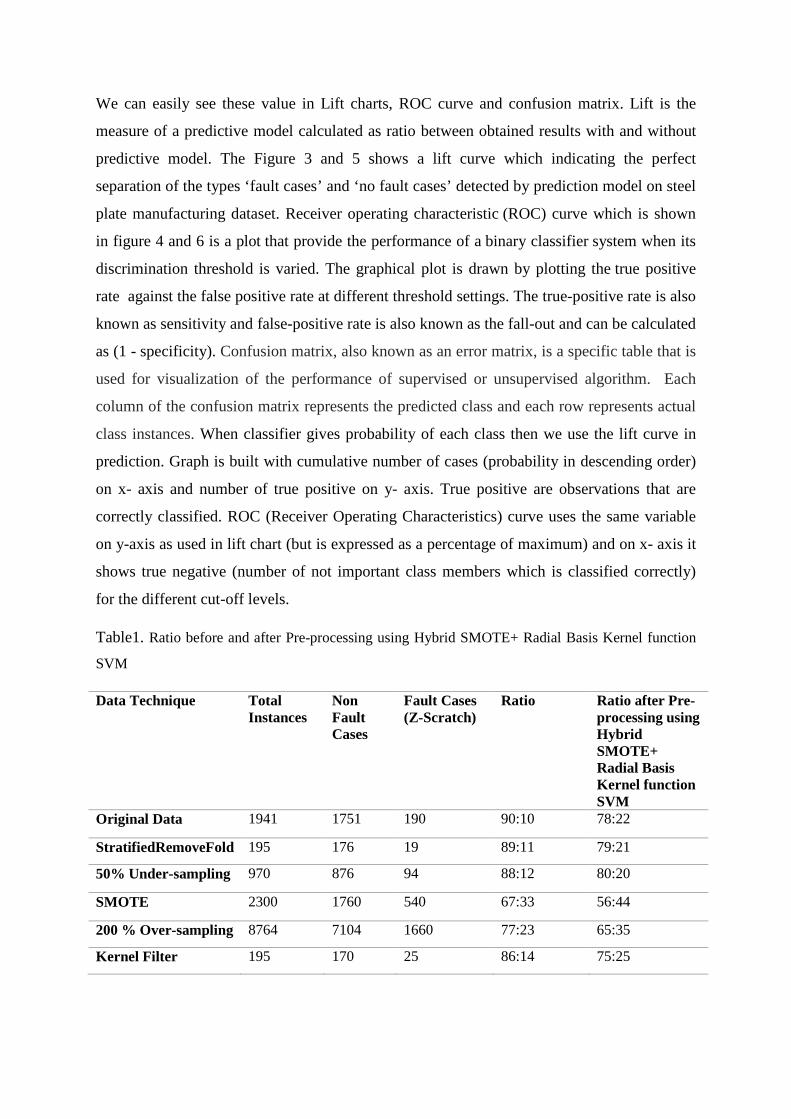
We can easily see these value in Lift charts, ROC curve and confusion matrix. Lift is the
measure of a predictive model calculated as ratio between obtained results with and without
predictive model. The Figure 3 and 5 shows a lift curve which indicating the perfect
separation of the types ‘fault cases’ and ‘no fault cases’ detected by prediction model on steel
plate manufacturing dataset. Receiver operating characteristic (ROC) curve which is shown
in figure 4 and 6 is a plot that provide the performance of a binary classifier system when its
discrimination threshold is varied. The graphical plot is drawn by plotting the true positive
rate against the false positive rate at different threshold settings. The true-positive rate is also
known as sensitivity and false-positive rate is also known as the fall-out and can be calculated
as (1 - specificity). Confusion matrix, also known as an error matrix, is a specific table that is
used for visualization of the performance of supervised or unsupervised algorithm. Each
column of the confusion matrix represents the predicted class and each row represents actual
class instances. When classifier gives probability of each class then we use the lift curve in
prediction. Graph is built with cumulative number of cases (probability in descending order)
on x- axis and number of true positive on y- axis. True positive are observations that are
correctly classified. ROC (Receiver Operating Characteristics) curve uses the same variable
on y-axis as used in lift chart (but is expressed as a percentage of maximum) and on x- axis it
shows true negative (number of not important class members which is classified correctly)
for the different cut-off levels.
Table1. Ratio before and after Pre-processing using Hybrid SMOTE+ Radial Basis Kernel function
SVM
Data Technique Total Instances
Non Fault Cases
Fault Cases (Z-Scratch)
Ratio Ratio after Pre-processing using Hybrid SMOTE+ Radial Basis Kernel function SVM
Original Data 1941 1751 190 90:10 78:22
StratifiedRemoveFold 195 176 19 89:11 79:21
50% Under-sampling 970 876 94 88:12 80:20
SMOTE 2300 1760 540 67:33 56:44
200 % Over-sampling 8764 7104 1660 77:23 65:35
Kernel Filter 195 170 25 86:14 75:25
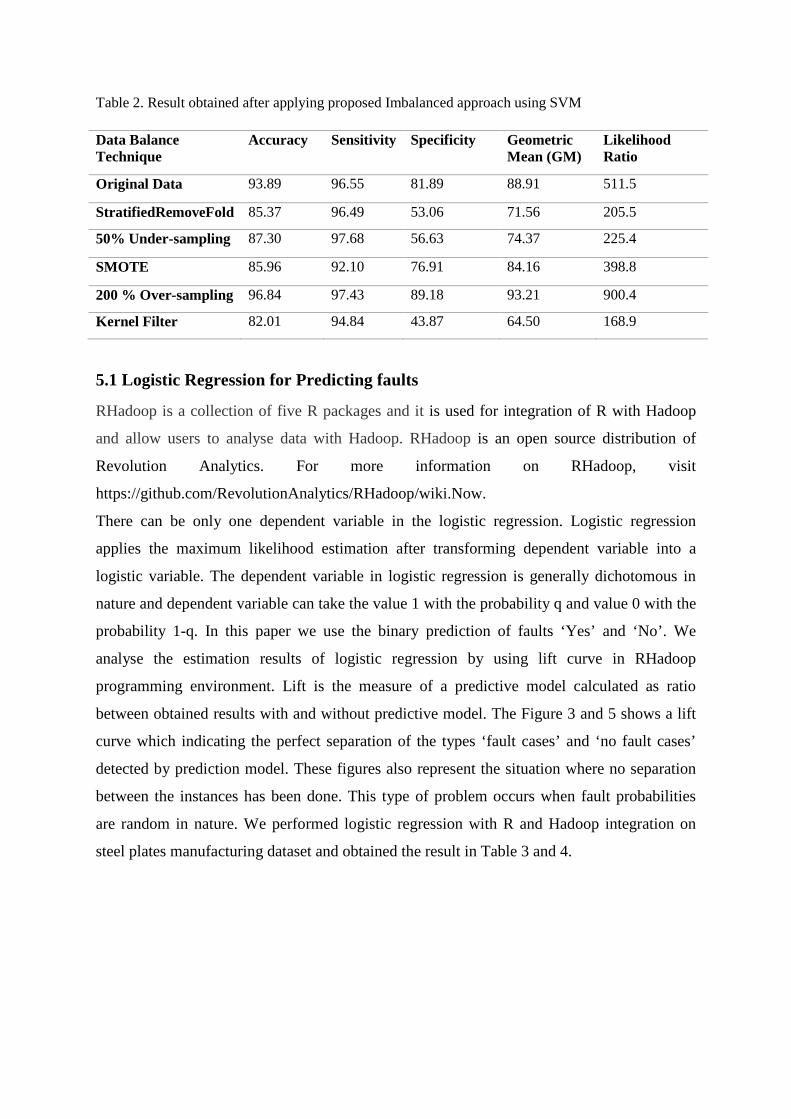
Table 2. Result obtained after applying proposed Imbalanced approach using SVM Data Balance Technique
Accuracy Sensitivity Specificity Geometric Mean (GM)
Likelihood Ratio
Original Data 93.89 96.55 81.89 88.91 511.5
StratifiedRemoveFold 85.37 96.49 53.06 71.56 205.5
50% Under-sampling 87.30 97.68 56.63 74.37 225.4
SMOTE 85.96 92.10 76.91 84.16 398.8
200 % Over-sampling 96.84 97.43 89.18 93.21 900.4
Kernel Filter 82.01 94.84 43.87 64.50 168.9
5.1 Logistic Regression for Predicting faults
RHadoop is a collection of five R packages and it is used for integration of R with Hadoop
and allow users to analyse data with Hadoop. RHadoop is an open source distribution of
Revolution Analytics. For more information on RHadoop, visit
https://github.com/RevolutionAnalytics/RHadoop/wiki.Now.
There can be only one dependent variable in the logistic regression. Logistic regression
applies the maximum likelihood estimation after transforming dependent variable into a
logistic variable. The dependent variable in logistic regression is generally dichotomous in
nature and dependent variable can take the value 1 with the probability q and value 0 with the
probability 1-q. In this paper we use the binary prediction of faults ‘Yes’ and ‘No’. We
analyse the estimation results of logistic regression by using lift curve in RHadoop
programming environment. Lift is the measure of a predictive model calculated as ratio
between obtained results with and without predictive model. The Figure 3 and 5 shows a lift
curve which indicating the perfect separation of the types ‘fault cases’ and ‘no fault cases’
detected by prediction model. These figures also represent the situation where no separation
between the instances has been done. This type of problem occurs when fault probabilities
are random in nature. We performed logistic regression with R and Hadoop integration on
steel plates manufacturing dataset and obtained the result in Table 3 and 4.
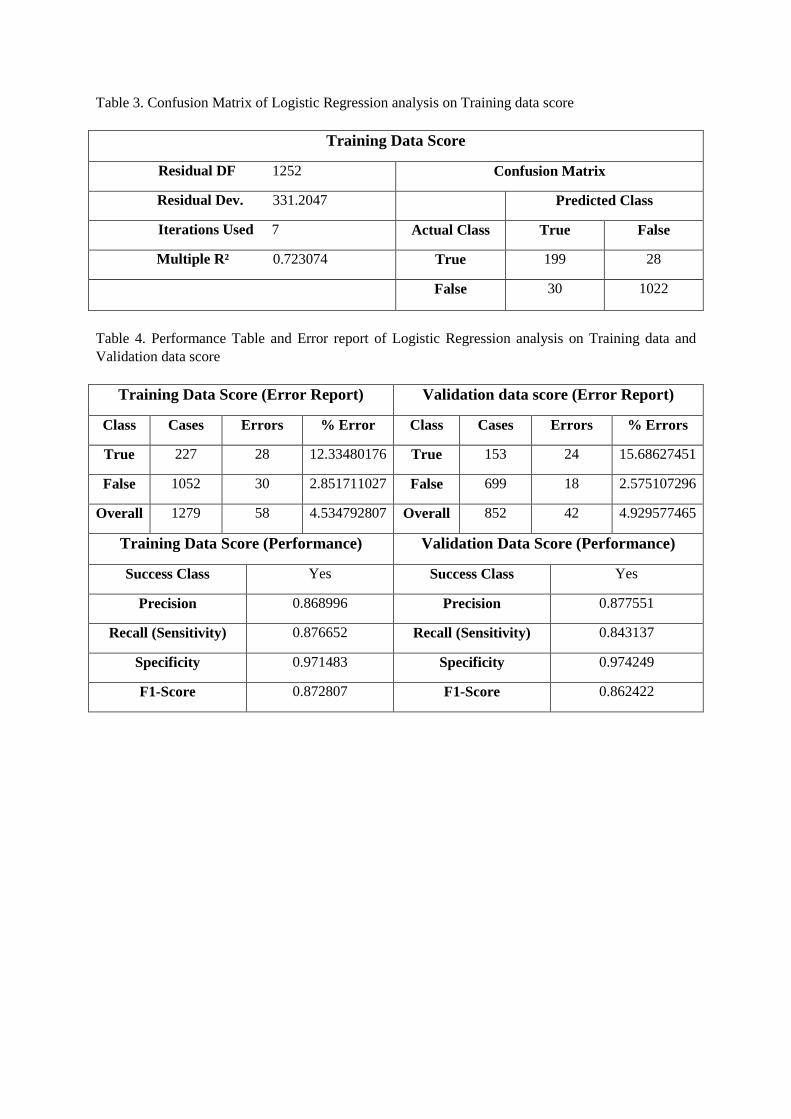
Table 3. Confusion Matrix of Logistic Regression analysis on Training data score
Training Data Score
Residual DF 1252 Confusion Matrix
Residual Dev. 331.2047 Predicted Class
Iterations Used 7 Actual Class True False
Multiple R² 0.723074 True 199 28
False 30 1022
Table 4. Performance Table and Error report of Logistic Regression analysis on Training data and Validation data score
Training Data Score (Error Report) Validation data score (Error Report)
Class Cases Errors % Error Class Cases Errors % Errors
True 227 28 12.33480176 True 153 24 15.68627451
False 1052 30 2.851711027 False 699 18 2.575107296
Overall 1279 58 4.534792807 Overall 852 42 4.929577465
Training Data Score (Performance) Validation Data Score (Performance)
Success Class Yes Success Class Yes
Precision 0.868996 Precision 0.877551
Recall (Sensitivity) 0.876652 Recall (Sensitivity) 0.843137
Specificity 0.971483 Specificity 0.974249
F1-Score 0.872807 F1-Score 0.862422
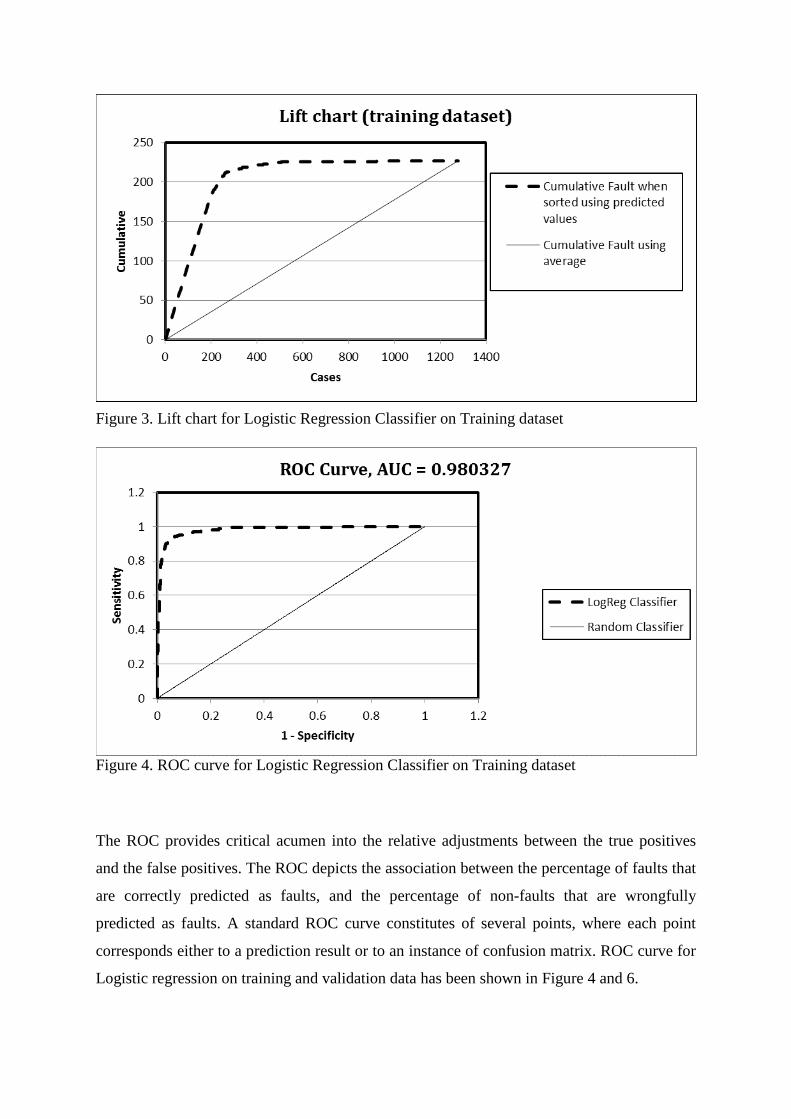
Figure 3. Lift chart for Logistic Regression Classifier on Training dataset
Figure 4. ROC curve for Logistic Regression Classifier on Training dataset
The ROC provides critical acumen into the relative adjustments between the true positives
and the false positives. The ROC depicts the association between the percentage of faults that
are correctly predicted as faults, and the percentage of non-faults that are wrongfully
predicted as faults. A standard ROC curve constitutes of several points, where each point
corresponds either to a prediction result or to an instance of confusion matrix. ROC curve for
Logistic regression on training and validation data has been shown in Figure 4 and 6.
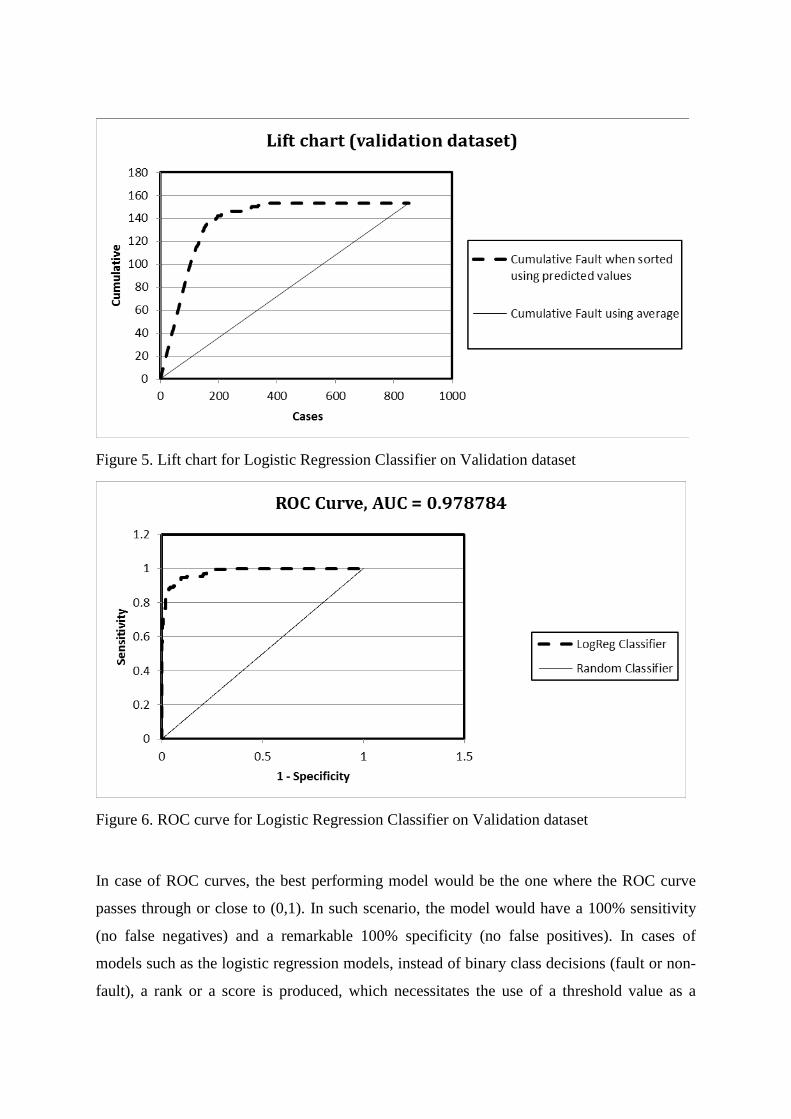
Figure 5. Lift chart for Logistic Regression Classifier on Validation dataset
Figure 6. ROC curve for Logistic Regression Classifier on Validation dataset
In case of ROC curves, the best performing model would be the one where the ROC curve
passes through or close to (0,1). In such scenario, the model would have a 100% sensitivity
(no false negatives) and a remarkable 100% specificity (no false positives). In cases of
models such as the logistic regression models, instead of binary class decisions (fault or non-
fault), a rank or a score is produced, which necessitates the use of a threshold value as a
binary classifier. If the output of the classifier is greater than the threshold, it would be
classified as fault, otherwise it would fall under the non-fault category. The area under the
ROC curve, denoted as AUC, is also used as a performance metric where it represents the
probability of a correct discrimination between instances of fault and non-fault. The AUC
values may vary somewhere from 0.0 to 1.0, and greater the AUC value, better would be the
performance of the model. In general, models with AUC values greater than 0.5 are
considered better than random models.
6. Conclusion and future direction
In the recent times, big data is at the juncture of a major breakthrough due to the
exponential growth and availability of data. The traditional data mining approaches and
software are unable to deal with the massive amounts of generated data. The objective of this
study was to develop a MapReduce framework for automatic pattern recognition based on
fault diagnosis by solving data imbalance problem in cloud-based manufacturing on steel
plate manufacturing dataset. In a mature CBM system, the occurrence of fault conditions is
few and far between. Fault diagnosis in a manufacturing process is a practical instance where
issue of class-imbalanced is highly applicable. Majority of the collected data from system
will exhibit the normal operating behaviour while faulty operating condition is limited.
Condition-based maintenance on such datasets does not work properly and makes it difficult
to build the reliable models for the accurate fault diagnosis. It is widely accepted that most of
the machine learning algorithms are somewhat biased towards the majority class while
dealing with the unbalanced big datasets. We evaluated our proposed hybrid method on steel
plate manufacturing dataset and have shown the promising results. Although there was some
loss in accuracy of result obtained after applying proposed imbalanced approach but
generally a trade-off exist between performance and cost. In the present study, we analysed
the efficiency of a hybrid SMOTE+ RBF-SVM Classifier in dealing with an imbalanced
dataset. For the empirical analysis, we used the steel plate manufacturing fault diagnosis
dataset, which is highly imbalanced in nature and has a class distribution ratio of 90:10. The
methodology proposed in our study followed a two-phase approach. During the first phase,
hybrid SMOTE+ RBF-SVM Classifier was used to replace the target values of the training
data by the corresponding predictions of the classifier. In the second phase the balanced data
was used to train the Logistic Regression. The intelligent approaches used in the first phase of

our study exhibited better learning about the minority class instances from the modified
training data, and also made better predictions regarding the minority class instances in the
unseen test data. Using the modified dataset, the performance of logistic regression also
improved exceptionally in our study because class distribution ratio has improved from 90:10
to 78:22. Until now most of the previous studies have focused on simple feature selection
using only pre-defined approach. If we can execute a number of dissimilar types feature
selection approaches and then sequentially combine selection outcomes, then we can
complement the errors made by the singular approach and we can also improve the
performance of classifier. In future direction, it is very crucial to study described challenges
in depth so that performance of classifier can be greatly improved with new methods.
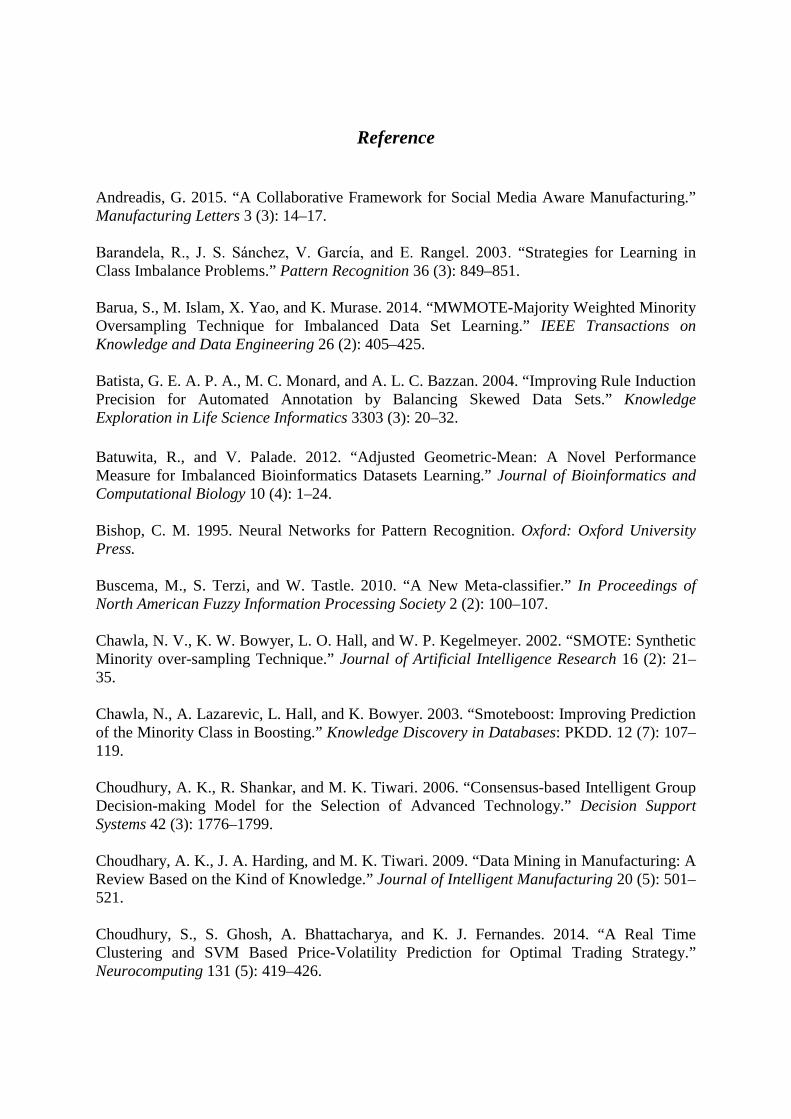
Reference
Andreadis, G. 2015. “A Collaborative Framework for Social Media Aware Manufacturing.” Manufacturing Letters 3 (3): 14–17. Barandela, R., J. S. Sánchez, V. Garcı́a, and E. Rangel. 2003. “Strategies for Learning in Class Imbalance Problems.” Pattern Recognition 36 (3): 849–851. Barua, S., M. Islam, X. Yao, and K. Murase. 2014. “MWMOTE-Majority Weighted Minority Oversampling Technique for Imbalanced Data Set Learning.” IEEE Transactions on Knowledge and Data Engineering 26 (2): 405–425. Batista, G. E. A. P. A., M. C. Monard, and A. L. C. Bazzan. 2004. “Improving Rule Induction Precision for Automated Annotation by Balancing Skewed Data Sets.” Knowledge Exploration in Life Science Informatics 3303 (3): 20–32. Batuwita, R., and V. Palade. 2012. “Adjusted Geometric-Mean: A Novel Performance Measure for Imbalanced Bioinformatics Datasets Learning.” Journal of Bioinformatics and Computational Biology 10 (4): 1–24. Bishop, C. M. 1995. Neural Networks for Pattern Recognition. Oxford: Oxford University Press. Buscema, M., S. Terzi, and W. Tastle. 2010. “A New Meta-classifier.” In Proceedings of North American Fuzzy Information Processing Society 2 (2): 100–107. Chawla, N. V., K. W. Bowyer, L. O. Hall, and W. P. Kegelmeyer. 2002. “SMOTE: Synthetic Minority over-sampling Technique.” Journal of Artificial Intelligence Research 16 (2): 21–35. Chawla, N., A. Lazarevic, L. Hall, and K. Bowyer. 2003. “Smoteboost: Improving Prediction of the Minority Class in Boosting.” Knowledge Discovery in Databases: PKDD. 12 (7): 107–119. Choudhury, A. K., R. Shankar, and M. K. Tiwari. 2006. “Consensus-based Intelligent Group Decision-making Model for the Selection of Advanced Technology.” Decision Support Systems 42 (3): 1776–1799. Choudhary, A. K., J. A. Harding, and M. K. Tiwari. 2009. “Data Mining in Manufacturing: A Review Based on the Kind of Knowledge.” Journal of Intelligent Manufacturing 20 (5): 501–521. Choudhury, S., S. Ghosh, A. Bhattacharya, and K. J. Fernandes. 2014. “A Real Time Clustering and SVM Based Price-Volatility Prediction for Optimal Trading Strategy.” Neurocomputing 131 (5): 419–426.
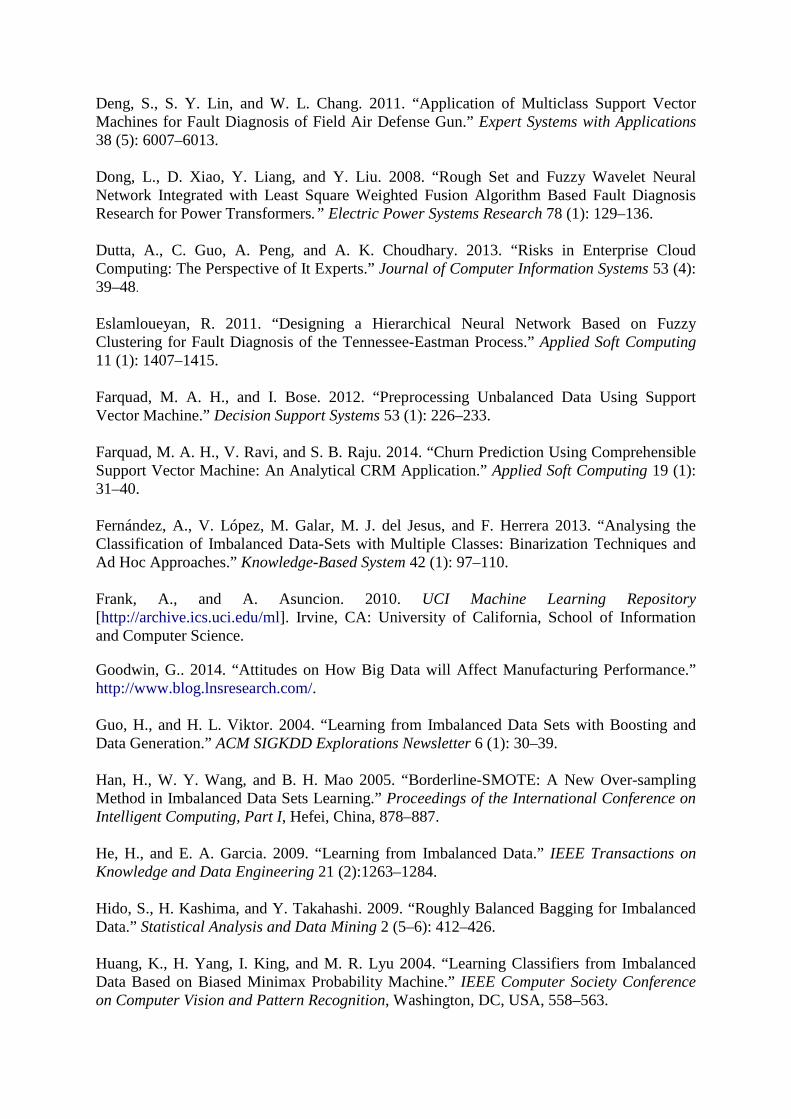
Deng, S., S. Y. Lin, and W. L. Chang. 2011. “Application of Multiclass Support Vector Machines for Fault Diagnosis of Field Air Defense Gun.” Expert Systems with Applications 38 (5): 6007–6013. Dong, L., D. Xiao, Y. Liang, and Y. Liu. 2008. “Rough Set and Fuzzy Wavelet Neural Network Integrated with Least Square Weighted Fusion Algorithm Based Fault Diagnosis Research for Power Transformers.” Electric Power Systems Research 78 (1): 129–136. Dutta, A., C. Guo, A. Peng, and A. K. Choudhary. 2013. “Risks in Enterprise Cloud Computing: The Perspective of It Experts.” Journal of Computer Information Systems 53 (4): 39–48. Eslamloueyan, R. 2011. “Designing a Hierarchical Neural Network Based on Fuzzy Clustering for Fault Diagnosis of the Tennessee-Eastman Process.” Applied Soft Computing 11 (1): 1407–1415. Farquad, M. A. H., and I. Bose. 2012. “Preprocessing Unbalanced Data Using Support Vector Machine.” Decision Support Systems 53 (1): 226–233. Farquad, M. A. H., V. Ravi, and S. B. Raju. 2014. “Churn Prediction Using Comprehensible Support Vector Machine: An Analytical CRM Application.” Applied Soft Computing 19 (1): 31–40. Fernández, A., V. López, M. Galar, M. J. del Jesus, and F. Herrera 2013. “Analysing the Classification of Imbalanced Data-Sets with Multiple Classes: Binarization Techniques and Ad Hoc Approaches.” Knowledge-Based System 42 (1): 97–110. Frank, A., and A. Asuncion. 2010. UCI Machine Learning Repository [http://archive.ics.uci.edu/ml]. Irvine, CA: University of California, School of Information and Computer Science. Goodwin, G.. 2014. “Attitudes on How Big Data will Affect Manufacturing Performance.” http://www.blog.lnsresearch.com/. Guo, H., and H. L. Viktor. 2004. “Learning from Imbalanced Data Sets with Boosting and Data Generation.” ACM SIGKDD Explorations Newsletter 6 (1): 30–39. Han, H., W. Y. Wang, and B. H. Mao 2005. “Borderline-SMOTE: A New Over-sampling Method in Imbalanced Data Sets Learning.” Proceedings of the International Conference on Intelligent Computing, Part I, Hefei, China, 878–887. He, H., and E. A. Garcia. 2009. “Learning from Imbalanced Data.” IEEE Transactions on Knowledge and Data Engineering 21 (2):1263–1284. Hido, S., H. Kashima, and Y. Takahashi. 2009. “Roughly Balanced Bagging for Imbalanced Data.” Statistical Analysis and Data Mining 2 (5–6): 412–426. Huang, K., H. Yang, I. King, and M. R. Lyu 2004. “Learning Classifiers from Imbalanced Data Based on Biased Minimax Probability Machine.” IEEE Computer Society Conference on Computer Vision and Pattern Recognition, Washington, DC, USA, 558–563.

Japkowicz, T., and N. Jo. 2004. “Class Imbalances versus Small Disjuncts.” SIGKDD Explorations 6 (1): 40–49. Khilwani, N., A. Prakash, Shankar, and M. K. Tiwari. 2007. “Fast Clonal Algorithm.” Engineering Applications of Artificial Intelligence 21 (2008): 106–128. Kubat, M., and S. Matwin. 1997. “Addressing the Curse of Imbalanced Training Sets: One Sided Selection.” 14th International Conference on Machine Learning, Nashville, TN, USA, 179–186. Kumar, A., Prakash, M. K. Tiwari, R. Shankar and A. Baveja. 2005. “Solving Machine Loading Problem of a Flexible Manufacturing System with Constraint-Based Genetic Algorithm.” European Journal of Operation Research 175 (2): 1043–1069. Kumar, S., A. K. Choudhary, M. Kumar, and R. Shankar. 2006. “Kernel Distance-based Robust Support Vector Methods and Its Application in Developing a Robust K-chart.” International Journal of Production Research 44 (1): 77–96. Larose, D. 2005. Discovering Knowledge in Data: An Introduction to Data Mining. Hoboken, NJ: Wiley. Lau, C. K., Y. S. Heng, M. A. Hussain, and M. I. Mohamad Nor. 2010. “Fault Diagnosis of the Polypropylene Production Process (UNIPOL PP) Using ANFIS.” ISA Transactions 49 (4): 559–566. Lee, J., and E. Lapira. 2013. “Predictive Factories: The Next Transformation.” Manufacturing Leadership Journal 20 (1): 13–24. Lee J, E Lapira, S Yang, and H. A. Kao. 2013. “Predictive Manufacturing System Trends of Next Generation Production Systems.” Proceedings of the 11th IFAC Workshop on Intelligent Manufacturing Systems 11 (1): 150–156. Lee, J., B. Bagheri, and H. A. Kao. 2015. “A Cyber-physical Systems Architecture for Industry 4.0-Based Manufacturing Systems.” Manufacturing Letters 3 (1): 18–23. Li, B. H., L. Zhang, S. L. Wang, F. Tao, J. W. Cao, X. D. Jiang, X. Song, and X. D. Chai. 2010. “Cloud Manufacturing: A New Service-oriented Networked Manufacturing Model.” Computer Integrated Manufacturing Systems 16 (1): 1–7. Liu, X. Y., J. Wu, and Z. H. Zhou. 2009. “Exploratory Undersampling for Class Imbalance Learning.” IEEE Transactions Systems Man Cabernets Part B 39 (2): 539–550. Lo, C. H., Y. K. Wong, A.B. Rad, and K. M. Chow. 2002. “Fusion of Qualitative Bond Graph and Genetic Algorithms: A Fault Diagnosis Application.” ISA Transactions 41 (2): 445–456. Mishra, N. K., A. K. Choudhary, R. Shankar, and M. K. Tiwari. 2009. “Rollout Strategy-based Probabilistic Causal Model for Multiple Fault Diagnosis.” Robotics and Computer Integrated Manufacturing 26 (3): 325–332.
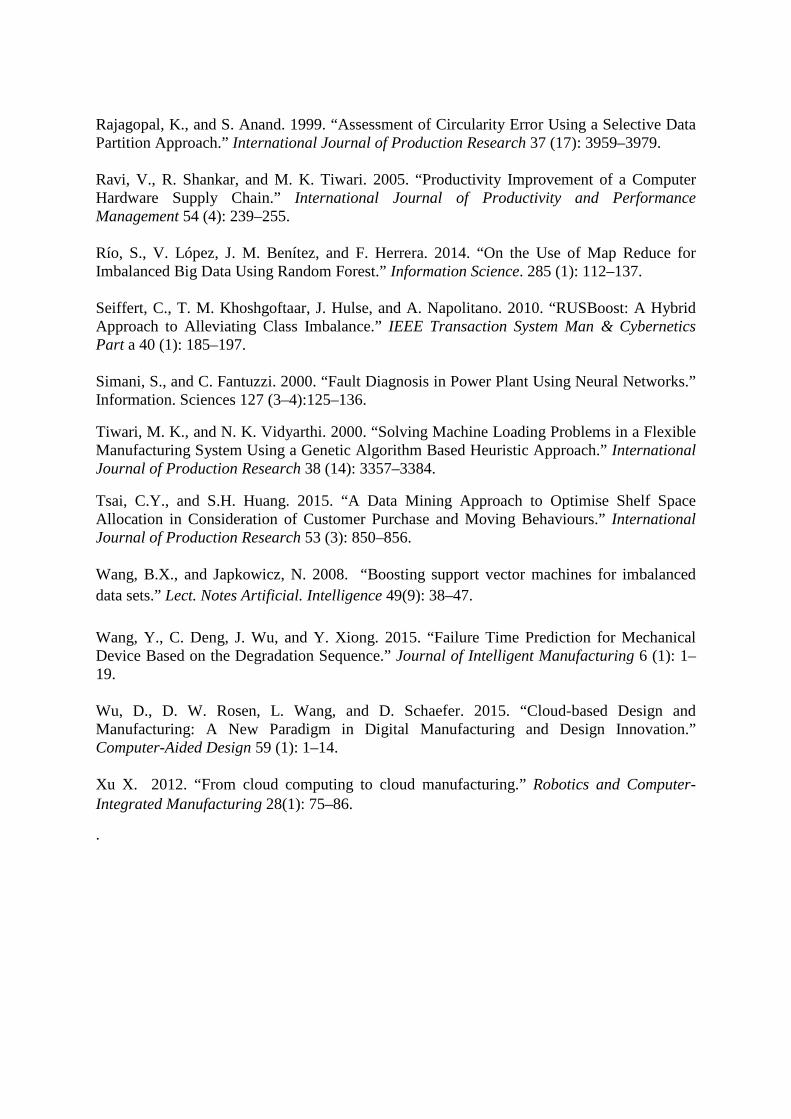
Rajagopal, K., and S. Anand. 1999. “Assessment of Circularity Error Using a Selective Data Partition Approach.” International Journal of Production Research 37 (17): 3959–3979. Ravi, V., R. Shankar, and M. K. Tiwari. 2005. “Productivity Improvement of a Computer Hardware Supply Chain.” International Journal of Productivity and Performance Management 54 (4): 239–255. Río, S., V. López, J. M. Benítez, and F. Herrera. 2014. “On the Use of Map Reduce for Imbalanced Big Data Using Random Forest.” Information Science. 285 (1): 112–137. Seiffert, C., T. M. Khoshgoftaar, J. Hulse, and A. Napolitano. 2010. “RUSBoost: A Hybrid Approach to Alleviating Class Imbalance.” IEEE Transaction System Man & Cybernetics Part a 40 (1): 185–197. Simani, S., and C. Fantuzzi. 2000. “Fault Diagnosis in Power Plant Using Neural Networks.” Information. Sciences 127 (3–4):125–136. Tiwari, M. K., and N. K. Vidyarthi. 2000. “Solving Machine Loading Problems in a Flexible Manufacturing System Using a Genetic Algorithm Based Heuristic Approach.” International Journal of Production Research 38 (14): 3357–3384. Tsai, C.Y., and S.H. Huang. 2015. “A Data Mining Approach to Optimise Shelf Space Allocation in Consideration of Customer Purchase and Moving Behaviours.” International Journal of Production Research 53 (3): 850–856. Wang, B.X., and Japkowicz, N. 2008. “Boosting support vector machines for imbalanced data sets.” Lect. Notes Artificial. Intelligence 49(9): 38–47. Wang, Y., C. Deng, J. Wu, and Y. Xiong. 2015. “Failure Time Prediction for Mechanical Device Based on the Degradation Sequence.” Journal of Intelligent Manufacturing 6 (1): 1–19. Wu, D., D. W. Rosen, L. Wang, and D. Schaefer. 2015. “Cloud-based Design and Manufacturing: A New Paradigm in Digital Manufacturing and Design Innovation.” Computer-Aided Design 59 (1): 1–14. Xu X. 2012. “From cloud computing to cloud manufacturing.” Robotics and Computer-Integrated Manufacturing 28(1): 75–86.
.