a bayesian approach to sample size estimation and the
TRANSCRIPT

A Bayesian Approach to Sample Size Estimationand the Decision to Continue ProgramDevelopment in Intervention ResearchDing-Geng Chen University of North Carolina at Chapel Hill, University of PretoriaMark W. Fraser University of North Carolina at Chapel Hill
A B S T R AC T Objective: In intervention research, the decision to continue develop-ing a new program or treatment is dependent on both the change-inducing poten-tial of a new strategy (i.e., its effect size) and the methods used to measure change,
including the size of samples. This article describes a Bayesian approach to deter-mining sample sizes in the sequential development of interventions. Description:Because sample sizes are related to the likelihood of detecting program effects,large samples are preferred. But in the design and development process that char-acterizes intervention research, smaller scale studies are usually required to justifymore costly, larger scale studies. We present 4 scenarios designed to address com-mon but complex questions regarding sample-size determination and the risk ofobserving misleading (e.g., false-positive) findings. From a Bayesian perspective,this article describes the use of decision rules composed of different target proba-bilities and prespecified effect sizes. Monte-Carlo simulations are used to demon-strate a Bayesian approach—which tends to require smaller samples than the clas-sical frequentist approach—in the development of interventions from one study tothe next.K E YWORD S : intervention research, research design, Bayesian, sample size, Monte-Carlo simulation
doi: 10.1086/693433
The determination of sample sizes is a crucial element in the development of
new interventions over a series of studies. Precision in research design is crit-
ical because the early stages of intervention research are rarely so well-funded
as to afford recruiting large samples.Without proper upfront consideration, a poorly
specified design can lead to results that are unreliable, difficult to interpret, or not sta-
tistically robust. Indeed, a poorly specified design could producemisleading findings
that result in a premature decision to stop program development, or, alternatively, a
false-positive decision that leads to unwarranted further development.
Journal of the Society for Social Work and Research, Volume 8, Number 3. 2334-2315/2017/0803-0007/$10.00.
© 2017 by the Society for Social Work and Research. All rights reserved.
457
This content downloaded from 152.002.176.242 on August 25, 2017 08:37:45 AMAll use subject to University of Chicago Press Terms and Conditions (http://www.journals.uchicago.edu/t-and-c).

458 Journal of the Society for Social Work & Research Fall 2017
In determining sample sizes in intervention research, a Bayesian framework of-
fers certain advantages. Differing from the more common frequentist perspective
on probability, a Bayesian perspective incorporates data from prior studies into the
design and development process. The Bayesian approach tends to produce studies
that are relatively smaller in size but adequately powered, thus decreasing costs
while preserving the reliability and robustness of the statistical findings. Focusing
on the design of small-scale trials and sample sizes, this paper describes and dem-
onstrates sample-size determination from a Bayesian perspective in intervention
research.
The Intervention Research ProcessEarly in the development process, small effectiveness trials are often designed to
compare the outcomes of a novel intervention with the outcomes observed in a
routine services condition (Fraser, Richman, Galinsky, & Day, 2009; Galinsky, Fra-
ser, Day, & Richman, 2013). Typically, the research aims to demonstrate the supe-
rior effectiveness of the novel treatment, but the research might alternatively aim
to show that the novel treatment is at least equivalent to and not inferior to routine
services. Additionally, a researcher might aim to demonstrate that the novel treat-
ment offers advantages over usual services, such as reduced costs or equal effective-
ness with decreased duration of treatment.
A common starting point in the development of a new intervention is to con-
struct a null and an alternative hypothesis as follows:
• H0 (null hypothesis): The new intervention and control conditions have the
same effect on the outcome of interest; and
• Ha (alternative one-tailed hypothesis): The new intervention is more effec-
tive than the control on the outcome of interest.
Data are collected during the intervention study and analyzed at the trial’s end
to assess the strength of evidence in support of the null hypothesis with a p value. If
the p value is sufficiently small, the null hypothesis is rejected in favor of the al-
ternative hypothesis, and the researcher can conclude that the novel treatment is
more effective than the reference control. This is often called the frequentist per-
spective, and it dominates intervention research (Chen & Fraser, 2017; Chen &
Peace, 2011).
In designing intervention studies, statistical power is calculated as a safeguard
to make certain that an adequate number of study participants is recruited to con-
trol the probability of a Type I error (i.e., incorrectly rejecting the H0 or accepting a
false-positive finding) to a certain level (a) and to ensure that a sufficiently high
probability exists of correctly rejecting a false H0 (i.e., power). Using the frequentist
approach, the sample size is calculated under the assumptions that the magnitude
This content downloaded from 152.002.176.242 on August 25, 2017 08:37:45 AMAll use subject to University of Chicago Press Terms and Conditions (http://www.journals.uchicago.edu/t-and-c).

Bayesian Sample Size Estimation 459
of the difference between the new intervention or treatment (T), when compared
with the usual services control (C), is a known, prespecified value, and the variabil-
ity of the outcome of interest is also known. In practice, this information is often
estimated from previous or similarly designed studies.
This frequentist approach works well when the assumption about the magni-
tude of the difference between the novel treatment and the reference control is cor-
rect, as is the assumption about the variability of the outcome of interest. However,
the information on which these assumptions rest is often insufficient, especially in
the early stage of conceptualizing a new intervention. Indeed, intervention re-
searchers are sometimes required to make best guesses.
Rather than setting up a study without sufficient evidence, a prudent researcher
designs initial studies to assess the possibility that the new interventionmight have
some benefit, or that it might have a magnitude of benefit that the researcher has
specified. However, such questions are difficult to address in the classical fre-
quentist statistical approach because these questions require reliable data for cal-
culations of sample size and statistical power. Given that such reliable data are of-
ten unavailable in the early stages of intervention development, we consider in this
paper an alternative: the Bayesian approach.
A Bayesian approach can be used to develop and answer critical questions early
in the intervention research process, including questions such as “What sample
sizes are required to assess a targeted possibility that the new intervention has a
benefit over the reference control?” and “What sample sizes are required to assess
a targeted possibility that the magnitude of a benefit over the reference control is
at least a certain amount?” These two questions are fundamental to the sequential
design/redesign process that makes up intervention research and repeatedly asks,
“To warrant further development, what level of confidence is required that the
new intervention is more effective?”
Corresponding to this question, this article addresses the following two ques-
tions:
Question 1: What sample sizes are required so that the researcher has sufficient
confidence that the novel intervention (T) has some benefit over the reference con-
trol (C)—that is, the probability that (T) is better than (C), which can then be written
as Pr(T > C) or Pr(T2C > 0)?
Question 2: What sample sizes are required so that the researcher has sufficient
confidence to demonstrate that the novel treatment (T) meets a prespecified benefit
(d) over the reference control (C)—that is, that (T) is better than (C) by the pre-
specified d, which can be then be written as Pr(T2C > d)?
Question 2 is more stringent than Question 1 because the intervention benefit
must meet a positive prespecified value (d). Whereas Question 1 is intended to eval-
uate the probability that the new treatment (T) is better than the conventional con-
trol (C), Question 2 is intended to evaluate the probability that the new treatment
This content downloaded from 152.002.176.242 on August 25, 2017 08:37:45 AMAll use subject to University of Chicago Press Terms and Conditions (http://www.journals.uchicago.edu/t-and-c).

460 Journal of the Society for Social Work & Research Fall 2017
(T) is superior to the conventional control (C) by a specified positive value (d). Notice
that in the Bayesian paradigm, the probabilities Pr(T2C > 0) and Pr(T2C > d) are
more intuitive, and these replace the typical Type I error, Type II error, and signif-
icance level in the frequentist paradigm. Building on extensive theoretical devel-
opments in sample-size determination using Bayesian models in medical clinical
trials (e.g., Brutti, De Santis, & Gubbiotti, 2008; Gajewski & Mayo, 2006; Mayo &
Gajewski, 2004; Whitehead, Valdés-Márquez, Johnson, & Graham, 2008), this arti-
cle briefly describes Bayesian methods in intervention research (see also, Chen &
Fraser, 2017) and then demonstrates a Bayesian approach to research design using
Monte-Carlo simulations. (For a more detailed explanation of simulations, see Chen &
Chen, 2017).
Bayesian Framework for Intervention ResearchBayesian methods can be used in intervention research to answer questions 1 and
2. For researchers familiar with the R program, a review of Bayesian methods for
intervention research can be found in Chen and Fraser (2017) and in Chen and
Peace (2011), both of which provide programming details for calculations. For re-
searchers familiar with SAS, Bayesian methods are described in Chen, Peace, and
Zhang (2017), which presents details for step-by-step implementation using R or
SAS for analysis with Bayesian methods. A comprehensive discussion on the use
of Bayesian methods in clinical trials can be found in Barry, Carlin, Lee, and Muller
(2010). The core Bayesian approach involves the following three steps:
1. Based on existing information or belief, identify a prior distribution (i.e., a
probability distribution) regarding the effect size of a novel treatment.
2. Construct the data likelihood from the new data collected to explore the
effect size of the new intervention.
3. Construct the posterior distribution by multiplying the constructed data
likelihood (data collected) from Step 2 and the prior distribution in Step 1.
Once the posterior distribution is obtained (Step 3), the researcher can use this
value as an updated prior distribution in Step 1 to repeat the process, gathering ad-
ditional data in Step 2 (e.g., by including more participants in the study or conduct-
ing a new study) and updating the prior information with each repetition of the
steps. This successive prior distribution updating process is a key feature of a Bayes-
ian perspective on intervention research.
Sometimes no prior information is available, or the available information is
based on an untested application of a new construct. Although a researcher might
believe a new intervention represents an advance over conventional practice, that
belief likely has low value in the selection of an effect size on which to power a
preliminary study. This situation commonly occurs in the early stages of interven-
This content downloaded from 152.002.176.242 on August 25, 2017 08:37:45 AMAll use subject to University of Chicago Press Terms and Conditions (http://www.journals.uchicago.edu/t-and-c).

Bayesian Sample Size Estimation 461
tion research or when an intervention is being applied to an entirely new popula-
tion or setting. In a data-poor situation, no reliable prior information is available to
construct a prior distribution.
How to proceed? The simple Bayesian solution is to start from ignorance—the
equivalent of a flat prior distribution—where no information supports a reason
to believe that the novel treatment will be better than the reference control. In other
words, all possible values for the treatment effect are considered equally plausible. In
this circumstance, data are collected and used to test how this noninformative prior
changes based on the new information. In this case, the posterior distribution is en-
tirely dependent on the observed data and not on the prior distribution.
Simulation Design on Sample Size and Decision-MakingSuppose we have developed a novel intervention to be compared to a usual-
services control, and we want to show that this novel intervention is not only
promising but also warrants further development. Because this is the new inter-
vention’s first effectiveness trial, funders will not want to invest in a large study.
Rather, consistent with a design approach in which an intervention is developed
in a series of small studies, we want to explore the possible effectiveness using a small-
scale trial. If a reasonable probability exists that the novel intervention provides ben-
efit, then further design and development would be warranted.
We constructed Monte-Carlo simulation studies within the Bayesian framework
to assess the potential impact of different sample sizes on our decision-making pro-
cess (i.e., the decision to continue development). The simulation study starts from a
noninformative prior where we assume no reliable prior information is available.
Based on ordered effect size (ES) categories as recommended in Cohen (1988; see
Table 1), we designed the following four scenarios:
• Scenario 1 is designed to address the first question regarding what sample
sizes are required for each condition (i.e., arm) to continue developing the
new intervention, based on a decision rule that the novel intervention has
at least a targeted 90% probability of observing a minimal benefit (defined
as ES > 0) over the reference control.
Table 1General Guideline for Effect Sizes
Effect size < 0.1 0.1–0.3 0.3–0.5 > 0.5Intervention effect Trivial Small Moderate Large
This content downAll use subject to University of C
loaded from 152.0hicago Press Term
02.176.242 on Augus and Conditions (ht
st 25, 2017 08:37:45 Atp://www.journals.uch
Micago.edu/t-and-c).

462 Journal of the Society for Social Work & Research Fall 2017
• Scenario 2 is intended to answer the second question regarding what sam-
ple sizes are required for each condition to continue developing the new in-
tervention, based on a decision rule that the intervention has at least a tar-
geted 90% probability of observing a prespecified ES greater than 0.3 (i.e., a
small to moderate ES, as defined in Table 1).
• Scenario 3 is intended to further answer the second question on what sam-
ple sizes are required for each arm to continue developing the new inter-
vention, based on a decision rule that the intervention has at least a targeted
90% probability of observing a prespecified ES greater than 0.5 (i.e., a moder-
ate to large ES, as defined in Table 1).
• Scenario 4 is designed to further examine the impact of different target
confidence probabilities (i.e., for deciding whether to continue developing
the novel intervention) under a fixed sample size of 30 subjects per arm. A
small sample size is selected because small samples are often used early in
the design and development process.
These four scenarios are summarized in Table 2.
Simulation Settings for Scenario 1Suppose we decide that if a targeted posterior probability of at least 90% is ob-
served, then we will continue developing the intervention. Suggesting that the novel
treatment is better than the routine services control is equivalent to saying that the
posterior probability that the true ES is ≥ 0 is at least 90%. Based on this decision rule
and using the simulations, we then choose an appropriate sample size for the inter-
vention study. In addition, we also want to avoid continuing to develop the interven-
tion if the new treatment is no better than the control (i.e., a false-positive outcome),
where the ES < 0.
For this purpose, the simulation process can be carried out in the following five
steps.
Table 2Summary of Four Simulation Scenarios and Decision Rules for Continuing Intervention Development
In each scenario, continue development if the posterior probability of the effect size (ES) . . .
Scenario 1 Scenario 2 Scenario 3 Scenario 4
Decision rule ES > 0 is at least90%
ES > 0.3 is at least90%
ES > 0.5 is at least90%
ES > 0 is at least60%, 70%, 80%,
90%Sample size 20–100 per arm 20–100 per arm 20–100 per arm Fixed at 30 per arm
ThAll use subject to
is content downloadUniversity of Chica
ed from 152.002.176go Press Terms and C
.242 on August 25, onditions (http://ww
2017 08:37:45 AMw.journals.uchicago.edu/t-and-c).

Bayesian Sample Size Estimation 463
Step 1: For a true standard deviation of j 5 10, create a list of values for a treat-
ment mean (mT) from22 to 10 by 1-unit intervals, and set the mean for control to
mC5 0without loss of generality.With this setup, the values for mT ≤ 0 (i.e.,22,21, 0)
indicate the new treatment (T) either performs worse than or not better than
the usual services control (C). The rest of the values for mT > 0 (i.e., 1 to 10 by an in-
terval of 1, such as 1, 2, 3, 4, 5, 6, 7, 8, 9, and 10) indicate the new treatment per-
forms better than the control. Based on this setup, the values for the ES are then
from 20.2 to 1 by an interval of 0.1 (i.e., 20.2, 20.1, 0, 0.1, 0.2, 0.3, 0.4, 0.5, 0.6,
0.7, 0.8, 0.9, 1).
Step 2: Create a series of sample sizes (n) from 20 to 100 by an interval of 20 (i.e.,
20, 40, 60, 80, and 100).
Step 3: For each sample-size selection in Step 2, simulate a set of samples from
both the new treatment (T) and conventional control (C) based on the normal dis-
tribution with the specific value of ES from Step 1.
Step 4: Based on the samples from Step 3, calculate the posterior probability of
Pr(T2C > 0) and evaluate whether the posterior probability is greater than the tar-
geted probability of 90%.
Step 5: Simulate steps 3 and 4 many times (N; we used N5 100,000) to calculate
how often the decision rule of Pr(T2C > 0) > 90% is satisfied among the N simula-
tions, which would be the probability to continue the new intervention.
Simulation Settings for Scenarios 2 and 3The steps for scenarios 2 and 3 are similar to those for Scenario 1, with the only
change needed at Step 4.
The following change is made at Step 4 (Scenario 2): Based on the samples from
Step 3, calculate the posterior probability of Pr(T2C > 0.3) and evaluate whether it
is greater than the targeted probability of 90%.
The following change is made at Step 4 (Scenario 3): Based on the samples from
Step 3, calculate the posterior probability of Pr(T2C > 0.5) and evaluate whether it
is greater than the targeted probability of 90%.
Simulation Settings for Scenario 4Scenario 4 was designed to examine the impact of different target probabilities un-
der a fixed small sample size of 30 participants per arm. We believe that the initial
tests of all new interventions should routinely include exploring the probability for
continuing development of the proposed intervention under a specified small sam-
ple size. For this purpose, the simulation process for Scenario 4 can be carried out
in the following five steps.
Step 1: It is the same as Scenario 1, Step 1.
Step 2: With a sample size of 30 subjects per arm, create a series of target prob-
abilities of 0.6, 0.7, 0.8, and 0.9.
This content downloaded from 152.002.176.242 on August 25, 2017 08:37:45 AMAll use subject to University of Chicago Press Terms and Conditions (http://www.journals.uchicago.edu/t-and-c).

464 Journal of the Society for Social Work & Research Fall 2017
Step 3: For sample size N 5 30, simulate a set of samples from both the new
treatment (T) and conventional control (C), based on the normal distribution with
the specific ES value from Step 1.
Step 4: Using the generated sample from Step 3, calculate the posterior proba-
bility of Pr(ES > 0) and evaluate whether it is greater than the target probability
from each ES value in Step 2.
Step 5: Simulate steps 3 and 4 many times (N; we used N 5100,000) to calculate
how often the decision rule of Pr(ES > 0) > the values of target probability is satis-
fied among the N simulations, which would be the probability to continue devel-
oping the new intervention.
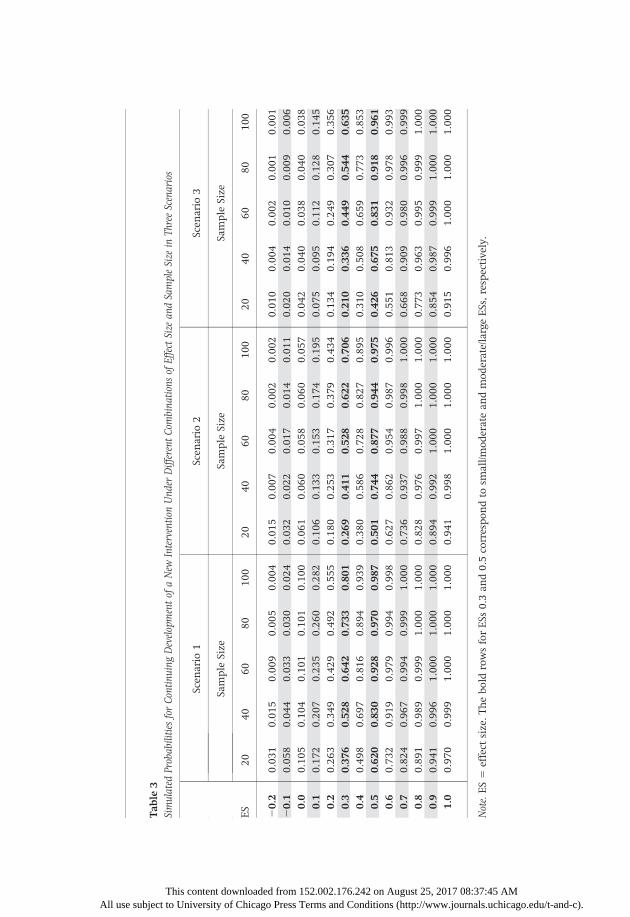
ResultsTable 3 summarizes the simulation results for scenarios 1, 2, and 3 for the combi-
nations of different ESs and sample sizes. From this table, the probability to continue
development of the new intervention generally increases as the ESs increase, from a
small value close to 0 to a large value close to 1 for all the sample sizes. For exam-
ple, in Scenario 1, the probability increases from 3.1% to 97% for a sample size of
20 subjects per arm; the probability increases from 1.5% to 99.9% for a sample size
of 40 subjects per arm; the probability increases from 0.9% to 100% for a sample
size of 80 subjects per arm; and the probability increases from 0.4% to 100% for
a sample size of 100 subjects per arm. As shown in Table 3, with a sample size of
20 subjects per arm, if the new treatment has an ES of 0.3, then we would continue
development 37.6% of the time. However, if the new treatment has an ES of 0.5,
then we would continue development 62% of the time. If we increase the sample
size to 80 subjects per arm and the new treatment has an ES of 0.3 or 0.5, then
we would continue development 73.3% or 97% of the time, respectively.
If the new treatment is no better than the conventional control (i.e., ES 5 0), a
10% probability of a false positive exists; that is, we would continue development
even though the new treatment is not effective. If the new intervention is worse
than the control (i.e., ES < 0), a small chance exists of making an incorrect decision
to continue development, although this probability decreases with larger sample
sizes.
To address the more stringent criterion of Question 2 (i.e., treatment benefit
must meet a positive prespecified value, d), Scenario 2 and Scenario 3 seek to deter-
mine the probability that the novel treatment (T) has a small/moderate ES greater
than the reference control defined as ES > 0.3 (i.e., Scenario 2) and amoderate/large
ES defined as ES > 0.5 (i.e., Scenario 3) across different sample-size specifications,
ranging from 20 to 100 subjects per arm. As shown in Table 3, moving from Sce-
nario 1 through Scenario 3, the probabilities to continue development of the new
intervention are sequentially smaller. Specifically, as shown for the small/moderate
ES of 0.3 on Table 3, the probabilities to continue intervention development for
This content downloaded from 152.002.176.242 on August 25, 2017 08:37:45 AMAll use subject to University of Chicago Press Terms and Conditions (http://www.journals.uchicago.edu/t-and-c).
Tab
le3
Simulated
Probabilities
forContinuing
Developmentof
aNew
Intervention
Und
erDifferentCombina
tionsof
EffectSize
andSampleSize
inThreeScenarios
Scen
ario
1Scen
ario
2Scen
ario
3
Sample
Size
Sample
Size
Sample
Size
ES20
4060
8010
020
4060
8010
020
4060
8010
0
20.2
0.03
10.01
50.00
90.00
50.00
40.01
50.00
70.00
40.00
20.00
20.01
00.00
40.00
20.00
10.00
120.1
0.05
80.04
40.03
30.03
00.02
40.03
20.02
20.01
70.01
40.01
10.02
00.01
40.01
00.00
90.00
60.0
0.10
50.10
40.10
10.10
10.10
00.06
10.06
00.05
80.06
00.05
70.04
20.04
00.03
80.04
00.03
80.1
0.17
20.20
70.23
50.26
00.28
20.10
60.13
30.15
30.17
40.19
50.07
50.09
50.11
20.12
80.14
50.2
0.26
30.34
90.42
90.49
20.55
50.18
00.25
30.31
70.37
90.43
40.13
40.19
40.24
90.30
70.35
60.3
0.37
60.52
80.64
20.73
30.80
10.26
90.41
10.52
80.62
20.70
60.21
00.33
60.44
90.54
40.63
50.4
0.49
80.69
70.81
60.89
40.93
90.38
00.58
60.72
80.82
70.89
50.31
00.50
80.65
90.77
30.85
30.5
0.62
00.83
00.92
80.97
00.98
70.50
10.74
40.87
70.94
40.97
50.42
60.67
50.83
10.91
80.96
10.6
0.73
20.91
90.97
90.99
40.99
80.62
70.86
20.95
40.98
70.99
60.55
10.81
30.93
20.97
80.99
30.7
0.82
40.96
70.99
40.99
91.00
00.73
60.93
70.98
80.99
81.00
00.66
80.90
90.98
00.99
60.99
90.8
0.89
10.98
90.99
91.00
01.00
00.82
80.97
60.99
71.00
01.00
00.77
30.96
30.99
50.99
91.00
00.9
0.94
10.99
61.00
01.00
01.00
00.89
40.99
21.00
01.00
01.00
00.85
40.98
70.99
91.00
01.00
01.0
0.97
00.99
91.00
01.00
01.00
00.94
10.99
81.00
01.00
01.00
00.91
50.99
61.00
01.00
01.00
0
Note.ES
5effect
size.Th
ebo
ldrowsforES
s0.3an
d0.5correspon
dto
small/m
oderatean
dmod
erate/largeES
s,respectively.
This content downloaded from 152.002.176.242 on August 25, 2017 08:37:45 AMAll use subject to University of Chicago Press Terms and Conditions (http://www.journals.uchicago.edu/t-and-c).

466 Journal of the Society for Social Work & Research Fall 2017
Scenario 1 are 0.376, 0.528, 0.642, 0.733, and 0.801; for Scenario 2, the probabil-
ities decrease to 0.269, 0.411, 0.528, 0.622, and 0.706; and the probabilities de-
crease further for Scenario 3 to 0.210, 0.336, 0.449, 0.544, and 0.635. Similarly,
as shown in Table 3 in the row for the moderate/large ES of 0.5, the probabilities
to continue intervention development for Scenario 1 are 0.620, 0.830, 0.928,
0.970, 0.987; for Scenario 2, the probabilities decrease to 0.501, 0.744, 0.877,
0.944, and 0.975; and the probabilities decrease further for Scenario 3 to 0.426,
0.675, 0.831, 0.918, and 0.961.
Simulation results showing the probability of continuing intervention develop-
ment for Scenario 1 are illustrated graphically in Figure 1. The horizontal axis in
this figure represents the ES, with values greater than 0 indicating a benefit asso-
ciated with the new intervention and values less than 0 indicating a detrimental ef-
fect of the new intervention. The three vertical dashed lines on the horizontal axis
represent no real effect (ES5 0), a small/moderate effect (ES5 0.3), and a moderate/
large effect (ES5 0.5). The vertical axis represents the probability of the decision to
continue development of the new intervention. The various colored dashed lines
and the solid line on the figure represent different sample sizes, showing the ben-
efits of increasing the sample size.
Figure 1. Simulation results showing the probability for continuing development with different specificationsof sample sizes and effect sizes under Scenario 1.
This content downloaded from 152.002.176.242 on August 25, 2017 08:37:45 AMAll use subject to University of Chicago Press Terms and Conditions (http://www.journals.uchicago.edu/t-and-c).

Bayesian Sample Size Estimation 467
Scenario 4 differs from the first three scenarios in that the aim of Scenario 4 is to
examine different specifications of the target values (60%, 70%, 80%, and 90%) on
the probability to continue development of the new intervention using a fixed
small sample size of 30 participants per arm. This scenario reflects real-world sit-
uations in which available resources, such as research budgets and time, are lim-
ited and only a small sample can be afforded. In this situation, the target value of
90% would have to be lowered. In other words, the cost of a smaller sample is in-
creased risk for a false-positive finding and making an incorrect decision to con-
tinue development.
Table 4 summarizes the results from the simulation study for Scenario 4, and Fig-
ure 2 presents a graphic illustration of the simulation results for Scenario 4. As can
be observed fromTable 4 and Figure 2, when the target value is lowered from90% to
80%, then to 70%, and then to a less stringent 60%, the probabilities increase for
continuing intervention development. For example, if we choose 60% as a target
value (the second column in Table 4 and top solid line in Figure 2), the probability
for continuing development increases from 0.4 to 1, with a corresponding positive
intervention ES ranging from 0 to 1. Specifically, when a new intervention has a
small/moderate ES of 0.3 and a moderate/large ES of 0.5, we would continue devel-
All
Table 4Simulated Probabilities for Continuing Development of a New Intervention Under DifferentCombinations of Target Probabilities and Effect Sizes in Scenario 4
Target Probability
ES 60% 70% 80% 90%
20.2 0.152 0.099 0.055 0.02120.1 0.264 0.184 0.112 0.0480.0 0.400 0.301 0.201 0.1030.1 0.552 0.446 0.325 0.1880.2 0.701 0.596 0.476 0.3110.3 0.817 0.739 0.627 0.4570.4 0.902 0.849 0.762 0.6110.5 0.953 0.920 0.861 0.7440.6 0.981 0.965 0.931 0.8510.7 0.993 0.986 0.968 0.9220.8 0.998 0.995 0.988 0.9650.9 0.999 0.998 0.996 0.9861.0 1.000 1.000 0.999 0.995
This contenuse subject to Universi
t downloaded from 1ty of Chicago Press T
52.002.176.242 on Aerms and Conditions
ugust 25, 2017 08:37 (http://www.journals
Note. ES5 effect size. Sample size is fixed at N5 30 per arm. The bold rows for ESs 0.3and 0.5 correspond to small/moderate and moderate/large ESs, respectively.
:45 AM.uchicago.edu/t-and-c).

468 Journal of the Society for Social Work & Research Fall 2017
opmentmore than 81.7% or 95.3% of the time, respectively. However, if the benefit
of the new intervention is no better than the usual services control (ES 5 0), then
there is a 40% probability that we would continue development even though the
new intervention is not effective. Because 60% is a far less stringent target, this sit-
uation has an inherently high risk of a false-positive recommendation.
DiscussionIn intervention research, a Bayesian approach is useful when, as a part of a se-
quence of studies intended to gradually refine a new social or health program, pro-
jecting an expected ES in calculating power is difficult because prior information is
of uncertain value. Bayesian methods enable intervention researchers to design in-
tervention studies in the context of differentially informative prior data.
Using Monte-Carlo simulations, we presented four scenarios to show the appli-
cability of the Bayesian approach with continuous and normally distributed data
with a noninformative prior distribution. That is, the shape of the prior distribu-
tion was flat, and there was no contribution of a prior intervention to the new
study. However, the results can be easily extended to an informative prior distribu-
tion if reliable data are available. With the use of a noninformative prior distribu-
tion, researchers can design intervention studies and evaluate results within a
Bayesian framework without searching for prior data that are potentially inappro-
priate or even misleading.
Figure 2. Simulation results showing the probability for continuing development with different specificationsof target confidence probabilities and effect sizes under Scenario 4 with sample size fixed atN5 30 per arm.
This content downloaded from 152.002.176.242 on August 25, 2017 08:37:45 AMAll use subject to University of Chicago Press Terms and Conditions (http://www.journals.uchicago.edu/t-and-c).

Bayesian Sample Size Estimation 469
Intervention research is developmental in nature, often beginning with a new
construct or mediating mechanisms, the creation of program activities and other
content (e.g., recruitment and trainingmaterials), and small pilot studies. To power
these studies under a frequentist perspective, researchers must make assumptions
based on scant information. Bayesian methods hold the potential to be more infor-
mative and forgiving in the sense that these methods provide a technique for re-
peatedly reassessing the state of the evidence and incorporating new findings—
in the form of revised prior distributions—in decision-making processes.
Author NotesDing-Geng Chen, PhD, is the Wallace H. Kuralt Distinguished Professor and Director of Sta-
tistical Development and Consultation at University of North Carolina at Chapel Hill andan extraordinary professor at University of Pretoria, South Africa.
MarkW. Fraser, PhD, is the John A. Tate Distinguished Professor for Children in Need in theSchool of Social Work at the University of North Carolina at Chapel Hill.
Correspondence regarding this article should be directed to Ding-Geng Chen via e-mail [email protected]
AcknowledgmentsWe thank Ms. Diane C. Wyant for providing helpful comments on the draft of this paper.
ReferencesBarry, S. M., Carlin, B. P., Lee, J. J., & Muller, P. (2010). Bayesian adaptive methods for clinical trials.
Boca Raton, FL: Chapman & Hall/CRC Biostatistics Series.Brutti, P., De Santis, F., & Gubbiotti, S. (2008). Robust Bayesian sample size determination in
clinical trials. Statistics in Medicine, 27(13), 2290–2306. doi:10.1002/sim.3175Chen, D. G., & Chen, J. D. (2017).Monte-Carlo simulation-based statistical modeling. New York, NY:
Springer/ICSA Book Series in Statistics.Chen, D. G., & Fraser, M. W. (2017) A Bayesian Perspective on Intervention Research: Using
Prior Information in the Development of Social and Health Programs. Journal of the Societyfor Social Work and Research, 8. Advance online publication. doi:10.1086/693432
Chen, D. G., & Peace, K. E. (2011). Clinical trial data analysis using R. Boca Raton, FL: Chapman &Hall/CRC Biostatistics Series.
Chen, D. G., Peace, K. E., & Zhang, P. (2017). Clinical trial data analysis using R and SAS. Boca Ra-ton, FL: Chapman & Hall/CRC Biostatistics Series.
Cohen, J. (1988). Statistical power analysis for the behavioral sciences (2nd ed.). Mahwah, NJ: Law-rence Erlbaum.
Fraser, M. W., Richman, J. M., Galinsky, M. J., & Day, S. H. (2009). Intervention research: Devel-oping social programs. New York, NY: Oxford University Press.
Gajewski, B. J., & Mayo, M. S. (2006). Bayesian sample size calculations in phase II clinical tri-als using a mixture of informative priors. Statistics in Medicine, 25(15), 2554–2566. doi:10.1002/sim.2450
Galinsky, M. J., Fraser, M. W., Day, S. H., & Richman, J. R. (2013). A primer for the design ofpractice manuals: Four stages of development. Research on Social Work Practice, 23, 219–228.https://doi.org/10.1177/1049731512468957
This content downloaded from 152.002.176.242 on August 25, 2017 08:37:45 AMAll use subject to University of Chicago Press Terms and Conditions (http://www.journals.uchicago.edu/t-and-c).

470 Journal of the Society for Social Work & Research Fall 2017
Mayo, M. S., & Gajewski, B. J. (2004). Bayesian sample size calculations in phase II clinical tri-als using informative conjugate priors. Controlled Clinical Trials, 25(2), 157–167. doi:10.1016/j.cct.2003.11.006
Whitehead, J., Valdés-Márquez, E., Johnson, P., & Graham, G. (2008). Bayesian sample size forexploratory clinical trials incorporating historical data. Statistics in Medicine, 27(13), 2307–2327. doi:10.1002/sim.3140
Manuscript submitted: January 26, 2017Revision submitted: March 2, 2017
Accepted: March 7, 2017Electronically published: July 12, 2017
This content downloaded from 152.002.176.242 on August 25, 2017 08:37:45 AMAll use subject to University of Chicago Press Terms and Conditions (http://www.journals.uchicago.edu/t-and-c).