a 5 ton demonstrator for large-scale dual phase liquid
TRANSCRIPT

A 5 ton demonstrator for large-scale dual phase liquid argon time
projection chambers
Abstract
Keywords: Neutrino, liquid argon TPC
Contents1
1 Introduction 22
2 Overview of the set-up 43
3 Cryostat and cryogenic system 54
3.1 The cryostat . . . . . . . . . . . . . . . . . . . . . . . . . . . . . . . . . . . . 75
3.2 The cryogenic and argon purification system . . . . . . . . . . . . . . . . . . 96
3.2.1 Gas argon piston purge, cooling down and filling . . . . . . . . . . . . 107
3.2.2 Boil off compensation and liquid purification during detector operation 128
3.3 Cryostat and cryogenic system performance . . . . . . . . . . . . . . . . . . 129
4 Description of the TPC 1410
4.1 Drift cage, cathode and high voltage feedthroughs . . . . . . . . . . . . . . . 1411
4.2 Charge readout plane . . . . . . . . . . . . . . . . . . . . . . . . . . . . . . . 1512
4.2.1 Mechanical frame and suspension system . . . . . . . . . . . . . . . . 1513
4.2.2 Large Area LEMs and anodes . . . . . . . . . . . . . . . . . . . . . . 1514
4.2.3 LEM biasing and medium voltage feedthroughs . . . . . . . . . . . . 1515
4.3 Photon detection system . . . . . . . . . . . . . . . . . . . . . . . . . . . . . 1716
5 Charge Readout scheme and data processing 1817
5.1 Cold analog Front Ends and signal feedthrough . . . . . . . . . . . . . . . . 1818
5.2 Front Ends cards and ASIC characteristics . . . . . . . . . . . . . . . . . . . 1819
5.3 Digital back end and data acquisition . . . . . . . . . . . . . . . . . . . . . . 1820
6 Ancillary instrumentation and slow control 1821
6.1 level monitoring and feedback to charge readout plane suspension . . . . . . 1822
6.2 Cryogenic cameras . . . . . . . . . . . . . . . . . . . . . . . . . . . . . . . . 1823
6.3 Slow control back-end . . . . . . . . . . . . . . . . . . . . . . . . . . . . . . 2024
Preprint submitted to NIM November 30, 2017

7 Dector commissioning and first data 2025
7.1 Stability of liquid level and charge readout plane adjustment . . . . . . . . . 2026
7.2 high voltage system settings and stability . . . . . . . . . . . . . . . . . . . 2027
7.3 Charge readout performance and response . . . . . . . . . . . . . . . . . . . 2028
7.3.1 Electronic noise study . . . . . . . . . . . . . . . . . . . . . . . . . . 2029
7.3.2 Response to an injected pulse . . . . . . . . . . . . . . . . . . . . . . 2030
7.4 Photon detection system performance . . . . . . . . . . . . . . . . . . . . . . 2031
7.5 First data . . . . . . . . . . . . . . . . . . . . . . . . . . . . . . . . . . . . . 2032
7.5.1 Electroluminescence and evidence for charge extraction . . . . . . . . 2033
7.5.2 Observation of first cosmic muons with gain . . . . . . . . . . . . . . 2034
1. Introduction35
Liquid argon time projection chamber (LAr TPC) is the detector technology chosen for36
the DUNE (Deep Underground Neutrino Experiment) experiment [1]. DUNE is the next37
generation of underground experiments aiming to study neutrino properties from both man-38
made and natural sources as well as probe the grand unification energy scale via nucleon39
decay searches. Such varied program requires a massive detector with active volume on a40
multi-kt scale. Numerous R&D efforts throughout the world have been aimed at realizing41
this goal. In Europe, a solution has been developed within the LAGUNA-LBNO design42
study for a LAr TPC detector with a mass of 20 kt to 50 kt [2]. The detector concept relies43
on the amplification of ionisation charges in ultra-pure cold argon vapour layer above the44
liquid to realize low-energy detection thresholds with high signal-to-noise (S/N) ratio over45
a long drift distances in a large fully-active volume.46
The principle of operation of the LAr TPC relies on the detection of ionisation electrons47
— produced in the liquid argon by charged particles traversing the medium — on sets48
of electrodes that provide the two-dimensional localisation of the point where the energy49
deposition had occurred. The time it takes for the charge cloud to arrive at the electrodes50
under influence of an electric (drift) field inside active TPC volume gives the third spatial51
coordinate along the axis parallel to the drift direction. In addition to charge, ionising52
particles produce excited excimer states of Ar that decay by emitting photons in ultraviolet53
range (128 nm). This light, recorded with a suitable cryogenic photon-detection system,54
provides an absolute time reference for the event with respect to a global clock cycle and55
could be used to trigger charge readout electronics.56
Traditionally the ionisation charge in LAr TPC has been detected inside liquid volume57
using a set of wire planes (views). Typically three views are used with the first two (in the58
sense encountered by the drifting electrons) detecting electrons by induction while the third59
and the last one collects the charges. In the case of the LAr TPC with dual-phase charge60
readout (DLAr TPC), the ionisation electrons are drifted upwards to the gas-liquid boundary61
and then extracted into gaseous phase with a help of submerged grid of wires that provide a62
local field of ∼ 2 kV/cm. Once in the gas, electrons are multiplied in Townsend avalanches63
taking place in the holes of a 1 mm thick GEM or LEM (Large Electron Amplifier) [3]. The64
resultant charge is collected on an anode with a two-dimensional segmentation providing65
2

two orthogonal detection views. The structure of the extraction grid, LEM, and anode will66
collectively be referred to as Charge Readout Plane (CRP) in the rest of the paper.67
The amplification of charge (or gain) in the dual-phase readout scheme allows to cope68
with a weakening of the signal strength due to electron attachment to electronegative impu-69
rities in liquid Argon and diffusion effects thereby making it possible to build large detector70
volumes with long drift distances. The gain factor could be tuned by adjusting the electric71
field strength in the LEM to achieve a good S/N ratio with a fine readout pitch of ∼ 3 mm.72
In addition, the anode provides two symmetric collection strips, removing any induction73
views which are more problematic to read out and reconstruct. The fact that the anode74
plane is located in the gas also makes it insensitive to any possible microphonic pick-up75
noise generated inside the liquid volume. The charge amplification and readout in pure76
argon vapour has been a subject of an extensive R&D in the last decade. Detectors varying77
in scales from 3L to 250L volume have been built and successfully operated over significant78
periods of time [4, 5]. In recent years developments have been targeted towards scaling up79
the system to meter squared readout areas [].80
Construction and operation of a large-scale∼ 300 t (6×6×6 m3 active volume) dual-phase81
LAr TPC is the ultimate goal of the WA105 experiment at CERN [6]. It is the key milestone82
towards deploying this detector technology on multi-kt scale. To prototype and test a83
number of critical sub-systems for the WA105 experiment a pilot technical demonstrator84
with an active TPC volume of 3×1×1 m3 has been developed. This detector is the subject85
of the paper. As a first ton-scale demonstrator of the dual phase LAr TPC we list below86
set of key technological deliverable and first operational milestones aiming to validate the87
technology and the progress achieved in this first step towards the construction of kton scale88
detectors.89
i) Liquid argon purity at the ≤100 ppt level and stability of the liquid and gas argon ther-90
modynamic conditions in a 23 m3 non evacuable membrane cryostat. The construction91
and operation of the 3 × 1 × 1 m3 represents a unique test bed to understand some92
essential installation, operational and performance aspects to address the suitability of93
those types of cryostats for future large dual phase LAr TPCs. The cryogenic system,94
the argon re-circulation, purification and cooling methods will also be discussed.95
ii) Extraction of the ionization charge and amplification in purge argon vapour over an96
area of 3 m2. Never before has charge been extracted from liquid argon over such97
a large area. The concept of a charge readout plane mechanically and electronically98
independent from the main drift volume will be discussed. Its performance in terms99
of extraction efficiency and the details of the amplification devices will be described in100
detail.101
iii) Readout of the signal on two collection planes with strips of up to 3 m length. perfor-102
mance of cold analogue front end electronics. An important aspects of the dual-phase103
TPC with its vertical drift is the ability to position front-end electronics closes to104
the readout strips while at the same time ensuring its accessibility during detector105
operation. The charge readout scheme will be described in detail106
3

The manuscript is organized as follows. In Section 3 the overview of the cryostat and107
cryogenic system is provided. Section 4 describes the TPC and photon detection system in108
detail. The charge readout, the analog and digital electronics as well as the data processing109
is discussed in Section 5. The trigger, data acquisition, as well as the on-line storage and110
processing units is covered in Section ??. Sections 6 will present the slow control system111
and some innovative type of instrumentation to monitor the conditions inside the cryo-112
stat. Finally, section 7 will show some initial results from the detector commissioning and113
operation.114
2. Overview of the set-up115
The experimental setup is illustrated in Figure 1. It consists of a 3 × 1 × 1 m3 active116
volume dual phase LAr-TPC inside a passively insulated cryostat with internal volume of117
∼23 m3. The TPC is composed of a one meter high field cage made by 19 field shapers118
placed at a constant spacing of 50 mm and a metallic grid cathode at the bottom. A119
uniform drift field is provided by a resistor divider chain situated between the cathode and120
the top field shaper. At the top of the drift cage the drifting charges are extracted to the121
gas phase where they are amplified and readout by a 3× 1 m2 charge readout plane (CRP).122
The CRP is a single frame electrically and mechanically independent from the drift cage123
that can be remotely adjusted to the liquid level with 100 micron precision by means of124
three suspension cables. It contains an extraction plane provided by a 3 mm pitch wire-125
mesh, an amplification plane made from individually powered 50 ×50 cm2 LEMs of 1 mm126
thickness and a readout stage provided by 50 ×50 cm2 printed circuit board anodes. The127
anodes are electrically bridged together to provide readout strips of 3 meter and 1 meter128
length. The CRP is designed to preserve a uniform 1 cm distance between the extraction-129
amplification plane (extraction gap) and a 2 mm distance between the amplification-readout130
plane (induction gap). In nominal operating conditions the liquid level is adjusted in the131
middle of the extraction gap, 5 mm above the wire-mesh. A detailed description of the CRP132
is provided in Section 4. Five photo-multiplier tubes (PMTs) coated with the wavelength133
shifter, TPB, are fixed to the bottom of the cryostat under a ground protecting grid. They134
are sensitive to the 128 nm scintillation light from the argon scintillation and provide the135
reference time for the drift as well as the trigger. The entire detector is hung under a 1.2 m136
thick insulating top cap. The field cage is fixed by eight FR4 bars and the CRP is suspended137
by the three adjustable cables inserted in dedicated motorised feedthroughs. The position of138
the CRP with respect to the LAr level is constantly readout by seven capactive level meters139
placed on the periphery of the CRP frame. The level meters have range of 25 mm and140
and accuracy of 100 microns which allow, together with the motorized suspension system, a141
precise alignment of the CRP to the level. The adjustment is performed once after the first142
filling of the cryostat and, unless of sudden changes in the level, the CRP remains locked at143
this set position during the entire data taking.144
The top cap is part of the cryostat structure providing the functionality of reducing heat145
input and minimizing the liquid and gas Argon convection. The TPC is pre-assembled under146
the top-cap in a custom built clean room ”tent” and then inserted in the main cryostat as147
4

shown in Figure 3. Subsequent access inside the cryostat is performed through the top-cap148
via 600 mm diameter manhole. Temperature and level measurements.
Figure 1: Drawing of the WA105-3× 1× 1 m3 dual phase LAr TPC in the cryostat.
149
3. Cryostat and cryogenic system150
The cryostat and the cryogenic system serve a multipurpose role that is critical to the151
good functioning of the dual phase TPC. The cryostat is operated as a totally sealed system152
near atmospheric pressure. The liquid argon is left to evaporate at a rate that depends on153
the insulation quality of the cryosat and on the total heat input provided to the system.154
The evaporated gas (the so called boil-off ) and the liquid are constantly recirculated and155
purified in a closed loop. Some specifications of the cryostat and of the cryogenic system are156
provided in Table 1. The main operational quantities that depend upon the performance of157
the cryostat and cryogenic installation are listed below.158
• Gas argon density. The thermodynamic properties of the gas argon need to be well159
controlled and measured since the gas density has an impact on the value of the160
amplification inside the LEM holes. The TPC is to be operated at a constant Pcryostat ∼161
1 Atm and a uniform gas temperature measured at the LEMs of around ∼ 90 K. With162
those settings previous dual phase TPCs were operated at stable gain of around 20 [7, 8]163
for long periods. In those chambers the pressure was either controlled or measured at164
the level of ∼1 mbar and the temperature was stable within one degree.165
5

• Liquid level. The value of the extraction electric field in the liquid, εextr, is determined166
by the difference in potential over the 1 cm grid-LEM distance and the position of167
the LAr level in-between the two planes. It has been measured in the past [9] and168
more recently in smaller dual phase chambers [10? ] that above εextr > 2 kV/cm the169
extraction efficiency is near 100%. Operating the detector at εextr ' 3 kV/cm thereby170
guarantees that close to 100% of the drifting charges are extracted from the liquid171
independently of fluctuations in the level. This is illustrated in Figure 2 where εextr172
is plotted as a function of the LAr level for various grid-LEM potential differences.173
Our requirements on the liquid level position are instead driven by the boundary174
conditions that on one hand the LEMs should not be immersed and on the other that175
the extraction grid must stay inside in the liquid. We therefore require that the CRP176
frame should be aligned with respect to the liquid level within 1-2 mm over its entire177
3 m2 surface and constantly monitored at the sub-mm scale. The cryogenic system is178
setup in such a way that it self-regulates to keep the absolute level inside the cryostat179
at a constant value. The global heat input from the cryostat and various sources should180
be compensated by the cooling system to maintain the LAr level relatively flat and181
avoid large waves on the surface. Local heat inputs that may also introduce undesired182
bubbling should be avoided for the same reason. The precise alignment of the CRP183
with respect to the liquid is discussed in Section 7184
• Liquid purity. A constant liquid argon purity of better than 100 ppt oxygen equivalent,185
or similarly an electron lifetime of 3 ms, is required in order to efficiently transport186
the electrons over the O(10) meter drifts proposed in future large dual phase TPCs187
[11, 12]. This setup, although of more modest drift distance, offers a unique test bed188
to verify if the cryostat and the purification systems are capable of achieving and189
maintaining such purities over long periods.190
Figure 2: extraction field in the liquid as a function of the liquid argon level above the extraction grid fordifferent voltages applied across the grid-LEM planes. The dotted red line indicates the electric field inliquid above which ∼100% of the charges are extracted according to Ref.[9]. FIXME maybe move this plotsome place else.
6

Component value unitcryostat
outer dimensions (l×w×h) 7.34× 4.88× 4.76 m3
inner dimensions (l×w×h) 4.76× 2.38× 2.03 m3
main vessel (top cap) insulationthickness
1 (1.2) m
nominal volume of LAr (GAr) 18.01 (4.98) m3
nominal height of LAr (GAr) 1590 (440) mmdesigned pressure range 995-1090 mbaroperating pressure 998 mbarGAr temperature gradient near theliquid
∼2 K/cm
GAr temperature extrapolated toLEM
95 K
liquid purifica-tion
pump model ACD-TC34.2pump nominal (max) flow rate 22 (35) lpmcartridge active volume (l×) 900×306 mm3
volume ratio copper:sieve 5:1 m3
boil off compen-sation
LN2 temperature (pressure) 85 (2.2) K (bar)max. cooling power 10 kWmeasured boil off rate xx l/sheat input from cryostat only. De-sign (measured)
600 (1100?) W
total heat input with recirculation.Design (measured)
1000 (1500?) W
Table 1: Some technical specifications of the cryostat and of the cryogenic systems
3.1. The cryostat191
One important conclusion of the LAGUNA-LBNO FP7 design study [2] is the technical192
feasibility to build giant underground cryostat up to 100 kton based on the Liquefied Natural193
Gas (LNG) industrial technology. The cryostats are made from corrugated stainless steel194
”membrane” panels that absorb the thermal stress and about 1 meter thick low density195
passive insulation. The study shows that it satisfies the requirement of long-term storage196
of ultra-pure liquid argon, and can fully accommodate a dual phase LAr TPC with the197
necessary cold-warm interfaces. The design studies also converged on the choice of the198
7
corrugated membrane technology licensed by GTT/France1, which offered several advantages199
in the deep underground environment and for liquid argon storage (as opposed to their200
industrial use for LNG). A close partnership was put in place with GTT to construct the201
cryostat hosting the 3 × 1 × 1 m3 detector. The cryostat comes in two separate elements:202
the main vessel and a thermally insulated lid called top-cap under which the detector is203
suspended. Their thermal insulation is based on GRPF (glass reinforced polyurethane foam)204
layers, interspersed with pressure distributing layers of plywood. The dimensions of the205
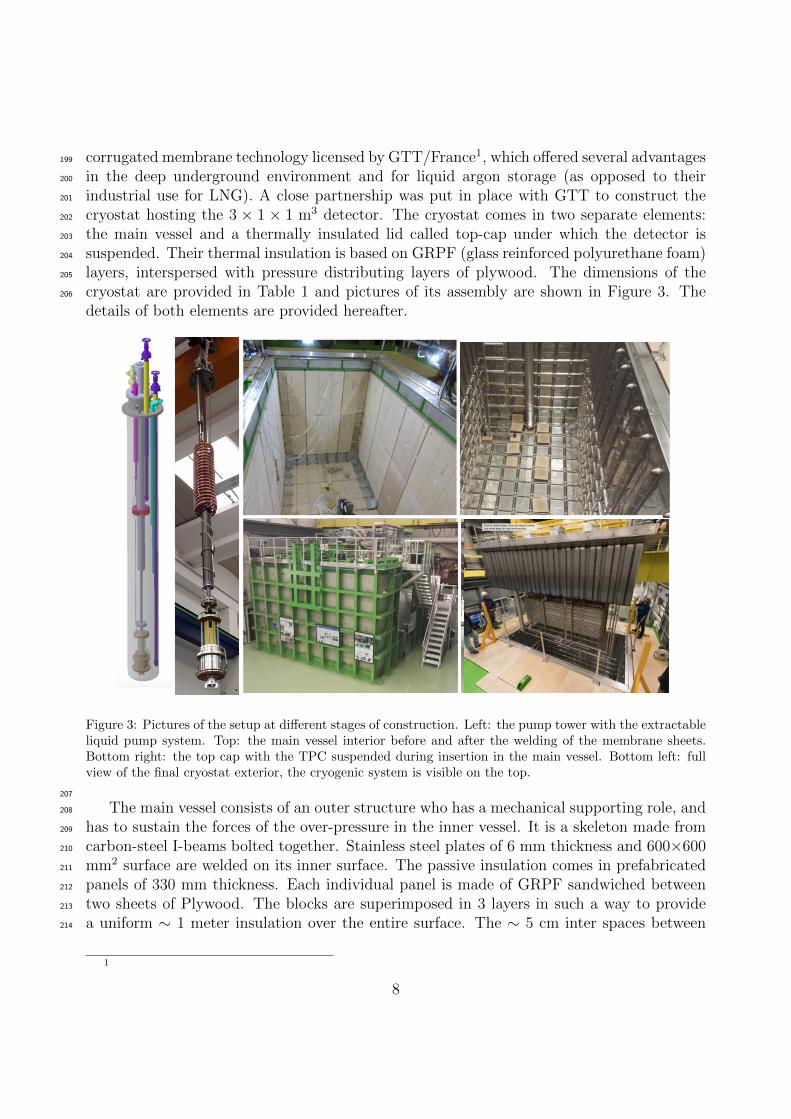
cryostat are provided in Table 1 and pictures of its assembly are shown in Figure 3. The206
details of both elements are provided hereafter.
Figure 3: Pictures of the setup at different stages of construction. Left: the pump tower with the extractableliquid pump system. Top: the main vessel interior before and after the welding of the membrane sheets.Bottom right: the top cap with the TPC suspended during insertion in the main vessel. Bottom left: fullview of the final cryostat exterior, the cryogenic system is visible on the top.
207
The main vessel consists of an outer structure who has a mechanical supporting role, and208
has to sustain the forces of the over-pressure in the inner vessel. It is a skeleton made from209
carbon-steel I-beams bolted together. Stainless steel plates of 6 mm thickness and 600×600210
mm2 surface are welded on its inner surface. The passive insulation comes in prefabricated211
panels of 330 mm thickness. Each individual panel is made of GRPF sandwiched between212
two sheets of Plywood. The blocks are superimposed in 3 layers in such a way to provide213
a uniform ∼ 1 meter insulation over the entire surface. The ∼ 5 cm inter spaces between214
1
8

neighbouring insulating panels are systematically filled with sheets of fiber-glass wool to215
avoid convective heat transfers. Forty five temperature sensors are distributed inside the216
insulation space to provide feedback on the gradient and quality of the insulation during217
cryogenic operation. The membrane sheets come in different dimensions with various shapes218
of corrugations to match the geometry and thermal shrinkage calculations of the cryostat.219
They are fixed on the insulation panels and carefully welded together.220
The top cap is a 1.2 meter thick thermal insulating lid that covers the main vessel. It is221
made from a top stainless steel top cover and an INVAR bottom plate. The side walls have222
vertical corrugations which are complementary to those from the main vessel in order to223
minimize the space in between the top cap and the main vessel. This gap is calculated to be224
2 mm. The insulation is made from stacked sheets of GRPF; plywood panels are arranged225
to provide internal structural reinforcement. Altogether twenty INVAR pipes of various226
diameters called chimneys cross the top cap in order to host the necessary feedthroughs as227
well the interfaces to the cryogenic system. Each pipe is extended to the exterior by about228
30 cm and terminated by a UHV flange so that the appropriate feedthrough can be fixed.229
The thickness and composition of the insulation is designed to reach a residual heat input230
of 5 W/m2 in cold operation. Based on those values the total heat input from the cryosat231
taking into account all the top-cap penetrations is estimated to be about 600 W.232
Since the membrane from the main vessel and the top cap ensure the tightness and233
liquid containment of the cryostat under normal operating condition, all the welds are sys-234
tematically inspected. Both the top cap and the main vessel have a set of external ports235
communicating with their insulation volumes to allow for input of gas during leak checking236
and to regulate the insulation space pressure during operation. Upon delivery both top-cap237
and main vessel are leaked checked separately by flushing Helium gas inside their respective238
insulation volumes and locally scanning the welds with a spectrometer. In the case of the239
main vessel, to increase the sensitivity of the test beyond the Helium traces present in the240
atmosphere (∼ ×10−5 mbar lt/s), custom designed vacuum plugs matching the shapes of241
the membrane corrugations have been developed. The plug covers about 20 cm of weld and242
allow to reach a vacuum better than 10−4 mbar in about one minute. Reaching this level243
of vacuum allows to check for leaks on the membrane welds down to the sensitivity limit244
of the spectrometer of ∼ 1 × 10⁻⁹ mbar l/s. Once the top-cap and detector are inserted,245
the top-cap is welded to the main vessel and their insulation volumes are linked together246
forming one single cryosat with a common insulation. In order to remove and prevent the247
presence of residual humidity inside the insulation, a constant ∼40 liter per hour flow of gas248
nitrogen is introduced and exhausted through a bubbler setting the insulation volume at a249
∼5 mbar over-pressure with respect to the atmospheric pressure.250
3.2. The cryogenic and argon purification system251
The principal tasks of the cryogenic and argon purification system can be summarised as252
follow: 1. evacuate the air from inside the cryostat to the level that its main contaminants253
(oxygen, moisture and nitrogen) are reduced to the part-per-million (ppm) level, 2. cool254
down and fill the cryostat with liquid argon in a uniform and controlled manner and 3.255
ensure optimal operation of the detector by setting a stable thermodynamic environment256
9

inside the cryostat while keeping the electronegative impurities in the liquid below ∼100 ppt.257
A detailed description of the system at each step along with its performance is provided below258
3.2.1. Gas argon piston purge, cooling down and filling259
In order to evacuate the air from inside the cryostat, argon gas is uniformly introduced260
at the bottom of the cryostat through a manifold of 4 pipes each containing three 12 mm261
diameter holes and is exhaust through venting pipes placed at the top of each top-cap pen-262
etrations. This ”piston purge” provides a uniform gas flow from the bottom to the top of263
the main volume and prevents the formation of any residual air pockets. The exhaust gas264
from the chimney vents can either be sent to the exterior through a non-return valve or265
recirculated through a purifying cartridge and return to the cryostat. During the purge pro-266
cess, the gas impurities present inside the cryostat main volume are continuously monitored267
and recorded with three trace analysers for oxygen, moisture and nitrogen. The technical268
details of the three trace analysers are summarised in Table 2. The sample gas to the trace269
analysers is taken with the help of a double diaphragm pump2 with a maximal flow capacity270
of 4.5 l/min. In order to compensate the gas taken by the sampling pump, a make-up gas271
line can inject pure argon gas through a commercial gas purifier3. The evolution of the272
impurities during the piston purge is shown in Figure 4. The process is performed in two273
phases. First in the so called open loop purge the input gas is injected into the cryostat274
with a flow rate of about 2 l/s and vented to the exterior through a non-return valve. At the275
end of the open loop the impurities are measured to be 0.4 ppm, 1.7 ppm and 43 ppm for276
oxygen, nitrogen and moisture. The comparatively larger moisture content is interpreted as277
stemming from the moisture attached to the surface of the cryostat, the cryogenic vessel,278
the process pipes and the detector components. The gas is then recirculated in closed loop279
by a double diaphragm pump at a flow rate of 240 l/min 4 and a commercial gas purifier 5280
which filters oxygen and moisture, but has no expected effect on nitrogen. Thus, during the281
closed looped stage only oxygen and moisture levels decrease while nitrogen slightly rises282
presumably due to outgassing of the detector components inside the cryostat. The sudden283
increase in the nitrogen level at the beginning of the closed loop is interpreted as coming284
from a trapped volume of air before the gas purification cartridge. From time to time, pure285
argon gas is injected through the makeup gas line to dilute the nitrogen impurity, as indi-286
cated in Figure 4. At the end of the closed loop the impurities are measured to be 0.2, 3.5287
and 25 ppm for oxygen, nitrogen and moisture.288
The cooling down is performed by a mixture of argon gas at 300 K and LAr at 87 K289
which is injected through four gas atomizing nozzles 6 located at the corner of the cryostat290
with flow rates of 500 l/min and 21.1 l/h respectively (CHECK FIXME Caspar, you could291
plot the flow during the cooling down stage, this number will replace the 500 l/min). This292
2KNF N 86 AN.12DC-B3SAES MicroTorr MC4004KNF 0150.1.2 AN.12 E5SAES MicroTorr MC45006SSCO-Spraying Systems 1/4J-SS+SUE18-SS
10
10 12 14 16 18 20 22 24Time in days
10-1
100
101
102
Impuri
ty in p
pm
purge in open loop~80 volume changes
purge in closed loop~104 volume changes
cool down
gas injection
160
180
200
220
240
260
280
300
320
Tem
pera
ture
in K
moisturenitrogenoxygen
Ttank bottomTtank middleTtank top
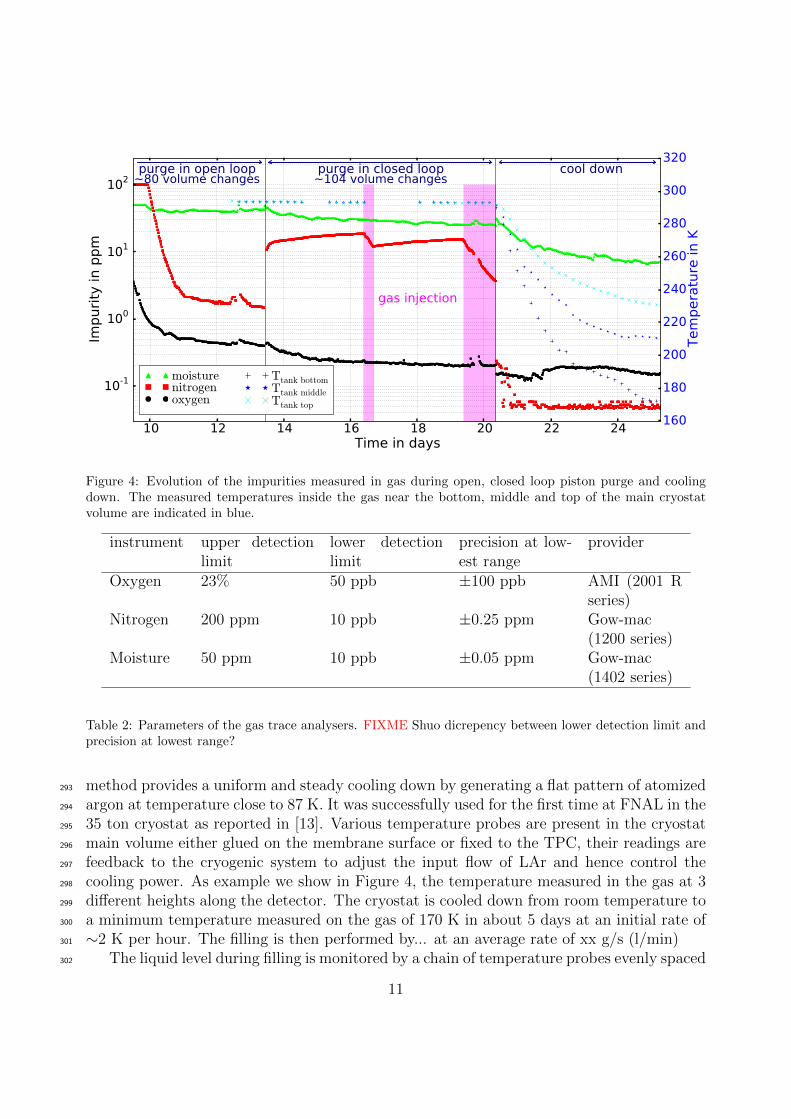
Figure 4: Evolution of the impurities measured in gas during open, closed loop piston purge and coolingdown. The measured temperatures inside the gas near the bottom, middle and top of the main cryostatvolume are indicated in blue.
instrument upper detectionlimit
lower detectionlimit
precision at low-est range
provider
Oxygen 23% 50 ppb ±100 ppb AMI (2001 Rseries)
Nitrogen 200 ppm 10 ppb ±0.25 ppm Gow-mac(1200 series)
Moisture 50 ppm 10 ppb ±0.05 ppm Gow-mac(1402 series)
Table 2: Parameters of the gas trace analysers. FIXME Shuo dicrepency between lower detection limit andprecision at lowest range?
method provides a uniform and steady cooling down by generating a flat pattern of atomized293
argon at temperature close to 87 K. It was successfully used for the first time at FNAL in the294
35 ton cryostat as reported in [13]. Various temperature probes are present in the cryostat295
main volume either glued on the membrane surface or fixed to the TPC, their readings are296
feedback to the cryogenic system to adjust the input flow of LAr and hence control the297
cooling power. As example we show in Figure 4, the temperature measured in the gas at 3298
different heights along the detector. The cryostat is cooled down from room temperature to299
a minimum temperature measured on the gas of 170 K in about 5 days at an initial rate of300
∼2 K per hour. The filling is then performed by... at an average rate of xx g/s (l/min)301
The liquid level during filling is monitored by a chain of temperature probes evenly spaced302
11

at 4 cm spanning 1.5 meters from the bottom of the main volume to the top of the TPC303
drift cage. A coaxial capacitive level meter The nominal level during detector operation is304
set305
3.2.2. Boil off compensation and liquid purification during detector operation306
During detector operation the liquid is continuously recirculated and purified. A sub-307
merged centrifugal cryogenic pump7 operating at ∼20 lpm circulates the liquid through a308
custom built purification cartridge containing 2 separate volumes of molecular sieve8 and309
copper pellets9 to remove moisture and oxygen respectively. Some specifications of the car-310
tridge and liquid pump are listed in Table 1. The liquid argon pump recirculates about 2311
cryostat volumes per day. The unique design of the liquid pumping system is that the pump312
can be extracted from the tank without polluting the LAr of the main volume. The pump is313
confined at the bottom of a fixed vessel called pump tower which has a 350 mm diameter and314
a 3.5 meter length. The pump tower communicates with the main cryostat liquid and gas315
volume via two 25 mm diameter openings. The size of the openings can be controlled from316
the exterior via two long stem cryogenics valves to regulate the flow of LAr and to equalise317
the pressure between the pump vessel and the main volume. FIXME describe extractable318
part Shuo, also describe phase separator319
The boil-off gas argon is continuously re-condensed by a liquid nitrogen heat exchanger.320
For a given heat input, the pressure inside the cryostat main volume is thus regulated by321
setting the flow and pressure of the liquid nitrogen. The condensed boil-off is re-injected322
as liquid into the pump tower where it undergoes the liquid recirculation cycle mentioned323
above. The liquid nitrogen heat exchanger is designed to provide compensation for up to 10324
kW of heat input.325
3.3. Cryostat and cryogenic system performance326
During detector operation the cryostat is filled with a nominal height of 1590 mm of327
liquid argon. As mentioned in Section 3.1 the pressure inside the insulation volume (PIV )328
is set at a constant PIV = PATM + 5 mbar by flushing gas nitrogen. A gas spectrometer329
also continuously analyses the contents of the gas in the insulation volume in order to330
detect abnormal traces of argon above the average baseline which could indicate a failure331
of the membrane containment. Due to mechanical constraints the operating pressure of332
the cryostat’s main volume (PMV ) must always remain above that of the insulation volume333
(PIV ). In addition a burst disk is set to rupture if the main volume pressure exceeds 160334
mbarG. These constraints provide an upper and lower bound for the operating pressure335
range inside the cryostat: PIS ≤ PMV < PATM + 160 mbar. From the lowest and highest336
atmospheric pressures recorded at CERN in the past 15 years, 930 < PATM < 990 mbar,337
we set a conservative range of operation for the main volume at 995 ≤ PMV < 1090 mbar.338
Figure 5-left shows a distribution of the recorded cryostat and atmospheric pressures during339
7ACD TC34.28BASF 4A 8x12 mesh9BASF CU 0226 S 8x14MESH
12

one week of data taking. As can be seen a constant 999 ± 1.4 mbar was achieved inside the340
main volume completely decoupled from external pressure variations. Temperature probes341
distributed in different places on the CRP area measure the temperature in the gas at342
different heights above the liquid level with a precision of about 0.1 K (see Section 6 for343
more details on the temperature monitoring). The measured gradient is around 2 K/cm344
and, as shown in Figure 5-right, the temperature measured in four points on the CRP over345
a one week data taking period are uniform and stable within one degree.
960 970 980 990 1000 1010Pressure [mBar]
0
5000
10000
15000
20000
25000
30000
35000
Counts / 1 m
Bar
mean = 999.5 mBar, σ = 1.4 mBar
Main Volume
Insulation Volume
Atmospheric
98 99 100 101 102 103Temperature [K]
0
5000
10000
15000
20000
25000
30000
Counts
σ = 0.089 K
σ = 0.081 K
σ = 0.092 K
σ = 0.081 K
Figure 5: Pressure and temperatures measured over a one week period during data taking. Left: the pressureinside the cryosat main volume compared to that of the insulation and atmospheric. Right: the temperaturemeasured in 4 different points on the CRP at a distance of 2.6 cm above the LEMs. The temperature andthe pressure inside the tank are taken over the same period of time.
346
Once the cryosat is filled, the CRP motorised system together with the level meters347
allow to precisely position the frame to its nominal position and align it with respect to348
the liquid level. Both level meters and the motorised system have a precision of about 100349
microns. During operation of the experiment, the cryogenic system constantly reads out350
the level meters to maintain a constant liquid level by adding or removing small amounts of351
purified liquid argon from the phase separator. This method does not introduce any large352
fluctuations of the liquid level which is stable within the 100 micron resolution of the level353
meters. This is verified in Figure 6 where the readings of the seven level meters placed on354
the CRP are shown for an extended period of time during data taking. All show a standard355
deviation at the 100 micron level, their relative offset is understood as arising from the356
mechanical deformations of the CRP frame in cold. More details on the frame’s deformation357
and the alignment procedure are provided in Section 4.358
The total heat input to the liquid argon arising from the cryostat and from the operation359
of the cryogenic system (pumps, etc..) can be estimated by measuring the rate of evaporation360
of the boil off gas. During operation we measured a rate of xx g/s gas, which indicates a361
total heat input of xxxx W, when subtracting for the heat input from the cryogenic system362
(mainly the liquid pump) the total estimated heat input from the cryostat only is of xxx W.363
These are to be compared to the design value of the cryostat insulation performance of 300364
13

W.365
The cryogenic system is thus capable to regulate the liquid argon level to a 100 micron366
precision while keeping a constant pressure and temperature over extended period of times.367
The achievements on the liquid argon purity are discussed in Section 7.368
1594 1595 1596 1597 1598level in mm
0
2
4
6
8
10
12
14
16
norm
aliz
ed f
requency
StdDev: 40.7 um, mean: 1595.5, north
StdDev: 44.3 um, mean: 1594.9, north-east
StdDev: 46.5 um, mean: 1596.6, east
StdDev: 53.2 um, mean: 1595.1, south
StdDev: 49.9 um, mean: 1595.2, south-west
StdDev: 55.9 um, mean: 1598.1, west
StdDev: 43.0 um, mean: 1594.5, north-west
Figure 6: The level recorded by seven level meters on the CRP over a period of 6 days, fitted with normaldistributions. The respective location is indicated in the legend.
4. Description of the TPC369
Pictures of the 3× 1× 1 m3 TPC during construction and inside the cryostat370
4.1. Drift cage, cathode and high voltage feedthroughs371
The field cage consists of cathode and 19 identical field shaping rings placed 50 mm372
apart. The rings are made from a 2 mm thick stainless steel tubes 33.7 mm in diameter.373
The cathode plane is built from a ring (same as the field shapers) and small 4 mm diameter374
stainless steel pipes welded to it at the 40 mm pitch on the inside. The rings and cathode375
are interconnected with a pair of 100 MΩ HV-rated resistors (Metallux 969.11) forming a376
voltage divider chain that ensures uniform drift field inside the active TPC volume. An377
average increase of about 7% in the value of the resistance has been measured for these378
resistors at 77 K.379
The resistor-divider chain is terminated to ground outside of the cryostat via an inter-380
changeable resistor. Depending on the HV applied to the cathode, this resistor allows to set381
an appropriate voltage drop from the first field shaper (furthest from the cathode) to the382
ground as to permit electrons to continue drifting to the CRP. The entire field cage assembly383
is suspended from 8 FR4 pillars fastened to the top cap. The pillars also support the frame384
holding the 5 PMT detectors as well as a stainless steel grid (ground grid) that shields the385
14
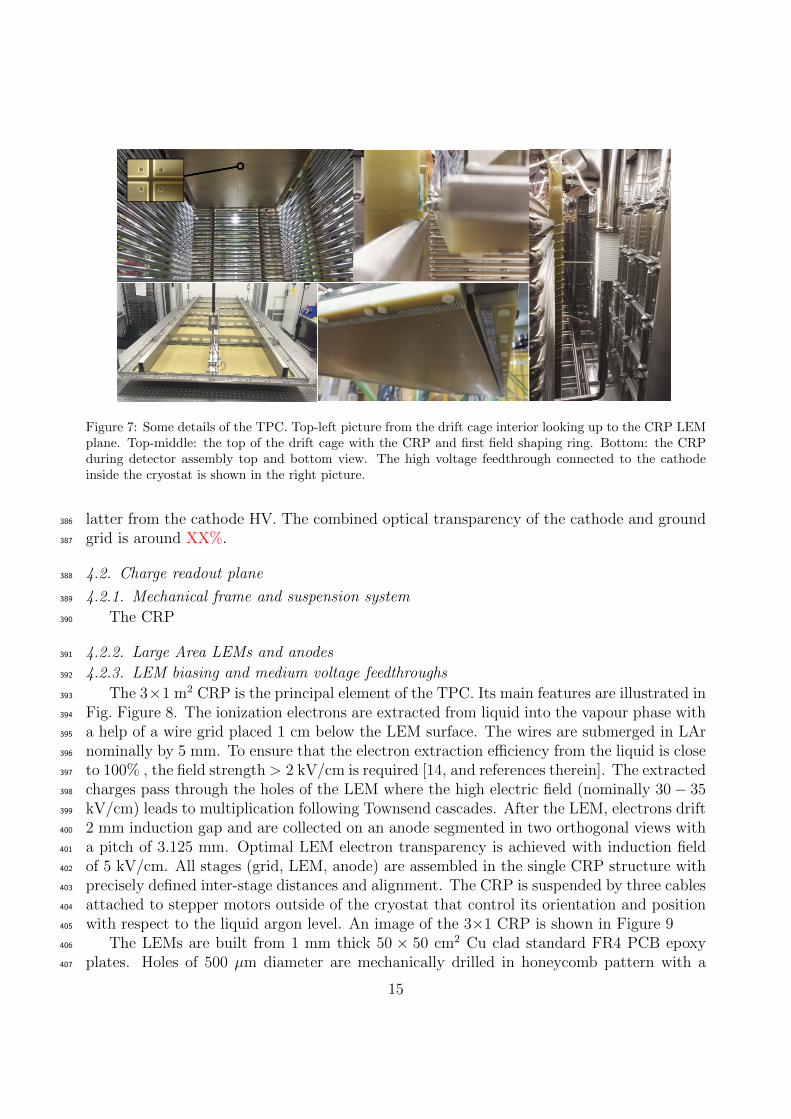
Figure 7: Some details of the TPC. Top-left picture from the drift cage interior looking up to the CRP LEMplane. Top-middle: the top of the drift cage with the CRP and first field shaping ring. Bottom: the CRPduring detector assembly top and bottom view. The high voltage feedthrough connected to the cathodeinside the cryostat is shown in the right picture.
latter from the cathode HV. The combined optical transparency of the cathode and ground386
grid is around XX%.387
4.2. Charge readout plane388
4.2.1. Mechanical frame and suspension system389
The CRP390
4.2.2. Large Area LEMs and anodes391
4.2.3. LEM biasing and medium voltage feedthroughs392
The 3×1 m2 CRP is the principal element of the TPC. Its main features are illustrated in393
Fig. Figure 8. The ionization electrons are extracted from liquid into the vapour phase with394
a help of a wire grid placed 1 cm below the LEM surface. The wires are submerged in LAr395
nominally by 5 mm. To ensure that the electron extraction efficiency from the liquid is close396
to 100% , the field strength > 2 kV/cm is required [14, and references therein]. The extracted397
charges pass through the holes of the LEM where the high electric field (nominally 30− 35398
kV/cm) leads to multiplication following Townsend cascades. After the LEM, electrons drift399
2 mm induction gap and are collected on an anode segmented in two orthogonal views with400
a pitch of 3.125 mm. Optimal LEM electron transparency is achieved with induction field401
of 5 kV/cm. All stages (grid, LEM, anode) are assembled in the single CRP structure with402
precisely defined inter-stage distances and alignment. The CRP is suspended by three cables403
attached to stepper motors outside of the cryostat that control its orientation and position404
with respect to the liquid argon level. An image of the 3×1 CRP is shown in Figure 9405
The LEMs are built from 1 mm thick 50 × 50 cm2 Cu clad standard FR4 PCB epoxy406
plates. Holes of 500 µm diameter are mechanically drilled in honeycomb pattern with a407
15

Figure 8: Illustration of the CRP region in a double phase LAr TPC. The simulated field lines in dark blueindicate those followed by the drifting charges.
Figure 9: Exploded and cut view of the 3×1 m2 CRP. The right plot shows in addition the nominal positionof the CRP with respect to the drift cage first field shaping ring and the liquid level. Distances are shownin millimeters.
pitch of 800 µm yielding about 200 holes per cm2. The Cu surfaces around each hole is408
further removed producing a 40 µm thick dielectric rim (see insert in Fig. 8). The LEM hole409
dimensions, pattern, and the rim size have been optimized as function of the LEM gain in410
[8]. Each LEM has a 4 mm border consisting of two square rings: the inner one is 2 mm411
wide rim from the copper cladding maintained at the same potential as the LEM surfaces412
and the outer is the PCB dielectric with the copper surface etched away. The function of413
this border is to provide protection against discharges around the edges of the LEM.414
The anodes are multi-layered PCBs with an area of 50 × 50 cm2 matching that of the415
LEMs. In the CRP the LEMs and anode are screwed into three identical 1×1 m2 G10 frames416
which are then mounted on a 3 × 1 m2 stainless steel structure. Each G10 support houses417
four LEM-anode ”sandwiches” which are fixed together with insulating (peek) screws. The418
LEM-anode distance is ensured with a precisely machined 2 mm thick peek pillars. The419
16

distance between each adjacent LEM-anode sandwiches is 0.5 mm. Taking into account the420
border of each LEM gives an inactive region of 8.5 mm wide.421
The extraction grid is built from 100 µm diameter stainless steel wires tensed in both x422
and y directions. The wire pitch of 3.125 mm matches that of the anode readout strips in423
order to avoid charge shadowing by the grid wires and provide a uniform extraction field.424
The wires are soldered on in groups of 32 on a pair of independent tensing pads. Each425
pad consist of a PCB fixed on a mechanical wire holder. The PCB hosts the high voltage426
connection and 32 soldering pads with 200 µm grooves for wire positioning. During soldering427
the wires had been tensed with 150 g weights. The precision on wire pitch after soldering428
has been verified with a microscope to be better than 50 µm. The mechanical wire holders429
housing the PCBs are designed to allow for the adjustment of the tension for each group430
of 32 wires. The holders are mounted along the outer perimeter of the CRP. Describe the431
weave???432
TODO electrical connection of anodes figure? The anodes are interconnected with short433
jumper cable to form 3 m long (320 channels) and 1 m (960 channels) long readout strips in434
two collection views... One side is readout the other side is pulsed. The capacitance of the435
anode strips is an important consideration for the electronic noise of the charge amplifiers.436
The 2D pattern formed by the strips in the two collection views on the anode has been437
optimized to limit the total strip capacitance to 160 pF/m, while ensuring also that charge438
is evenly split between the two, independently of the azimuthal angle of particles traversing439
the TPC [7]. It should be noted here that this 160 pF/m capacitance of the anode is not a440
simple capacitance of a strip to a ground, but it rather comes from the inter-strip capacitive441
couplings. This fact carries some interesting implications for the noise characteristics of the442
readout electronics as will be discussed later.443
TODO: Describe some details of HV connections on the CRP444
TODO445
The LEMs and anodes have been produced using industrial PCB manufacturer Eltos446
S.p.A. A quality assurance and control (QA/QC) procedure was established...447
LEM metrology.448
• LEM, anode QA449
• hv connections on the CRP450
• extraction grid QA manufacturing etc.. The extraction grid consists of individual pads451
of 32 wires tensioned across both the three meter and one meter directions. The wires452
are pre- tensioned and soldered on the pads one by one. Altogether we had to solder453
the wires on 30 pads for the 1 meter direction and 10 for the other.454
• QA of CRP (bath test, photogrammetry, results)455
4.3. Photon detection system456
TPB coating (concentration, uniformity, QA, etc...)457
17
The Ar scintillation light is detected with 5 cryogenic 8 inch photo-multiplier tubes458
(Hamamatsu R5912 - 02) placed below the ground grid underneath the cathode. The pho-459
tocathode of these detectors is not sensitive to the photons below visible wavelengths and an460
organic wavelength shifter, tetraphenyl butadiene (TPB), is used. Three of the five PMTs461
were coated with TPB by evaporating it directly on the PMT glass window (concentration462
0.x mg/cm2). While for the other two, the coating was applied on transparent acrylic plates463
(concentration??? mg/cm2) which were then mounted on top of the photo-detectors.464
The PMT signals are acquired by an 8-channel commercial digitizer (CAEN ADC V1720)465
with 12 bit resolution and 250 MHz sampling rate. During the TPC operation, a time466
window of 1 ms — fully covering the maximal the drift time of electrons from the cathode467
to the anode — is read out in order to collect the light from primary (S1) and secondary468
(S2) scintillation. The latter is coming from the electroluminescence of electrons in the469
gas traversing the high E-field regions in the CRP (primarily extraction and amplification470
regions). The data acquisition system can be operated with an the external trigger provided471
by the cosmic ray trigger counters or a pulse generator (random trigger). The readout can472
in addition be triggered internally by setting an adjustable thresholds on all the channels473
in coincidence. This light-generated trigger could also be distributed to the charge-readout474
electronics.475
5. Charge Readout scheme and data processing476
5.1. Cold analog Front Ends and signal feedthrough477
5.2. Front Ends cards and ASIC characteristics478
5.3. Digital back end and data acquisition479
6. Ancillary instrumentation and slow control480
6.1. level monitoring and feedback to charge readout plane suspension481
(both coax and plate) principle of operation, electronic schematics, tests, precisions,...482
6.2. Cryogenic cameras483
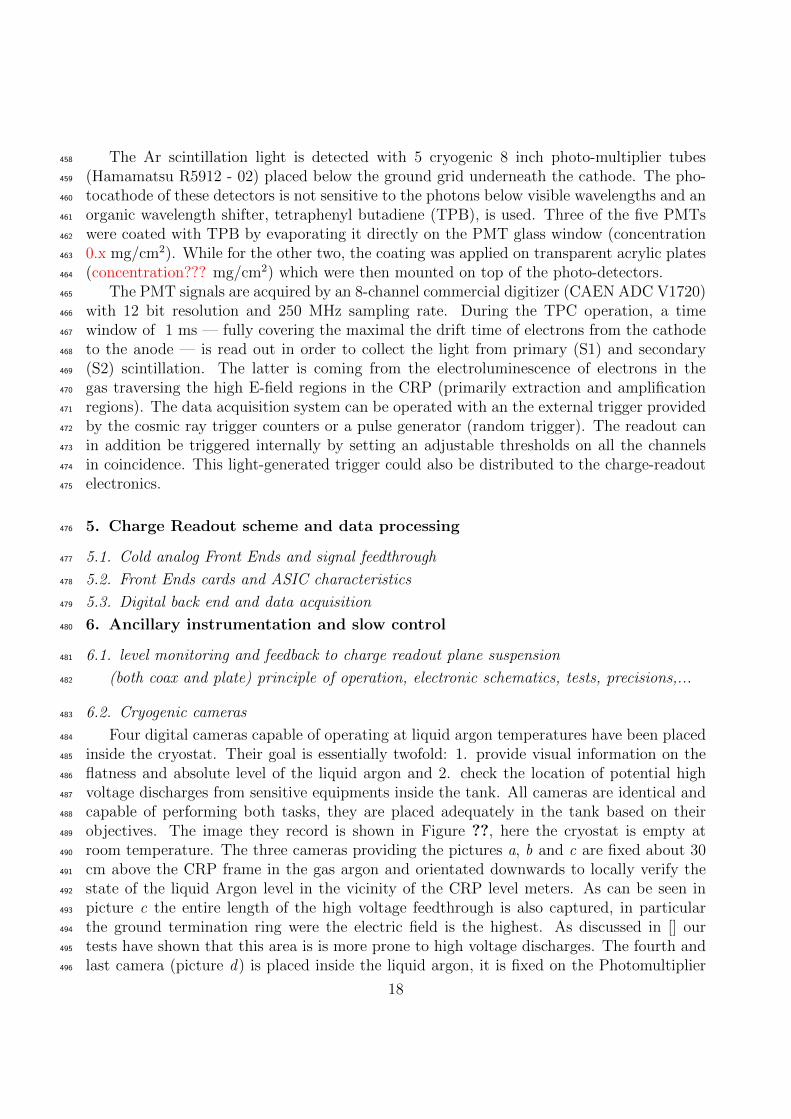
Four digital cameras capable of operating at liquid argon temperatures have been placed484
inside the cryostat. Their goal is essentially twofold: 1. provide visual information on the485
flatness and absolute level of the liquid argon and 2. check the location of potential high486
voltage discharges from sensitive equipments inside the tank. All cameras are identical and487
capable of performing both tasks, they are placed adequately in the tank based on their488
objectives. The image they record is shown in Figure ??, here the cryostat is empty at489
room temperature. The three cameras providing the pictures a, b and c are fixed about 30490
cm above the CRP frame in the gas argon and orientated downwards to locally verify the491
state of the liquid Argon level in the vicinity of the CRP level meters. As can be seen in492
picture c the entire length of the high voltage feedthrough is also captured, in particular493
the ground termination ring were the electric field is the highest. As discussed in [] our494
tests have shown that this area is is more prone to high voltage discharges. The fourth and495
last camera (picture d) is placed inside the liquid argon, it is fixed on the Photomultiplier496
18
supporting frame below the ground grid at the center of the active volume and orientated497
upwards capturing most of the CRP LEMs from a distance of about 1.2 meters.498
The main selection criteria for the camera was its ability to undergo long term operations499
immersed in liquid argon while still maintaining the same image quality and without having500
to apply a local heat source that could induce formation of bubbles. Low power consumption,501
cost-effectiveness, size, and the capability to be readout at a distance of a few meters were502
also important aspects. A solution satisfying the above requirements was found with the503
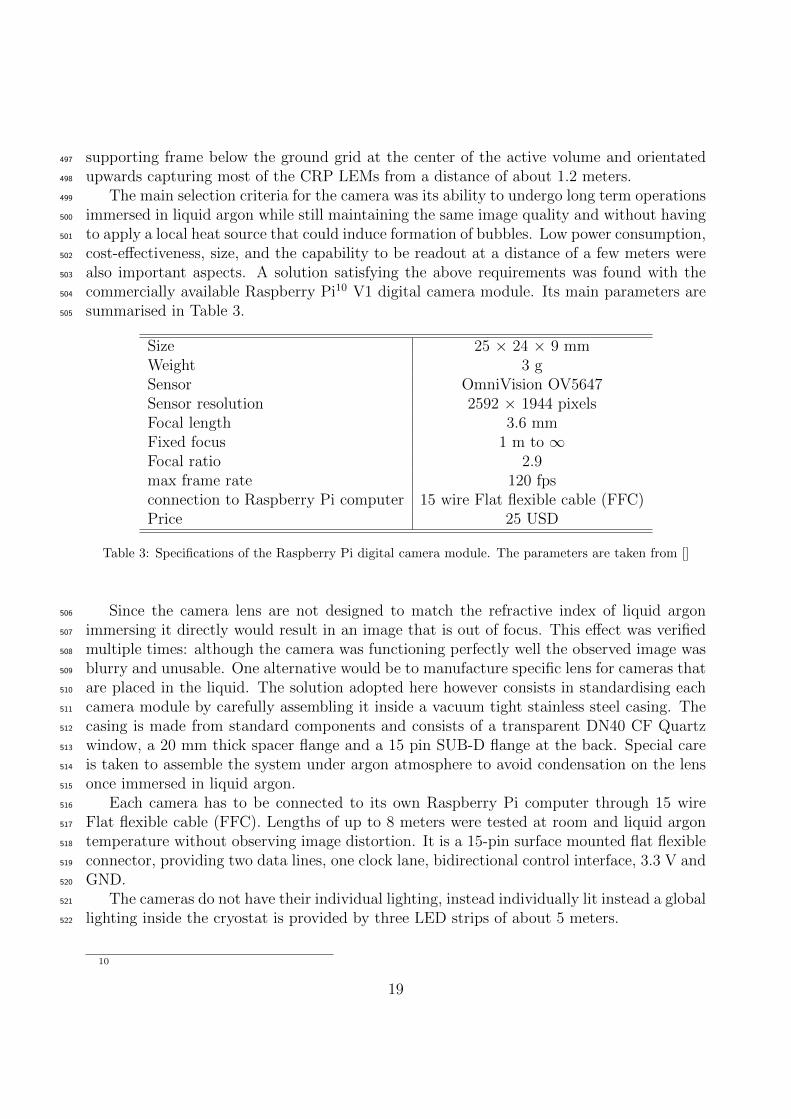
commercially available Raspberry Pi10 V1 digital camera module. Its main parameters are504
summarised in Table 3.505
Size 25 × 24 × 9 mmWeight 3 gSensor OmniVision OV5647Sensor resolution 2592 × 1944 pixelsFocal length 3.6 mmFixed focus 1 m to ∞Focal ratio 2.9max frame rate 120 fpsconnection to Raspberry Pi computer 15 wire Flat flexible cable (FFC)Price 25 USD
Table 3: Specifications of the Raspberry Pi digital camera module. The parameters are taken from []
Since the camera lens are not designed to match the refractive index of liquid argon506
immersing it directly would result in an image that is out of focus. This effect was verified507
multiple times: although the camera was functioning perfectly well the observed image was508
blurry and unusable. One alternative would be to manufacture specific lens for cameras that509
are placed in the liquid. The solution adopted here however consists in standardising each510
camera module by carefully assembling it inside a vacuum tight stainless steel casing. The511
casing is made from standard components and consists of a transparent DN40 CF Quartz512
window, a 20 mm thick spacer flange and a 15 pin SUB-D flange at the back. Special care513
is taken to assemble the system under argon atmosphere to avoid condensation on the lens514
once immersed in liquid argon.515
Each camera has to be connected to its own Raspberry Pi computer through 15 wire516
Flat flexible cable (FFC). Lengths of up to 8 meters were tested at room and liquid argon517
temperature without observing image distortion. It is a 15-pin surface mounted flat flexible518
connector, providing two data lines, one clock lane, bidirectional control interface, 3.3 V and519
GND.520
The cameras do not have their individual lighting, instead individually lit instead a global521
lighting inside the cryostat is provided by three LED strips of about 5 meters.522
10
19
Although all four cameras are identical they are hence placed in strategic positions based523
on their use as indicated in Figure ??524
Sufficient lighting is required for the first goal525
The first goal requires sufficient lighting inside the tank which is provided by LED strips526
of five meter length. The strips means hence can only be monitored under certain operating527
conditions when any light sensitive equipment is off. The second set of cameras on the528
contrary require a dark environment and can be operated continuously.529
requires no lighting and the cameras can be left on for continuous monitoring.530
when light sensitive equipment (such as PTMs) is switched off. The second531
surface during filling and detector operation532
The lighting inside the tank is provided by xx meters LED strips powered by 48 V DC533
power supplies. Points 1 and 2 require534
6.3. Slow control back-end535
esaily scalable SC system536
7. Dector commissioning and first data537
7.1. Stability of liquid level and charge readout plane adjustment538
7.2. high voltage system settings and stability539
7.3. Charge readout performance and response540
7.3.1. Electronic noise study541
7.3.2. Response to an injected pulse542
3m vs 1 m strip, impedance, pulsing , signal shape etc..543
7.4. Photon detection system performance544
7.5. First data545
7.5.1. Electroluminescence and evidence for charge extraction546
7.5.2. Observation of first cosmic muons with gain547
References548
[1] R. Acciarri, et al., Long-Baseline Neutrino Facility (LBNF) and Deep Underground Neutrino Experi-549
ment (DUNE)arXiv:1601.02984.550
[2] S. Agarwalla, et al., LAGUNA-LBNO Part 1: Liquid Argon Detectors,551
http://laguna.ethz.ch:8080/Plone/deliverables/laguna-lbno-284518-deliverables (2014).552
[3] A. Bondar, A. Buzulutskov, A. Grebenuk, D. Pavlyuchenko, Y. Tikhonov, A. Breskin, Thick gem versus553
thin gem in two-phase argon avalanche detectors, JINST 3 (07) (2008) P07001.554
URL http://stacks.iop.org/1748-0221/3/i=07/a=P07001555
[4] A. Badertscher., et al., Stable operation with gain of a double phase Liquid Argon LEM-TPC with a556
1 mm thick segmented LEM, J. Phys. Conf. Ser.arXiv:1010.2482.557
[5] A. Badertscher, A. Curioni, U. Degunda, L. Epprecht, A. Gendotti, et al., First operation and perfor-558
mance of a 200 lt double phase LAr LEM-TPC with a 40×76 cm2 readout, JINST 8 (2013) P04012.559
arXiv:1301.4817, doi:10.1088/1748-0221/8/04/P04012.560
[6] L. Agostino, et al., LBNO-DEMO: Large-scale neutrino detector demonstrators for phased performance561
assessment in view of a long-baseline oscillation experimentarXiv:1409.4405.562
20

[7] C. Cantini, et al., Long-term operation of a double phase LAr LEM Time Projection Chamber563
with a simplified anode and extraction-grid design, JINST 9 (2014) P03017. arXiv:1312.6487,564
doi:10.1088/1748-0221/9/03/P03017.565
[8] C. Cantini, et al., Performance study of the effective gain of the double phase liquid Argon LEM566
Time Projection Chamber, JINST 10 (03) (2015) P03017. arXiv:1412.4402, doi:10.1088/1748-567
0221/10/03/P03017.568
[9] B. M. Gushchin, et al., Emission of hot electrons from liquid and solid argon and xenon, Sov. Phys.569
JETP 55(5) (1982) 860862.570
[10] F. Resnati, Modeling, design and first operation of the novel double phase LAr LEM-TPC detector,571
Ph.D. thesis, ETH Zurich (2012).572
URL http://dx.doi.org/10.3929/ethz-a-007582292573
[11] A. Stahl, et al., Expression of Interest for a very long baseline neutrino oscillation experiment (LBNO).574
[12] R. Acciarri, et al., Long-Baseline Neutrino Facility (LBNF) and Deep Underground Neutrino Experi-575
ment (DUNE) Conceptual Design Report, Volume 4 The DUNE Detectors at LBNFarXiv:1601.02984.576
[13] A. H. B. N. J. R. R. R. J. S. D. Montanari, M. Adamowski, T. Tope, Performance and Results of the577
LBNE 35 Ton Membrane Cryostat Prototype, Phys. Procedia 67 (2015) 308–313.578
[14] A. Bondar, A. Buzulutskov, A. Grebenuk, D. Pavlyuchenko, R. Snopkov, Y. Tikhonov, Two-phase579
argon and xenon avalanche detectors based on gas electron multipliers, Nucl. Instrum. Meth. A556580
(2006) 273–280. arXiv:physics/0510266, doi:10.1016/j.nima.2005.10.102.581
21