a 3d velocity model for earthquake location in campi ... 3d velocity model for earthquake location...
TRANSCRIPT

A 3D velocity model for earthquake locationin Campi Flegrei area: application
to the 1982-84 uplift event
C. Satriano1, A. Zollo1, P. Capuano2,3, G. Russo1, T. Vanorio4,G. Caielli5, L. Lovisa6, M. Moretti7
1 Dipartimento di Scienze Fisiche, Università Federico II, Napoli, Italy 2 Dipartimento di Scienze e Tecnologie per l’Ambiente ed il Territorio, Università del Molise, Isernia, Italy
3 Osservatorio Vesuviano, INGV, Napoli, Italy4 Géosciences Azur, CNRS, Université de Nice, Sophie Antinopolies, Valbonne, France
5 Istituto per la Dinamica dei Processi Ambientali, CNR, Milano, Italy6 Istituto Nazionale di Oceanografia e Geofisica Sperimentale, Trieste, Italy
7 Centro Nazionale Terremoti, INGV, Roma, Italy
Abstract: The uplift crisis of the 1982-1984 in the Campi Flegrei area underli-ned the importance of seismic surveillance for this volcanic caldera. One of thekey elements for an effective seismic network is to make use of a reliable velo-city model for earthquake location.In the present work we will discuss criteria for the construction and validationof a new 3D P-wave velocity model for earthquake location in the CampiFlegrei area built from the integration of two high-resolution 3D tomographicimages of the region.The model is used for locating a group of earthquakes from the uplift event ofthe 1982-1984.
INTRODUCTION
The Campi Flegrei (CF) caldera is an active volcanic system located at the westof the city of Naples. Like other calderas, CF periodically experiences significantunrest episodes which include ground deformations and seismic swarms. Never-theless ground deformations in CF may reach values without equal in the world.Two marked ground uplift took place in the area in the periods 1970-1972 and1982-1984. The last one, began in the second half of 1982 and was characte-rized by a total vertical displacement of 1.8 m (Barberi et al., 1984), togetherwith a seismic swarm of more that 15,000 shallow microearthquakes with amaximum duration magnitude of 4.0 (Zollo and De Natale, 1986).
38

Aster and Mayer (1988) first made a joint tomographic and earthquake loca-tion study, using 228 events occurred during the 1982-1984 crisis. Recently(Capuano et al., this issue) a database of 3C waveforms containing severalhundreds microearthquakes have been reconstructed and the whole waveformdata base have been re-picked.Vanorio et al. (2005) upgraded the original dataset by using 1209 earthquakesand performed a new joint inversion of earthquake location and P and S velo-city model. They interpreted the resulting velocity model by using experimen-tal measurements of rock physical properties.The SERAPIS experiment (Zollo et al., 2002) has given a new insight into thestructure of the CF area. Zollo et al. (2003) and Judenherc and Zollo (2004)obtained high-resolution 3D P wave velocity images from the inversion of theactive seismic data (~90,000 P wave first arrival times), evidencing several vol-canic structures like the buried rim of the Campi Flegrei caldera.One of the most important components of volcanic surveillance is the recor-ding and analysis of seismic activity. Due to the strong 3D structural variationsgenerally characterizing the volcanic areas, in order to obtain reliable earth-quake locations it is important not only to have a dense network with a goodazimuthal coverage deployed on the area but also a valid velocity model.In this paper, starting from the results of tomographic studies, we have deve-loped and validated a 3D P-wave velocity model for earthquake location in CFarea. This model have been used to locate the seismicity of the 1982-1984uplift episode.
CONSTRUCTION OF THE MODEL
We constructed a 16 x 20 x 8 km 3D P-wave model for the CF area and sur-roundings, centered on the Bay of Pozzuoli, starting from two 3D tomogra-phic images. The first is a 250m-cell P wave tomography of the Bay ofPozzuoli obtained by Zollo et al. (2003); the second is a 1000m-cell image ofthe Gulf of Naples obtained by Judenherc and Zollo (2004).Due to the resolution of the tomographic procedure, both the starting modelshave cells where the velocity value is not defined. However, for event location,the velocity model must be defined everywhere in the search volume so thatthe location algorithm can look for all the possible ray paths.In order to define a complete velocity model for the CF area we proceed asfollows.First we select the interested area, then the large scale model (1000m) is re-sam-pled at 250m, finally the two model are merged together using the values of thelarge scale model where the 250m values were not defined. Then, for the cellswhich still remained undefined, we use a mean value for that particular depth.The resulting model was filtered using a cosine filter with one cell width(250m), in order to avoid abrupt changes in velocity from a cell to another and,
A 3D velocity model for earthquake location in Campi Flegrei area: application to the 1982-84…
39
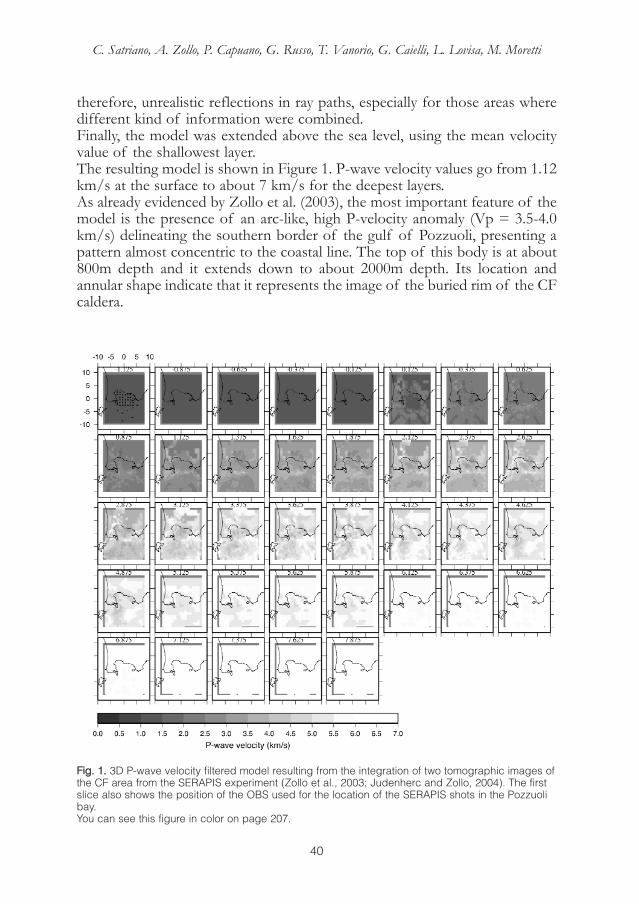
therefore, unrealistic reflections in ray paths, especially for those areas wheredifferent kind of information were combined.Finally, the model was extended above the sea level, using the mean velocityvalue of the shallowest layer.The resulting model is shown in Figure 1. P-wave velocity values go from 1.12km/s at the surface to about 7 km/s for the deepest layers.As already evidenced by Zollo et al. (2003), the most important feature of themodel is the presence of an arc-like, high P-velocity anomaly (Vp = 3.5-4.0km/s) delineating the southern border of the gulf of Pozzuoli, presenting apattern almost concentric to the coastal line. The top of this body is at about800m depth and it extends down to about 2000m depth. Its location andannular shape indicate that it represents the image of the buried rim of the CFcaldera.
C. Satriano, A. Zollo, P. Capuano, G. Russo, T. Vanorio, G. Caielli, L. Lovisa, M. Moretti
40
FFiigg.. 11.. 3D P-wave velocity filtered model resulting from the integration of two tomographic images ofthe CF area from the SERAPIS experiment (Zollo et al., 2003; Judenherc and Zollo, 2004). The firstslice also shows the position of the OBS used for the location of the SERAPIS shots in the Pozzuolibay.You can see this figure in color on page 207.

The Italian Oil Agency (AGIP) drilled five 2-3 km deep boreholes on the land-side of the caldera for geothermal exploration purposes (AGIP, 1987). Litho-stratigrafic and sonic log data indicate that the caldera rim is formed by asequence of compacted tuffs, tuffs with interbedded lavas and thermo meta-morphic rocks, the latter of which are encountered at about 2-2.5 km depth.P-wave log velocities show a variation with depth (2.7-3 km/s at 0.8-1 kmdepth, 3.6-4.2 km/s at 2-2.2 km depth) which is consistent with our velocitymodel in the same depth range.
VERIFICATION OF THE 3D VELOCITY MODEL
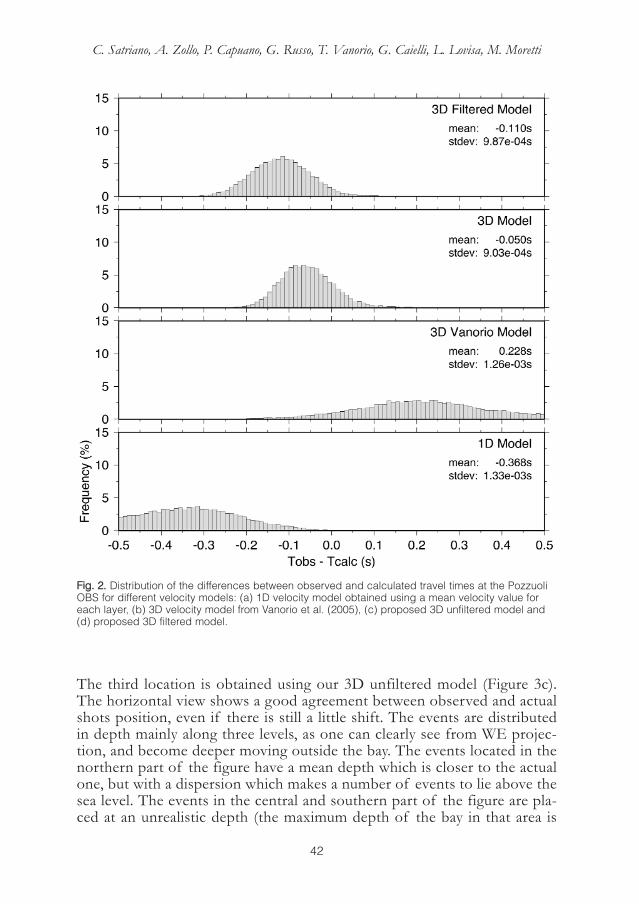
We evaluated the quality of the constructed velocity model looking at the dif-ferences between observed and calculated travel times for the shots in thePozzuoli bay from the SERAPIS experiment (Zollo et al., 2002); then we triedto locate the shots using the proposed model.The travel times are calculated using a method based on the finite differencesolution of the eikonal equation (Podvin and Lecomte, 1991), which is validfor a 3D heterogeneous medium.Figure 2 shows the distribution of the differences between observed and cal-culated travel times using different models. We make a comparison between a1D model, obtained calculating the mean value of each layer, the 3D velocitymodel obtained by Vanorio et al. (2005), our proposed 3D unfiltered modeland the 3D filtered model.Both the 1D model and the Vanorio model present a highly spread distribu-tion of time residuals and a very large mean value (-0.37s and 0.23s, respecti-vely). The 3D unfiltered model still present a bias (-0.05s), but the distributionof residual is very narrow, which indicates that actual travel times are betterreproduced. The 3D filtered model presents a worse bias (-0.11s), but a simi-lar distribution.We verify the consistency of our model also by comparing the location of theSERAPIS shots using these four models computed by NonLinLoc program(Lomax et al., 2000) to obtain probabilistic location using a non-linear globalsearch methods. The results of location are shown in Figure 3. The black starsare the located events; the grey dots show the actual position of the shots.Figure 3a shows the location obtained using the 1D model. The shots path isquite well reproduced but there is a shift in horizontal position that becomeslarger moving inward the Pozzuoli bay. All the events are located around 1 kmdepth with a little dispersion. Nevertheless we are locating very shallow events(in Figure 3 we show the mean event depth which is around 10 meters).Figure 3b shows the location obtained with the 3D Vanorio model. The shotspath is only vaguely reproduced. Events are very scattered in depth withoutshowing an evident mean value. A great quantity of events (21%) is locatedabove the sea level.
A 3D velocity model for earthquake location in Campi Flegrei area: application to the 1982-84…
41
The third location is obtained using our 3D unfiltered model (Figure 3c).The horizontal view shows a good agreement between observed and actualshots position, even if there is still a little shift. The events are distributedin depth mainly along three levels, as one can clearly see from WE projec-tion, and become deeper moving outside the bay. The events located in thenorthern part of the figure have a mean depth which is closer to the actualone, but with a dispersion which makes a number of events to lie above thesea level. The events in the central and southern part of the figure are pla-ced at an unrealistic depth (the maximum depth of the bay in that area is
C. Satriano, A. Zollo, P. Capuano, G. Russo, T. Vanorio, G. Caielli, L. Lovisa, M. Moretti
42
FFiigg.. 22.. Distribution of the differences between observed and calculated travel times at the PozzuoliOBS for different velocity models: (a) 1D velocity model obtained using a mean velocity value foreach layer, (b) 3D velocity model from Vanorio et al. (2005), (c) proposed 3D unfiltered model and(d) proposed 3D filtered model.

around 300m). This is probably due to the lower density of OBS in this area(as one can see from Figure 1), which implies a bad quality of the locationin terms of the 68% confidence ellipsoid major semi-axis length (Lomax etal., 2001).Figure 3d shows the location results using the 3D filtered model. The hori-zontal pattern is accurately reproduced; the dispersion in depth is stronglyreduced with many events around the actual mean depth in the area wherethe location is more accurate. Again, as we move outward the bay, the qua-lity of the location decreases and the depth estimate gets worse.
A 3D velocity model for earthquake location in Campi Flegrei area: application to the 1982-84…
43
FFiigg.. 33.. SERAPIS shots locations using the four models described in Figure 2: 1D (a), Vanorio (b), 3Dunfiltered (c), 3D filtered (d). The grey dots show the actual shot positions in the plane view, whilethey indicate a mean depth in the vertical views. The black stars are the located shots.

Figure 4 shows the distribution of the values of the 68% confidence ellipsoidmajor semi-axis length as a function of the position along the N-S direction.One can see how, for both the unfiltered and the filtered model, the quality ofthe location improves moving inward the bay (highest values of Y).
C. Satriano, A. Zollo, P. Capuano, G. Russo, T. Vanorio, G. Caielli, L. Lovisa, M. Moretti
44
FFiigg.. 44.. Length of the major semi-axis of the 68% confidence ellipsoid as a function of the Y (N-S)position for the four models described in Figure 2.
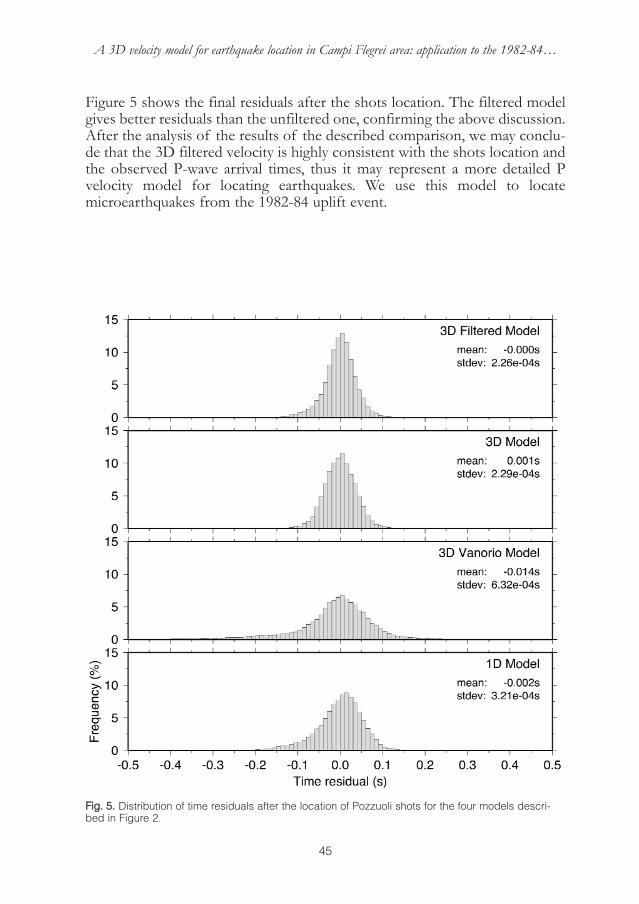
Figure 5 shows the final residuals after the shots location. The filtered modelgives better residuals than the unfiltered one, confirming the above discussion.After the analysis of the results of the described comparison, we may conclu-de that the 3D filtered velocity is highly consistent with the shots location andthe observed P-wave arrival times, thus it may represent a more detailed Pvelocity model for locating earthquakes. We use this model to locatemicroearthquakes from the 1982-84 uplift event.
A 3D velocity model for earthquake location in Campi Flegrei area: application to the 1982-84…
45
FFiigg.. 55.. Distribution of time residuals after the location of Pozzuoli shots for the four models descri-bed in Figure 2.

LOCATION OF THE EARTHQUAKES FROM THE 1982-84 UPLIFT EVENT
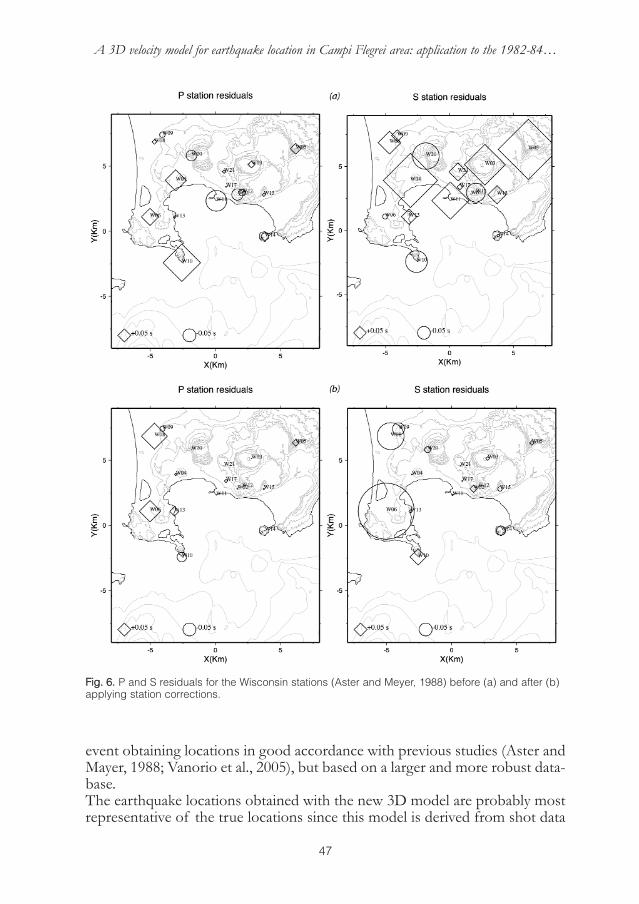
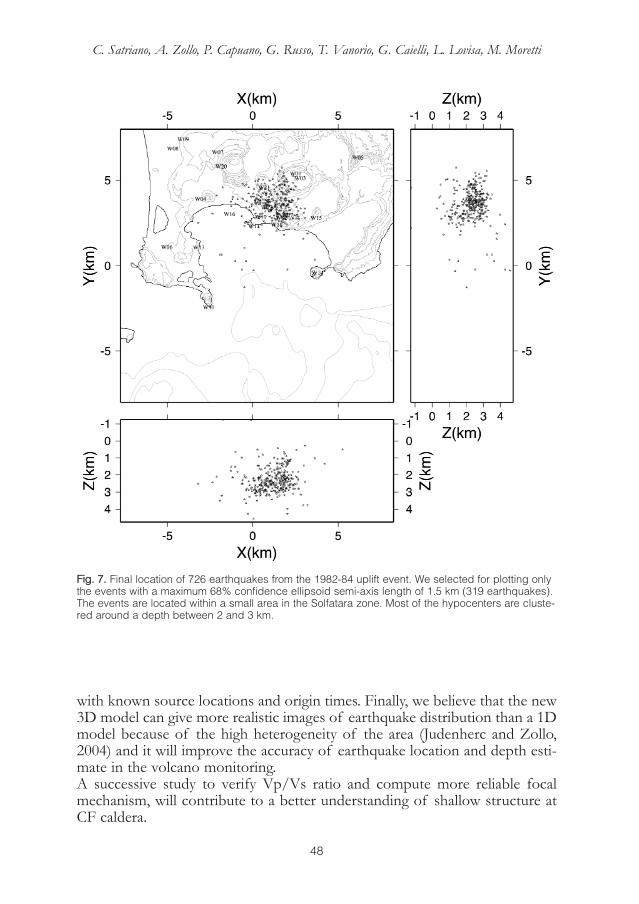
As a contribute to monitor the seismic activity accompanying the 1982-1984crisis, the University of Wisconsin began a field experiment deploying a tem-porary network consisting of 21 three-component digital short-period sei-smometers. Data were recorded at 100 or 200 Hz sampling rates and 1 Hzgeophones were used (Aster and Meyer, 1988). The seismic monitoring net-work recorded more than 15,000 events. Events were clustered in time, mainlyconcentrated in the Pozzuoli-Solfatara area and had maximum durationmagnitudes of 4.0 (De Natale and Zollo, 1986).After the reconstruction of waveforms database and phase pickings (Capuanoet al., this issue), Vanorio et al. (2005) used these database joint with the sei-smicity occurred in the previous period, recorded by the OsservatorioVesuviano seismic network, to produce tomographic maps.We started from a dataset of 726 events from January 1st trough April 15th1984, with a total number of 4237 P and 2837 S readings. For the location weused a fixed Vp/Vs ratio of 1.68; this is a reasonably good mean value for theinferred Vp/Vs ratio distribution in the area (Vanorio et al, 2005). A moreconsistent investigation of Vp/Vs ratio will be dealt in an upcoming study.After the first location, we calculated the station corrections as the mean resi-dual value for each station. We iterated this process two times. Figure 6 showsstation residuals for P and S readings before applying station corrections (a)and after the last iteration (b). It is evident that the station residuals are highlyreduced, except for two stations (W06, W08) for which, anyway, there are veryfew readings (13 and 8, respectively).Figure 7 shows the final location result. We selected for plotting only theevents with a maximum 68 per cent confidence ellipsoid semi-axis length of1.5 km (319 earthquakes). The events are located within a small area in theSolfatara zone. Most of the hypocenters are clustered around a depth between2 and 3 km. These results are in good accordance with the localization obtai-ned by Vanorio et al. (2005) but events appear less scattered, especially in theW-E direction.
DISCUSSION
We have constructed a 3D velocity model (Figure 1) for earthquake locationin CF area and surroundings starting from two high-resolution tomographicimages obtained after the SERAPIS seismic experiment.We confirm that the 3D velocity model reproduce P waves travel times and loca-tion for the SERAPIS shots, also comparing with results obtained using a 1Dmean model and the 3D tomographic model proposed by Vanorio et al. (2005).This new 3D velocity model has been used to obtain non-linear global searchearthquakes locations selecting 726 earthquakes from the 1982-1984 CF uplift
C. Satriano, A. Zollo, P. Capuano, G. Russo, T. Vanorio, G. Caielli, L. Lovisa, M. Moretti
46
event obtaining locations in good accordance with previous studies (Aster andMayer, 1988; Vanorio et al., 2005), but based on a larger and more robust data-base.The earthquake locations obtained with the new 3D model are probably mostrepresentative of the true locations since this model is derived from shot data
A 3D velocity model for earthquake location in Campi Flegrei area: application to the 1982-84…
47
FFiigg.. 66.. P and S residuals for the Wisconsin stations (Aster and Meyer, 1988) before (a) and after (b)applying station corrections.
with known source locations and origin times. Finally, we believe that the new3D model can give more realistic images of earthquake distribution than a 1Dmodel because of the high heterogeneity of the area (Judenherc and Zollo,2004) and it will improve the accuracy of earthquake location and depth esti-mate in the volcano monitoring.A successive study to verify Vp/Vs ratio and compute more reliable focalmechanism, will contribute to a better understanding of shallow structure atCF caldera.
C. Satriano, A. Zollo, P. Capuano, G. Russo, T. Vanorio, G. Caielli, L. Lovisa, M. Moretti
48
FFiigg.. 77.. Final location of 726 earthquakes from the 1982-84 uplift event. We selected for plotting onlythe events with a maximum 68% confidence ellipsoid semi-axis length of 1.5 km (319 earthquakes).The events are located within a small area in the Solfatara zone. Most of the hypocenters are cluste-red around a depth between 2 and 3 km.
REFERENCES
AGIP (1987). Geologia e Geofisica del Sistema Geotermico dei Campi Flegrei. ServiziCentrali per l’Esplorazione, SERG-MMESG, San Donato.
Aster R. C., Meyer R. P. (1988). Three-dimensional velocity structure and hypocenter dis-tribution in the Campi Flegrei caldera, Italy. Tectonophysics, 149, 195-218.
Barberi F., Corrado G., Innocenti F., Luongo G. (1984). Phlegraen Fields 1982-1984: Briefchronicle of a volcano emergency in a densely populated area. Bull. Volcanol., 47, 175-85.
Capuano P., Russo G., Vanorio T., Prevete R., Auger E., Bonagura M., Caielli G.,Convertito V., Damiano N., D’Auria L., Emolo A., Lovisa L., Moretti M. (2006). 1984Campi Flegrei seismic waveforms compilation, in Geophysical Exploration of the CampiFlegrei (Southern Italy) Caldera’ Interiors: Data, Methods and Results, edited by A. Zollo, P.Capuano, M. Corciulo, pp. 15-24 , doppiavoce, Naples, Italy.
De Natale G., Zollo A. (1986). Statistical analysis and clustering features of thePhlegraean Fields earthquake sequence. Bull. Seismol. Soc. Am., 76(3), 801-14.
Judenherc S., Zollo A. (2004). The Bay of Naples (southern Italy): Constraints on the vol-canic structures inferred from a dense seismic survey. J. Geophys. Res., 109, B10312,doi:10.1029/2003JB002876.
Lomax A. J., Virieux P., Volant & Berge C. (2000). Probabilistic earthquake location in 3Dand layered models: introduction of a Metropolis-Gibbs method and comparison withlinear locations, in Advances in Seismic Event Location, edited by C.H. Thurber & N.Rabinowitz, pp. 101-34, Kluwer, Amsterdam.
Lomax A., Zollo A., Capuano P., Virieux J. (2001). Precise, absolute earthquake locationunder Somma-Vesuvius volcano using a new three-dimensional velocity model. Geophys.J. Int., 146, 313-31.
Podvin P., Lecomte I. (1991). Finite difference computations of traveltimes in very con-trasted velocity models: a massively parallel approach and its associated tools. Geophys.J. Int., 105, 271-84.
Vanorio T., Virieux J., Capuano P., Russo G. (2005). Three-dimensional seismic tomographyfrom P wave and S wave microearthquake travel times and rock physics characterizationof the Campi Flegrei Caldera. J. Geophys. Res., 110(B03), doi:10.1029/2004JB003102.
Zollo A., Virieux J., Makris J., Auger E., Boschi L., Capuano P., Chiarabba C., D’Auria L.,De Franco R., Judenherc S., Michelini A., Musacchio G. (2002). High resolution seismicimaging of the Campi Flegrei caldera, Southern Italy. Eos Trans. AGU, 83(47).
Zollo A., Judenherc S., Auger E., D’Auria L., Virieux J., Capuano P., Chiarabba C., deFranco R., Makris J., Michelini A., Musacchio G. (2003). Evidence for the buried rim ofCampi Flegrei caldera from 3-d active seismic imaging. Geophys. Res. Lett., 30(19), 2002,doi:10.1029/2003GL018173.
A 3D velocity model for earthquake location in Campi Flegrei area: application to the 1982-84…
49