1-d velocity model for use by the sansn in earthquake location · 1-d velocity model for use by the...
TRANSCRIPT
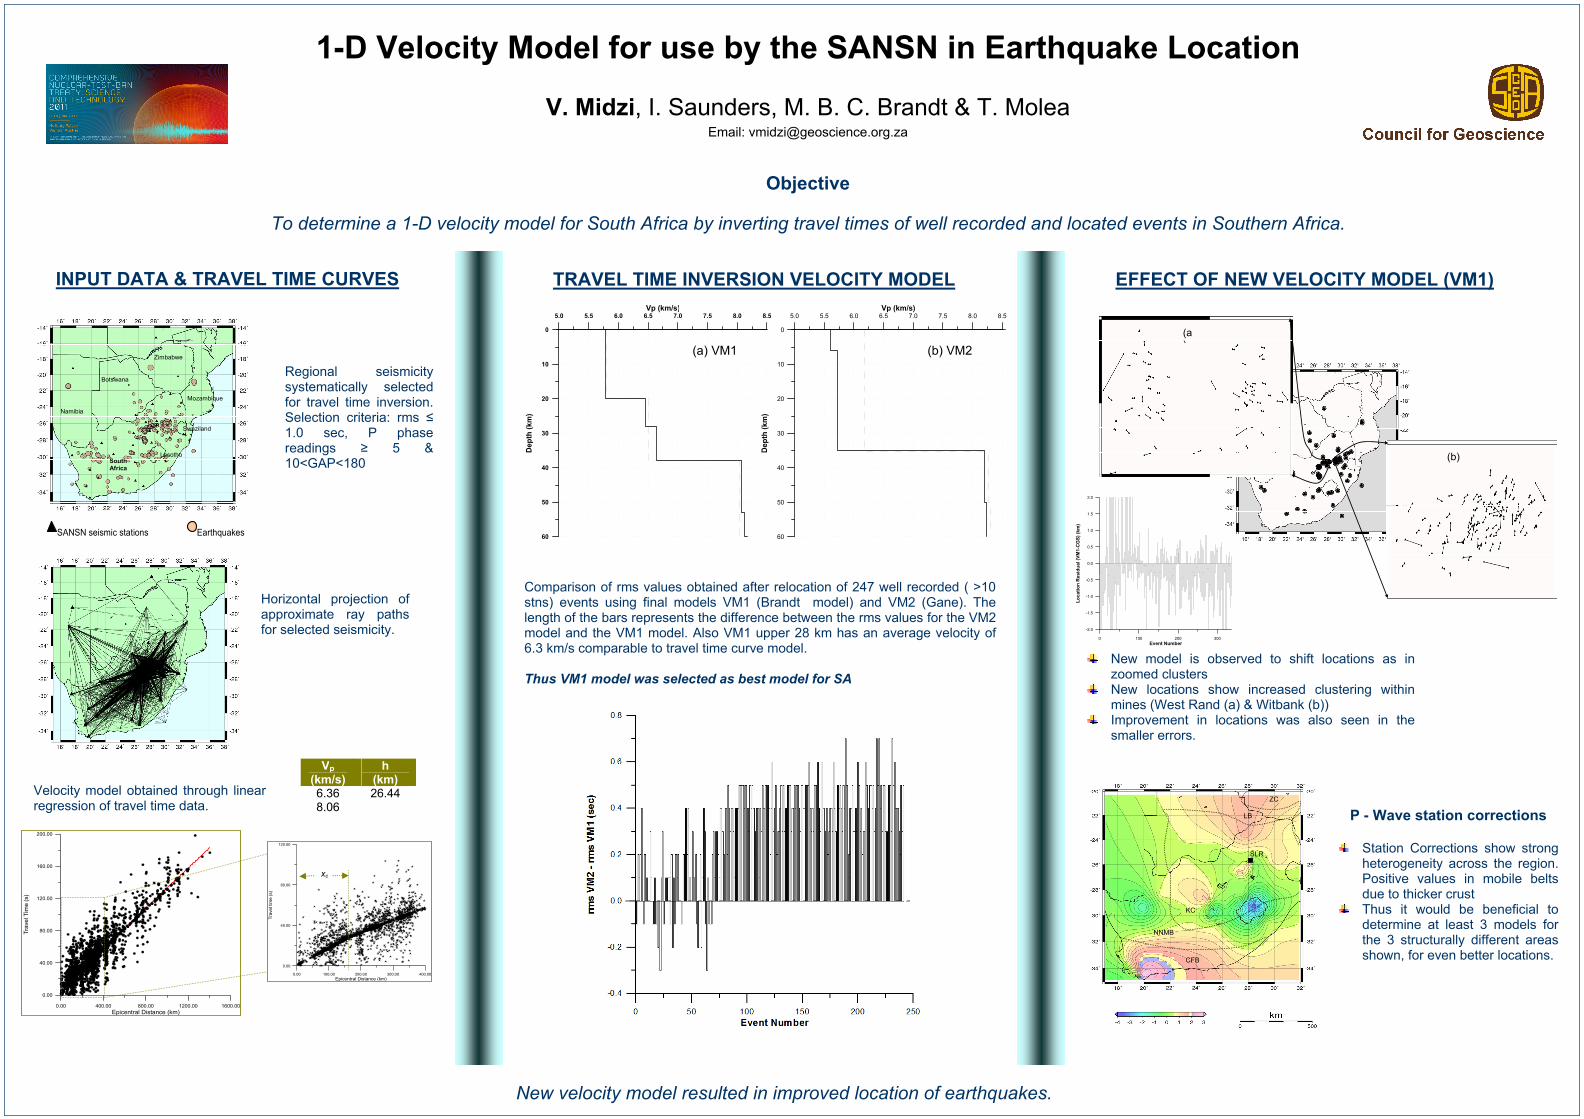
1-D Velocity Model for use by the SANSN in Earthquake Location
V. Midzi, I. Saunders, M. B. C. Brandt & T. Molea Email: [email protected]
Objective
To determine a 1-D velocity model for South Africa by inverting travel times of well recorded and located events in Southern Africa.
INPUT DATA & TRAVEL TIME CURVES
TRAVEL TIME INVERSION VELOCITY MODEL EFFECT OF NEW VELOCITY MODEL (VM1)
South Africa
Zimbabwe
Mozambique
Botswana
Namibia
Lesotho
Swaziland
SANSN seismic stations Earthquakes
0.00 400.00 800.00 1200.00 1600.00Epicentral Distance (km)
0.00
40.00
80.00
120.00
160.00
200.00
Trav
el T
ime
(s)
0.00 100.00 200.00 300.00 400.00Epicentral Distance (km)
0.00
40.00
80.00
120.00
Trav
el ti
me
(s)
xc
Regional seismicity systematically selected for travel time inversion. Selection criteria: rms ≤ 1.0 sec, P phase readings ≥ 5 & 10<GAP<180
Velocity model obtained through linear regression of travel time data.
Horizontal projection of approximate ray paths for selected seismicity.
Vp (km/s)
h (km)
6.36 26.44 8.06
5.0 5.5 6.0 6.5 7.0 7.5 8.0 8.5Vp (km/s)
0
10
20
30
40
50
60D
epth
(km
)
(a) VM1
5.0 5.5 6.0 6.5 7.0 7.5 8.0 8.5Vp (km/s)
0
10
20
30
40
50
60
Dep
th (k
m)
(b) VM2
Comparison of rms values obtained after relocation of 247 well recorded ( >10 stns) events using final models VM1 (Brandt model) and VM2 (Gane). The length of the bars represents the difference between the rms values for the VM2 model and the VM1 model. Also VM1 upper 28 km has an average velocity of 6.3 km/s comparable to travel time curve model. Thus VM1 model was selected as best model for SA
(a)
(b)
New model is observed to shift locations as in zoomed clusters
New locations show increased clustering within mines (West Rand (a) & Witbank (b))
Improvement in locations was also seen in the smaller errors.
0 100 200 300Event Number
-2.0
-1.5
-1.0
-0.5
0.0
0.5
1.0
1.5
2.0
Loca
tion
Res
idua
l (VM
1-C
GS)
(km
)
P - Wave station corrections
Station Corrections show strong heterogeneity across the region. Positive values in mobile belts due to thicker crust
Thus it would be beneficial to determine at least 3 models for the 3 structurally different areas shown, for even better locations.
KC
ZC
LB
NNMB
CFB
SLR
sec
New velocity model resulted in improved location of earthquakes.