a 1961–2010 record of fertilizer use, pesticide
TRANSCRIPT

HAL Id: hal-01284272https://hal.archives-ouvertes.fr/hal-01284272
Submitted on 7 Mar 2016
HAL is a multi-disciplinary open accessarchive for the deposit and dissemination of sci-entific research documents, whether they are pub-lished or not. The documents may come fromteaching and research institutions in France orabroad, or from public or private research centers.
L’archive ouverte pluridisciplinaire HAL, estdestinée au dépôt et à la diffusion de documentsscientifiques de niveau recherche, publiés ou non,émanant des établissements d’enseignement et derecherche français ou étrangers, des laboratoirespublics ou privés.
A 1961–2010 record of fertilizer use, pesticideapplication and cereal yields: a review
Yongbo Liu, Xubin Pan, Junsheng Li
To cite this version:Yongbo Liu, Xubin Pan, Junsheng Li. A 1961–2010 record of fertilizer use, pesticide application andcereal yields: a review. Agronomy for Sustainable Development, Springer Verlag/EDP Sciences/INRA,2015, 35 (1), pp.83-93. �10.1007/s13593-014-0259-9�. �hal-01284272�

REVIEWARTICLE
A 1961–2010 record of fertilizer use, pesticideapplication and cereal yields: a review
Yongbo Liu & Xubin Pan & Junsheng Li
Accepted: 3 October 2014 /Published online: 30 October 2014# INRA and Springer-Verlag France 2014
Abstract Global crop production has doubled since theGreen Revolution on the average, but crop yield has stagnatedor even declined in some regions. In the same time, fooddemand has highly increased due to population growth andhigher living standards. The use of pesticides and mineralfertilizers has improved crop yields but also contaminatedfood and the environment, thus leading to a global food crisis.Here, we reviewed the historical trends of global pesticide andfertilizer application, cereal yields, and production. Our mainfindings are as follows: (1) fertilizer and pesticide consump-tion increased for 35–40 % of the countries; (2) cereal pro-duction in 38 % of countries and yields in 47 % of countrieseither stagnated or decreased from 1961 to 2010; (3) countriesshowing stagnated or decreased yields are countries with lowgross domestic product per capita, mainly situated in Africa,South America, and West Asia. Our findings thus evidence aglobal imbalance in food production and the usage of fertil-izers and pesticides.
Keywords Consumption imbalance . Fertilizers . Pesticides .
Cereal production . Environmental protection
Contents
1. Introduction ..................................................................... 42. History trend of global fertilizer consumption................ 6
3. History trend of global pesticide consumption .............. 93.1 Insecticide consumption ......................................... 93.2 Herbicide consumption ........................................ 103.3 Fungicide and bactericide consumption ............... 11
4. History trend of global cereal yields and produc-tion ................................................................................ 134.1 Yield of total cereals ............................................ 134.2 Production of total cereals .................................... 14
5. Integrated assessment of chemical additions .................. 166. Conclusions .................................................................. 19
1 Introduction
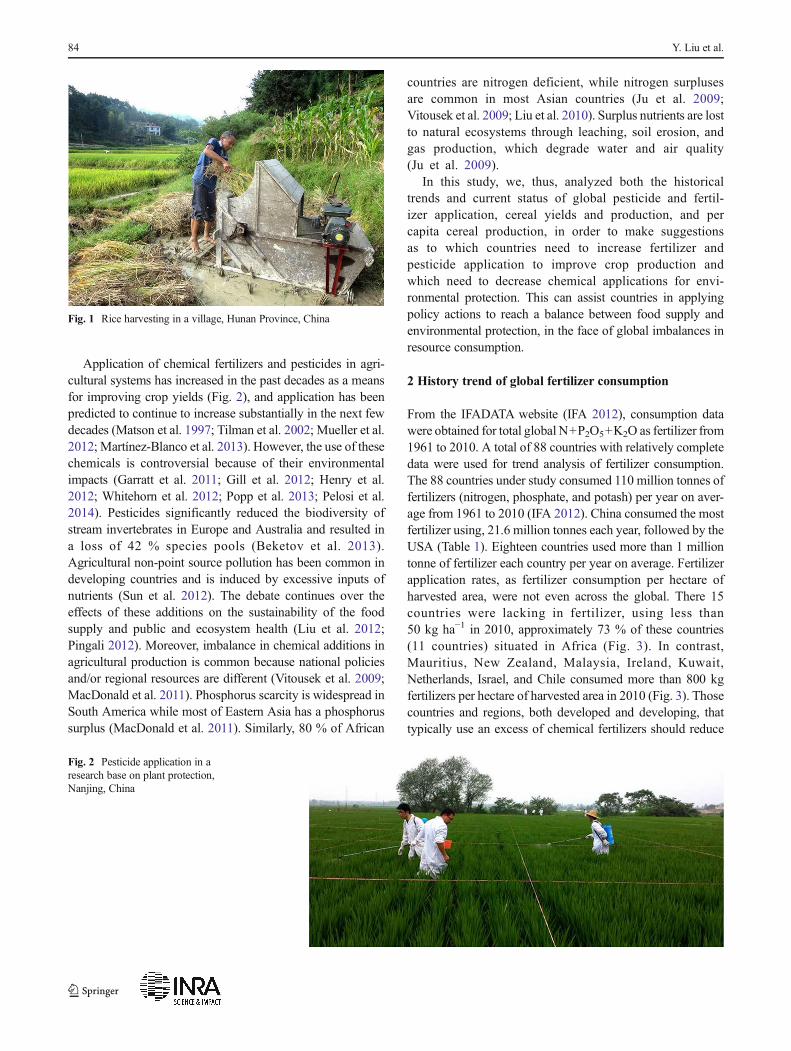
Increased global crop production has decreased the number ofhungry people worldwide since the Green Revolution(Godfray et al. 2010). However, in 2010, there were still 925million undernourished people worldwide, with 98 % of theseindividuals living in developing countries (FAO 2010). Cropyields have stagnated or even declined in some regions(Peltonen-Sainio et al. 2009; Lin and Huybers 2012), andcereal yields in around a quarter of cereal growing area didnot improve from 1961 to 2008 (Ray et al. 2012). Thisindicates a potential global food crisis in the coming decades,which will likely be aggravated by a decrease in the area inagricultural production (Foley et al. 2011; Graf et al. 2014),the continual expansion of biofuel production (Gelfand et al.2013), generally elevated standards of living, and huge foodwastage (Del Grosso and Cavigelli 2012). The crisis may beserious (Fig. 1), not only in relatively poor countries but alsoin countries that depend on food imports; if food-exportingcountries stop exporting or increase food prices, then coun-tries that depend on food imports will require increased do-mestic food production, likely through increased fertilizersand pesticides usage.
Y. Liu (*) : J. Li (*)State Key Laboratory of Environmental Criteria and RiskAssessment, Chinese Research Academy of EnvironmentalSciences, 8 Dayangfang, 100012 Beijing, Chinae-mail: [email protected]: [email protected]
X. PanInstitute of Plant Quarantine, Chinese Academy of Inspectionand Quarantine, 100029 Beijing, China
Agron. Sustain. Dev. (2015) 35:83–93DOI 10.1007/s13593-014-0259-9
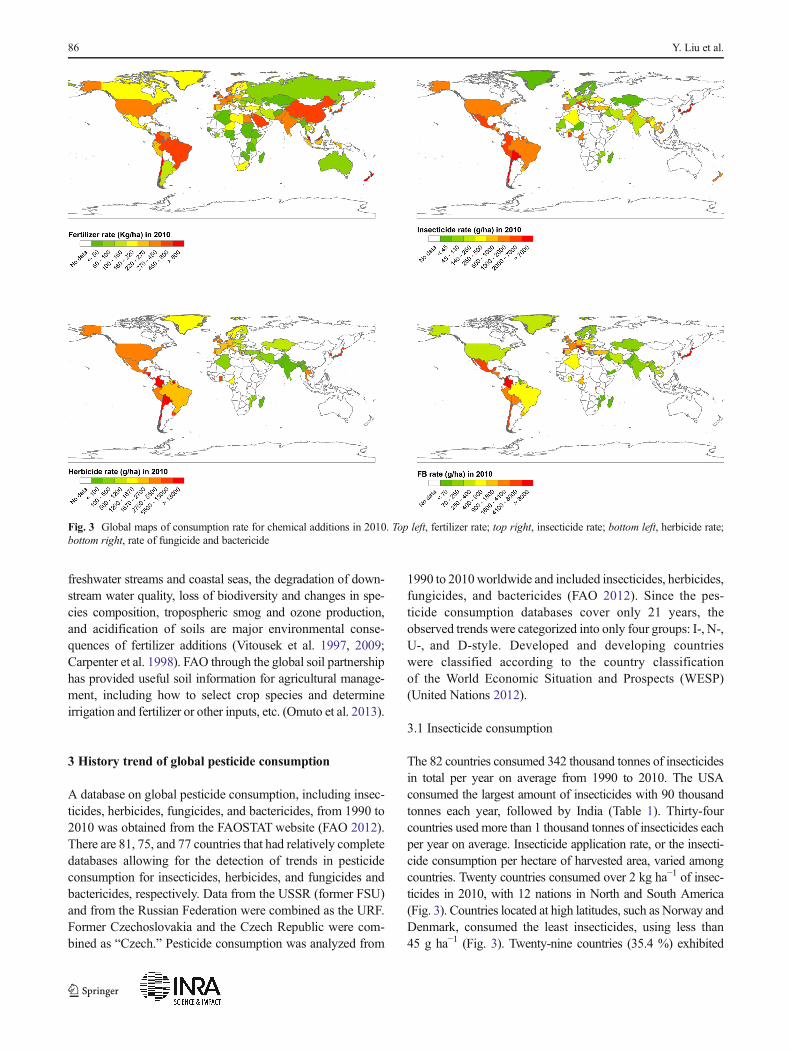
Application of chemical fertilizers and pesticides in agri-cultural systems has increased in the past decades as a meansfor improving crop yields (Fig. 2), and application has beenpredicted to continue to increase substantially in the next fewdecades (Matson et al. 1997; Tilman et al. 2002; Mueller et al.2012; Martínez-Blanco et al. 2013). However, the use of thesechemicals is controversial because of their environmentalimpacts (Garratt et al. 2011; Gill et al. 2012; Henry et al.2012; Whitehorn et al. 2012; Popp et al. 2013; Pelosi et al.2014). Pesticides significantly reduced the biodiversity ofstream invertebrates in Europe and Australia and resulted ina loss of 42 % species pools (Beketov et al. 2013).Agricultural non-point source pollution has been common indeveloping countries and is induced by excessive inputs ofnutrients (Sun et al. 2012). The debate continues over theeffects of these additions on the sustainability of the foodsupply and public and ecosystem health (Liu et al. 2012;Pingali 2012). Moreover, imbalance in chemical additions inagricultural production is common because national policiesand/or regional resources are different (Vitousek et al. 2009;MacDonald et al. 2011). Phosphorus scarcity is widespread inSouth America while most of Eastern Asia has a phosphorussurplus (MacDonald et al. 2011). Similarly, 80 % of African
countries are nitrogen deficient, while nitrogen surplusesare common in most Asian countries (Ju et al. 2009;Vitousek et al. 2009; Liu et al. 2010). Surplus nutrients are lostto natural ecosystems through leaching, soil erosion, andgas production, which degrade water and air quality(Ju et al. 2009).
In this study, we, thus, analyzed both the historicaltrends and current status of global pesticide and fertil-izer application, cereal yields and production, and percapita cereal production, in order to make suggestionsas to which countries need to increase fertilizer andpesticide application to improve crop production andwhich need to decrease chemical applications for envi-ronmental protection. This can assist countries in applyingpolicy actions to reach a balance between food supply andenvironmental protection, in the face of global imbalances inresource consumption.
2 History trend of global fertilizer consumption
From the IFADATA website (IFA 2012), consumption datawere obtained for total global N+P2O5+K2O as fertilizer from1961 to 2010. A total of 88 countries with relatively completedata were used for trend analysis of fertilizer consumption.The 88 countries under study consumed 110 million tonnes offertilizers (nitrogen, phosphate, and potash) per year on aver-age from 1961 to 2010 (IFA 2012). China consumed the mostfertilizer using, 21.6 million tonnes each year, followed by theUSA (Table 1). Eighteen countries used more than 1 milliontonne of fertilizer each country per year on average. Fertilizerapplication rates, as fertilizer consumption per hectare ofharvested area, were not even across the global. There 15countries were lacking in fertilizer, using less than50 kg ha−1 in 2010, approximately 73 % of these countries(11 countries) situated in Africa (Fig. 3). In contrast,Mauritius, New Zealand, Malaysia, Ireland, Kuwait,Netherlands, Israel, and Chile consumed more than 800 kgfertilizers per hectare of harvested area in 2010 (Fig. 3). Thosecountries and regions, both developed and developing, thattypically use an excess of chemical fertilizers should reduce
Fig. 1 Rice harvesting in a village, Hunan Province, China
Fig. 2 Pesticide application in aresearch base on plant protection,Nanjing, China
84 Y. Liu et al.

inputs and take measures to increase the efficiency of chem-ical additions, for the benefit of the agricultural economy, theenvironment, and human health (Gill et al. 2012; Henry et al.2012; Kuivila et al. 2012; Whitehorn et al. 2012). Scarcity ofnutrient supplies is also a key factor that limited the increase incereal yields (Vitousek et al. 2009; Liu et al. 2010;MacDonald et al. 2011). These developing countries first needto feed their increasing human populations. Modern technol-ogies and best practices could help developing nations toincrease crop production substantially. For example, inAfrica, the lack of roads makes it way too expensive anddifficult for farmers to get access to synthetic fertilizers, whichhampers agricultural productivity.
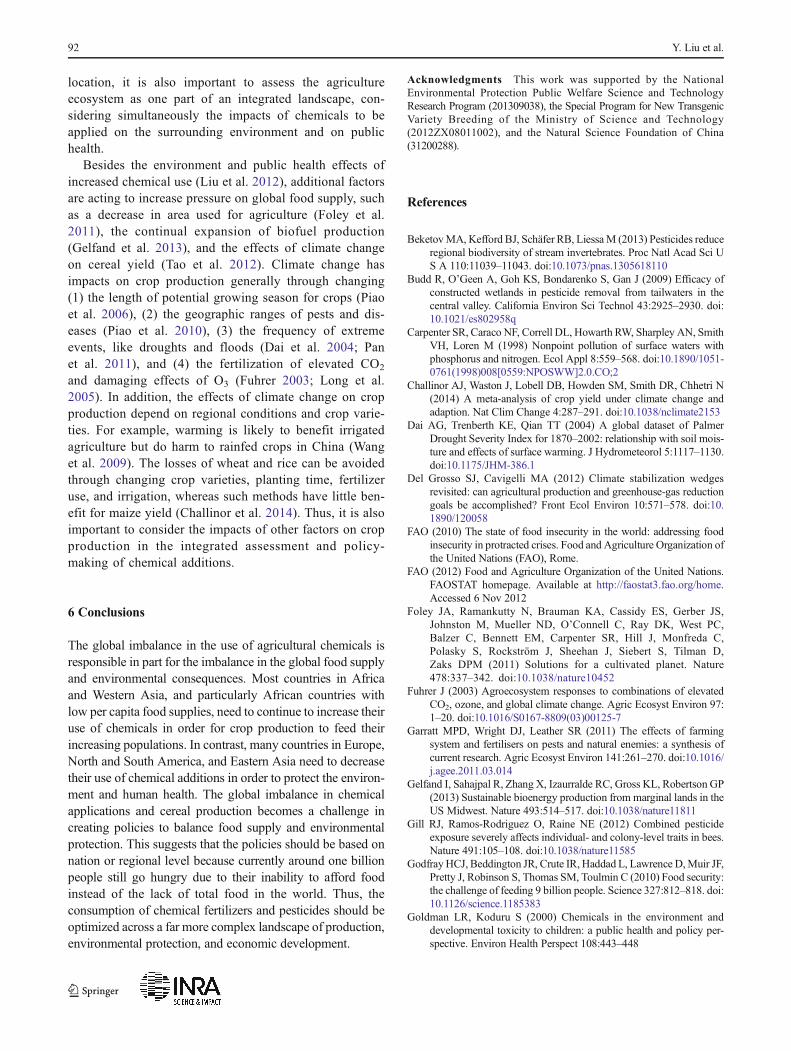
Based on the observed trends in fertilizer consumption, thecountries and regions were categorized into five groups (Rayet al. 2012): increasing (I-style), interannual variation but noobvious trends (N-style), first increasing and then stagnating(IN-style), first increasing and then decreasing with aunimodal trend (U-style), and finally decreasing over time(D-style). Fertilizer consumption in 35 countries (39.7 %)increased (I-style) over the study period (Fig. 4; Table 2); thiscategory included only three developed countries with themajority situated in Asia and South America. There were 15IN-style countries (17.1 %) (Fig. 4), including the USA andSpain, two developed countries. Seven countries were cate-gorized as N-style (7.95 %). Thirty countries (34.1 %) exhib-ited the U-style, first increasing and then decreasing, and mostof these (21 countries) were developed nations situated inEurope. There was only one D-style country (Trinidad andTobago), which consumed a decreasing quantity of fertilizerfrom 1961 to 2010 (Fig. 4). Some developed countries havedecreased their consumption of fertilizers and pesticides inrecent years owing to growing public concern over the envi-ronmental impacts of excessive chemical inputs in agriculturesystems (Ju et al. 2009; MacDonald et al. 2011; Sun et al.2012). In contrast, research agendas and national policyshould be focused on the needs of resource-limited countries.Multiple non-governmental organizations (NGOs) arepouring money to African farmers to providing fertilizers.Some African countries show recent increases in consump-tion. Agricultural policies provide farm households withgrains and input subsidies in developing nations made themto use enough chemical applications (Huang et al. 2011).
Thousands of tonnes of fertilizers have been consumed toimprove crop yield since the Green Revolution beginning afew decades ago (Tilman 2001; Mueller et al. 2012).However, harvested crops generally only consume about halfof the fertilizer input to a given fields (Liu et al. 2010; Miaoet al. 2011); the excess fertilizer is a threat to the surroundingenvironment and a large waste for farmers. Fertilizers affectsoil organic carbon by influencing crop residue and C miner-alization (e.g., Russell et al. 2009; Martínez-Blanco et al.2013). Eutrophication of surface waters, particularly inT
able1
Meanvalue(tonne
peryear)of
thetoptencountriesforfertilizer,pesticide,andcerealproductio
nin
recent
decadesbasedon
theFA
OandIH
Fdatabase
Order
Cereal
Fertilizers
Insecticides
Herbicides
FB
Countries
Trend
aMean(106)
Countries
Trend
Mean(106)
Countries
Trend
Mean(103)
Countries
Trend
Mean(103)
Countries
Trend
Mean(103)
1China
I324
China
I21.6
USA
U89.9
USA
N201
Italy
D61.7
2USA
I285
USA
I17.5
India
D30.6
Mexico
I34.4
France
D46.4
3India
I169
URFb
U9.94
Mexico
I24.8
Thailand
I31.2
Mexico
I31.8
4URF
IN128
India
I9.84
Japan
D23.5
France
D30.0
Japan
D30.2
5France
I49.5
France
U4.59
Italy
D19.6
Brazil
I25.4
USA
N21.1
6Canada
IN43.6
Brazil
I4.08
Brazil
I15.1
Colom
bia
U25.2
Colom
bia
U20.3
7Indonesia
I43.0
Germany
U3.81
Turkey
N13.7
Ukraine
I23.2
Spain
N10.5
8Brazil
I38.3
Poland
U2.25
Vietnam
N12.9
Germany
N16.0
Portugal
I10.1
9Germany
I35.1
UK
U1.95
Spain
N9.44
UK
U15.9
India
N9.81
10Argentin
aI
26.7
Canada
I1.89
SouthKorea
N9.05
Italy
D14.2
Germany
N9.49
No.of
countries
148
8882
7577
Year
1961–2010
1961–2010
1990–2010
1990–2010
1990–2010
FBfungicides
andbactericides
aTrend
type:I,increase;IN
,increasethen
stagnate;N
,noobvioustrend;
U,unimodal;D
,decrease
bURF(U
),increaseddataof
USS
R(1961–1991)anddecreaseddataof
Russian
Federatio
n(1992–2010)
Trends of chemical additions and cereal yields during 1961–2010 85
freshwater streams and coastal seas, the degradation of down-stream water quality, loss of biodiversity and changes in spe-cies composition, tropospheric smog and ozone production,and acidification of soils are major environmental conse-quences of fertilizer additions (Vitousek et al. 1997, 2009;Carpenter et al. 1998). FAO through the global soil partnershiphas provided useful soil information for agricultural manage-ment, including how to select crop species and determineirrigation and fertilizer or other inputs, etc. (Omuto et al. 2013).
3 History trend of global pesticide consumption
A database on global pesticide consumption, including insec-ticides, herbicides, fungicides, and bactericides, from 1990 to2010 was obtained from the FAOSTAT website (FAO 2012).There are 81, 75, and 77 countries that had relatively completedatabases allowing for the detection of trends in pesticideconsumption for insecticides, herbicides, and fungicides andbactericides, respectively. Data from the USSR (former FSU)and from the Russian Federation were combined as the URF.Former Czechoslovakia and the Czech Republic were com-bined as “Czech.” Pesticide consumption was analyzed from
1990 to 2010worldwide and included insecticides, herbicides,fungicides, and bactericides (FAO 2012). Since the pes-ticide consumption databases cover only 21 years, theobserved trends were categorized into only four groups: I-, N-,U-, and D-style. Developed and developing countrieswere classified according to the country classificationof the World Economic Situation and Prospects (WESP)(United Nations 2012).
3.1 Insecticide consumption
The 82 countries consumed 342 thousand tonnes of insecticidesin total per year on average from 1990 to 2010. The USAconsumed the largest amount of insecticides with 90 thousandtonnes each year, followed by India (Table 1). Thirty-fourcountries used more than 1 thousand tonnes of insecticides eachper year on average. Insecticide application rate, or the insecti-cide consumption per hectare of harvested area, varied amongcountries. Twenty countries consumed over 2 kg ha−1 of insec-ticides in 2010, with 12 nations in North and South America(Fig. 3). Countries located at high latitudes, such as Norway andDenmark, consumed the least insecticides, using less than45 g ha−1 (Fig. 3). Twenty-nine countries (35.4 %) exhibited
Fig. 3 Global maps of consumption rate for chemical additions in 2010. Top left, fertilizer rate; top right, insecticide rate; bottom left, herbicide rate;bottom right, rate of fungicide and bactericide
86 Y. Liu et al.

an I-style of insecticide consumption from 1990 to 2010 (Fig. 4;Table 2), including five developed countries (Czech Republic,Hungary, Latvia, Netherlands, and Poland). Most of these I-style countries were situated in South America and EasternEurope (Fig. 4). The insecticide consumption of 23 countries(28.1 %), including six developed countries, showed an N-stylepattern. There were seven countries (8.50 %) that exhibited aunimodal trend (U-style). Twenty-three countries (28.0 %)displayed a decreased trend (D-style), of which over one half(13 countries) were developed nations in Europe (Fig. 4).
3.2 Herbicide consumption
The herbicide consumption of 75 countries per year was onaverage 566 thousand tonnes from 1990 to 2010. The USAconsumed the most herbicides, at 201 thousand tonnes eachyear, followed by Mexico (Table 1). There were 45 countrieswhich used more than 1 thousand tonnes of herbicides per yearon average each. Most South American countries consumedover 2 kg ha−1 of pesticides in 2010 (Fig. 3). South and WestAsian countries such as India, Myanmar, and Bangladesh,
Fig. 4 Global maps of trend types for chemical additions (ArcMap 9.3, ESRI Inc.): top left, fertilizer trends from 1961 to 2010; top right, insecticide trendsfrom 1990 to 2010; bottom left, herbicide trends from 1990 to 2010; bottom right, trends of fungicide and bactericide from 1990 to 2010
Table 2 Percentage of four trend types for consumption of fertilizers and pesticides (i.e., insecticides, herbicides, and fungicides and bactericides) andglobal cereal production at the country scale
Trend typea Cereal production (%) Yield (%) Fertilizers (%) Insecticides (%) Herbicides (%) Fungicides and bactericides (%)
Increase 62.16 52.60 39.77 35.37 40.00 33.77
No obvious trend 17.57 24.00 7.95 28.05 44.00 48.05
Increase then stagnate 4.73 15.40 17.05 – – –
Unimodal 10.81 4.57 34.09 8.53 6.67 6.49
Decrease 4.73 3.43 1.14 28.05 9.33 11.69
No. of countries 148 175 88 82 75 77
a Trend type is consistent with Table 1
Trends of chemical additions and cereal yields during 1961–2010 87
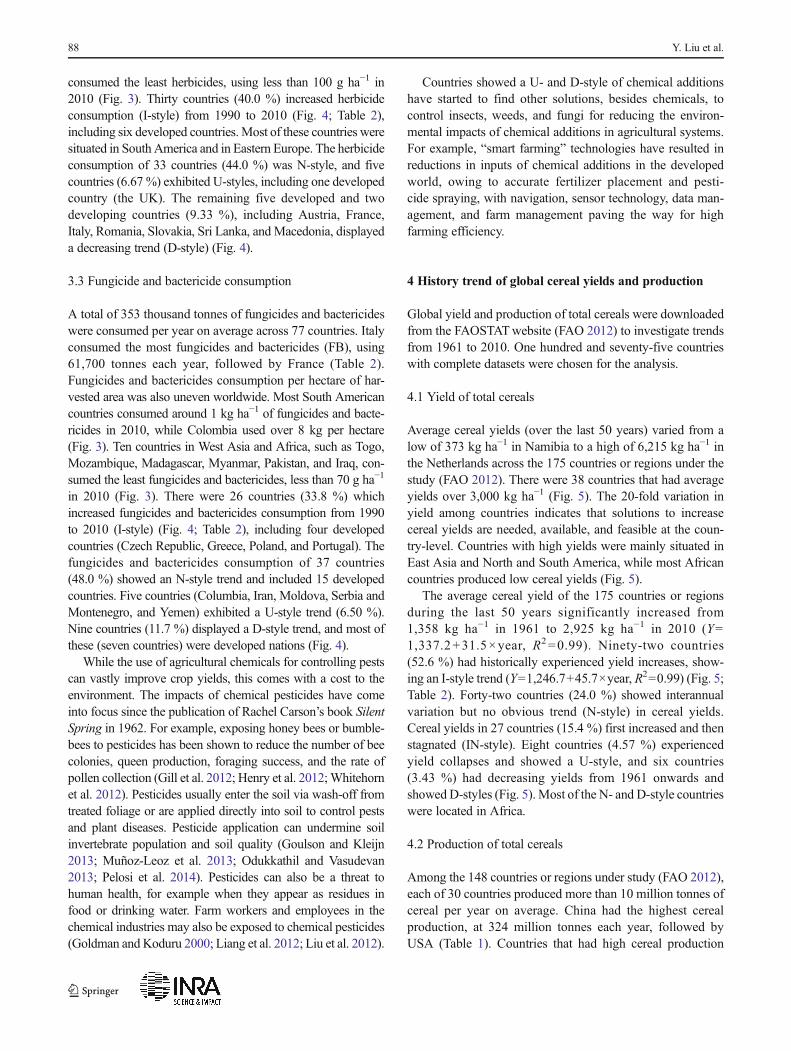
consumed the least herbicides, using less than 100 g ha−1 in2010 (Fig. 3). Thirty countries (40.0 %) increased herbicideconsumption (I-style) from 1990 to 2010 (Fig. 4; Table 2),including six developed countries.Most of these countries weresituated in South America and in Eastern Europe. The herbicideconsumption of 33 countries (44.0 %) was N-style, and fivecountries (6.67 %) exhibited U-styles, including one developedcountry (the UK). The remaining five developed and twodeveloping countries (9.33 %), including Austria, France,Italy, Romania, Slovakia, Sri Lanka, and Macedonia, displayeda decreasing trend (D-style) (Fig. 4).
3.3 Fungicide and bactericide consumption
A total of 353 thousand tonnes of fungicides and bactericideswere consumed per year on average across 77 countries. Italyconsumed the most fungicides and bactericides (FB), using61,700 tonnes each year, followed by France (Table 2).Fungicides and bactericides consumption per hectare of har-vested area was also uneven worldwide. Most South Americancountries consumed around 1 kg ha−1 of fungicides and bacte-ricides in 2010, while Colombia used over 8 kg per hectare(Fig. 3). Ten countries in West Asia and Africa, such as Togo,Mozambique, Madagascar, Myanmar, Pakistan, and Iraq, con-sumed the least fungicides and bactericides, less than 70 g ha−1
in 2010 (Fig. 3). There were 26 countries (33.8 %) whichincreased fungicides and bactericides consumption from 1990to 2010 (I-style) (Fig. 4; Table 2), including four developedcountries (Czech Republic, Greece, Poland, and Portugal). Thefungicides and bactericides consumption of 37 countries(48.0 %) showed an N-style trend and included 15 developedcountries. Five countries (Columbia, Iran, Moldova, Serbia andMontenegro, and Yemen) exhibited a U-style trend (6.50 %).Nine countries (11.7 %) displayed a D-style trend, and most ofthese (seven countries) were developed nations (Fig. 4).
While the use of agricultural chemicals for controlling pestscan vastly improve crop yields, this comes with a cost to theenvironment. The impacts of chemical pesticides have comeinto focus since the publication of Rachel Carson’s book SilentSpring in 1962. For example, exposing honey bees or bumble-bees to pesticides has been shown to reduce the number of beecolonies, queen production, foraging success, and the rate ofpollen collection (Gill et al. 2012; Henry et al. 2012;Whitehornet al. 2012). Pesticides usually enter the soil via wash-off fromtreated foliage or are applied directly into soil to control pestsand plant diseases. Pesticide application can undermine soilinvertebrate population and soil quality (Goulson and Kleijn2013; Muñoz-Leoz et al. 2013; Odukkathil and Vasudevan2013; Pelosi et al. 2014). Pesticides can also be a threat tohuman health, for example when they appear as residues infood or drinking water. Farm workers and employees in thechemical industries may also be exposed to chemical pesticides(Goldman and Koduru 2000; Liang et al. 2012; Liu et al. 2012).
Countries showed a U- and D-style of chemical additionshave started to find other solutions, besides chemicals, tocontrol insects, weeds, and fungi for reducing the environ-mental impacts of chemical additions in agricultural systems.For example, “smart farming” technologies have resulted inreductions in inputs of chemical additions in the developedworld, owing to accurate fertilizer placement and pesti-cide spraying, with navigation, sensor technology, data man-agement, and farm management paving the way for highfarming efficiency.
4 History trend of global cereal yields and production
Global yield and production of total cereals were downloadedfrom the FAOSTATwebsite (FAO 2012) to investigate trendsfrom 1961 to 2010. One hundred and seventy-five countrieswith complete datasets were chosen for the analysis.
4.1 Yield of total cereals
Average cereal yields (over the last 50 years) varied from alow of 373 kg ha−1 in Namibia to a high of 6,215 kg ha−1 inthe Netherlands across the 175 countries or regions under thestudy (FAO 2012). There were 38 countries that had averageyields over 3,000 kg ha−1 (Fig. 5). The 20-fold variation inyield among countries indicates that solutions to increasecereal yields are needed, available, and feasible at the coun-try-level. Countries with high yields were mainly situated inEast Asia and North and South America, while most Africancountries produced low cereal yields (Fig. 5).
The average cereal yield of the 175 countries or regionsduring the last 50 years significantly increased from1,358 kg ha−1 in 1961 to 2,925 kg ha−1 in 2010 (Y=1,337.2+31.5×year, R2=0.99). Ninety-two countries(52.6 %) had historically experienced yield increases, show-ing an I-style trend (Y=1,246.7+45.7×year, R2=0.99) (Fig. 5;Table 2). Forty-two countries (24.0 %) showed interannualvariation but no obvious trend (N-style) in cereal yields.Cereal yields in 27 countries (15.4 %) first increased and thenstagnated (IN-style). Eight countries (4.57 %) experiencedyield collapses and showed a U-style, and six countries(3.43 %) had decreasing yields from 1961 onwards andshowedD-styles (Fig. 5).Most of the N- and D-style countrieswere located in Africa.
4.2 Production of total cereals
Among the 148 countries or regions under study (FAO 2012),each of 30 countries produced more than 10 million tonnes ofcereal per year on average. China had the highest cerealproduction, at 324 million tonnes each year, followed byUSA (Table 1). Countries that had high cereal production
88 Y. Liu et al.

per capita were mainly situated in Europe and in NorthAmerica, while most African countries had low cereal pro-duction per capita of less than 50 kg cereal per capita onaverage in 2010 (Fig. 5).
Approximately 62.2 % of countries (92) increased cerealproduction from 1961 to 2010 (I-style) (Figs. 5, 6; Table 2),including the three highest cereal producers: China, the USA,and India. There were seven countries (4.73 %), Norway,Congo, Greece, Hungary, UK, Canada, and USF (the USSRand the Russian Federation), classified as first increasing andthen stagnating (IN-style). These countries first increasedproduction until roughly 1990 and then stagnated (Figs. 5and 6). There were 26 countries (17.6 %) that showed inter-annual variation in production but no obvious trend (N-style)(Figs. 5 and 6; Table 2). Apart from the Netherlands andPortugal, the other N-style countries were developing nations,and most of them were in Africa (Fig. 5). The mean grossdomestic product (GDP) per capita in those countries (2.97×10³ dollars on average) was three times less than the meanvalue (1.15×10⁴ dollars) in the world in 2010 (rude data fromthe World Bank). Cereal production in 16 countries (10.8 %)
first increased until 1985–1990 and then decreased, exhibiting aunimodal trend (U-style); this category included two developedcountries, Sweden and Switzerland (Figs. 5 and 6; Table 2).This may indicate that the 1980s were boom years in cerealproduction for these countries. There were seven countries(4.73%) that showed decreased production (D-style), includingtwo developed countries (Cyprus and Japan) (Fig. 5).
The global imbalance in the consumption of fertilizers andpesticides inevitably has had impacts on cereal productionaround the world. Developed countries, such as those inEurope, have had high cereal production per capita, and yieldsand production have increased over time. In these countries, theamount of fertilizers and pesticides used has also been high.
In contrast, per capita cereal production in most Africancountries was very low (Fig. 5), and cereal yields either stayedthe same or even decreased over time. Other studies have alsofound evidence for stagnation in yields in some regions(Peltonen-Sainio et al. 2009; Lin and Huybers 2012). Forexample, based on dataset for maize, rice, wheat, and soybeanfrom 1961 to 2008, Ray et al. found that yields in around aquarter of cereal growing area either stagnated or declined (Ray
Fig. 5 Global maps of cereal production and yield (ArcMap 9.3, ESRIInc.): five trend styles (I, IN, N, U, D) of cereal production (top left) andyield (top right) from 1961 to 2010, per capita cereal production (annualcereal production divided by population) in 2010 (bottom left), and cereal
yield in 2010 (bottom right). I, IN, N, U, and D suggest increasing,stagnating, interannual variability, collapsing, and decreasing trends,respectively
Trends of chemical additions and cereal yields during 1961–2010 89

et al. 2012). Cereal yields mainly depend on the cropvarieties grown and the environmental conditions (bothabiotic and biotic) and the crop experiences, such asnutrient inputs, herbivory damage, competition fromweeds, diseases, and local climate. Cereal yields andproduction in those N-style countries depends on naturalweather fluctuations, and here there is a lack of effec-tive agricultural management policies, which may playan important role in improving cereal yields.
5 Integrated assessment of chemical additions
Per capita cereal production was calculated by dividing cerealproduction by population for each country studied in 2010.The consumption of fertilizers and pesticides (insecticides,herbicides, fungicides, and bactericides) in 2010 was dividedby harvested area to obtain the rate of fertilizer and pesticideapplication. All countries with data were ordered into the ninetypes and assigned values with integers from −4 to 4 (Xi) for
Fig. 6 Illustrative examples for five styles of global cereal production trends from 1961 to 2010: Filled points in each panel are the cereal production inthree example countries
90 Y. Liu et al.

six indicators (i): per capita cereal production and yield, andfertilizer, insecticide, herbicide, and FB application rates. Theweights of the six indicators (Wi) were 0.4, 0.2, 0.1, 0.1, 0.1,and 0.1, respectively. The consumption index (CI) of each
country was calculated as: CI ¼ ∑i¼1
6X i �Wið Þ.
Low consumption index values mean that higher chemicaladditions are needed to increase cereal production, and highconsumption index values indicate that chemical additionsshould be decreased to protect the environment. The sixindicators were divided into two parts: the first included percapita cereal production and yield, and indicated the value ofcurrent cereal production, while the second part included theremaining four indicators and was a measure of environmentalprotection. When any indicator value was missing in eitherpart, its weight was added to the other indicators in that part.The consumption index value will not be calculated if allindicators in any part were missing.
Countries with a high consumption index were mainly inNorth America, Europe, South and East Asia, and in thesouthern part of South America (Fig. 7), indicating that thesecountries should decrease the consumption of fertilizers andpesticides in agriculture systems for the health of their eco-systems. Countries in Africa had some of the lowest consump-tion index values, and West Asia and Russia also had lowconsumption indices. Policies in these countries, especiallyamong the African countries, should strive to increase
investment in nutrient additions to increase cereal production.It will be more efficient and effective to enhance the commu-nication and cooperation between authorities and companies,particularly those producing fertilizer and pesticide.
If there are no feasible solutions to alleviate thenegative effects of production practices aimed to simul-taneously increase crop yields and decrease environmen-tal impacts of agricultural intensification, there will be atrade-off between increased crop yield and environmen-tal protection. Thus, feasible solutions should be devel-oped to obtain a balance between increasing crop pro-duction to feed a growing human population and simul-taneously mitigating negative environmental impacts(Tilman 2001; Foley et al. 2011; Mueller et al. 2012).For example, new technologies have gained high pro-duction with lower nutrient inputs (Matson et al. 1998).Drip and pivot techniques, conservation tillage, in-creased soil moisture capacities, and agro-forestry ortree-cropping systems are all technologies likely to in-crease nutrient-use efficiency and reduce environmentalimpacts. Biological pest control is an alternative methodto control pests; the use of which may reduce pesticideconsumption (Popp et al. 2013). Ecosystem-basedmethods for removing chemical pollutants, such as con-structed wetlands, are an effective practice for mitigat-ing hydrophobic pesticides in irrigation tailwater (Buddet al. 2009). When applying chemicals in a given
Fig. 7 Global maps of the consumption index (CI) for chemical additions (ArcMap 9.3, ESRI Inc.): integrated assessment for increasing (low CI value)or decreasing (high CI value) their consumption in each country
Trends of chemical additions and cereal yields during 1961–2010 91
location, it is also important to assess the agricultureecosystem as one part of an integrated landscape, con-sidering simultaneously the impacts of chemicals to beapplied on the surrounding environment and on publichealth.
Besides the environment and public health effects ofincreased chemical use (Liu et al. 2012), additional factorsare acting to increase pressure on global food supply, suchas a decrease in area used for agriculture (Foley et al.2011), the continual expansion of biofuel production(Gelfand et al. 2013), and the effects of climate changeon cereal yield (Tao et al. 2012). Climate change hasimpacts on crop production generally through changing(1) the length of potential growing season for crops (Piaoet al. 2006), (2) the geographic ranges of pests and dis-eases (Piao et al. 2010), (3) the frequency of extremeevents, like droughts and floods (Dai et al. 2004; Panet al. 2011), and (4) the fertilization of elevated CO2
and damaging effects of O3 (Fuhrer 2003; Long et al.2005). In addition, the effects of climate change on cropproduction depend on regional conditions and crop varie-ties. For example, warming is likely to benefit irrigatedagriculture but do harm to rainfed crops in China (Wanget al. 2009). The losses of wheat and rice can be avoidedthrough changing crop varieties, planting time, fertilizeruse, and irrigation, whereas such methods have little ben-efit for maize yield (Challinor et al. 2014). Thus, it is alsoimportant to consider the impacts of other factors on cropproduction in the integrated assessment and policy-making of chemical additions.
6 Conclusions
The global imbalance in the use of agricultural chemicals isresponsible in part for the imbalance in the global food supplyand environmental consequences. Most countries in Africaand Western Asia, and particularly African countries withlow per capita food supplies, need to continue to increase theiruse of chemicals in order for crop production to feed theirincreasing populations. In contrast, many countries in Europe,North and South America, and Eastern Asia need to decreasetheir use of chemical additions in order to protect the environ-ment and human health. The global imbalance in chemicalapplications and cereal production becomes a challenge increating policies to balance food supply and environmentalprotection. This suggests that the policies should be based onnation or regional level because currently around one billionpeople still go hungry due to their inability to afford foodinstead of the lack of total food in the world. Thus, theconsumption of chemical fertilizers and pesticides should beoptimized across a far more complex landscape of production,environmental protection, and economic development.
Acknowledgments This work was supported by the NationalEnvironmental Protection Public Welfare Science and TechnologyResearch Program (201309038), the Special Program for New TransgenicVariety Breeding of the Ministry of Science and Technology(2012ZX08011002), and the Natural Science Foundation of China(31200288).
References
BeketovMA, Kefford BJ, Schäfer RB, LiessaM (2013) Pesticides reduceregional biodiversity of stream invertebrates. Proc Natl Acad Sci US A 110:11039–11043. doi:10.1073/pnas.1305618110
Budd R, O’Geen A, Goh KS, Bondarenko S, Gan J (2009) Efficacy ofconstructed wetlands in pesticide removal from tailwaters in thecentral valley. California Environ Sci Technol 43:2925–2930. doi:10.1021/es802958q
Carpenter SR, Caraco NF, Correll DL, Howarth RW, Sharpley AN, SmithVH, Loren M (1998) Nonpoint pollution of surface waters withphosphorus and nitrogen. Ecol Appl 8:559–568. doi:10.1890/1051-0761(1998)008[0559:NPOSWW]2.0.CO;2
Challinor AJ, Waston J, Lobell DB, Howden SM, Smith DR, Chhetri N(2014) A meta-analysis of crop yield under climate change andadaption. Nat Clim Change 4:287–291. doi:10.1038/nclimate2153
Dai AG, Trenberth KE, Qian TT (2004) A global dataset of PalmerDrought Severity Index for 1870–2002: relationship with soil mois-ture and effects of surface warming. J Hydrometeorol 5:1117–1130.doi:10.1175/JHM-386.1
Del Grosso SJ, Cavigelli MA (2012) Climate stabilization wedgesrevisited: can agricultural production and greenhouse-gas reductiongoals be accomplished? Front Ecol Environ 10:571–578. doi:10.1890/120058
FAO (2010) The state of food insecurity in the world: addressing foodinsecurity in protracted crises. Food and Agriculture Organization ofthe United Nations (FAO), Rome.
FAO (2012) Food and Agriculture Organization of the United Nations.FAOSTAT homepage. Available at http://faostat3.fao.org/home.Accessed 6 Nov 2012
Foley JA, Ramankutty N, Brauman KA, Cassidy ES, Gerber JS,Johnston M, Mueller ND, O’Connell C, Ray DK, West PC,Balzer C, Bennett EM, Carpenter SR, Hill J, Monfreda C,Polasky S, Rockström J, Sheehan J, Siebert S, Tilman D,Zaks DPM (2011) Solutions for a cultivated planet. Nature478:337–342. doi:10.1038/nature10452
Fuhrer J (2003) Agroecosystem responses to combinations of elevatedCO2, ozone, and global climate change. Agric Ecosyst Environ 97:1–20. doi:10.1016/S0167-8809(03)00125-7
Garratt MPD, Wright DJ, Leather SR (2011) The effects of farmingsystem and fertilisers on pests and natural enemies: a synthesis ofcurrent research. Agric Ecosyst Environ 141:261–270. doi:10.1016/j.agee.2011.03.014
Gelfand I, Sahajpal R, Zhang X, Izaurralde RC, Gross KL, Robertson GP(2013) Sustainable bioenergy production from marginal lands in theUS Midwest. Nature 493:514–517. doi:10.1038/nature11811
Gill RJ, Ramos-Rodriguez O, Raine NE (2012) Combined pesticideexposure severely affects individual- and colony-level traits in bees.Nature 491:105–108. doi:10.1038/nature11585
GodfrayHCJ, Beddington JR, Crute IR, Haddad L, Lawrence D,Muir JF,Pretty J, Robinson S, Thomas SM, Toulmin C (2010) Food security:the challenge of feeding 9 billion people. Science 327:812–818. doi:10.1126/science.1185383
Goldman LR, Koduru S (2000) Chemicals in the environment anddevelopmental toxicity to children: a public health and policy per-spective. Environ Health Perspect 108:443–448
92 Y. Liu et al.

Goulson D, Kleijn D (2013) REVIEW: an overview of the environmentalrisks posed by neonicotinoid insecticides. J Appl Ecol 50:977–987.doi:10.1111/1365-2664.12111
Graf R, Müller M, Korner P, Jenny M, Jenni L (2014) 20% loss ofunimproved farmland in 22 years in the Engadin, Swiss Alps.Agric Ecosyst Environ 185:48–58. doi:10.1016/j.agee.2013.12.009
Henry M, Beguin M, Requier F, Rollin O, Odoux J-F, Aupinel P, Aptel J,Tchamitchian S, Decourtye A (2012) A common pesticide decreasesforaging success and survival in honey bees. Science 336:348–350.doi:10.1126/science.1215039
Huang J, Wang X, Zhi H, Huang Z, Rozelle S (2011) Subsidies anddistortions in China’s agriculture: evidence from producer-leveldata. Aust J Agric Resour Econ 55:53–71. doi:10.1111/j.1467-8489.2010.00527.x
IFA (2012) International Fertilizer Industry Association. IFADATAhomepage. Available at http://www.fertilizer.org/ifa/ifadata/search.Accessed 6 Nov 2012
Ju XT, Xing GX, Chen XP, Zhang SL, Zhang LJ, Liu XJ, Cui ZL, Yin B,Christie P, Zhu ZL, Zhang FS (2009) Reducing environmental riskby improving N management in intensive Chinese agriculturalsystems. Proc Natl Acad Sci U S A 106:3041–3046. doi:10.1073/pnas.0813417106
Kuivila KM,HladikML, Ingersoll CG, Kemble NE,Moran PW, CalhounDL, Nowell LH, Gilliom RJ (2012) Occurrence and potentialsources of pyrethroid insecticides in stream sediments from sevenU.S. metropolitan areas. Environ Sci Technol 46:4297–4303. doi:10.1021/es2044882
LiangY,WangW, ShenY, LiuY, LiuXJ (2012) Effects of home preparationon organophosphorus pesticide residues in raw cucumber. Food Chem133:636–640. doi:10.1016/j.foodchem.2012.01.016
LinM,Huybers P (2012) Reckoningwheat yield trends. Environ Res Lett7:024016. doi:10.1088/1748-9326/7/2/024016
Liu J, You L, AminiM,ObersteinerM, HerreroM, Zehnder AJB, YangH(2010) A high-resolution assessment on global nitrogen flows incropland. Proc Natl Acad Sci U S A 107:8035–8040. doi:10.1073/pnas.0913658107
Liu Y, Liu F, Pan X, Li J (2012) Protecting the environment and publichealth from pesticides. Environ Sci Technol 46:5658–5659. doi:10.1021/es301652v
Long SP, Ainsworth EA, Leakey ADB, Morgan PB (2005) Global foodinsecurity. Treatment of major food crops with elevated carbondioxide or ozone under large-scale fully open-air conditions sug-gests recent models may have overestimated future yields. PhilTrans R Soc B 360:2011–2020. doi:10.1098/rstb.2005.1749
MacDonald GK, Bennett EM, Potter PA, Ramankutty N (2011) From thecover: agronomic phosphorus imbalances across the world’s crop-lands. Proc Natl Acad Sci U S A 108:3086–3091. doi:10.1073/pnas.1010808108
Martínez-Blanco J, Lazcano C, Christensen TH, Muñoz P, Rieradevall J,Møller J, Antón A, Boldrin A (2013) Compost benefits for agricul-ture evaluated by life cycle assessment. A review Agron SustainDev 33:721–732. doi:10.1007/s13593-013-0148-7
Matson PA, Parton WJ, Power AG, Swift M (1997) Agricultural intensi-fication and ecosystem properties. Science 277:504–509. doi:10.1126/science.277.5325.504
Matson PA, Naylor R, Ortiz-Monasterio I (1998) Integration of environ-mental, agronomic, and economic aspects of fertilizer management.Science 280:112–115. doi:10.1126/science.280.5360.112
Miao Y, Stewart BA, Zhang F (2011) Long-term experiments for sustain-able nutrient management in China. A review Agron Sustain Dev31:397–414. doi:10.1051/agro/2010034
Mueller ND, Gerber JS, Johnston M, Ray DK, Ramankutty N, Foley JA(2012) Closing yield gaps through nutrient and water management.Nature 490:254–257. doi:10.1038/nature11420
Muñoz-Leoz B, Garbisu C, Charcosset J-Y, Sánchez-Pérez JM,Antigüedad I, Ruiz-Romera E (2013) Non-target effects of three
formulated pesticides on microbially-mediated processes in a clay-loam soil. Sci Total Environ 449:345–354. doi:10.1016/j.scitotenv.2013.01.079
Odukkathil G, Vasudevan N (2013) Toxicity and bioremediation ofpesticides in agricultural soil. Rev Environ Sci Biotechnol 12:421–444. doi:10.1007/s11157-013-9320-4
Omuto C, Nachtergaele F, Rojas RV (2013) State of the art report onglobal and regional soil information: Where are we? Where to go?Global Soil Partnership Technical Report. Food and AgricultureOrganization of the United Nations, Rome
Pan X, Shen D, Dong X, Patton B (2011) Natural disaster occurrence andaverage global temperature. Disaster Adv 4:61–63
Pelosi C, Barot S, Capowiez Y, Hedde M, Vandenbulcke F (2014)Pesticides and earthworms. A review Agron Sustain Dev 34:199–228. doi:10.1007/s13593-013-0151-z
Peltonen-Sainio P, Jauhiainen L, Laurila IP (2009) Cereal yieldtrends in northern European conditions: changes in yield potentialand its realization. Field Crops Res 110:85–90. doi:10.1016/j.fcr.2008.07.007
Piao SL, Fang JY, Zhou LM, Ciais P, Zhu B (2006) Variations in satellite-derived phenology in China’s temperate vegetation. Global ChangeBiol 12:672–685. doi:10.1111/j.1365-2486.2006.01123.x
Piao S, Ciais P, Huang Y, Shen Z, Peng S, Li J, Zhou L, Liu H, Ma Y,DingY, Friedlingstein P, Liu C, Tan K, YuY, Zhang T, Fang J (2010)The impacts of climate change on water resources and agriculture inChina. Nature 467:43–51. doi:10.1038/nature09364
Pingali PL (2012) Green Revolution: impacts, limits, and the path ahead.Proc Natl Acad Sci U S A 109:12302–12308. doi:10.1073/pnas.0912953109
Popp J, PetőK, Nagy J (2013) Pesticide productivity and food security. Areview Agron Sustain Dev 33:243–255. doi:10.1007/s13593-012-0105-x
Ray DK, Ramankutty N, Mueller ND, West PC, Foley JA (2012) Recentpatterns of crop yield growth and stagnation. Nat Commun. doi:10.1038/ncomms2296
Russell AE, Cambardella CA, Laird DA, Jaynes DB, Meek DW (2009)Nitrogen fertilizer effects on soil carbon balances in midwestern U.S.agricultural systems. Ecol Appl 19:1102–1113. doi:10.1890/07-1919.1
Sun B, Zhang LX, Yang LZ, Zhang FS, Norse D, Zhu ZL (2012)Agricultural non-point source pollution in China: causes and mitiga-tion measures. Ambio 41:370–379. doi:10.1007/s13280-012-0249-6
Tao F, Zhang Z, Zhang S, Zhu Z, ShiW (2012) Response of crop yields toclimate trends since 1980 in China. Clim Res 54:233–247. doi:10.3354/cr01131
Tilman D (2001) Forecasting agriculturally driven global environmentalchange. Science 292:281–284. doi:10.1126/science.1057544
Tilman D, Cassman KG, Matson PA, Naylor R, Polasky S (2002)Agricultural sustainability and intensive production practices.Nature 418:671–677. doi:10.1038/nature01014
United Nations (201) Country classification in: United Nations publica-tion (Ed.) World Economic Situation and Prospects, New York, pp.131–140.
Vitousek PM, Mooney HA, Lubchenco J, Melillo JM (1997) Humandomination of Earth’s ecosystems. Science 277. doi:10.1126/science.277.5325.494
Vitousek PM, Naylor R, Crews T, DavidMB, Drinkwater LE, Holland E,Johnes PJ, Katzenberger J,Martinelli LA,Matson PA, Nziguheba G,Ojima D, Palm CA, Robertson GP, Sanchez PA, Townsend AR,Zhang FS (2009) Nutrient imbalances in agricultural development.Science 324:1519–1520. doi:10.1126/science.1170261
Wang JX, Mendelsohn R, Dinar A, Huang J, Rozelle S, Zhang L (2009)The impact of climate change on China’s agriculture. Agric Econ40:323–337. doi:10.1111/j.1574-0862.2009.00379.x
Whitehorn PR, O’Connor S,Wackers FL, Goulson D (2012) Neonicotinoidpesticide reduces bumble bee colony growth and queen production.Science 336:351–352. doi:10.1126/science.1215025
Trends of chemical additions and cereal yields during 1961–2010 93