98p. · research triangle educational consultants. ... lecture frequency by carnegie classification...
TRANSCRIPT

DOCUMENT RESUME
ED 428 607 HE 031 925
AUTHOR Brawner, Catherine E.; Felder, Richard M.; Brent, Rebecca;Allen, Rodney H.; Miller, Thomas K., III
TITLE Faculty Survey of Teaching Practices and Perceptions ofInstitutional Attitudes Toward Teaching, 1997-1998.
INSTITUTION Southeastern Univ. and Coll. Coalition for EngineeringEducation.
SPONS AGENCY National Science Foundation, Arlington, VA.PUB DATE 1999-03-00NOTE 98p.
PUB TYPE Reports Research (143) Tests/Questionnaires (160)EDRS PRICE MF01/PC04 Plus Postage.DESCRIPTORS Active Learning; *College Faculty; *Engineering Education;
*Faculty College Relationship; Faculty Development; Grouping(Instructional Purposes); Higher Education; *NationalSurveys; Self Evaluation (Individuals); *Teacher Attitudes;*Teaching Methods
ABSTRACTThis report presents findings of a survey of engineering
college faculty at eight participating institutions in SUCCEED (SoutheasternUniversity and College Coalition for Engineering Education) concerning theiruse of various instructional methods, their prior involvement ininstructional development programs, and their perceptions about institutionalsupport for teaching on their campuses. Findings of the survey responses(n.503, or 32 percent) were analyzed and organized according to the followingaspects: participation in faculty development programs and discussions ofteaching; use of instructor-centered teaching methods; use of activelearning; use of group assignments, team projects, and writing assignments;use of various methods of communicating with students; and rated importanceof teaching quality. Analysis also looked at inter-institutional differences,differences by professorial rank, and sex differences. Findings indicated amoderate level of involvement by respondents in attending teaching seminarsand implementing nontraditional teaching practices, such as using teamactivities in and out of class, giving writing assignments, and using e-mailand the World Wide Web. Respondents tended to believe that teaching is moreimportant to them than it is to their colleagues and administrators and thatit counts for relatively little in the faculty incentive and rewardstructure. The questionnaire is appended. (DB)
********************************************************************************Reproductions supplied by EDRS are the best that can be made
from the original document.********************************************************************************

SOUTHEASTERN UNIVERSITY AND COLLEGECOALITION FOR ENGINEERING EDUCATION
1997-1998 Faculty Survey ofTeaching Practices and Perceptions of
Institutional Attitudes Toward Teaching
Catherine E. BrawnerResearch Triangle Educational Consultants
Richard M. Felder and Rebecca BrentNorth Carolina State University
Rodney H. AllenCON1P-AID
Thomas K. Miller, IIINorth Carolina State University
March 1999U.S. DEPARTMENT OF EDUCATION
Office of Educational Research and ImprovementiUCATIONAL RESOURCES INFORMATION
CENTER (ERIC)This document has been reproduced asreceived from the person or organizationoriginating it.
0 Minor changes have been made toimprove reproduction quality.
Points of view or opinions stated in thisdocument do not necessarily representofficial OERI position or policy.
1
Sponsored by the NSF SUCCEED CoalitionFaculty Development Coalition Focus Team and
Assessment and Evaluation Coalition Service Team
2
PERMISSION TO REPRODUCE ANDDISSEMINATE THIS MATERIAL HAS
BEEN GRANTED BY
Richard Felder
TO THE EDUCATIONAL RESOURCESINFORMATION CENTER (ERIC)

Table of Contents
Index of Tables ii
Executive Summary 1
Introduction 10
Survey Methodology 10
Description of Sample 11
Methodology 13
Survey Responses 14
Prior involvement in teaching beyond classroom instruction 14
Rated importance of teaching quality and innovation 15
Frequency of use of instructor-centered teaching techniques 18
In-class activities 21
Assignments 27
Communications 32
Writing objectives and soliciting feedback from students 34Involvement in teaching improvement programs 37
Interinstitutional differences 41
Respondent demographic information 41
Prior involvement in teaching beyond classroom instruction 42
Rated importance of teaching quality and innovation 42
Frequency of use of instructor-centered teaching techniques 43
In-class activities 43
Assignments 43
Communications 44
Writing objectives and soliciting feedback from students 44
Involvement in teaching improvement programs 44
Teaching ratings 45
Implications and Cautions 45
Acknowledgment 46
Appendix A Survey instrument 47
Appendix B Survey summary by institution 54
i 3
Index of Tables
1. Survey responses by survey administration and institution 11
2. Rank by primary academic function 12
3. Rank by years of service 13
4. Engineering discipline of respondents 13
5. Attendance at teaching seminars, workshops or conferences 15
6. Level of involvement in SUCCEED programs 15
7. Rated importance of teaching quality and innovation 16
8. Importance of teaching quality by sex of respondents 16
9. Importance of teaching quality by primary academic function 17
10. Use of instructor-centered teaching techniques 18
11. Lecture frequency by teaching seminars attended in past year 18
12. Lecture frequency by teaching seminars attended in career 19
13. Lecture frequency by level of involvement in SUCCEED -19
14. Lecture frequency by primary academic function 19
15. Lecture frequency by Carnegie Classification 2016. Frequency of showing overheads by respondents' sex 2017. Frequency of use of demonstrations in class by teaching seminars attended in
past year 2118. Frequency of use of demonstrations in class by number of teaching seminars
attended in career 21
19. In-class activities 2220. Put students in groups for brief intervals by rank 2221. Put students in groups for brief intervals by teaching seminars attended in past
year 2322. Put students in groups for brief intervals by teaching seminars attended in
career 2323. Put students in groups for brief intervals by level of involvement in
SUCCEED 2324. Put students in groups for brief intervals by sex of respondents 2425. Put students in groups of brief intervals by Carnegie classification 2426. Put students in groups for most of class by teaching seminars attended in past
year 2527. Put students in groups for most of class by teaching seminars attended in
career 2528. Put students in groups for most of class by level of involvement in SUCCEED 2529. Put students in groups for most of class by sex of respondents 2630. Put students in groups for most of class by Carnegie classification 2631. Students work on computers in class by teaching seminars attended in past
year 2632. Students work on computer terminals during class by teaching seminars
attended in career 2733. Students work on computer terminals in class by Carnegie classification 2734. Assignments 28
II
35. Assign homework to individuals by number of teaching seminars attended inpast year 28
36. Option to do homework in teams by teaching seminars attended in career 2937. Option to do homework in teams by primary academic function 2938. Require teams for homework by teaching seminars attended in past year 2939. Require teams for homework by teaching seminars attended in career 3040. Require teams for homework by level of SUCCEED involvement 3041. Assign a major team project by teaching seminars attended in past year 3042. Assign a major team project by teaching seminars attended in career 31
43. Assign a major team project by primary academic function 3144. Assign a major team project by Carnegie classification 31
45. Give a writing assignment by teaching seminars attended in past year 3246. Give a writing assignment by teaching seminars attended in career 3247. Communication with students 3248. Use e-mail to communicate with class by teaching seminars attended in past
year -33
49. Use e-mail to communicate with entire class by teaching seminars attended incareer 33
50. Use e-mail to communicate with entire class by academic rank 3351. Use World Wide Web to provide information to the entire class by academic
rank 3452. Use World Wide Web to provide information to the entire class by primary
academic function 3453. Providing instructional objectives and study guides 3554. Write instructional objectives by teaching seminars attended in past year 35
55. Write instructional objectives by teaching seminars attended in career 3556. Frequency of seeking student feedback 3657. Soliciting feedback from students by teaching seminars attended in past year 3658. Soliciting feedback from students by Carnegie classification 3659. Use of faculty development resources by teaching seminars attended in past
year 3760. Use of faculty development resources by career teaching seminars 3861. Use of faculty development resources by sex of respondents 3862. Discussion of teaching techniques with colleagues and graduate students 3863. Discussion of teaching techniques with colleagues by teaching seminars
attended in past year 3964. Discussion of teaching techniques with colleagues by teaching seminars
attended in career 3965. Discussion of teaching techniques with colleagues by level of involvement in
SUCCEED 4066. Discuss teaching techniques with graduate students by position 4067. Student ratings of faculty members' department by position 41
68. Student ratings of faculty members' department by Carnegie classification 41
69. Rated importance of teaching quality and innovation 4370. Teaching ratings 45
iii5

Executive Summary
SUCCEED (Southeastern University and College Coalition for Engineering Education) isa National Science Foundation-sponsored engineering education coalition. Theparticipating institutions are Clemson University, Georgia Tech, Florida A&M-FloridaState University, North Carolina State University, North Carolina A&T State University,University of Florida, University of North Carolina at Charlotte, and Virginia PolytechnicInstitute and State University. SUCCEED was first funded in 1992 and began its secondfive-year award period with a mission of scaling up and institutionalizing the educationalreforms developed and pilot-tested in its first five years. A major component of thiseffort is the design and implementation of a faculty development program. The programobjectives are (1) to promote faculty adoption of nontraditional instructional methods andmaterials that have been proven effective by classroom research studies and (2) toimprove institutional support for teaching at each of the eight SUCCEED campuses.
As the first step in assessing and evaluating the faculty development program, abaseline campus climate survey was sent to all engineering faculty members at theCoalition schools. The survey asked the respondents about their use of a variety ofinstructional methods, their prior involvement in instructional development programs,and their perceptions about institutional support for teaching on their campuses. Thesurvey was administered to some faculty members via e-mail and to others via the WorldWide Web during the period from December 1997 to February 1998, and a second roundwas sent to non-respondents by e-mail in March 1998. Administrations of the samesurvey in 2000 and 2002 will indicate the degree to which the faculty developmentprogram is meeting its objectives.
Response rates and respondents
Five hundred and three valid usable surveys were received. The coalition-wideresponse rate was 32%, with responses on individual campuses ranging from 26% to45%. (A return of 25% is considered quite good in survey research of this type.) Therespondents included
10% female, 85% male, 5% who did not respond to this item.3% instructors/lecturers, 19% assistant professors, 31% associate professors, 40% fullprofessors, 5% "other" (mostly full-time administrators), 2% non-respondents.73% teaching/research faculty, 9% teaching faculty, 2% research faculty, 13%administration or "other," 3% non-respondents.8% with less than two years teaching experience, 12% 2-5 years, 20% 5-10 years,32% 10-20 years, 26% more than 20 years, 2% non-respondents.
The distributions of the respondents by academic ranks and disciplines closely matchedthe total faculty population of the SUCCEED campuses. Women faculty members wereoverrepresented (roughly 10% of the respondents, as compared with 7% of the total
1
6

faculty population), as were faculty active in SUCCEED and past participants inSUCCEED programs.
The respondents were asked to characterize student ratings of their teaching andaverage student ratings for their department on a scale from 0 (extremely poor) to 10(superior). The results were as follows.
Respondents' ratings: N 498, Mean = 7.91, Standard Deviation = 1.12, Minimum =3, Maximum = 10.Department ratings: N = 485, Mean = 6.89, Standard Deviation = 1.04, Minimum =1, Maximum = 10.
The implication is that better-than-average teachers were overrepresented among thesurvey respondents.
The sections that follow summarize the principal findings of the study,emphasizing results that show significant between-group differences.
Participation in Faculty Development Programs and Discussions of Teaching
Attended teaching seminars, workshops, and coqferences. In the preceding year, 9%attended three or more programs, 16% attended two, 30% attended one, and 45%attended none. In their careers, 13% attended 10 or more, 16% attended 6-10, 29%attended 3-5, 26% attended 1-2, and 15% attended none.Participated in SUCCEED activities: 7% directed a coalition project and 14% wereactively involved in one, 13% attended a coalition program but were not involved in aproject, 57% heard of the coalition but were never involved in it, and 8% knewnothing about the coalition.Discuss teaching with colleagues: 12% did so more than once a week, 39% less thanonce a week and more than once a month, 40% once a month or less, 5% never (3%non-respondents).Discuss teaching with graduate students: 7% did so more than once a week, 21% lessthan once a week and more than once a month, 44% once a month or less, 15% never,and 9% did not work with graduate students (4% non-respondents).When asked how often they had used faculty development resources on theircampuses, over half of the respondents indicated that they had used them at leastonce. Eighty-nine percent of these respondents indicated that they had attended aworkshop or seminar, 31% consulted or borrowed books, 14% worked individuallywith a teaching consultant, and 9% indicated that they had done something else.(Respondents were asked to mark all responses that applied.) Women weresignificantly more likely to use faculty development resources than were men, withtwo-thirds using them at least once compared with just over half of the men.
2

Use of Instructor-Centered Teaching Methods
The respondents were asked about the frequency with which they used differentinstructional methods, and were told not to respond if they taught only non-lecturecourses (laboratories and project-based courses like design). The percentages to be givenare based on those who responded to each item. The term "semester" means whicheverof the terms "semester" or "quarter" applies.
Four of the questions referred to instructor-centered teaching methods that do notcall for much active student involvement.
Lecture for most of a class period: 66% reported doing so in every class session, 29%once or more a week, 3% once or more a month, 1% once or more a semester, and1% never. (The respondents were instructed to check the first response that applied tothem.)Use overhead transparencies: 25% used them in every class session, 33% once ormore a week, 20% once or more a month, 15% once or more a semester, and 7%never use them.Use in-class demonstrations: 4% used them in every class session, 17% once or morea week, 34% once or more a month, 32% once or more a semester, 14% never.Direct questions to the entire class: 84% did so every class session, 13% once a weekor more, and 3% less than once a week.
Most teaching seminars and workshops are concerned largely with presentingactive alternatives to straight lecturing. The results of this study show a strong negativecorrelation between attendance at teaching seminars and extensive lecturing. Theinstructors who lectured for most of every class session they taught included 85% ofthose who had never attended a teaching seminar in their career, 72% of those attendingone or two seminars, 60% of those attending 3-5,62% of those attending 6-10, and 49%of those attending more than ten. Teaching/research faculty were more likely to engagein straight lecturing (69%) than were teaching faculty (55%).
Using demonstrations in class can be an effective alternative to straight lecturing,albeit one that still may keep students in a passive role. Instructors who presenteddemonstrations at least once a week in their classes included 15% of those who had neverattended a teaching seminar, 17% of those attending one or two, 17% of those attending3-5,24% of those attending 6-10, and 36% of those attending more than 10.
We should point out that these results show correlation, not necessarily causation.They probably indicate that teaching seminars have a positive effect on faculty teachingpractices, and they probably also reflect a greater tendency of faculty members who useactive learning and other nontraditional methods to attend teaching seminars. The samecaution applies throughout this report.

Use of Active Learning
Active learning methods are those that call upon all students to do things in classother than watching and listening to the professor and taking notes. Fifty-eight percent ofthe respondents reported giving brief in-class assignments to groups of students at leastonce a semester, with 17% doing so at least once a week. Forty percent put students ingroups for most of a class period at least once a semester, with 8% doing so at least oncea week.
Assistant professors were most likely to put students in groups for brief intervalsat some point during the semester, with two-thirds of them doing so compared to lessthan 60% of the associate professors and just over half of the full professors. The use ofactive learning exercises correlated with career attendance at teaching seminars: thoseusing them included 80% of those who attended more than ten seminars, 67% of thoseattending 6-10, 64% of those attending 3-5, 47% of those attending 1-2, and 32% ofthose who never attended a seminar. Instructors who assigned group exercises at leastonce a semester included roughly 75% of respondents who had been involved withSUCCEED in some manner and 50% of nonparticipants. Women (75%) were morelikely than men (57%) to report putting students into groups for brief intervals duringclass.
The more teaching seminars faculty members attended in their careers, the morelikely they were to report putting students in groups for most of class at some pointduring the semester. Sixty-six percent of those attending more than ten seminars reporteddoing so, compared with about 40% of those who had attended one to ten (the actualnumber attended made very little difference) and 18% of those who had never attendedone. Women (56%) were more likely than men (39%) to report putting students intogroups for most of a class session at least once during the semester. Faculty members atMasters' institutions (51%) were more likely than their counterparts at researchinstitutions (38%) to report putting students in groups for most of class at some pointduring the semester.
Use of Group Assignments, Team Projects, and Writing Assignments
A strong focus of many teaching workshops is assignment of work to be done byteams of students outside class. Respondents were asked about the frequency with whichthey assign group work in classes other than laboratories or design courses. Optionalgroup work was assigned 1-3 times a week by 24% of the respondents, 1-3 times amonth by 17%, 1-3 times a semester by 24%, and never by 34%. Mandatory group workwas assigned 1-3 times a week by 10% of the respondents, 1-3 times a month by 10%,1-3 times a semester by 25%, and never by 55%.
About two-thirds of the respondents who had ever attended a teaching seminar letstudents do homework in groups, compared with less than half of those who had neverattended one. Roughly 50% of the seminar attendees and 60% of those who had beeninvolved in some way with SUCCEED activities ever assigned mandatory group work, as

compared with 19% of the respondents who never attended a seminar and 33% of thosewho had not been involved with SUCCEED.
Twenty-four percent of the respondents assigned a major team project in everycourse they taught, 52% assigned one in some but not all courses, and 24% neverassigned one. Between 75% and 80% of those who had attended teaching seminarsassigned team projects, as compared with 51% of those who never attended one.Teaching faculty (69%) were less likely than teaching/research faculty (75%) andadministrators (84%) to assign major team projects.
Eight percent of the respondents reported giving writing assignments 1-3 times aweek, 28% gave them 1-3 times a month, 48% 1-3 times a semester, and 16% never.Between 85% and 90% of those who had attended teaching seminars gave them, ascompared with 74% of those who never attended one.
Use Various Methods of Communicating with Students
Use e-mail to communicate to the entire class: 25% reported doing so at least once aweek, 22% less than once a week but more than once a month, 18% once a month orless, 35% never. Assistant professors (73%) and associate professors (69%) weremore likely than full professors (59%) to use e-mail to communicate with theirclasses. Roughly 32% of assistant professors did so weekly compared with 28% ofassociate professors and 19% of full professors.Present iqfonnation via the World Wide Web: 27% did so at least once a week, 14%less than once a week but more than once a month, 21% once a month or less, 37%never. Assistant professors (76%) were much more likely than associate professors(61%) or full professors (58%) to use the World Wide Web as a communicationsmedium with their students.Write instructional objectives for a course: 39% always wrote them, 21% usually,21% sometimes, 19% never. Those who wrote them included 89% of respondentswho had attended 10 or more teaching seminars in their careers, 82% of thoseattending 6-10 seminars, 84% of those attending 3-5 seminars, 77% of thoseattending 1-2 seminars, and 72% of those who never attended a seminar.Give study guides to students before tests: 35% always did so, 24% usually, 21%sometimes, 20% never.Give a study guide to students before the final exam: 39% always did so, 21%usually, 17% sometimes, 23% never.Solicit feedback from students: 4% did so in every class session, 11% more than oncea week, 27% more than once a month, 57% once or more a semester, 2% never.
Participation in Faculty Development Programs and Discussions of Teaching
Attended teaching seminars, workshops, and conferences. In the past year, 9%attended three or more, 16% attended two, 30% attended one, and 45% attendednone. In their careers, 13% attended 10 or more, 16% attended 6-10,29% attended3-5,26% attended 1-2, and 15% attended none.

Partiapated in SUCCEED activities: 7% directed a coalition project, 14% wereactively involved in a coalition project, 13% attended a coalition program but werenot involved in a project, 57% heard of the coalition but were never involved in it,and 8% knew nothing about the coalition.Discuss teaching with colleagues: 12% do so more than once a week, 39% less thanonce a week and more than once a month, 40% once a month or less, 5% never (3%non-respondents).Discuss teaching with graduate students: 7% do so more than once a week, 21% lessthan once a week and more than once a month, 44% once a month or less, 15% never9% do not work with graduate students (4% non-respondents).
Rated Importance of Teaching Quality
The respondents were asked to rate the importance of high quality teaching (defined asteaching that sets high but attainable standards for lemming, enables most students beingtaught to meet or exceed those standards, and produces high levels of satisfaction andself-confidence in the students) and innovative teaching (testing new methods, writingtextbooks or instructional software) to themselves, to their colleagues and administrators,and in their institutkon's faculty incentive and reward system (recognition, raises, tenure,promotion). They were told to use a 0-10 scale, with 0 meaning "not at all important"and 10 meaning "extremely important."
The average ratings and standard deviations of the importance of teaching qualitywere as follows: To respondent 9.26 (1.01); to colleagues 7.34 (1.69); to departmenthead 7.70 (2.14); to the dean 7.02 (2.26); to the chancellor and provost 7.02 (2.16).The average rating of the importance of teaching quality in the faculty incentive andreward system was 4.72 (2.24), and the average rating of the importance of innovativeteaching in the incentive and reward system was 4.48 (2.35). The pairwise differences inthese mean values were subjected to t-tests. All differences were significant at or belowthe .001 level except for those between the ratings given to the dean and thechancellor/provost.
Women gave lower ratings than men to the importance of teaching to colleagues[W 6.62 (1.97), M 7.41 (1.62)], to the department head [W 7.13 (2.37), M 7.78(2.09)], and to the dean [W 6.27 (2.22), M 7.07 (2.24)]. All of the differences weresignificant at the p .05 level.
Significant differences exist in the mean responses given by respondents indifferent academic positions. The rated importance of teaching quality to the respondentwas significantly higher among those identifying themselves as teaching faculty [9.76(0.52)] than among those who identify themselves as engaging in both teaching andresearch [9.20 (1.06)1. The importance of teaching to the department head was ratedsignificantly higher by administrators (including department heads) [8.72 (1.69)] than byteaching/research faculty [7.53 (2.12)1 and administrators similarly rated the importanceof teaching quality to the dean [7.96 (2.15)] significantly higher than did teaching faculty[6.43 (2.62)] or teaching/research faculty [6.90 (2.18)]. Those who identified themselves
6
11

as teaching faculty rated the importance of teaching quality in the academic rewardsystem [3.98 (1.99)] significantly lower than did those who identified themselves asteaching research faculty [4.74 (2.21)], research faculty [5.62 (3.02)], and administrators[5.44 (2.38)].
Inter-institutional Differences
There were substantial "variations in responses from different institutions. Thedifferences were not subjected to tests of statistical significance as the purpose of thisstudy is to provide information about the coalition as a whole rather than to comparemember institutions. Some of the observed ranges follow. Numbers in parentheses arestandard deviations.
Attended at least one teaching seminar: Low=75%, High=97%Attended 6 or more teaching seminars: Low=24%, High=42%Use brief in-class group exercises: Low=47%, High=83%.Use group exercises lasting most of a class period: Low=34%, High=55%.Assign required teem homework: Low = 35%, High = 72%.Provide class iqformation via the World Wide Web: Low=56%, High=69%.Importance of teaching quality (0=not at all important, 10=extremely important)> to respondent: Low=8.98(1.26), High=9.41(0.82)> to colleagues: Low=6.76(2.32), High=7.97(1.26)> to department head: Low = 6.66(2.92), High = 8.32(1.42)> to dean: Low-----6.44(2.21), High=7.76(1.89)> to president/chancellor/provost: Low=6.03(2.41), High=7.80(1.76)Importance of teaching quality in the faculty reward system: Low=4.10(1.99),High=4.99(2.17)Importance of teaching innovation in the faculty reward system: Low=3.18(2.42),High=5.03(2.17)
Rank Differences
Several differences in responses of assistant professors, associate professors, and fullprofessors were noted. Assistant professors
were more likely than associate or full professors to use brief group activities in theirclasses (asst. 68%, assoc. 59%, full 52%) and to use the World Wide Web toprovide information to students (asst. 76%, assoc. 62%, full. 58%).Were somewhat more likely than associate professors and more likely than fullprofessors to use email to communicate with their classes (asst. 73%, assoc. - 69%,full - 58%)were equally likely as associate professors and more likely than full professors to usegroup activities lasting most of a class period (asst-44%, assoc-45%, full-34%).were just as likely as associate and full professors to assign required team homework(asst-44%, assoc-43%, full-47%).
712

gave comparable ratings of the importance of teaching quality to themselves (asst.9.15, assoc. 9.29, full 9.25) and to their institutions' top administrators (asst.7.13, assoc. 6.94, fi.ill 7.01), significantly lower ratings to their colleagues (asst.7.05, assoc. 7.25, full 7.53), and similar ratings to their department heads (asst.7.58, assoc. 7.51, full 7.86) and deans (asst. 6.78, assoc. 6.85, full 7.21).gave ratings of the importance of teaching quality and innovation in the facultyreward system comparable to those of the associate professors and below those of thefull professors, though not significantly (quality: asst. 4.60, assoc. 4.54, full4.94), (innovation: asst. 4.20, assoc. 4.30, full 4.73).
Sex differences
Relative to men, women
were more likely to have used faculty development resources on campus (W 67%,M 53%), to use brief in-class group activities (W 76%, M 57%).were more likely to use group activities lasting most of a class period (W 56%, M -39%), and to use the World Wide Web to provide information to students (W - 78%,M - 62%). They were equally likely to assign required team homework (45% of menand women).gave comparable ratings to the importance of teaching quality to themselves (W9.26, M 9.28) and to their institutions' top administrators (W 6.98, M 7.05), andlower ratings to their colleagues (W 6.64, M 7.40), department heads (W 7.26,M 7.78), and deans (W 6.46, M 7.10).gave lower ratings to the importance of teaching quality (W 4.56, M 4.77) andinnovation (W 4.30, M 4.55) in the faculty reward system.
Conclusions
The survey indicates a moderate level of involvement of the respondents in attendingteaching seminars and implementing nontraditional teaching practices: using teamactivities in and out of class, giving writing assignments, and using e-mail and the WorldWide Web as sources of information, among other methods. (We would speculate thatthese levels represent considerable gains over the five years that have elapsed since theSUCCEED Coalition was formed, but a survey was unfortunately not conducted at thattime.) The respondents also believe that teaching is more important to them than it is totheir colleagues and administrators, and that it counts for relatively little in the facultyincentive and reward system.
The responses vary noticeably from one institution to another, from one academicrank to another, and between male and female respondents. For example, the percentagesof respondents giving required team assignments vary from a low of 35% at oneinstitution to a high of 72% at another, and the ratings of importance attached byadministrators to teaching varied from one institution to another by almost two points ona 10-point scale. Assistant professors are more likely than associate or full professors andfemale professors are more likely than male professors to use in-class group activities and
813

the World Wide Web in their teaching, and the assistant professors and female professorsare more likely to believe that teaching is devalued in the faculty reward system.
While these results are interesting, they must be viewed with a measure of caution.Although the overall response rate of 35% is considered quite high in survey-basedresearch, in all likelihood the respondents are not truly representative of the total facultypopulation. The respondents' student evaluations are well above the average ratings fortheir departments; professors who place a high priority on teaching are more likely torespond to a survey on teaching practices than are professors who place a higher priorityon research; and professors who perceive that teaching is devalued on their campus mightbe more likely to respond than professors who are satisfied with the faculty rewardsystem.
This survey is the first step in assessing the impact of coalition efforts on the climatefor teaching at the eight SUCCEED campuses. The true significance of the results willonly be known once similar data are obtained two and four years from now. We lookforward to reporting these data at those times.

Introduction
This document reports the findings from the 1997-1998 survey of SUCCEEDCoalition faculty members. The purpose of the survey was to provide baselineinformation to the SUCCEED Faculty Development Coalition Focus Team on thefaculty's use of various instructional methods, their prior involvement in instructionaldevelopment programs, and their perceptions about institutional support for teaching ontheir campuses. The survey asked respondents to answer questions about their teachingexperiences and practices in four primary areas: prior involvement with teaching beyondclassroom instruction, rated importance of teaching quality and innovation to themselvesand colleagues, frequency of use of various teaching techniques for undergraduateinstruction, and involvement in teaching improvement programs on campus. In addition,respondents were asked to characterize student ratings of their teaching and teaching intheir departments. A copy of the survey instrument appears in the Appendix to thisdocument. This report summarizes responses to each of the questions and itemizessignificant differences among groups (sex, rank, position, years of service, SUCCEEDinvolvement, prior attendance at teaching seminars, and Carnegie classification).
The survey was designed by Dr. Rebecca Brent and Dr. Richard Felder,Codirectors of the SUCCEED Faculty Development Coalition Focus Team, withassistance from Dr. Catherine Brawner of Research Triangle Educational Consultants, amember of the SUCCEED Assessment and Evaluation Coalition Service Team. It wasadministered by electronic mail or via the World Wide Web to all coalition engineeringfaculty members with the assistance of Dr. Thomas Miller, the SUCCEED Technology-Based Curriculum Delivery Focus Team representative at North Carolina StateUniversity. The analysis of the data was performed by Dr. Brawner with assistance fromDr. Rodney Allen of COMP-A1D.
Survey Methodology
Faculty Development team representatives from each SUCCEED campus wereasked to provide complete lists of engineering faculty members. Surveys were sent onlyto faculty members with e-mail addresses. There were 1578 e-mail addresses provided,which included some invalid addresses, duplicates, and addresses for former facultymembers and non-faculty members such as administrative assistants. E-mail messagesthat were returned as undeliverable were resent if there was a correctable error in theoriginal address or if a campus directory search yielded a valid address. The total numberof faculty members (with and without e-mail addresses) reported by the institutions as ofthe spring of 1998 was 1572.
The survey first was pilot-tested at NC A&T. Surveys were sent by electronicmail to 81 e-mail addresses in November 1997, one of which was determined to be aduplicate. Twenty-five faculty members responded, for a 31.2% response rate. Minormodifications were made to the wording of a few questions and the revised survey wasadministered at Virginia Tech and FAMU-FSU to determine whether delivery of the
10
15

survey via e-mail or the Web would yield similar response rates. In the e-mail version,the recipient could select "Reply," fill in the survey, and send it back directly to thesurvey administrator. The Web version sent an e-mail message giving the recipient aunique identification number and instructions to access a Web site containing the survey,fill in the survey on-line, and submit it. The advantage of the Web-based survey is that agreat deal of the tabulation, preliminary analysis, and record-keeping could be doneautomatically, where the e-mail survey required a more complex data entry process.Faculty members at the tw6 schools were randomly assigned to receive either the e-mailor Web-based survey. The e-mail administration yielded a much higher response rate(27% vs. 16% at Virginia Tech and 40% vs. 17% at FAMU-FSU) and therefore was usedfor the first administration of the survey at the remaining five schools and for the follow-up administration at all eight schools.
The first administration of the survey was sent to NC A&T in November of 1997,to Virginia Tech and FAMU-FSU in December, to the University of Florida, Clemson,NC State, and UNC-Charlotte in January 1998, and to Georgia Tech in February 1998.The first administration of the survey at Georgia Tech required all replies to go to anintermediary at the Georgia Tech campus, compromising confidentiality and possiblycontributing to the low response rate (on the order of 9%). The second administration ofthe survey was sent in late March directly by Dr. Brawner to faculty members at all eightcampuses without requiring the use of an intermediary at any campus. Most of those whoresponded to the first administration of the survey were deleted from the mailing list forthe second administration.
Description of Sample
In all, 528 surveys were returned of which 503 were valid and usable. Blanksurveys, duplicates, and responses from outside of the population of interest account forthe difference. Table 1 shows the valid responses by institution.
Table 1. Survey responses by survey administration and institution
INameClemson.. 141
FAMU-FSU 72Georgia Tech
.NC.A&TUNC-CharlotteUniversity of FloridaVirginia Tech
32119981
93353289
Total 1549
:::::-:..Total .%E-mail Web E-mail
48 16 64 45.414 6 9 29 40.329 55 84 26.250 18 68 34.225 2 27 33.324 10 34 36.678 20 98 27.838 23 38 99 34.3
306 29 168 503 32.3Note: the total figures have been adjusted for undeliverable and duplicate addresses where possible

Duplicate responses were determined by e-mail addresses and, if available, thereal names of the respondents. In cases of duplication, the first survey returned was usedin the analysis and the second was discarded. Twenty-nine surveys were returned via theWeb, 464 surveys were returned via e-mail, and 10 surveys were returned from facultymembers who printed out the e-mail survey, filled it out by hand, and returned it viaregular mail to the administrator.
Of the 488 responddnts who indicated their sex, 50 or 10.2% were female and89.8% were male. This distribution compares with a population that is 93.2% male and6.8% female. The sample population thus overrepresents women and underrepresentsmen (x2 (1, N = 488) = 9.39, p 0.05).
Roughly two-fifths of the sample (42.5%) indicated that they were full professors,one-third (32.1%) indicated that they were associate professors, two-fifths (19.4%)indicated that they were assistant professors and less than five percent indicated that theywere "instructor/lecturer" or "other." Respondents who indicated that they were "other"and provided an answer that closely resembled one of the other choices were recoded tothe appropriate response (e.g., a person who checked "other" and listed a namedprofessorship was recoded as a professor). The sample population is representative of theunderlying population of the three primary ranks of assistant professor, associateprofessor and full professor (x2 (2, N = 494) = 1.96, not significant).
Roughly three fourths (77%) of the respondents identified themselves asteaching/research faculty and 10% each indicated that they were administrators orteaching faculty. Less than 2% indicated that they were research faculty only. Just overa quarter (27%) of the respondents stated that they had been faculty members for morethan 20 years, a third had 10 to 20 years of service, a fifth had five to ten years of service,and a fifth had less than five years experience. Given the reporting discrepancies of theparticipating schools, it is impossible to determine rigorously if these numbers arerepresentative of the underlying population. However, based on available data, theyappear to be consistent. All of the major engineering disciplines were represented in thesample in proportion to their numbers in the population (x2 (7, N = 483) = 3.81, notsignificant). (See Tables 2-4.)
Table 2. Rank by primary academic function
Teac4irig .
ResearCh::.
Current POSition
Instr/Lecturer..AssistaritAssociateProfessor
10
414
18
63499
688138146
38928770
0 02 23 22 1
Othdr:Tothl
3 23 2 15 15
49 10 380 77 9 2
1217
Admin.. Other Total.%
0 16 3
1 1 1 1 96 19
3 2 1 <1 159 32
43 21 1 <1 210 436 46 0 0 13 3
53 11 3 <1 494 100

Table 3. Rank by years of service
RankInstr/Lecturer
.Yers. Of Service2-5
%6
AssistantAssociateProfessorOtherTotal
31 32 432 1 64 2 5
3 25 1
41 8 60
5-1 '10-20
29 35 3 18
44 14 14 9 94 64 40 61 382 15 7 86 408 1 8 3 25
12 100 20 162 33
> 20 'Total.N .%
12 17 3
0 0 97 2026 16 159 32103 48 213 434 33 12 2
135 27 498 100
Table 4. Engineering discipline of respondents
Discipline .'' Slit Vey % .'i 1360tilatiOn-%::Civil and Environmental 90 18.6 16.6Chemical 37 7.7 6.6Ceramics and Materials 34 7.0 7.0Computer Science* 28 5.8 5.3Electrical and Computer 90 17.9 20.8Industrial and Systems 40 8.3 8.8Mechanical, Aerospace, and Ocean** 107 22.2 22.0All others*** 57 11.8 12.9
Notes: *Computer science is not in the college of engineering at all schools. These numbers only representcomputer science faculty who are in the college of engineering** Ocean engineering is included in this category when it is combined with aerospace engineering in thesame department.*** Includes Agricultural, Architectural, Biological/Agricultural, Bioengineering, Coastal/Oceanographic,Engineering Fundamentals, College of Engineering, Engineering Science and Mechanics, EngineeringTechnology, Mining and Minerals, Nuclear, and Textiles.
Methodology
The data obtained from the SUCCEED Faculty Development Survey wereanalyzed using standard statistical methods and practices. Responses were classifiedaccording to the respondents' sex, rank, position, years of service, level of involvementwith SUCCEED, prior attendance at teaching seminars, and the Carnegie classification ofthe respondents' schools' and were tested to determine if there were any significant
1Carnegie Foundation for the Advancement of Teaching, 1998: See httn://www.carnegiefoundation.orRicthekihe-
dc.htm. Clemson, Florida, Florida State, Georgia Tech, NC State, and Vuginia Tech are classified by the CarnegieFoundation for the Advancement of Teaching as Research institutions while FAMU, NC A&T, and UNC-Charlotte areclassified as Masters institutions. For the purposes of this report, the FAMI.J-FSU College of Engineering was classifiedas a Masters institution.
13
18

differences in response within these categories. The data were analyzed using SPSS® forWindowsrm version 8.0, a popular statistical package for social science research.Responses to scaled questions were analyzed using either t-tests or one-way analysis ofvariance (ANOVA) with the Bonferroni multiple comparisons procedure used to comparemean responses among the various groups. Chi-squared analysis and the Mann-WhitneyU or Kruskal-Wallis H tests were used for categorical data. For the purpose ofdetermining significant differences, alpha was set at 0.05 for all tests of significance.
To identify significant differences among groups, it was necessary to eliminatecertain low-incidence groups from further analysis or to combine categories. Taking thisstep improves the likelihood that significant differences found among the groups aremeaningful rather than simply a statistical artifice. The following adjustments to the datawere made:
Within the rank category, only assistant professor, associate professor, and professorcategories were investigated. This decision eliminated 39 people who identifiedthemselves as either "instructor/lecturer" or "other."Within the current position category, only teaching, teaching/research, andadministration categories were investigated. This decision eliminated 12 people whoidentified their position as "research only" or "other."Within the number of teaching seminars in the 1996-1997 academic year category,the nine people who responded that they had attended more than 5 seminars werecombined with the 35 who indicated that they had attended 3-5 seminars to create a"more than 3" category.Within the level of involvement in SUCCEED category, the 4 people who indicatedthat their involvement level was "other" were eliminated.
Survey Responses
Prior involvement in teaching beyond classroom instruction
Respondents were asked how many teaching seminars, workshops andconferences they had attended in their careers and how many they had attended duringthe 1996-1997 academic year. (See Table 5.) Eighty five percent of the respondentsreported that they had attended at least one teaching seminar in their careers with over13% indicating that they had attended at least ten. More than half reported that they hadattended at least one teaching seminar in the previous academic year.
Respondents were also asked about their level of involvement in SUCCEED-sponsored activities. (See Table 6.) Nearly two-thirds of the respondents indicated thatthey either did not know anything about SUCCEED or that they had heard of it but werenot involved with it, whereas about one-fifth of the respondents reported that they hadbeen actively involved with the Coalition. The latter results may overrepresent thepercentage of actively-involved faculty, which has generally been estimated at around
14
19

10% of the faculty at Coalition institutions. It is certainly not surprising that people whohad been actively involved in SUCCEED were more likely to respond; however, thisoverrepresentation should not affect observed differences between active respondents andtheir less active counterparts.
Table 5. Attendance at teaching seminars, workshops or conferences
Of teachingseminars
Career
None 73 14.71 129 25.63-5 148 29.4610 81 16.1.?10 66 13.1
.TOtal 497 100Since you began teaching; aboutsenunars,.-workshops, conferences, etc.; liave youafierided that ivere stietifiCifiy related t6 ttheili4g9 1
E. # of teaching 1996-1997seminarsNone 2201 151
2 81
3-5 35.>5 9
.Totil 496
44.430.416.37.11.8100
FrOrit'.Septeinber 1996 4100.gnAugustnianY'iefinnars; yibitc..ihOPS.,....ConfeieriCei, etc , did
.yoU attend that irere speCifieally related to-teaching?
Table 6. Level of involvement in SUCCEED programs
Don't know anything about the SUCCEED coalition 41 8.2
.Heard of the Coalition but haven't.been inVolVed :With it 281 56.3Attended a Coalition program but have not actively participated 67 13.4
Been actively involved in a Coalition project 72 14.4
Been a Coalition project leader 34 6.8
Other 4 0.8
.Total 499 100
Rated importance of teaching quality and innovation
Respondents were asked to rate, on a scale of 0 to 10 with 0 meaning "not at allimportant" and 10 meaning "extremely important," the importance of teaching quality tothemselves, their department faculty colleagues, their department head, their dean, andtheir chancellor/president and provost. They were also asked to rate on the same scalethe importance of teaching quality in their institution's faculty incentive and rewardsystem (recognition, raises, tenure, promotion) and the importance of teaching innovation(testing new methods, writing textbooks or instructional software) in their institution'sfaculty incentive and reward system. (See Tables 7-9.)

As Table 7 shows, respondents rated the importance of teaching quality tothemselves as very high and the importance to their colleagues and administratorssignificantly lower. The importance of teaching quality and innovation in the facultyincentive and reward system was rated very low. All of the means are significantlydifferent from each other using a paired samples t-test (p 0.005) with the exception ofthe dean-chancellor/provost pair.
Table 7. Rated importance of teaching quality and innovation
Importance of: Mean . Std. Dev.Quality Respondent 9.26 1.02 500QualitY Colleagues 7.34 1.68 490Quality Dept:Head 7.69 2.14 489Quality Dean 6.98 2.26 483Quality Chancellor/ProvOst 7.00 2.15 474Quality :Reward System 4.74 2.24 487
Innovation Reward Systett 4.50 2.34 481
Men and women differed significantly when rating the importance of teachingquality to their colleagues, their department head, and their dean. (See Table 8.) In allcases, the women's mean ratings were significantly lower than the men's.
Table 8. Importance of teaching quality by sex of respondents
Import4nce ofteadhing quality
Female .Male.SD M . SD ..N F*
Colleagues : 6.62 1.97 47 7.41 1.62 429 9.62 .002Dept. Head 7.13 2.37 47 7.78 2.09 428 3.98 .047'Dean . 6.27 2.22 45 7.07 2.24 425 5.27 .022
* The degrees of freedom for the F statistic are 1 and NF Nm -1
Significant differences exist in the mean responses given by respondents indifferent academic positions. (See Table 9.) The rated importance of teaching quality tothe respondent was significantly higher among those identifying themselves as teachingfaculty than among those who identify themselves as engaging in both teaching andresearch. The importance of teaching to the department head was rated significantlyhigher by administrators (including department heads) than by teaching/research faculty,and administrators similarly rated the importance of teaching quality to their deansignificantly higher than did teaching faculty or teaching/research faculty. Those whoidentified themselves as teaching faculty rated the importance of teaching quality in theacademic reward system significantly lower than did those who identified themselves asadministrators.
16
21

Tab
le 9
. Im
port
ance
of
teac
hing
qua
lity
by p
rim
ary
acad
emic
fun
ctio
n
.::jf
.461
-tat
id6.
1
Te4
ohiu
g
I:yo
u
:Dea
nR
ewar
d SY
Stet
h::
Tea
chin
g:..
.Tea
chitI
WR
esea
ftb,
:i.R
esea
rch
Oth
erSD
.N
SD9.
76,
0.52
499.
20b
1.06
378
9.33
6.7
19
9.28
60.
9753
8.67
41.
153
7.60
62.
2948
7.53
,2.
1237
39.
146
1.07
71.
6950
7.33
63.
063
6.43
,2.
6246
6.90
,2.
1836
78.
29,b
1.70
77.
96b
2.15
523.
063
3.98
,1.
9948
4.74
62.
2136
95.
626
3.02
85.
44b
2.38
5231
33.1
,1.
533
Not
e: M
eans
in th
e sa
me
row
that
do
not s
hare
a s
ubsc
ript
are
sig
nifi
cant
ly d
iffe
rent
at t
he p
< .0
5 le
vel u
sing
the
Bon
ferr
oni t
est.
23
Frequency of use of instructor-centered teaching techniques
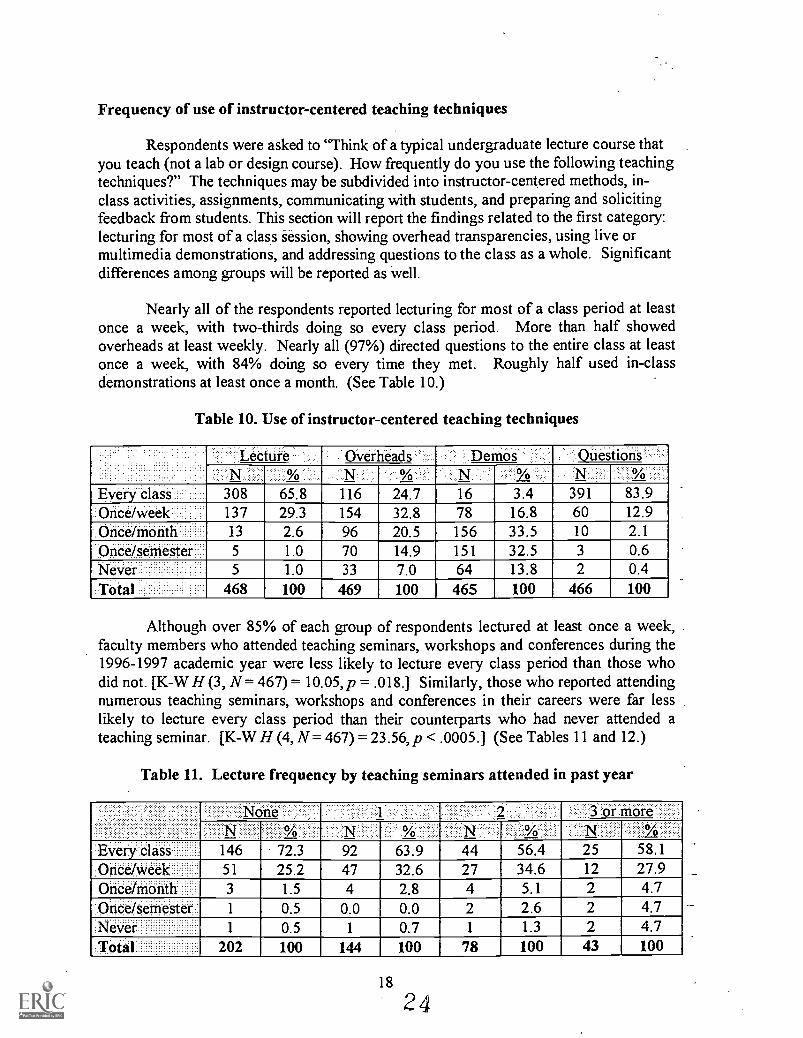
Respondents were asked to "Think of a typical undergaduate lecture course thatyou teach (not a lab or design course). How frequently do you use the following teachingtechniques?" The techniques may be subdivided into instructor-centered methods, in-class activities, assignments, communicating with students, and preparing and solicitingfeedback from students. This section will report the findings related to the first category:lecturing for most of a class -Session, showing overhead transparencies, using live ormultimedia demonstrations, and addressing questions to the class as a whole. Significantdifferences among groups will be reported as well.
Nearly all of the respondents reported lecturing for most of a class period at leastonce a week, with two-thirds doing so every class period. More than half showedoverheads at least weekly. Nearly all (97%) directed questions to the entire class at leastonce a week, with 84% doing so every time they met. Roughly half used in-classdemonstrations at least once a month. (See Table 10.)
Table 10. Use of instructor-centered teaching techniques
Lecture Overheads Demos QuestionS"..:0
Every class 308 65.8 116 24.7 16 3.4 391 83.9Once/week 137 29.3 154 32.8 78 16.8 60 12.9Once/month 13 2.6 96 20.5 156 33.5 10 2.1
Onte/seinesteri::: 5 1.0 70 14.9 151 32.5 3 0.6Never 5 1.0 33 7.0 64 13.8 2 0.4Total 468 100 469 100 465 100 466 100
Mthough over 85% of each group of respondents lectured at least once a week,faculty members who attended teaching seminars, workshops and conferences during the1996-1997 academic year were less likely to lecture every class period than those whodid not. [K-W H (3, N = 467) = 10.05,p = .0181 Similarly, those who reported attendingnumerous teaching seminars, workshops and conferences in their careers were far lesslikely to lecture every class period than their counterparts who had never attended ateaching seminar. [K-W H (4, N = 467) = 23.56, p < .00051 (See Tables 11 and 12.)
Table 11. Lecture frequency by teaching seminars attended in past year
Noé or inoreN.
Every class 146 72.3 92 63.9 44 56.4 25 58.1Once/Week 51 25.2 47 32.6 27 34.6 12 27.9Once/month 3 1.5 4 2.8 4 5.1 2 4.7Oncelsemester 1 0.5 0.0 0.0 2 2.6 2 4.7.Never 1 0.5 1 0.7 1 1.3 2 4.7.Totil 202 100 144 100 78 100 43 100
18
2 4

Table 12. Lecture frequency by teaching seminars attended in career
one .2 .5 6-100 ....% 0/
.:Every:class 57 85.1 84 72.4 87 60.4 48 62.3 31 49.2Once/week 8 11.9 28 24.1 52 36.1 24 31.2 25 39.7
i'Once/month 2 3.0 3 2.6 2 1.4 3 3.9 3 4.8:Once/semester 0 0.0 0 0.0 2 1.4 2 2.6 1 1.6Never. 0 0.0 1 0.9 1 0.7 0 0.0 3 4.8Total 67 100 116 100 144 100 77 100 63 100
Those who had never heard of SUCCEED and those who reported that they hadheard of SUCCEED but weren't involved in it were more likely to report that they lectureevery class period than those who had been involved in SUCCEED in some way. [K7WH (4,N = 462) = 21.26,p < .0005]. (See Table 13.)
Table 13. Lecture frequency by level of involvement in SUCCEED
Don't know Heard, not Atterided Actively PrOjeatanything involved not aCtiVe', involved leaderN % :N N % N
Every:class 27 73.0 191 73.2 35 55.6 37 52.9 15 48.4Once/week 9 24.3 63 24.1 22 34.9 27 38.6 13 41.9Once/month 1 2.7 3 1.1 4 6.3 3 4.3 2 6.5Once/seMeter 0 0.0 2 0. 8 0 0.0 2 2.9 1 3.2Never 0 0.0 2 0.8 2 3.2 1 1.4 0 0.0Total : 37 100 261 100 63 100 70 100 31 100
Those who classified themselves as teaching/research faculty were more likely tolecture every class period than those who classified themselves as either teaching facultyor administrators. [K-W H (2, N = 453) = 6.43, p = .04.] (See Table 14.)
Table 14. Lecture frequency by primary academic function
Teachin_ Teachin e§eardi Administration
'Every:class 27 55.1 249 69.0 23 53.5Once/week 19 38.8 95 36.3 18 41.9.Once/mo nth 0 0.0 11 3.0 2 4.7:Once/semester 3 6.1 1 0.3 0.0:Never 0 0.0 5 1.4 0.0:Taal 49 100 361 100 43 100
19
2 5

Faculty members at Masters institutions were less likely to report that they lectureevery class period than their counterparts at the Research institutions. [M-W U = 13,854,p = .015.] (See Table 15.)
Table 15. Lecture frequency by Carnegie Classification
eseaich Masters
EVery Class 262 68.2 46 54.8OnCe/Week 106 27.6 31 36.9Once/month 7 1.8 6 7.1.0nCe/semester 5 1.3 0 0.0Never 4 1.0 1 1.2Total 384 100 84 100
Women were more likely to report showing overheads every class period or atleast once a week than were men. [M-W U = 7653,p = .011.] (See Table 16.)
Table 16. Frequency of showing overheads by respondents' sex
&male ale
Once/week()nee/Month .
Once/semesterNeverTotal
N15 31.3 99 24.323 47.9 125 30.64 8.3 90 22.15 10.4 63 15.41 2.1 31 7.6
48 100 408 100
Respondents who attended one or more teaching seminars in the past year weresomewhat more likely use demonstrations in class at least once a week and less likely tonever use them. [K-W H (2, N = 468) = 7.49, p= .024.] They were more likely to usedemonstrations at least once a week if they had attended at least six teaching seminars intheir careers and much less likely never to use them if they had been to any teachingseminars. [K-W H (4, N = 464) = 22.56,p < .0005.] (See Tables 17 and 18.)

Table 17. Frequency of use of demonstrations in classby teaching seminars attended in past year
Every classOnce/week.Once/monthOnce/semesterNever ..Total
5458383321204
None 3 or moreN.
26.5 39 27.1 14 17.9 9 21.428.4 47 32.6 33 42.3 16 38.118.6 28 19.4 20 25.6 9 21.416.2 24 16.7 8 10.3 5 11.910.3 6 4.2 3 3.8 3 7.1
100 144 100 78 100 42 100
Table 18. Frequency of use of demonstrations in class bynumber of teaching seminars attended in career
Every classOnce/weekOnce/MonthOnce/semester
.NeverTotal
one 1 2 6-10 > 10
2 3.0 3 2.6 2 1.4 7.8 3 4.98 12.1 17 14.7 21 14.6 13 16.9 19 31.1
14 21.2 37 31.9 61 42.4 20 26.0 24 39.325 37.9 43 37.1 43 29.9 28 36.4 11 18.017 25.8 16 13.8 17 11.8 10 13.0 4 6.666 100 116 100 144 100 77 100 61 100
In-Class Activities
The next responses relate to in-class activities: putting students into pairs or smallgroups for brief intervals during class or for most of a class period to answer questions orsolve problems, and having students work on computer terminals in class.
Fifty-eight percent of the respondents put students in groups for brief intervals atleast once a semester, although few (3.4%) reported doing so every class period. Evenfewer respondents (40%) put students in groups for most of a class period. Mostrespondents (81%) reported that they never have students use computers during class.(See Table 19.)
21 27
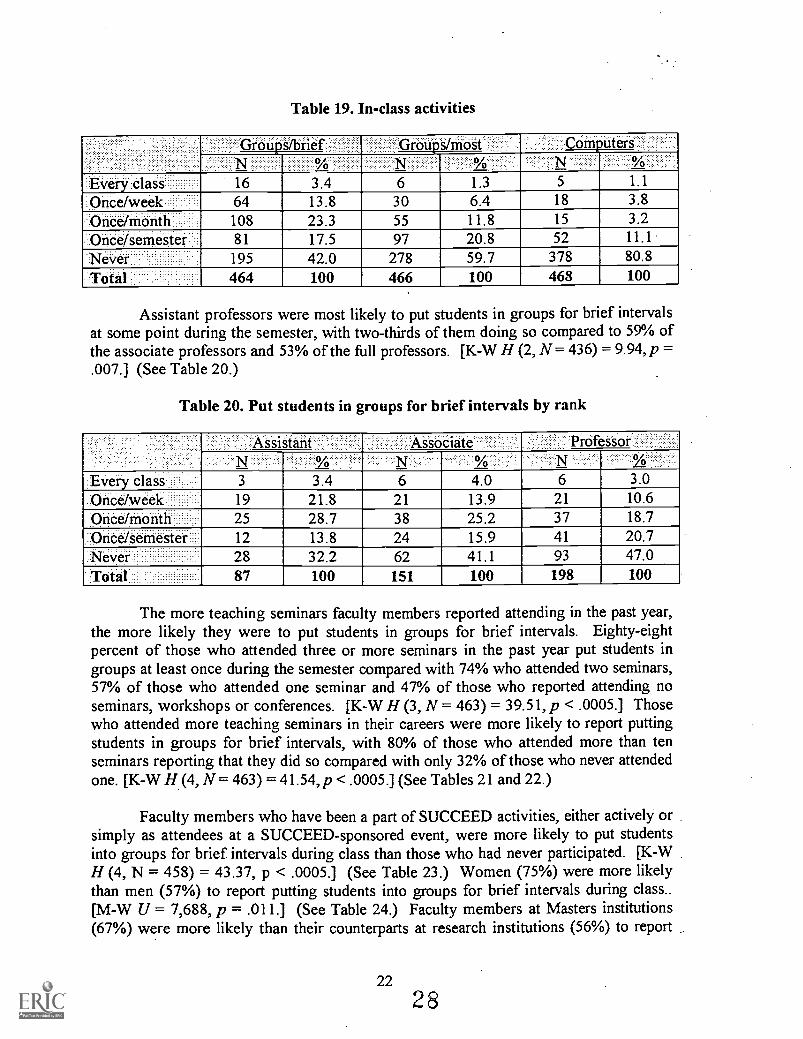
Table 19. In-class activities
:EVery:class:Once/Week;Once/month:;::.OncesernesterNeverTotal
GroUps/brief Comptiters
16 3.4 6 1.3 5 1.1
64 13.8 30 6.4 18 3.8
108 23.3 55 11.8 15 3.281 17.5 97 20.8 52 11.1
195 42.0 278 59.7 378 80.8
464 100 466 100 468 100
Assistant professors were most likely to put students in groups for brief intervalsat some point during the semester, with two-thirds of them doing so compared to 59% ofthe associate professors and 53% of the full professors. [K-W H (2, N = 436) = 9.94, p =.007.] (See Table 20.)
Table 20. Put students in groups for brief intervals by rank
Every classOnce/weekOnce/Month :
:OritOSeinesteri:.Never
Assistan Associate Professor
3 3.4 6 4.0 6 3.019 21.8 21 13.9 21 10.6
25 28.7 38 25.2 37 18.7
12 13.8 24 15.9 41 20.728 32.2 62 41.1 93 47.087 100 151 100 198 100
The more teaching seminars faculty members reported attending in the past year,the more likely they were to put students in groups for brief intervals. Eighty-eightpercent of those who attended three or more seminars in the past year put students ingroups at least once during the semester compared with 74% who attended two seminars,57% of those who attended one seminar and 47% of those who reported attending noseminars, workshops or conferences. [K-W H (3, N = 463) = 39.51, p < .0005.] Thosewho attended more teaching seminars in their careers were more likely to report puttingstudents in groups for brief intervals, with 80% of those who attended more than tenseminars reporting that they did so compared with only 32% of those who never attendedone. [K-W H (4,N = 463) = 41.54,p < .0005.] (See Tables 21 and 22.)
Faculty members who have been a part of SUCCEED activities, either actively orsimply as attendees at a SUCCEED-sponsored event, were more likely to put studentsinto groups for brief intervals during class than those who had never participated. [K-WH (4, N = 458) = 43.37, p < .0005.] (See Table 23.) Women (75%) were more likelythan men (57%) to report putting students into groups for brief intervals during class..[M-W U = 7,688, p = .011.] (See Table 24.) Faculty members at Masters institutions(67%) were more likely than their counterparts at research institutions (56%) to report

putting students in groups for brief intervals at some point during the semester. [M-W U= 13,854,p = .015.] (See Table 25.)
Table 21. Put students in groups for brief intervalsby teaching seminars attended in past year
Every :Class'.Once/WeekOnce/mOnth:Once/Seinester-..NeverTotal
.Norie 3 or more .
5 2.5 4 2.8 3 3.9 4 9.820 9.9 14 9.9 19 24.7 11 26.836 17.7 40 28.2 19 24.7 13 31.734 16.7 23 16.2 16 20.8 8 19.5108 53.2 61 43.0 20 26.0 12.2203 100 142 100 77 100 41 100
Table 22. Put students in groups for brief intervalsby teaching seminars attended in career
None
Every.class
%
0.0 5.1
3-5
1.4
.6-10
3.9 8.2Once/week- 4 6.1 15 12.8 19 13.2 9 11.8 17 27.9'Onte/mon hil: 7 10.6 18 15.4 43 29.9 27 15.5 13 21.3Once/semester 10 15.2 16 13.7 29 21.1 12 15.8 14 23.0Never 45 68.2 62 53.0 51 35.4 25 32.9 12 19.7
TOtal 66 100 117 100 144 100 76 100 61 100
Table 23. Put students in groups for brief intervalsby level of involvement in SUCCEED
Oret,kne*involved
:EVery iclgss 0 0.0 7 2.7Once/Week 1 2.8 24 9.3
:-Once/month 7 19.4 51 19.8.Once/semesterNever
10 27.8 40 15.618 50.0 135 52.536 100 257 100
23
ttended ACtiVely: Projectnot active .involved II leader
4 6.3 4 5.7 1 3.212 18.8 16 22.9 9 29.017 26.6 24 34.3 8 25.816 25.0 11 15.7 4 12.9
15 23.4 15 21.4 29.064 1 70 100 31 100
9

Table 24. Put students in groups for brief intervals by sex of respondents
:Every.claSSOnce/weekOnce/monthOnce/semesterNeverTotal
Teniale
0 0.0 16 4.011 22.9 52 12.917 35.4 88 21.88 16.7 72 17.912 25.0 175 43.448 100 403 100
Table 25. Put students in groups for brief intervals by Carnegie classificationResearc ...Masters .
Every class-Once/weekOnce/month'Once/semesterNeverTotal
11 2.9 5 6.048 12.6 16 19.086 22.6 22 26.268 17.9 13 15.5
167 43.9 28 33.3380 100 84 100
The more teaching seminars faculty members reported attending, the more likelythey were to report putting students in groups for most of the class period at some pointduring the semester. Sixty-one percent of those who attended three or more seminars inthe past year put students in groups at least once during the semester compared with 52%who attended two seminars, 44% of those who attended one seminar, and 30% of thosewho reported attending no seminars, workshops or conferences. [K-W H (3, N = 465) =20.98,p < .0005.] (See Table 26.) Similarly, 66% of those who reported attending morethan ten teaching seminars, workshops or conferences in their careers reported that theyput students in groups for most of class at least once during the semester, compared withabout 40% of those who had attended one to ten seminars and 18% of those who hadattended no teaching seminars in their careers [K-W H (4, N = 466) = 29.81, p < .0005.](See Table 27.)
At least 45% of those who had been involved in SUCCEED, either byparticipating in one or more projects or by attending a SUCCEED-sponsored event,reported that they put students into groups for most of class, compared with less than35% of those who had not heard of SUCCEED or participated in any SUCCEEDsponsored activities [K-W H (4, N = 460) = 12.03, p =.017.] (See Table 28.) Women(56%) were more likely than men (39%) to report that they put students into groups formost of class at least once during the semester. Nearly 30% of the women did so at leastonce a month compared with only 19% of the men [M-W U = 8,078, p = .03.] (SeeTable 29.) Faculty members at Masters institutions (51%) were more likely than their
24
3 0

counterparts at research institutions (38%) to report putting students in groups for most ofclass at some point during the semester. [M-W U = 13,773,p = .03.] (See Table 30.)
Table 26. Put students in groups for most of classby teaching seminars attended in past year
one
.. :
:-Every.class: 0.5 1.4
or-More
1.3 2 4.9:Once/week 10 4.9 8 5.6 9 11.7 3 7.3.0ne&month 20 9.9 17 11.8 10 13.0 8 19.5..Once/semester 29 14.3 36 25.0 20 26.0 12 29.3.Never 143 70.4 81 56.3 37 48.1 16 39.0*Total 203 100 144 100 77 100 41 100
Table 27. Put students in groups for most of classby teaching seminars attended in career
None'
Every claSs.Once/weekOnce/month
*Once/semester:.:NeverTotal
0 0.02 3.04 6.16 9.1
54 81.866 100
2
917
1.77.714.5
20 17.169 59.0117 100
N 13/
1 0.77 4.815 10.335 24.187 60.0
145 100
1
3
10
1.3
3.913.0
299
3.314.814.8
16 20.8 20 32.847 61.0 21 34.477 100 61 100
Table 28. Put students in groups for most of classby level of involvement in SUCCEED
Don't knowanythingN
Heatd.- notInvolved
very classOnce/wee
0.00.0
:Once/month 7 19.4:Once/semester:Never::Total
7 19.422 61.136 100
N ')/(;'
2 0.8 1 1.613 5.0 7 10.926 10.0 6 9.448 18.5 18 28.1170 65.6 32 50.0259 100 64 100
25
3 1
Actively.mvolved
3 4.38 11.4
02
0.06.5
10 14.3 6 19.415 21.4 6 19.434 48.6 17 54.870 100 31 100
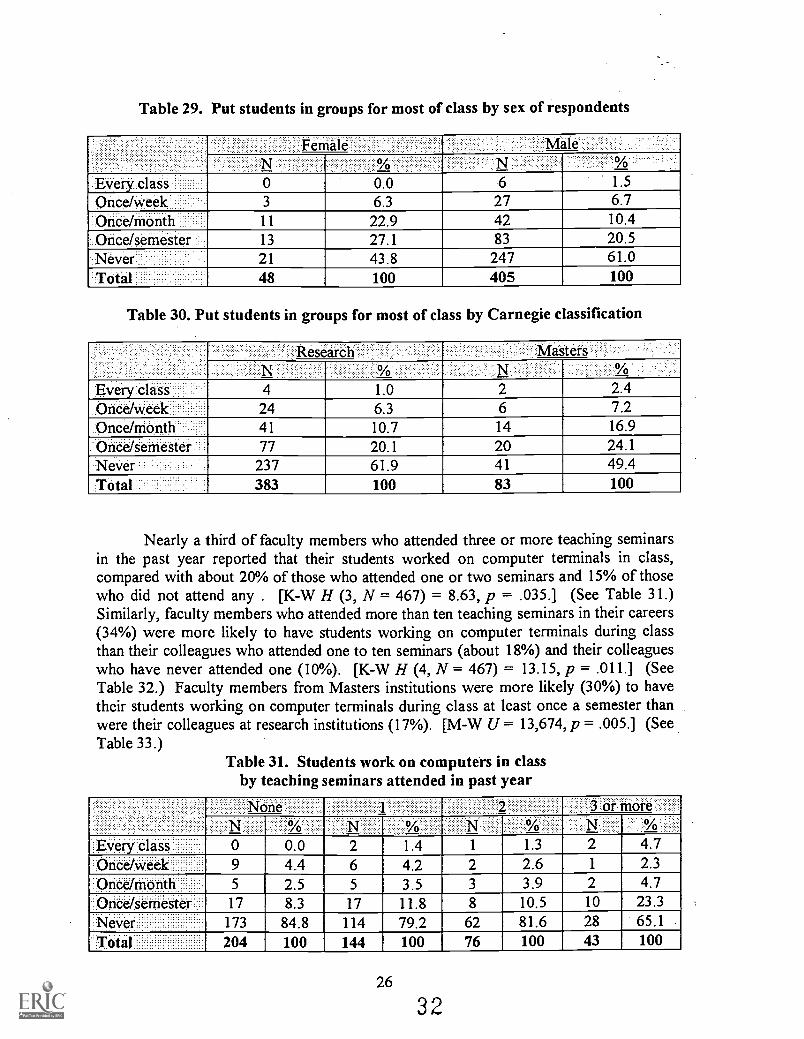
Table 29. Put students in groups for most of class by sex of respondents
E,Very classOnce/WeekOnce/monthOnce/semesterNeverTotal .
Male.
0 0.0 6 1.5
3 6.3 27 6.7
11 22.9 42 10.413 27.1 83 20.521 43.8 247 61.048 100 405 100
Table 30. Put students in groups for most of class by Carnegie classification
Every classOnce/weekOnce/mOnth
Researc Masters
Once/semester.NeverTotal
4 1.0 2 2.424 6.3 6 7.241 10.7 14 16.977 20.1 20 24.1
237 61.9 41 49.4383 100 83 100
Nearly a third of faculty members who attended three or more teaching seminarsin the past year reported that their students worked on computer terminals in class,compared with about 20% of those who attended one or two seminars and 15% of thosewho did not attend any . [K-W H (3, N = 467) = 8.63, p = .035.] (See Table 31.)Similarly, faculty members who attended more than ten teaching seminars in their careers(34%) were more likely to have students working on computer terminals during classthan their colleagues who attended one to ten seminars (about 18%) and their colleagueswho have never attended one (10%). [K-W H (4, N = 467) = 13.15, p = .011.] (SeeTable 32.) Faculty members from Masters institutions were more likely (30%) to havetheir students working on computer terminals during class at least once a semester thanwere their colleagues at research institutions (17%). [M-W U = 13,674, p = .005.] (SeeTable 33.)
Table 31. Students work on computers in classby teaching seminars attended in past year
None 1 2- or more
'EVerY!Class 0 0.0 2 1.4 1 1.3 2 4.7Once/week' ..... 9 4.4 6 4.2 2 2.6 1 2.3
nee/Month 5 2.5 5 3.5 3 3.9 2 4.7nee/semester 17 8,3 17 11.8 8 10.5 10 23.3
ever 173 84.8 114 79.2 62 81.6 28 65.1
"Totil 204 100 144 100 76 100 43 100
26
32

Table 32. Students work on computer terminals duringclass by teaching seminars attended in career
EvelyclasS:Once/week.0nce/Month:-...Once/semesterNeverTotal
1 640 > 10 :
0 0.0 1 0.9 1 0.7 0 0.0 3 4.81 1.5 6 5.1 4 2.8 3 3.9 4 6.51 1.5 4 3.4 5 3.5 1 1.3 4 6.55 7.5 10 8.5 16 11.1 11 14.3 10 16.1
60 89.6 96 82.1 118 81.9 62 80.5 41 66.167 100 117 100 144 100 77 100 62 100
Table 33. Students work on computer terminals in class by Carnegie classification
Research Masters
,Eyery :class 5 1.3 0 0.0Once/week 12 3.1 . 6 7.3
Once/month 10 2.6 5 6.1
Ottooseme$teri: 38 9.8 14 17.1
Never 321 83.2 57 69.5Total 386 100 82 100
Assignments
This section reports frequencies with which respondents assigned homework toindividuals (as opposed to teams), gave students the option of working in teams tocomplete homework, required students to work in teams to complete homework, assignedat least one major team project, and gave writing assignments (exercises that requiredverbal explanations and not just calculations). (See Table 34.)
Just over half (55%) of the respondents gave students individual homeworkassignments weekly and only 7% never gave individual assignments. About a quarter(24%) gave students the option to do their homework in teams every week and abouttwo-thirds allowed students the option of doing homework in teams at some time duringthe semester. About 10% required students to do weekly homework in teams and morethan half (55%) never required students to work in teams. Most respondents (85%)required students to do a writing assignment during the semester, although only 7%required such assignments weekly. Three-fourths of the respondents required a majorteam project in some or all of the courses that they taught.

Table 34. Assignments
Individual HW Team option
1-3 times/week1-3 times/month1-3 times/sem.
.NeVer
255 54.6148 -31.731 6.633 7.1
110 24.278 17.2110 24.2156 34.4
Team requiredWriting
assignment
45 9.7 36 7.1
47 10.1 131 26.0117 25.2 225 44.6256 55.1 73 14.5
Assign one major team project
In everY course I teach 111 23.8In some, but not 'all, courses I teach. 242 51.9
.Never 113 24.2
Respondents who attended three or more teaching seminars in 1996-1997 wereless likely (36%) to assign homework to individuals weekly than their counterparts whohad attended fewer seminars (roughly 60%) or no seminars (52%) [K-W H (3, N = 466)= 9.53,p = .023.] (See Table 35.)
Table 35. Assign homework to individuals by numberof teaching seminars attended in past year
;-3 tirtieS/AV&k
1-3 times/month1-3 times/semester
Neveri::
:TOtal
3 or 'more..N
106 52.2 87 60.8 46 59.0 15 35.775 36.9 39 27.3 18 23.1 16 38.15 2.5 9 6.3 10 12.8 7 16.717 8.4 8 5.6 4 5.1 4 9.5
203 100 143 100 78 100 42 100
About two-thirds of those respondents who had ever attended a teaching seminarin their careers allowed students the option of doing at least some of their homework inteams, compared with less than half of those who had never attended a teaching seminarin their careers. [K-W H (4, N = 453) = 10.05,p = .04.] (See Table 36.) Administrators(84%) were more likely to offer their students the option of doing homework in teamsthan their teaching (67%) or teaching/research (70%) counterparts. [K-W H (2, N = 440)= 6.43,p = .049.] (See Table 37.)
28
3 4

Table 36. Option to do homework in teams by teaching seminars attended in career
orie 6-10
1-3 times/week 10 15.2 33 28.9 30 21.6 20 26.7 16 27.1- 10 15.2 19 16.7 23 16.5 12 16.0 14 23.7
1-3 times/semester 11 16.7 28 24.6 45 32.4 17 22.7 9 15.3'Never 35 53.0 34 29.8 41 29.5 26 34.7 20 33.9Total..... 66 100 114 100 139 100 75 100 59 100
Table 37. Option to do homework in teams by primary academic function
1-3 times/weelc
1-3 times/semester
Total ..
Teaching .:,..:TeaChing/ReSearch.. Administration
18 37.5 76 21.8 11 25.06 12.5 60 17.2 11 25.08 16.7 82 23.6 15 34.116 33.3 130 29.5 7 15.948 100 348 100 44 100
Faculty members who did not attend any teaching seminars in the past year wereless likely to ever require students to work in groups to do their homework (32%) thanthose who attended any teaching seminars (45%-54%) [K-W H (3, N = 464) = 10.89,p =.0121 (See Table 38.) Similarly, faculty members who have never attended a teachingseminar in their careers were less likely (19%) to ever require students to work in groupsthan those who had attended at least one teaching seminar in their careers (42% 56%).[K-W H (4, N = 464) = 22.63,p < .0005.1 (See Tables 38 and 39.)
Table 38. Require teams for homework by teaching seminars attended in past year
None ot More'
-3 times/week 17 8.5 13 9.1 8 10.3 7 16.7imes/month 16 8.0 16 11.2 7 9.0 8 19.0
:.1.-3.times/semester 40 19.9 49 34.3 20 25.6 7 16.7Never 128 63.7 65 45.5 43 55.1 20 47.6TOtal 201 100 143 100 78 100 42 100
293 5

Table 39. Require teams for homework by teaching seminars attended in career
1-3 times/week1-3 times/month1-3 times/semesterNeverTotal
None 1-; 6-10. > 10% %
2 3.0 14 12.2 13 9.1 7 9.1 9 14.51 1.5 14 12.2 12 8.4 11 14.3 9 14.510 14.9 24 20.9 50 35.0 25 32.5 8 12.954 80.6 63 54.8 68 47.6 34 44.2 36 58.167 100 115 100 143 100 77 100 62 100
About 30% of those who reported participating in SUCCEED required students towork in teams to complete their homework at least monthly, compared with 24% of thosewho had never heard of SUCCEED and 13% of those who had heard of SUCCEED butwere not involved in it. [K-W H (4, N = 459) = T7.48, p < .0005.] (See Table 40.)
Table 40. Require teams for homework by level of SUCCEED involvement
1-3 times/Week.1-3 times/month1-3 times/semesterNeverTotal
.Don't knovi .Heard not Attended, ..!.ACtiVelk Project
...anything involved not active leaderN. ;N1 2.7 21 8.1 10 15.9 9 13.0 4 12.98 21.6 12 4.6 10 15.9 12 17.4 5 16.110 27.0 58 22.4 17 27.0 22 31.9 8 25.818 48.6 168 64.9 26 41.3 26 37.7 14 45.237 100 259 100 63 100 69 100 31 100
Those who attended three or more teaching seminars in the past year were muchmore likely (43%) to assign a major team project in every course they teach than werethose who had attended two (31%), one (23%), or no (18%) teaching seminars that year.[K-W H (3,N = 465) = 13.05,p = .005.] Similarly, the likelihood of faculty assigning amajor team project in every course increased from a low of 17% for those who had neverattended a teaching seminar in their careers to a high of 39% for those who had attended10 or more. [K-W H (4, N = 465) = 12.94,p = .012.] (See Tables 41 and 42.)
Table 41. Assign a major team project by teaching seminars attended in past year
None 3 or more
'In:every...course.I:teach 36 17.8 33 22.9 24 31.2 18 42.9.In soine;hUtinot 014,cOUrSes 108 53.5 80 55.6 35 45.5 18 42.9-NeVer. 58 28.7 31 21.5 18 23.4 6 14.3
ITota 202 100 144 100 77 100 42 100

Table 42. Assign a major team project by teaching seminars attended in career
. ..........:In.every.course.In someCOUrses:NeverTotal
one 6-10 > 10
11 16.7 27 23.1 30 20.8 19 25.0 24 38.728 42.4 62 53.0 86 59.7 39 51.3 26 41.927 40.9 28 23.9 28 19.4 18 23.7 12 19.4
66 "100 117 100 144 100 76 100 62 100
Teaching faculty (69%) were less likely than teaching/research faculty (75%) andadministrators (84%) to assign major team projects. [K-W H (2, N = 451) = 8.31, p =.016.] (See Table 43.) Faculty members at Masters institutions were more likely (91%)to assign a major team project to their undergraduate students than were faculty membersat research institutions (73%). [M-W U = 12,492,p = .001.] (See Table 44.)
Table 43. Assign a major team project by primary academic function
In every Course' I teachIn some courses I teachNever.Total
,Teaching Teachin esearch Administration6.,..
6 12.2 83 23.1 17 39.5
28 57.1 187 52.1 19 44.215 30.6 89 24.8 7 16.3
49 100 359 100 43 100
Table 44. Assign a major team project by Carnegie classification
:In everyCOUrSell teachIn sorne,:but not all,. courses I teac
. .... ......... . .............
Total
esearch Masters0
86 22.4 25 30.5
192 50.0 50 61.0106 27.6 7 8.5
384 100 82 100
The more teaching seminars that faculty members attended in the past year, themore likely they were to give writing assignments at least monthly. Nearly all (95%) ofthose who attended at least three teaching seminars during the year gave a writingassignment at some point during the semester. [K-W H (3, N = 464) = 9.95, p = .019.]The number of respondents who never gave a writing assignment during the semestervaried from a high of 26% for those who never attended a teaching seminar in theircareers to less than 20% for those who attended one or more. [K-W H (4, N = 464) =10.'77,p = .029.] (See Tables 45 and 46.)
31
3 7

Table 45. Give a writing assignment by teaching seminars attended in past year
1-3 times/week 10 5.0 9 6.3 12 15.81-3 times/month 54 26.9 43 29.9 19 25.01-3 times/semester 95 47.3 74 51.4 35 46.1Never 42 20.9 18 12.5 10 13.2Total 201 100 144 100 76 100
11.634.948.84.7100
Table 46. Give a writing assignment by teaching seminars attended in career
1-3 times/week1-3 times/month1-3 times/semesterNeverTotal
Communications
None 2 -5 6 10 > 10% N %
5 7.6 6 5.2 8 5.6 7 9.1 9 14.519 28.8 33 28.4 38 26.6 16 20.8 25 40.325 37.9 59 50.9 81 56.6 39 50.6 21 33.317 25.8 18 15.5 16 11.2 15 19.5 7 11.3
66 100 116 100 143 100 77 100 62 100
Table 47 summarizes faculty's use of electronic mail and the World Wide Web tocommunicate with students. Nearly two-thirds of respondents use electronic mail or theWorld Wide Web to communicate with students in their classes at some point in thesemester, and about a quarter use each method weekly.
Table 47. Communication with students
Use e-mail USe WWW
.At least once/Week" 122 24.6 136 27.6Less than once/wee more t an once/mont 110 22.2 67 13.6Once a month or less 90 18.2 105 21.3
Never 173 34.9 185 37.5
Faculty members who attended teaching seminars in the past academic year weremore likely to use e-mail to communicate with their students than those who attendednone of these activities. Roughly 76% of those who attended two or more teachingseminars used this communications medium, compared with 67% of those who attendedone seminar and 57% of those who attended none. [K-W H (3, N = 492) = 16.07, p =.001.] Similarly, faculty members who had attended more than 10 teaching seminars,workshops and conferences in their careers were more likely than anyone else to use e-
32
3 8

mail to communicate with their classes at some point during the semester. [K-W H(4, N= 492) = 12.13,p = .016.] (See Tables 48 and 49.)
Table 48. Use e-mail to communicate with classby teaching seminars attended in past year
At least once/weekLess than once/week,more than'orice/monthOnce a month or lessNeVeri'.::
Total
None 'tie
N. N -:% %
49 22.5 28 18.5 26 32.5 18 41.9
42 19.3 37 24.5 21 26.3 10 23.3
34 15.6 37 24.5 14 17.5 5 11.6
93 42.7 49 32.5 19 23.8 10 23.3
218 100 151 100 80 100 43 100
Table 49. Use e-mail to communicate with entireclass by teaching seminars attended in career
None 1-2 &10 > 10
At'leaSt once/week 13 18.1 40 31.0 31 21.2 13 16.0 24 37.5
Less than once/week,more than once/month 20 27.8 22 17.1 30 20.5 21 25.9 17 26.6
Once a month or less 10 13.9 23 17.8 29 19.9 19 23.5 9 14.1
Never 29 40.3 44 34.1 56 38.4 28 34.6 14 21.9
Total 72 100 129 100 146 100 81 100 64 100
Assistant professors (73%) and associate professors (69%) were more likely thanfull professors (59%) to use e-mail to communicate with their classes. Roughly 32% ofassistant professors did so weekly compared with 28% of associate professors and 19%of full professors. [K-W H (2,N = 466) = 10.40,p = .006.] (See Table 50.)
Table 50. Use e-mail to communicate with entire class by academic rank
Assistan s'sOciate . ProfeSsor.:
i.2Nt: least:once/week 30 31.6 44 27.7 40 18.9
'Less-than:once/wee.:more :than:once/month:: 26 27.4 32 20.1 47 22.2
:Once:a.month.oriless 13 13.7 34 21.4 37 17.5
Never 26 27.4 49 30.8 88 41.5
::TOta 95 100 159 100 212 100
33
3 9

Assistant professors (76%) were much more likely than associate professors(61%) or full professors (58%) to use the World Wide Web as a communications mediumwith their students. [K-W H (2, N = 463) = 10.60, p = .005.1 (See Table 51.)Teaching/research faculty (65%) and administrators (60%) were more likely to use theWeb to communicate with their classes at some point during the semester than teachingfaculty (48%); however, teaching (33%) and teaching/research (30%) faculty were morelikely to use the Web weekly than their administrative counterparts (8%). [K-W H (2, N= 473) = 6.045, p = .049.] (See Table 52.)
Table 51. Use World Wide Web to provide informationto the entire class by academic rank
Assistant Associate Professor
:At.least once/week 34 35.4 46 29.5 47 22.3Less than once/week,more than once/month 16 16.7 22 14.1 26 12.3
On66.4 ...... orleSS 23 24.0 28 17.9 50 23.7Never 23 24.0 60 38.5 88 41.7TOtal 96 100 156 100 211 100
Table 52. Use World Wide Web to provide informationto the entire class by primary academic function
Teaching/esearch Administration
At least once/week 16 33.3 111 29.6.LesSEthan:OnCe/week,.bribrelhan once/Month.:. 0 0.0 56 14.9Once a month orless 7 14.6 77 20.5Never 25 52.1 131 34.9Total 48 100 375 100
Writing objectives and soliciting feedback from students
4 8.0
10 20.016 32.020 40.050 100
This section summarizes how often faculty members give their students explicitindications of what they (the students) should be able to do to demonstrate their masteryof course material, and how often the faculty members ask the students for feedback onthe course instruction.
34
40

Respondents were asked how often they write instructional objectives for theircourses. Nearly four in ten said that they always do so, with an additional 20%responding that they usually do so. About 60% reported that they always or usuallyprovide study guides to their students for tests and exams and more than a third always doso. (See Table 53.)
Table 53. Providing instructional objectives and study guides
Always .
Usually
'Never
Instructional Ob'ectives Study guides fOr tests Study guides for exams
194 39.0 170 34.8 193 39.1104 20.9 117 23.9 103 20.9103 20.7 107 21.9 87 17.6
96 19.3 95 19.4 110 22.3
There were no significant between-group differences in providing study guidesfor tests. The number of seminars attended in the past year did have a significant impacton whether respondents wrote instructional objectives for their courses [K-W H (3, N =494) = 8.04, p = .045] as did the number of seminars attended throughout therespondent's career [K-W H (4, N = 494) = 13.08,p = .011]. (See Tables 54 and 55).
Table 54. Write instructional objectives by teaching seminars attended in past year
'AlWAYs....
UsuallYSometimes'Never:Total
:None 3 or more
80 36.5 56 37.3 35 43.2 22 50.037 17.8 38 25.3 17 21.0 10 22.742 19.2 36 24.0 16 19.8 8 18.258 26.5 20 13.3 13 16.0 4 9.1
219 100 150 100 81 100 44 100
Table 55. Write instructional objectives by teaching seminars attended in career
'Always:UsuallySometimes
:Never.TOtal
None 640(/0
19 26.4 54 41.9 59 40.4 29 35.8 33 50.015 20.8 23 17.8 35 24.0 14 17.3 16 24.218 25.0 22 17.1 29 19.9 23 28.4 10 15.220 27.8 30 23.3 23 15.8 15 18.5 7 10.672 100 129 100 146 100 81 100 66 100
Although nearly all (98.8%) of the respondents solicited feedback at least once asemester, only 41% did so more often than that. Very few (4%) asked for feedback everyclass and an additional 10.7% did so at least once a week. (See Table 56.)
35
41

Table 56. Frequency of seeking student feedback
Every Class 20 4.0One or more times a week 53 10.7OneormoretiMeS"aMOrith'::r 133 26.8One or more times a semester 285 57.3Neyer 6 1.2.TOtal . . .. ;;:: 497 100
Those who attended two or more teaching seminars in the past year were morelikely to solicit feedback from their students more than once during the semester (54%)than were those who only attended one teaching seminar (40%) or no seminars (35%).Those who attended no teaching seminars in the past year were less likely to solicitfeedback at least once a week (6%) than those who attended one (14%), two (21%), orthree or more seminars (23%) [K-W H (3, N = 494) = 13.91,p = .003]. (See Table 57).
Table 57. Soliciting feedback from studentsby teaching seminars attended in past year
Everyclass:OnCe/week':Once/Month'Once/SeMeSterNever.Total
Or' linOfe
N . N %7 3.2 5 3.3 4 5.0 4 9.318 3.2 16 10.6 13 16.3 6 14.052 23.6 40 26.5 26 32.5 14 32.6139 63.2 89 58.9 36 45.0 19 44.24 1.8 1 0.7 1 1.3 0 0.0
220 100 151 100 80 100 43 100
Faculty members at Masters institutions were more likely to solicit feedback fromtheir students more than once a semester (51%) than were their colleagues at Researchinstitutions (39%), with more than 20% at the Masters institutions doing so at leastweekly compared with only 13% at the Research institutions [M-W U = 15,774, p =.029]. (See Table 58.)
Table 58. Soliciting feedback from students by Carnegie classification
Research MasteisN.
Every.class 13 3.2 7 7.9:OnceiWeek 41 10.0 12 13.5
Oridemonth 107 26.2 26 29.2Once/semester.' 242 59.3 43 48.3
Never 5 1.2 1 1.1
:Total 408 100 89 100
36
4 2

Involvement in Teaching Improvement Programs
Nearly two-thirds (63.3%) of the respondents reported that there was a teachingcenter on their campus. Most of the rest (30.6%) indicated that they did not know. Thefew who said that there was not a teaching center on campus were spread out amongseven of the eight schools but concentrated at one of them (12/29), which is reasonablebecause there was no teaching center at that one when the survey was conducted.
Faculty members were asked how often they had used faculty developmentresources on their campuses. Over half of the 339 people who responded to this question(54.9%) indicated that they had used these resources at least once. Of the 193 peoplewho indicated that they had used faculty development resources at all, most (88.6%)indicated that they had attended a workshop or seminar. Fewer consulted or borrowedbooks (31.1%), worked individually with a teaching consultant (13.5%), or indicated thatthey had done something else (9.3%). (Note that respondents were asked to mark allresponses that applied.) Within the "other" category, open-ended responses includedbeing videotaped while teaching and receiving assistance in the use of technology in theclassroom.
Faculty members who attended teaching seminars in the past year were morelikely than those who did not to report that they used on-campus faculty developmentresources extensively or occasionally. Sixty-three percent of those who attended three ormore teaching seminars and used these resources used them extensively or occasionally,compared with 57% of those who attended two seminars, 47% of those who attended oneseminar and only 24% of those who did not attend any teaching seminars, workshops, orconferences. This result is not surprising in light of the fact that attending a teachingseminar on campus was one of the faculty development resources specified. [K-W H (3,N = 335) = 35.874, p < .00051 (See Table 59.)
Table 59. Use of faculty development resourcesby teaching seminars attended in past year
Orie. 3 or rnore
Extensively 2 1.5 2 1.9 3 5.2 4 10.5
Occasionally 30 22.1 46 44.7 30 51.7 20 52.6
.Once 20 14.7 15 14.6 10 17.2 3 7.9
:Never 84 61.8 40 38.8 15 25.9 11 28.9
Total 136 100 103 100 58 100 38 100
Not surprisingly, use of faculty development resources also correlated with careerattendance at seminars. Sixty four percent of those who had attended more than 10seminars in their careers, 49% of those who attended between six and ten career teachingseminars and 52% of those who attended between three and five seminars reported usingfaculty development resources extensively or occasionally compared with 20% of those

who reported attending one or two teaching seminars in their careers and 17% of thosewho had never attended a teaching seminar, workshop, or conference [K-W H (4, N =336) = 48.082,p < .0005.] (See Table 60.)
Table 60. Use of faculty development resources by career teaching seminars6-10 >
NExtensively 1 2.4 1 1.2 2 1.9 2 3.4 5 10.6Occasionally 6 14.3 15 18.3 53 50.0 27 45.8 25 53.2:Once 2 4.8 17 20:7 14 13.2 8 13.6 7 14.9Never 33 78.6 49 59.8 37 34.9 22 37.3 10 21.3Total 42 100 82 100 106 100 59 100 47 100
Women were significantly more likely to use faculty development resources thanwere men, with two-thirds using them at least once compared with just over half of-themen [M-W U = 4725,p = .037]. (See Table 61.)
Table 61 . Use of faculty development resources by sex of respondents
Female ' Male
Extensively 2 5.0 9 3.1:Occasionally 21 52.5 105 35.7Once 4 10.0 42 14.4Never 13 32.5 136 46.7Total 40 100 291 100
Respondents were asked how often they discussed teaching techniques withcolleagues and graduate students. More than half did so with colleagues at least once amonth while less than three in ten did so with graduate students that often. (See Table62.)
Table 62. Discussion of teaching techniques with colleagues and graduate students
With colleaguesWith Graduate
Students
.At least once a week 61 12.3 34 6.9:Less'thari:once:awee ut.:rnore-thatroncenmont 203 40.8 106 21.6.Onc.e.a month.or:less 209 42.1 231 47.0Never 24 4.8 77 15.7
on't work wi grad studen 43 8.8:Total 497 100 491 100
38
4 4

The more teaching seminars respondents attended in the past year, the more likelythey were to discuss teaching techniques with their colleagues on at least a monthly basis.Sixty-three percent of those who attended three or more seminars did so more than once amonth, compared with 60% of those who attended two seminars, 55% of those whoattended one seminar and 47% of those who did not attend any teaching seminars in thepast year [K-W H (3, N = 493) = 8.283,p = .041]. (See Table 63.)
Table 63. Discussion of teaching techniques with colleaguesby teaching seminars attended in past year
-None Tbiqiidre
!At least:once .a:week::- 22 10.1 20 13.2 13 16.0 5 11.6
.1.,.ess than -once.a week:butmore than once a month 80 36.7 63 41.7 36 44.4 22 51.2:Ona:mOhor less 100 45.9 64 42.4 31 38.3 13 30.2
Never 16 7.3 4 2.6 1 1.2 3 7.0.:TOtal 218 100 151 100 81 100 43 100
A similar pattern was observed in the relationship between discussing teachingtechniques with colleagues and teaching seminars attended in career, with the percentagesof those doing so more than once a month ranging from 67% for those who had attendedten or more seminars to 45% for those who had attended two or fewer. [K-W H (4, N =493) = 13.416,p = .009.] (See Table 64.)
Table 64. Discussion of teaching techniques with colleaguesby teaching seminars attended in career.
At least once a WeekI.,ess than once a week but
'More than once a month:Once:a :month orlessNever
:]Total
None 6-10 10
A3 4.2 17 13.2 17 11.7 12 14.8 11 16.7
29 40.3 41 31.8 71 49.0 29 35.8 33 50.032 44.4 64 49.6 54 37.2 39 48.1 17 25.88 11.1 7 5.4 2.1 1 1.2 5 7.6
72 100 129 100 145 100 81 100 66 100
Respondents who knew nothing about SUCCEED were less likely to engage indiscussions of teaching with colleagues at least once a month than were respondents whoknew about SUCCEED, but the frequency of discussion of teaching was relativelyindependent of the level of involvement with the Coalition. [K-W H (4, N = 491) =9.489,p = .05.] (See Table 65.)
39
45
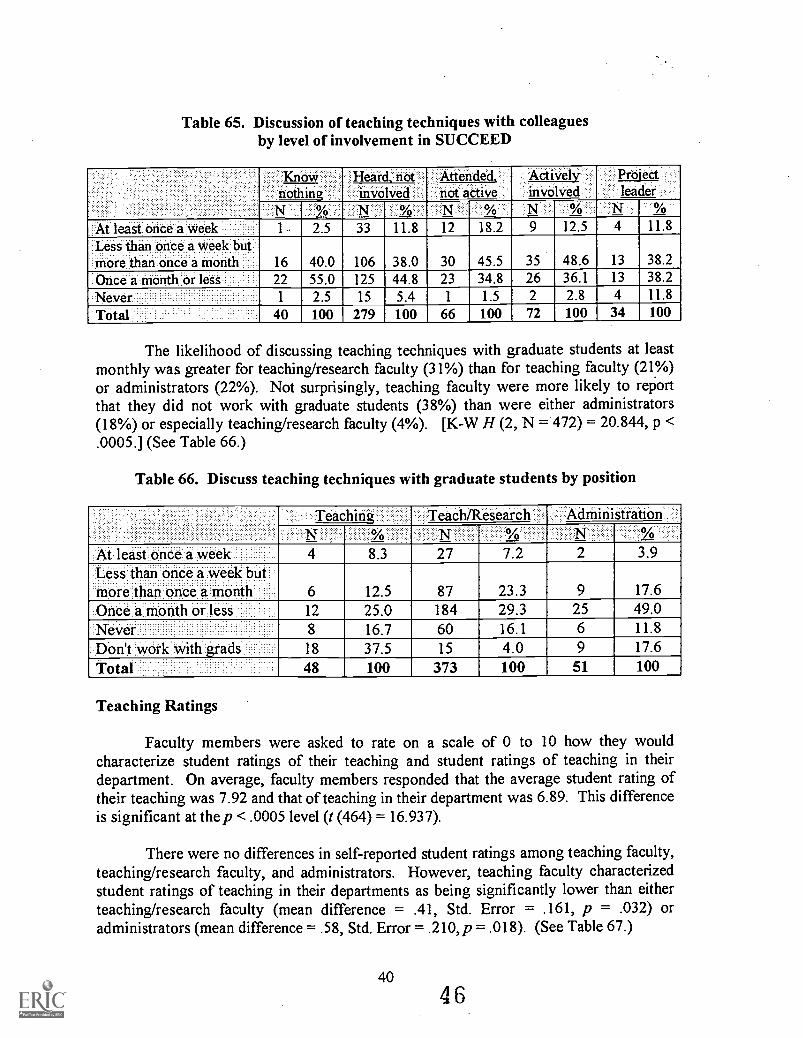
Table 65. Discussion of teaching techniques with colleaguesby level of involvement in SUCCEED
Kriovr:nothing
%..2.5
Heard, not.involved
(v.
-Attendednat. aCtiVe.:.
33 11.8:Less than brice a week'but:
:mote.thaiiOnCe.a MOnth.'H:, 16 40.0 106 38.0Once amonth or less 22 55.0 125 44.8Never 1 2.5 15 5.4Total 40 100 279 100
12 18.2
30 45.523 34.8
1 1.5
66 100
Activelyinvolved
Pro'ectleader
12.5 11.8
35 48.6 13 38.226 36.1 13 38.22 2.8 4 11.872 100 34 100
The likelihood of discussing teaching techniques with graduate students at leastmonthly was greater for teaching/research faculty (31%) than for teaching faculty (21%)or administrators (22%). Not surprisingly, teaching faculty were more likely to reportthat they did not work with graduate students (38%) than were either administrators(18%) or especially teaching/research faculty (4%). [K-W H (2, N = 472) = 20.844, p <.0005.] (See Table 66.)
Table 66. Discuss teaching techniques with graduate students by position
Teaching
At least once a.week.T.L;e§.than..once.a Nyeekbi.it !more than once a month:Onte.arnanth or lesSNever.D.on't :work With grads
Teath/Research
8.3
612
8
18
12.525.016.737.5
Total 48 100
Teaching Ratings
27 7.2
87 23.3184 29.360 16.115 4.0
373 100
Administration
3.9
92569
17.649.011.817.6
51 100
Faculty members were asked to rate on a scale of 0 to 10 how they wouldcharacterize student ratings of their teaching and student ratings of teaching in theirdepartment. On average, faculty members responded that the average student rating oftheir teaching was 7.92 and that of teaching in their department was 6.89. This differenceis significant at the p < .0005 level (t (464) = 16.937).
There were no differences in self-reported student ratings among teaching faculty,teaching/research faculty, and administrators. However, teaching faculty characterizedstudent ratings of teaching in their departments as being significantly lower than eitherteaching/research faculty (mean difference = .41, Std. Error = .161, p = .032) oradministrators (mean difference = .58, Std. Error = .210,p = .018). (See Table 67.)
404 6

Table 67. Student ratings of faculty members' department by position
D N.Teaching 6.50 1.19 46Teachin esearch 6.91* 1.02 356Adiniiiistration 7.08* .88 50* Indicates that the mean is statistically different from the mean of teaching faculty at p .05level using the Bonferroni procedure.
Faculty members at Research institutions characterized student ratings of theteaching in their departments higher than did faculty members at Masters institutions(mean difference = .36, Std. Error = .16, t (450) = 2.233, p = .028; equal variances notassumed). (See Table 68.)
Table 68. Student ratings of faculty members'department by Carnegie classification
Re Search 6.96 .93 387Masters 6.58 1.38 83
Inter-institutional Differences
Appendix B provides the answers to every question by institution. All identifyinginformation about the schools other than their classification as Research or Mastersinstitutions has been obscured to prevent inappropriate use of the data. InstitutionsBETA, THETA, ETA, ZETA, and OMEGA are Research institutions and institutionsPHI, PI, and PSI are Masters institutions. Each institution has been provided with a copyof its own data under separate cover.
This section will highlight several noteworthy inter-institutional responsevariations. The differences were not subjected to tests of statistical significance as thepurpose of this study is to provide information about the coalition as a whole rather thanto compare member institutions. Also, although the sample of respondents represents thecoalition as a whole with respect to faculty rank, department, and sex, the same cannot besaid of the individual campuses. Therefore, comparisons made between institutionsshould be viewed with caution.
Respondent demographic information
Although the sample broadly represents the coalition at large with respect to faculty rank,only the respondents at Institutions BETA, THETA, and PHI were representative of theirown populations in that regard. At Institution ETA (a research institution) only 1.5% ofthe respondents were assistant professors, a percentage far lower than the percentage ofassistant professors on the faculty at this institution. Likewise, at institution ETA no
41
faculty members with fewer than five years of service returned the survey, compared with20% for the coalition as a whole. The three Masters institutions had a larger percentage oftheir faculty members with five or fewer years of service responding (range 26-38%) thanthe research institutions (range 0-25%). Women faculty were more likely to return thesurvey than were men, however, there was again a wide variation among schools rangingfrom a low of 1.6% at ETA to a high of 17.3% at BETA.
The great majority of the respondents from each institution described theirposition as teaching/research faculty ranging from a low of 65.5% at PI to 85.2% atBETA. Both institutions PI (20.7%) and ETA (17.9%) had a large percentage of theirrespondents describe their position as administration (including department head),compared with a low of 4.9% of respondents at Institution BETA.
Prior involvement in teaching beyond classroom instruction
Many of the significant findings in this study are related to the number of teachingseminars that a faculty member has attended in his or her career as well as in the yearpreceding the survey. Among institutions, there is a wide variation in the number ofcareer teaching seminars, workshops and conferences that faculty members haveattended. Overall, 85% of faculty members reported that they had attended at least one ofthese seminars in their career and 30% had attended at least six. Institutions THETA andPHI, however, had over 96% of their faculty reporting that they had attended at least oneseminar compared with institution ZETA where only 76% of faculty had attended anyteaching seminars in their careers. Similarly, 42% of faculty at institution THETAreported attending at least six career teaching seminars compared with less than 30% atmost of the other schools. In the 1996-1997 school year, 77% of the faculty members atTHETA reported attending at least one teaching seminar compared with 41% at PI.Faculty members who reported attending more than three seminars during 1996-1997ranged from a low of 3% at ETA to a high of 17% at PHI. Involvement in SUCCEED,either by attending a SUCCEED sponsored activity, being more actively involved, orbeing a project leader ranged from a low of 19% at BETA to a high of 59% at PHI.
Rated importance of teaching quality and innovation
Respondents were asked to rate on a scale of 0 to 10 with 0 meaning not at allimportant and 10 meaning very important the importance of teaching quality andinnovation to themselves and others. This section will report the ranges of the meanscores with standard deviations in parenthesis. (See Table 69.)
42 4 8
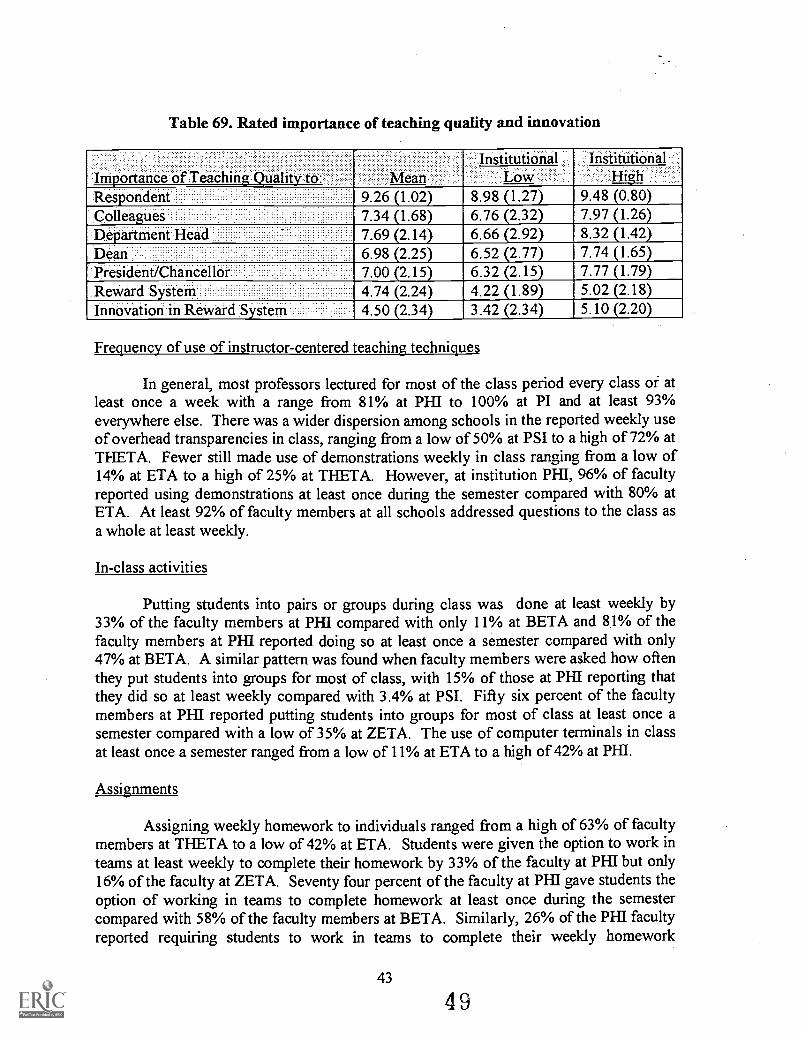
Table 69. Rated importance of teaching quality and innovation
Importance of Teaching Quality to: MeanRes ondent 9.26 1.02Colleagues 7.34 (1.68)Department Head 7.69 (2.14)Dean 6.98 (2.25)President/Chancellor 7.00 (2.15)Reward System 4.74 (2.24)Innovation in Reward System 4.50 (2.34)
'Institutional : InstitutionalLoW High
8.98 1.27 9.48 0.806.76 (2.32)6.66 (2.92)
7.97 (1.26)8.32 (1.42)
6.52 (2.77) 7.74 (1.65)6.32 (2.15) 7.77 (1.79)4.22 (1.89) 5.02 (2.18)3.42 (2.34) 5.10 (2.20)
Frequency of use of instructor-centered teaching techniques
In general, most professors lectured for most of the class period every class of atleast once a week with a range from 81% at PHI to 100% at PI and at least 93%everywhere else. There was a wider dispersion among schools in the reported weekly useof overhead transparencies in class, ranging from a low of 50% at PSI to a high of 72% atTHETA. Fewer still made use of demonstrations weekly in class ranging from a low of14% at ETA to a high of 25% at THETA. However, at institution PHI, 96% of facultyreported using demonstrations at least once during the semester compared with 80% atETA. At least 92% of faculty members at all schools addressed questions to the class asa whole at least weekly.
In-class activities
Putting students into pairs or groups during class was done at least weekly by33% of the faculty members at PRI compared with only 11% at BETA and 81% of thefaculty members at PHE reported doing so at least once a semester compared with only47% at BETA. A similar pattern was found when faculty members were asked how oftenthey put students into groups for most of class, with 15% of those at PHI reporting thatthey did so at least weekly compared with 3.4% at PSI. Fifty six percent of the facultymembers at PRE reported putting students into groups for most of class at least once asemester compared with a low of 35% at ZETA. The use of computer terminals in classat least once a semester ranged from a low of 11% at ETA to a high of 42% at PHI.
Assignments
Assigning weekly homework to individuals ranged from a high of 63% of facultymembers at THETA to a low of 42% at ETA. Students were given the option to work inteams at least weekly to complete their homework by 33% of the faculty at PHI but only16% of the faculty at ZETA. Seventy four percent of the faculty at PHE gave students theoption of working in teams to complete homework at least once during the semestercompared with 58% of the faculty members at BETA. Similarly, 26% of the PHI facultyreported requiring students to work in teams to complete their weekly homework
43
4 9
assignments compared with only 2% at THETA, and 70% of PHI faculty reported thatthey require students to work in teams at some point during the semester compared with35% of BETA's faculty. All of the PHI respondents assign at least one major teamproject in some or all of their courses compared with 62% of BETA's faculty. Nineteenpercent of PI faculty required students to turn in a weekly writing assignment comparedwith none at PHI. Similarly, 96% of PI faculty required a writing assignment at somepoint during the semester compared with only 78% at ZETA.
Communications
Faculty members at OMEGA (37%) were more likely to report using email tocommunicate with their students on a weekly basis than were faculty members at ZETA(16%). Likewise 57% of ZETA faculty reported never using email to communicate withtheir students compared with 18% of PI faculty. Thirty six percent of ZETA facultyreported that they use the World Wide Web weekly to communicate with their studentscompared with 15% of PHI faculty. Similarly, 44% of both PHI and THETA facultyreported that they never use the Web to provide information to their students comparedwith less than 40% at each of the other institutions.
Writing objectives and soliciting feedback from students
Forty four percent of respondents at PI and PI-II reported that they always writeformal instructional objectives for their courses compared with 35% at ZETA. Only 4%of the respondents at PHI reported that they never do so compared with 28% at ETA.Students were given study guides for regular tests at least sometimes by 88% of PHIfaculty but only 64% of PSI faculty. Nearly 44% of ZETA faculty reported that theyalways give students study guides for tests compared with 24% at PSI and THETA.Similarly, 52% of PHI faculty always give students study guides before the final examcompared with only 26% of THETA faculty. Nearly all faculty members reported thatthey solicit feedback from students at least once a semester, no doubt in the form of theperfunctory end-of-course evaluation. However, 56% of the PI faculty report solicitingfeedback more often than once a semester compared with 30% at THETA.
Involvement in teaching improvement programs
Few respondents made extensive use of faculty development resources on theircampuses. The percentage who reported that they never use such resources ranges from33% at PSI to 75% at PH. The vast majority of faculty members who did availthemselves of faculty development services attended workshops or seminars, with morethan 85% doing so at every campus except PI where only 43% of respondents reportedthat they had attended a workshop or seminar. At that campus, 71% reported that theyconsulted or borrowed books, tapes, etc. compared with less than 40% at all of the othercampuses. The percent of faculty members who reported that they discuss teachingtechniques with their colleagues more than once a month varies from 32% at PHI to 73%at THETA. Thirty six percent of faculty members at ZETA reported discussing teachingtechniques with their graduate students more than once a month compared with 7% at
445 0
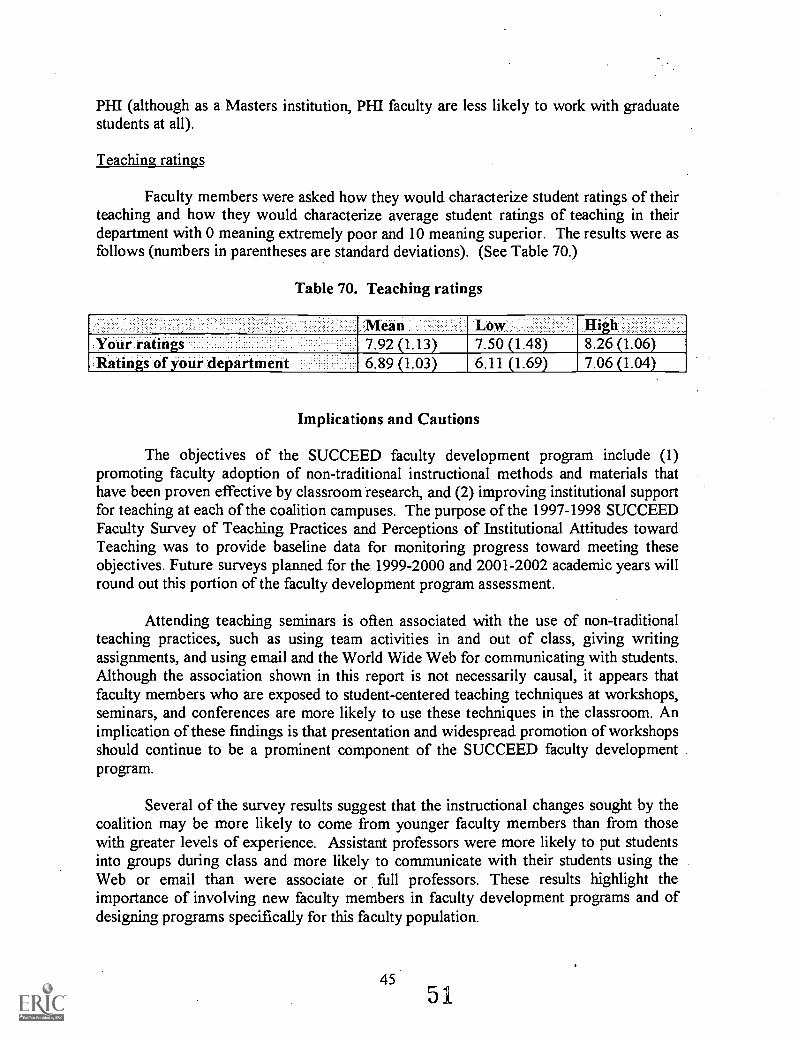
PHI (although as a Masters institution, PI-H faculty are less likely to work with graduatestudents at all).
Teaching ratings
Faculty members were asked how they would characterize student ratings of theirteaching and how they would characterize average student ratings of teaching in theirdepartment with 0 meaning extremely poor and 10 meaning superior. The results were asfollows (numbers in parentheses are standard deviations). (See Table 70.)
Table 70. Teaching ratings
Mean Low High .
Your ratings . .. 7.92 (1.13) 7.50 (1.48) 8.26 (1.06).Ratings of your department 6.89 (1.03) 6.11 (1.69) 7.06 (1.04)
Implications and Cautions
The objectives of the SUCCEED faculty development program include (1)promoting faculty adoption of non-traditional instructional methods and materials thathave been proven effective by classroom research, and (2) improving institutional supportfor teaching at each of the coalition campuses. The purpose of the 1997-1998 SUCCEEDFaculty Survey of Teaching Practices and Perceptions of Institutional Attitudes towardTeaching was to provide baseline data for monitoring progress toward meeting theseobjectives. Future surveys planned for the 1999-2000 and 2001-2002 academic years willround out this portion of the faculty development program assessment.
Attending teaching seminars is often associated with the use of non-traditionalteaching practices, such as using team activities in and out of class, giving writingassignments, and using email and the World Wide Web for communicating with students.Although the association shown in this report is not necessarily causal, it appears thatfaculty members who are exposed to student-centered teaching techniques at workshops,seminars, and conferences are more likely to use these techniques in the classroom. Animplication of these findings is that presentation and widespread promotion of workshopsshould continue to be a prominent component of the SUCCEED faculty developmentprogram.
Several of the survey results suggest that the instructional changes sought by thecoalition may be more likely to come from younger faculty members than from thosewith greater levels of experience. Assistant professors were more likely to put studentsinto groups during class and more likely to communicate with their students using theWeb or email than were associate or fitll professors. These results highlight theimportance of involving new faculty members in faculty development programs and ofdesigning programs specifically for this faculty population.

based research, in all likelihood the responders are not truly representative of the totalfaculty population. Professors who place a high priority on teaching are more likely torespond to a survey on teaching practices than are professors who place a higher priorityon research; and professors who perceive that teaching is devalued on their campus mightbe more likely to respond than professors who are satisfied with the faculty rewardsystem. The responders' self-reported student evaluations are indeed well above theaverage ratings for their departments.
We also must be cautious not to equate the associations found here with causality.Some of the significant differences found between groups may reflect underlyingstructural factors rather than true attitude differences between the groups. For instance,teaching faculty were found to assign fewer team projects than other faculty members,which could reflect a difference in the types of classes these faculty members tend toteach rather than a disinclination to assign team projects.
This survey is the first step in assessing the impact of coalition efforts on _theclimate for teaching at the eight SUCCEED campuses. The true significance of theresults will only be known once similar data are obtained two and four years from now.
Acknowledgment
This work was supported by the National Science Foundation under CooperativeAgreement EID-9109853.

Appendix A
1997-1998 SUCCEED Coalition Faculty Survey
47 5 3

SUCCEED COALITION FACULTY QUESTIONNAIRE - FALL 1997
Please "reply" to this message and in the reply type your responses between the brackets.
What is your University? [ ]
What is your Department? [ ]
Type an X in the brackets corresponding to your response.
1. What is your rank?a) Instructor/Lecturerb) Assistant Professorc) Associate Professord) Professore) Other (specify) [ ]
2. Which of these categories best describes your primary position?a) Teaching facultyb) Teaching/research facultyc) Research facultyd) Administration (including Department Head)e) Other (specify) [ ]
3. How long have you been a faculty member?a) 0-2 yearsb) 2-5 yearsc) 5-10 yearsd) 10-20 yearse) More than 20 years
4. Since you began teaching, about how many seminars, workshops, conferences, etc., have youattended that were specifically related to teaching?
a) noneb) 1-2c) 3-5d) 6-10e) More than 10
5. From September 1996 through August 1997, how many seminars, workshops, conferences,etc., did you attend that were specifically related to teaching?
[ ] a) none[ ] b) 1[ ] c) 2[ ] d) 3-5[ ] e) More than 5
485 4

6. What level of involvement have you had in SUCCEED Coalition programs?[1 a) I don't know anything about the SUCCEED Coalition.[ ] b) I've heard of the Coalition but haven't been involved with it.[1 c) I've attended a Coalition program but have not actively participated.[ ] d) I've been actively involved in a Coalition project.[ 1 e) I've been a Coalition project leader.[ ] 0 Other (specify)-[ ]
* * *
Questions 7-12 refer to "teaching quality." By this we mean teaching that sets high butattainable standards for learning, enables most students being taught to meet or exceed thosestandards, and produces high levels of satisfaction and self-confidence in the students.
In Questions 7-13, rate the importance of teaching quality and innovation on a scale from 0 to10, with 0 meaning "not at all important" and 10 meaning "extremely important."
7. How important is teaching quality to you?[ ] (Choose a rating from 0-10.)
8. How important do you feel teaching quality is to most of your department faculty colleagues?[ ] (Choose a rating from 0-10.)
9. How important do you feel teaching quality is to your department head?[ 1 (Choose a rating from 0-10.)
10. How important do you feel teaching quality is to your dean?[ ] (Choose a rating from 0-10.)
11. How important do you feel teaching quality is to your chancellor/president and provost?[ ] (Choose a rating from 0-10.)
12. How important is teaching quality in your institution's faculty incentive and reward system(recognition, raises, tenure, promotion)?
[ ] (Choose a rating from 0-10.)
13. How important is teaching innovation (testing new methods, writing textbooks orinstructional software) play in your institution's faculty incentive and reward system(recognition, raises, tenure, promotion)?
[ ] (Choose a rating from 0-10.)
If you never teach undergraduate courses other than lab or design courses, please skip toQuestion 26.
* * *
49 55

Think of a typical undergraduate lecture course that you teach (not a lab or design course). Howfrequently do you use the following teaching techniques? Mark your response with an X in thebrackets.
14. Lecture for most of the class period (Select the first response that applies)[ ] a) Every class
[ 1 b) One or more times a week[1 c) One or more times a month[ ] d) One or more times a semester[ ] e) Never
15. Show overhead transparencies[1 a) Every class[ b) One or more times a week[ ] c) One or more times a month[1 d) One or more times a semester[ ] e) Never
16. Use demonstrations (live or multimedia)[ 1 a) Every class[ ] b) One or more times a week[ ] c) One or more times a month[ ] d) One or more times a semester[ 1 e) Never
17. Address questions to the class as a wholea) Every classb) One or more times a weekc) One or more times a monthd) One or more times a semestere) Never
18. Put students into pairs or small groups for brief intervals during class to answer questions orsolve problems
[ ] a) Every class[1 b) One or more times a week[ ] c) One or more times a month[ 1 d) One or more times a semester
[ e) Never
50 5 6

19. Put students into pairs or small groups for most of a class period to answer questions orsolve problems
H
a) Every classb) One or more times a weekc) One or more times a monthd) One or more times a semestere) Never
20. Have students work on computer terminals in class[ 1 a) Every class[ ] b) One or more times a week[ 1 c) One or more times a month[ 1 d) One or more times a semester[ ] e) Never
21. Assign homework to individuals (as opposed to teams)[J a) 1-3 times a week[1 b) 1-3 times a month[ 1 c) 1-3 times a semester[ ] d) Never
22. Give students the option of working in teams (2 or more) to complete homework[ ] a) 1-3 times a week[ 1 b) 1-3 times a month[ ] c) 1-3 times a semester[J d) Never
23. Require students to work in teams (2 or more) to complete homework[ 1 a) 1-3 times a week[ 1 b) 1-3 times a month[ 1 c) 1-3 times a semester[ 1 d) Never
24. Assign at least one major team projecta) In every course I teachb) In some but not all courses I teachc) Never
25. Give a writing assignment (any exercise that requires verbal explanations and not justcalculations)
[
[ 1
[ 1
[ 1
a) 1-3 times a weekb) 1-3 times a monthc) 1-3 times a semesterd) Never
51 57

* * *
26. How often do you use email to communicate with your entire class?H a) At least once a week
b) Less than once a week but more than once a monthc) Once a month or lessd) Never
27. How often do you use the World Wide Web to provide information to students?a) At least once a weekb) Less than once a week but more than once a monthc) Once a month or lessd) Never
28. Do you write formal instructional objectives for your courses (detailed statements of whatyou expect your students to be able to do if they have mastered the course content)?
a) Alwaysb) Usually.c) Sometimesd) Never
29. Do you give students study guides before regular tests?a) Alwaysb) Usuallyc) Sometimesd) Never
30. Do you give students study guides before the final exam?[1 a) Always[1 b) Usually[J c) Sometimes[1 d) Never
31. Is there a university-wide learning/teaching center or a faculty development coordinator onyour campus providing consulting, a resource library, and/or workshop opportunities?
a) Yesb) Noc) I don't know
(If the answer to Question 31 is b or c, skip to Question 34.)
32. How often have you used the faculty development resources on your campus?a) Extensivelyb) Occasionallyc) Onced) Never
52 58

(If the answer to Question 32 is d, skip to Question 34.)
33. Which faculty development services have you used (check all that apply)?[ 1 a) Attended workshops or seminars[J b) Worked individually with a teaching consultant[1 c) Consulted or borrowed books, tapes, etc.[J d) Other (specify) [ ]
34. How often do you discuss teaching techniques with your colleagues?[1[1[ ][1
a) At least once a weekb) Less than once a week but more than once a monthc) Once a month or lessd) Never
35. How often do you discuss teaching techniques with your graduate students?a) At least once a weekb) Less than once a week but more than once a monthc) Once a month or lessd) Nevere) I don't work with graduate students
36. How often do you solicit feedback from your students toward improving your teaching?[ 1 a) Every class[ 1 b) One or more times a week[1 c) One or more times a month[ 1 d) One or more times a semester[ 1 e) Never
37. Are you[
[Ita) femaleb) male
38. How would you characterize student ratings of your teaching? (0=extremely poor,10=superior)
[ ] (Choose a rating from 0-10.)
39. How would you characterize the average student ratings of teaching in your department?(0=extremely poor, 10=superior)
[ ] (Choose a rating from 0-10.)
Do you have any comments about the quality or importance of teaching on your campus?[ 1
Thank you for completing this survey.
53 5 9

Appendix B
Survey Summary by Institution
Notes to the Appendix:
These tables show the answers to each question by institution. The number ofrespondents and the percent of respondents are shown for the coalition as a whole. Onlythe percent of respondents at each institution is shown. The sample sizes range from 64to 99 at the Research institutions and 27 to 34 at the Masters institutions. The number ofpeople answering an individual question may vary.
54 6 0

Que
stio
n 1.
Wha
t is
your
ran
k?
nstr
ucto
r/L
ectu
rer
Ass
ista
nt P
rofe
ssor
Ass
ocia
tePr
ofes
sor:
.
:Oth
erT
otal
ReS
earc
hM
aste
rsB
ET
A .
...T
HE
TA
OM
EG
API
PSV
173.
41.
23.
10
4.1
5.1
6.9
5.9
3.7
9719
.423
.218
.81.
520
.420
.220
.729
.433
.316
132
.135
.425
.030
.930
.643
.424
.123
.525
.921
342
.539
.051
.667
.638
.830
.341
.438
.233
.313
2.6
1.2
1.6
06.
11.
06.
92.
93.
750
110
010
010
010
010
010
010
010
010
0
Que
stio
n 2.
Whi
ch o
f th
ese
cate
gori
es b
est d
escr
ibes
you
r pr
imar
y po
sitio
n?
. Tot
alR
esea
rch
Mas
ters
. TH
ET
A'
ET
AZ
ET
AO
ME
GA
PSI
.PH
IT
each
ing
499.
98.
612
.97.
59.
49.
110
.314
.711
.1
Tea
chin
esea
rch
381
77.0
85.2
74.2
73.1
77.1
79.8
65.5
73.5
74.1
;:Res
earc
91.
81.
20
1.5
6.3
1.0
00
0
Adm
inis
trat
ion
5310
.74.
912
.917
.96.
39.
120
.711
.814
.8
Oth
er3
.60
00
1.0
1.0
3.4
00
.:Tot
al49
510
010
010
010
010
010
010
010
010
0
6162

Que
stio
n 3.
How
long
hav
e yo
u be
en a
fac
ulty
mem
ber?
.:.:T
otal
.Res
earc
h.M
aste
rs...
BE
TA
ST
HE
TA
:.,.:
:ET
A...
-ZE
TA
,.O
ME
GA
.PS
Iea
r41
8.2
7.2
7.8
010
.39.
120
.711
.8-y
ears
.60
12.0
18.1
10.9
07.
211
.117
.226
.55:
10ye
ars
101
20.2
27.7
18.8
14.9
14.4
21.2
27.6
17.6
10-'-
20:y
ears
163
32.6
25.3
35.9
43.3
39.2
31.3
24.1
20.6
Mor
e th
an:
135
27.0
21.7
26.6
41.8
28.9
27.3
10.3
23.5
,TO
tat
500
100
100
100
100
100
100
100
100
3.7
22.2
25.9
25.9
22.2
100
Que
stio
n 4.
Sin
ce y
ou b
egan
teac
hing
, abo
ut h
ow m
any
sem
inar
s, w
orks
hops
, con
fere
nces
, etc
., ha
ve y
ou a
ttend
ed th
at w
ere
spec
ific
ally
rel
ated
to te
achi
ng?
Tot
alR
eser
ch-M
aste
rs.
BE
'rA'T
HE
TA
ET
AZ
ET
AO
ME
GA
PTPS
Is.
NO
ne73
14.7
20.5
3.1
14.9
23.2
10.1
17.2
18.2
3.7
129
26.0
27.7
18.8
23.9
26.3
29.3
37.9
24.2
148
29.8
24.1
35.9
31.3
25.3
36.4
20.7
21.2
640
8116
.316
.921
.914
.913
.715
.217
.212
.1
Mor
e.th
an66
13.3
10.8
20.3
14.9
11.6
9.1
6.9
24.2
..Tot
al49
710
010
010
010
010
010
010
010
0
18.5
40.7
22.2
14.8
100
6364

Que
stio
n 5.
Fro
m S
epte
mbe
r 19
96 th
roug
h A
ugus
t 199
7, h
ow m
any
sem
inar
s, w
orks
hops
, con
fere
nces
, etc
., di
d yo
u at
tend
that
wer
esp
ecif
ical
ly r
elat
ed to
teac
hing
?
,Non
e22
044
.41
151
30.4
281
16.3
357.
1
-MO
re th
an 5
91.
8
:TO
tal
496
100
. BE
TA
ITH
ET
A56
.122
.618
.345
.214
.622
.66.
19.
74.
90
100
100
Res
earc
h
52.2
29.9
14.9
3.0 0 100
ZE
TA
53.1
27.1
10.4
7.3
2.1
100
35.4
35.4
22.2
6.1
1.0
100
58.6
24.1
10.3
3.4
3.4
100
Mas
ters
PSI
38.2
32.4
14.7
11.8
2.9
100
%PH
I
33.3
33.3
18.5
14.8
2.1
100
Que
stio
n 6.
Wha
t lev
el o
f in
volv
emen
t hav
e yo
u ha
d in
SU
CC
EE
D C
oalit
ion
prog
ram
s?
Tot
alR
esea
rch
.M
aste
rsB
ET
AE
TA
%O
ME
GA
.PI
PHI
i:Dor
irt :
know
any
thin
418.
210
.73.
21.
59.
316
.211
.12.
90
iiljo
atd;
:bot
invo
lved
281
56.3
70.2
52.4
58.8
58.8
48.5
55.6
52.9
40.7
Atth
nded
, not
act
ive
6713
.411
.917
.513
.27.
211
.17.
423
.533
.3A
ctiv
el in
vo v
ed72
14.4
4.8
20.6
13.2
15.5
19.2
14.8
8.8
18.5
Proj
ect.l
eade
r34
6.8
2.4
6.3
11.8
7.2
4.0
11.1
11.8
7.4
Oth
er4
0.8
00
1.5
2.1
1.0
00
0
rota
i50
010
010
010
010
010
010
010
010
010
0
6566

Que
stio
ns 7
-12
refe
r to
"te
achi
ng q
ualit
y."
By
this
we
mea
n te
achi
ng th
at s
ets
high
but
atta
inab
le s
tand
ards
for
lear
ning
, ena
bles
mos
tst
uden
ts b
eing
taug
ht to
mee
t or
exce
ed th
ose
stan
dard
s, a
nd p
rodu
ces
high
leve
ls o
f sa
tisfa
ctio
n an
d se
lf-c
onfi
denc
e in
the
stud
ents
.
In Q
uest
ion
13, r
ate
the
impo
rtan
ce o
f te
achi
ng q
ualit
y an
d in
nova
tion
on a
sca
le f
rom
0 to
10,
with
0 m
eani
ng "
not a
t all
impo
rtan
tan
d 10
mea
ning
"ex
trem
ely
impo
rtan
t."
Que
stio
n 7.
How
impo
rtan
t is
teac
hing
qua
lity
to y
ou?
Que
stio
n 8.
How
impo
rtan
t do
you
feel
teac
hing
qua
lity
is to
mos
t of
your
dep
artm
ent f
acul
ty c
olle
ague
s?Q
uest
ion
9. H
ow im
port
ant d
o yo
u fe
el te
achi
ng q
ualit
y is
to y
our
depa
rtm
ent h
ead?
Que
stio
n 10
. How
impo
rtan
t do
you
feel
teac
hing
qua
lity
is to
you
r de
an?
Que
stio
n 11
. How
impo
rtan
t do
you
feel
teac
hing
qua
lity
is to
you
r ch
ance
llor/
pres
iden
t and
pro
vost
?Q
uest
ion
12. H
ow im
port
ant i
s te
achi
ng q
ualit
y in
you
r in
stitu
tion'
s fa
culty
ince
ntiv
e an
d re
war
d sy
stem
(re
cogn
ition
, rai
ses,
tenu
re,
prom
otio
n)?
Que
stio
n 13
. How
impo
rtan
t is
teac
hing
inno
vatio
n (t
estin
g ne
w m
etho
ds, w
ritin
g te
xtbo
oks
or in
stru
ctio
nal s
oftw
are)
pla
y in
you
rin
stitu
tion'
s fa
culty
ince
ntiv
e an
d re
war
d sy
stem
(re
cogn
ition
, rai
ses,
tenu
re, p
rom
otio
n)?
686
7

Tea
Chi
nQ
ualit
y to
You
9.26
1.02
::Ran
ge2-
10
Qua
lity
toC
olle
ague
s7.
341.
68
Ran
ge0-
10
Qua
lity4
0ip
el*:
Hea
d7.
69:S
D'
2.14
Rat
tge
0-10
Qua
lity
to.D
ean
.M...
6.98
. SD
2.26
ualit
Pres
iden
t ....
.
Ran
se0-
107.
00
'iRan
ge
2.15
0-10
Qua
lity
rew
ard
4.74
SI)
2.24
syst
em.
0-10
Inno
vatio
n4.
502.
34sy
stem
'Ran
ge0-
10
69
:Res
earc
hM
aste
rsB
ET
A:
.T
HE
TA
ET
AO
ME
GA
.PS
I8.
989.
299.
329.
329.
379.
219.
219.
481.
271.
010.
910.
891.
000.
941.
090.
802-
105-
107-
106-
103-
107-
106-
108-
106.
837.
977.
257.
257.
736.
767.
477.
041.
681.
261.
571.
681.
592.
321.
671.
611-
105-
103-
103-
103-
100-
105-
104-
107.
498.
327.
197.
787.
946.
66,
7.91
7.69
2.05
1.42
2.61
2.10
2.04
2.92
1.75
1.87
1-10
4-10
0-10
0-10
1-10
0-10
2-10
1-10
6.71
6.44
6.93
6.62
7.61
6.52
7.71
7.74
2.25
2.21
2.45
2.36
1.94
2.77
1.94
1.65
0-10
0-10
0-10
0-10
2-10
0-10
2-10
4-10
7.19
6.32
6.59
7.02
7.77
6.54
7.28
6.37
2.01
0-10
2.15
0-10
2.64
0-10
2.09
0-10
1.79
3-10
2.16
1-10
1.83
3-10
2.13
1-10
4.51
4.82
4.56
5.02
4.99
4.39
4.69
4.22
2.40
2.02
2.51
2.18
2.16
2.44
2.21
1.89
0-10
0-10
0-10
0-10
0-10
0-10
0-9
0-8
4.73
4.28
4.15
4.74
4.67
4.07
5.10
3.42
2.46
2.22
2.28
2.38
2.28
2.42
2.20
2.34
0-10
0-9
0-8
0-10
0-10
0-8
0-10
0-8
70

Que
stio
ns 1
4 to
25
ask
the
resp
onde
nt to
: Thi
nk o
f a
typi
cal u
nder
grad
uate
lect
ure
cour
se th
at y
ou te
ach
(not
a la
b or
des
ign
cour
se).
How
fre
quen
tly d
o yo
u us
e th
e fo
llow
ing
teac
hing
tech
niqu
es?
Que
stio
n 14
. Lec
ture
for
mos
t of
the
clas
s pe
riod
:.:R
eS.e
arch
.':Z
ET
N:'i
'..B
ET
AT
HE
TA
:E
TA
OM
EG
A>
PSI
PHI
.Eve
ry :c
lass
308
65.8
74.0
60.0
68.8
75.3
61.7
55.6
63.3
44.4
Atle
aSt:o
nce/
wee
k13
729
.323
.435
.026
.622
.531
.944
.430
.037
.0A
tilea
st o
nce/
mon
th::
132.
80
5.0
1.6
03.
20
6.7
14.8
At:l
east
ionc
e/se
m--
-5
1.1
1.3
01.
61.
12.
10
00
:Nev
er::
51.
11.
30
1.6
1.1
1.1
00
3.7
468
100
100
100
100
100
100
100
100
100
Que
stio
n 15
. Sho
w o
verh
ead
tran
spar
enci
es
TO
ta.P
.'R
esea
rch
Mas
ters
.
.BE
TA
.,.T
HE
TA
OM
EG
A:..
P.I.
PSI
::EV
eryc
laSs
116
24.7
19.5
30.0
18.5
29.2
33.0
18.5
20.0
.1.e
ast.o
nce/
wee
k15
432
.832
.541
.721
.529
.236
.237
.030
.040
.7A
t :le
ast:o
nce/
mon
th::
9620
.526
.011
.721
.513
.518
.118
.533
.340
.7A
t 16a
St:O
fite
heM
7014
.913
.011
.724
.619
.110
.622
.26.
77.
4:N
ever
337.
09.
15,
013
.89.
02.
13.
710
.00
Tot
146
910
010
010
010
010
010
010
010
010
0
7172

Que
stio
n 16
. Use
dem
onst
ratio
ns (
live
or m
ultim
edia
)
-::M
aqer
sE
TA
ZE
TA
OM
EG
APS
I.PH
I16
3.4
03.
41.
66,
74.
30
7.1
0A
t:lea
st io
nce/
wee
k78
16.8
18.2
22.0
12.5
18.0
13.8
14.8
14.3
22.2
At l
east
onc
e/m
onth
:15
633
.527
.332
.229
.737
.139
.437
.025
.037
.0lS
tdnc
eLse
m15
132
.537
.727
.135
.929
.228
.737
.039
.333
.3:N
ever
6413
.816
.915
.320
.39.
013
.811
.114
.33.
746
510
010
010
010
010
010
010
010
010
0
Que
stio
n 17
. Add
ress
que
stio
ns to
the
clas
s as
a w
hole
Tot
alIt
esea
rch
Mas
ters
.B
ET
A:
.ZE
TA
OM
EG
AE
very
:c1a
ss39
183
.973
.789
.889
.281
.185
.977
.896
.781
.516
a41b
nCe/
Wee
6012
.918
.45.
110
.815
.613
.022
.23.
3io
rice
itoot
ithi::
102.
16.
61.
70
2.2
1.1
00
3.7
:At.l
eaSt
:onc
e/ie
in3
0.6
1.3
1.7
01.
10
00
0N
ever
20.
40
1.7
00
00
03.
7T
otal
466
100
100
100
100
100
100
100
100
100
7374

Que
stio
n 18
. Put
stu
dent
s in
to p
airs
or
smal
lgr
oups
for
bri
ef in
terv
als
duri
ng c
lass
to a
nsw
er q
uest
ions
or
solv
e pr
oble
ms
Res
eftr
ch:
Mas
teis
:TH
ET
A.
TA
ZE
TA
:0M
"LE
GA
:.PS
II,
Eve
ry1c
1as§
:::16
3.4
2.6
1.7
6.2
2.3
2.2
03.
314
.8A
t ile
aa:o
nce/
wee
k64
13.8
7.9
20.7
12.3
15.9
8.6
25.9
13.3
18.5
AC
Ieas
tpnc
e/m
onth
i::10
823
.321
.119
.027
.718
.226
.922
.223
.333
.3i.:
At;l
east
once
/sen
t81
17.5
15.8
24.1
18.5
13.6
19.4
22.2
10.0
14.8
:Nev
er19
542
.052
.634
.535
.450
.043
.029
.650
.018
.5T
ot46
410
010
010
010
010
010
010
010
010
0
7576

Que
stio
n 19
. Put
stu
dent
s in
to p
airs
or
smal
l gro
ups
for
mos
t of
a cl
ass
peri
od to
ans
wer
que
stio
ns o
r so
lve
prob
lem
s
At l
east
onc
e/w
eek.
At l
east
onc
e/m
onth
;:A
tliea
st o
nce/
se:N
ever
Res
earc
h::::
;.
.TH
ET
A:
....E
TA
ZE
TA
61.
30
1.7
02.
21.
1
306.
45.
23.
47.
79.
05.
355
11.8
13.0
8.6
15.4
7.9
9.6
9720
.818
.225
.916
.915
.724
.527
859
.763
.660
.360
.065
.259
.646
610
010
010
010
010
010
0
Mas
ters
3.7
7.4
25.9
14.8
48.1
100
.PS
IPH
I0
3.7
3.4
11.1
13.8
11.1
27.6
29.6
55.2
44.4
100
100
Que
stio
n 20
. Hav
e st
uden
ts w
ork
on c
ompu
ter
term
inal
s in
cla
ss. R
esea
rch.
.-.H
-M
aste
rsB
ET
A.Z
ET
A:O
ME
GA
.PS
I. ..
.PH
I::E
yery
.c a
ss5
1.1
03.
30
1.1
2.1
00
0
At
leas
.ion
ce/w
eeki
r18
3.8
2.6
6.7
1.5
5.6
00
11.5
i:At :
leas
t onc
e/m
onth
:15
3.2
5.2
03.
13.
31.
111
.16.
90
::At:t
east
once
/sem
.52
11.1
6.5
8.3
6.2
13.3
12.8
7.4
13.8
30.8
:Nev
.er
378
80.8
85.7
81.7
89.2
76.7
84.0
70.4
79.3
57.7
tal
468
100
100
100
100
100
100
100
100
100
7778

Que
stio
n 21
. Ass
ign
hom
ewor
k to
indi
vidu
als
(as
oppo
sed
to te
ams)
1-3
times
/wee
ktim
es/m
onth
-3 ti
mes
/sem
este
rN
ever
Tot
al
TR
eSea
rch
Mas
ters
BE
TA
ET
AZ
ET
A.;O
ME
GA
::..
PSI.
255
54.6
55.3
63.3
41.5
56.8
59.6
51.9
53.3
148
31.7
38.2
28.3
40.0
28.4
28.7
29.6
33:3
316.
61.
33.
33.
111
.46.
411
.110
.033
7.1
5.3
5.0
2.1
3.4
5.3
7.4
3.3
467
100
100
100
100
100
100
100
100
PHI
44.4
22.2
14.8
18.5
100
Que
stio
n 22
. Giv
e st
uden
ts th
e op
tion
of w
orki
ng in
team
s (2
or
mor
e) to
com
plet
e ho
mew
ork.
times
/wee
k1-
3 im
es/tn
onth
imes
/sem
este
r
Tot
al
Tot
alR
esea
rch
Mas
ters
.TH
ET
AE
TA
ZE
TA
..OM
EG
-A11
024
.224
.725
.923
.415
.927
.224
.029
.678
18.2
16.4
19.0
15.6
15.9
17.4
20.0
11.1
110
24.2
16.4
19.0
28.1
30.7
26.1
24.0
29.6
156
34.4
42.5
36.2
32.8
37.5
29.3
32.0
29.6
454
100
100
100
100
100
100
100
100
33.3
25.9
14.8
25.9
100
80
79

Que
stio
n 23
. Req
uire
stu
dent
s to
wor
k in
team
s (2
or
mor
e) to
com
plet
e ho
mew
ork
Tot
alR
esea
rch
Mas
ters
BE
TA
.'T
HE
TA
ET
A :
ZE
TA
times
/wee
k45
9.7
7.8
1.7
12.3
10.1
8.6
14.8
7.1
25.9
1-3
imes
/mon
th47
10.1
9.1
15.3
9.2
6.7
12.9
3.7
7.1
14.8
tfin
es/s
eMeS
ter
117
25.2
18.2
18.6
27.7
27.0
30.1
25.9
25.0
29.6
Nev
er25
655
.164
.964
.450
.856
.248
.455
.660
.729
.6.T
otal
465
100
100
100
100
100
100
100
100
100
Que
stio
n 24
. Ass
ign
at le
ast o
ne m
ajor
team
pro
ject
Tot
alR
esea
rch
Mas
ters
..
: TH
ET
AZ
ET
A1
Pa:
eyer
y co
urse
111
23.8
20.8
25.0
21.9
17.8
26.9
36.0
20.0
37.0
:Ip,
soin
e bu
t.not
. all
!:co
urse
s24
251
.941
.651
.751
.646
.758
.152
.066
.763
.011
324
.237
.723
.326
.635
.615
.112
.013
.30
466
100
100
100
100
100
100
100
100
100
8182

Que
stio
n 25
. Giv
e a
wri
ting
assi
gnm
ent (
any
exer
cise
that
req
uire
s ve
rbal
exp
lana
tions
and
not
just
cal
cula
tions
)
times
/wee
k
imes
/sem
este
rN
ever
Tot
al
Tot
al...
Res
earc
hM
aste
rs.
BE
TA
TH
ET
A.-
..ET
A.Z
ET
AO
ME
GA
367.
713
.36.
73.
111
.14.
318
.53.
70
131
28.2
21.3
35.0
18.5
27.8
35.1
29.6
29.6
29.6
225
48.4
50.7
38.3
58.5
38.9
52.1
48.1
51.9
55.6
7315
.714
.720
.020
.022
.28.
53.
714
.814
.846
510
010
010
010
010
010
010
010
010
0
8 3
e y

Que
stio
n 26
. How
oft
en d
o yo
u us
e em
ail t
o co
mm
unic
ate
with
your
ent
ire
clas
s?
Tot
alM
aste
rs.
BE
TA
'E
TA
ZE
TA
:O
ME
GA
PIA
t lea
st:O
nce/
wee
k12
224
.627
.717
.523
.516
.037
.425
.024
.2on
c w
eek,
!onc
e/Jn
onth
110
22.2
20.5
23.8
20.6
18.1
24.2
32.1
33.3
Onc
e/m
orith
orle
ss:
9018
.218
.131
.726
.58.
59.
125
.021
.2:N
ever
173
34.9
33.7
27.0
29.4
57.4
29.3
17.9
21.2
495
100
100
100
100
100
100
100
100
18.5
22.2
48.1
100
Que
stio
n 27
. How
oft
en d
o yo
u us
e th
e W
orld
Wid
e W
eb to
pro
vide
info
rmat
ion
to s
tude
nts?
Tot
alR
esea
rch
Mas
ters
BE
TA
TFI
ET
ky.Z
ET
AO
ME
GA
PIA
t lea
st o
nce/
wee
k13
627
.630
.515
.928
.836
.526
.531
.025
.014
.81:
<:o
ncet
wee
k,?o
nce/
Mci
nt''''
''' "
''''''''
''67
13.6
14.6
14.3
7.6
12.5
13.3
17.2
18.8
Onc
.e/m
orit
105
21.3
20.7
25.4
28.8
15.6
20.4
17.2
21.9
:Nev
er18
537
.534
.144
,434
.835
.439
.834
.534
.4T
otal
493
100
100
100
100
100
100
100
100
85
18.5
22.2
44.4
100
86

Que
stio
n 28
. Do
you
wri
te f
orm
al in
stru
ctib
nal o
bjec
tives
for
you
r co
urse
s (d
etai
led
stat
emen
ts o
f w
hat
you
expe
ct y
ou s
tude
nts
to b
eab
le to
do
if th
ey h
ave
mas
tere
d th
e co
urse
con
tent
)?
Tot
alR
esea
rch
Mas
ters
TH
ET
A'.
OM
EG
A..P
-.PH
IiiA
lwa
194
39.0
41.0
41.9
36.8
34.7
40.4
44.8
32.4
44.4
i:Usu
all
104
20.9
19.3
19.4
17.6
20.0
27.3
27.6
14.7
18.5
Som
etim
es10
320
.722
.917
.717
.623
.216
.213
.829
.433
.3N
ever
9619
.316
.921
.027
.922
.116
.213
.823
.53.
749
710
010
010
010
010
010
010
010
010
0
Que
stio
n 29
. Do
you
give
stu
dent
s st
udy
guid
es b
efor
e re
gula
r te
sts?
Res
earc
hM
aste
rs_E
TA
,O
ME
GA
PIw
ays
170
34.8
40.2
24.6
34.8
43.6
32.3
35.7
24.2
30.8
117
23.9
25.6
18.0
27.3
21.3
20.2
21.4
Usu
ally
Som
etim
eiiN
eyer
ot 1
107
95 489
21.9
18.4
100
17.1
17.1
100
27.9
29.5
100
22.7
15.2
100
20.2
14.9
100
27.3
20.2
100
28.6
14.3
100
33.3
6.1
36.4
100
38.5
19.2
11.5
100
8887

Que
stio
n 30
. Do
you
give
stu
dent
s st
udy
guid
es b
efor
e th
e fi
nal e
xam
?
Tot
al.R
eSea
rch
Mas
ters
BE
TK
'PS
IPH
I:A
lWay
s19
339
.137
325
.844
.845
.735
.442
936
451
9U
sual
ly10
320
.922
.914
525
421
.321
.217
.915
225
.9So
met
imes
8717
618
121
013
417
021
225
.09.
111
1ev
e11
022
.321
.738
.716
416
022
.214
.339
411
.1T
otal
j49
310
010
010
010
010
010
010
010
010
0
Que
stio
n 31
. Is
ther
e a
univ
ersi
ty-w
ide
lear
ning
/teac
hing
cen
ter
or a
fac
ulty
dev
elop
men
t coo
rdin
ator
on
your
cam
pus
prov
idin
gco
nsul
ting,
a r
esou
rce
libra
ry, a
nd/o
r w
orks
hop
oppo
rtun
ities
?
otri
:ktiO
wT
otal
8 9
Res
earc
hM
aste
rs:N
.B
ET
A.
PI.
.PH
I31
663
.389
.242
.958
.271
.176
.841
.447
.111
.129
5.8
1.2
14.3
3.0
02.
03.
45.
944
.415
430
.99.
642
.938
.828
.921
.255
.247
.144
.449
910
010
010
010
010
010
010
010
010
0

Que
stio
n 32
. How
oft
en h
ave
you
used
the
facu
lty d
evel
opm
ent r
esou
rces
on y
our
cam
pus?
Tot
alR
esea
rch
Mas
tërs
.BE
TA
.T
HE
TA
.Z
E'T
AO
Jvff
iGA
Ekt
engi
V;e
li11
3.2
7.7
00
1.4
4.0
05.
60
Occ
asio
nally
127
37.5
28.2
43.8
16.7
42.3
53.3
26.7
50.0
12.5
4814
.215
.49.
419
.09.
917
.313
.311
.112
.5N
eVer
153
45.1
48.7
46.9
64.3
46.5
25.3
60.0
33.3
75.0
Tot
al33
910
010
010
010
010
010
010
010
010
0
Que
stio
n 33
. Whi
ch f
acul
ty d
evel
opm
ent s
ervi
ces
have
you
use
d (c
heck
all
that
app
ly)?
.:.R
esea
:rch
:M
aste
rsO
ME
GA
.,PH
IA
ttend
edw
orks
hops
/sem
inar
s17
188
.687
.288
.994
.485
.094
.442
.992
.310
0.0
:NY
:Ork
iedi
wite
achi
ng::
cons
ulta
nt26
13.5
33.3
00
10.0
11.1
14.3
15.4
0:B
orro
wed
book
s,ita
pes;
:etc
6031
.138
.516
.738
.935
.022
.271
.423
.125
.0t e
r18
9.3
15.4
00
12.5
11.1
00
0
Not
e: r
espo
nden
ts c
ould
giv
e m
ore
than
one
ans
wer
. If
they
ans
wer
ed "
neve
r" to
que
stio
n 32
, the
yw
ere
inst
ruct
ed to
ski
p th
isqu
estio
n. T
here
wer
e a
tota
l of
193
resp
onde
nts
to th
is q
uest
ion.
The
num
ber
ofre
spon
ses
rang
ed f
rom
4-1
3 at
the
Mas
ters
inst
itutio
ns a
nd 1
8-54
at t
he R
esea
rch
inst
itutio
ns.
9291

Que
stio
n 34
. How
oft
en d
o yo
u di
scus
s te
achi
ng te
chni
ques
with
your
col
leag
ues?
Tot
alR
esea
rch
Mas
ters
B T
AE
TA
.s:
PSI
At l
east
onc
e/w
eek
6112
.316
.923
.817
.68.
38.
13.
45.
94.
0on
ce/w
eek,
onc
mon
th'
203
40.8
34.9
49.2
41.2
40.6
42.4
41.4
44.1
28.0
209
42.1
42.2
25.4
33.8
46.9
47.5
48.3
44.1
56.0
Nev
er24
4.8
6.0
1.6
7.4
4.2
2.0
6.9
5.9
12.0
497
100
100
100
100
100
100
100
,10
010
0
Que
stio
n 35
. How
oft
en d
o yo
u di
scus
s te
achi
ng te
chni
ques
with
your
gra
duat
e st
uden
ts?
Mas
ters
ZE
TA
OM
EG
API
PSI
At:l
eaSt
:onc
e/W
eek:
::::
346.
96.
16.
67.
410
.44.
114
.36.
50
once
/wee
k,oh
ce/m
onth
106
21.6
26.8
21.3
20.6
26.0
23.5
7.1
16.1
7.4
nc m
ont
231
47.0
51.2
47.5
58.8
44.8
48.0
35.7
35.8
44.4
7715
.712
.218
.010
.313
.515
.325
.022
.625
.9D
on t
wor
k w
itgr
a st
uden
ts43
8.8
3.7
6.6
2.9
5.2
9.2
17.9
29.0
22.2
t 149
510
010
010
010
010
010
010
010
010
0
94
93

Que
stio
n 36
. How
oft
en d
o yo
u so
licit
feed
back
fro
myo
ur s
tude
nts
tow
ard
impr
ovin
g yo
ur te
achi
ng?
Tot
al-R
esea
rch-
Mas
ters
...:
...T
HE
TA
'At:l
east
onc
etw
eek
:Atie
aSt'.
Onc
e/se
mev
......
.
Tot
al
Que
stio
n 37
. Are
you
?
204.
053
10.7
133
26.8
285
57.3
61.
249
710
0
3.6
3.2
8.4
7.9
28.9
19.0
59.0
69.8
00
100
100
ZE
TA
OM
EG
A0
5.3
3.0
10.7
10.3
15.8
7.1
21.4
26.5
26.3
28.3
25.0
60.3
50.5
60.6
39.3
2.9
2.1
1.0
3.6
100
100
100
100
PHI
5.9
7.4
5.9
14.8
35.3
25.9
52.9
51.9
00
100
100
:Tot
alB
ET
AT
HE
TA
FeM
dle
5010
.217
.36.
3;;M
ale
438
89.8
82.7
93.7
:.TO
tal
488
100
100
100
95
Res
earc
hE
TA
ZE
TA
OM
EG
API
1.6
13.5
9.4
11.1
98.4
86.5
90.6
88.9
100
100
100
100
Mas
ters
P I
.P11
.87.
488
.292
.610
010
0
96

Que
stio
n 38
. How
wou
ld y
ou c
hara
cter
ize
stud
ent r
atin
gs o
f yo
ur te
achi
ng?
(0-e
xtre
mel
ypo
or, 1
0-su
peri
or)
Que
stio
n 39
. How
wou
ld y
ou c
hara
cter
ize
the
aver
age
stud
ent r
atin
gs o
f te
achi
ng in
your
dep
artm
ent?
(0=
extr
emel
y po
or,
10-s
uper
ior)
01.1
1-iM
7.92
:iS1.
13'R
ange
3-10
Rat
ings
of
Otr
nent
:.:M
::.6.
891.
03:R
ange
'1-
10
Res
earc
h'.M
aste
rsT
HE
TA
ZE
TA
z.
OM
EG
APS
IH
I7.
947.
907.
818.
267.
847.
507.
768.
001.
081.
201.
251.
061.
011.
48,1.
120.
944-
103-
105-
105-
104-
105-
105-
105-
107.
066.
876.
866.
927.
026.
116.
866.
741.
040.
870.
920.
950.
871.
691.
161.
164-
105-
95-
94-
95-
91-
95-
104-
9
9798
U.S. Liopartment of EducationOffice of EduCational Research and Improvement (OERI)
National Library of Education (NLE)Educational Resources Information Center (ERIC)
REPRODUCTION RELEASE(Specific Document)
I. DOCUMENT IDENTIFICATION:
A/A---- 6 3.) q
J
Title: 1997-1998 Faculty Survey of Teaching Practices and Perceptions of InstitutionalAttitudes Toward Teaching..
Author(s): Catherine E. Brawner, Richard M. Felder, Rebecca Brent, R.H. Allen and T.K. Miller
Corporate Source:North Carolina State University
Publication Date:March 1999
II. REPRODUCTION RELEASE:
In order to disseminate as widely as possible timely and significant materials of interest to the educational community, documents announced in themonthly abstract journal of the ERIC system, Resources in Education (RIE), are usually made available to users in microfiche, reproduced paper copy,and electronic media, and sold through the ERIC Document Reproduction Service (EDRS). Credit is given to the source of each document, and, ifreproduction release is granted, one of the following notices is affixed to the document.
If permission is granted to reproduce and disseminate the identified document, please CHECK ONE of the following three options and sign at the bottomof the page.
The sample sticker shown below will beaffixed to all Level 1 documents
Ii
PERMISSION TO REPRODUCE ANDDISSEMINATE THIS MATERIAL HAS
BEEN GRANTED BY
\e
TO THE EDUCATIONAL RESOURCESINFORMATION CENTER (ERIC)
Level 1
Check here for Level 1 release, permitting reproductionand dissemination In microfiche or other ERIC archival
media (e.g., electronic) and paper copy.
Signhere,-)please
The sample sticker shown below will beaffixed to all Level 2A documents
PERMISSION TO REPRODUCE ANDDISSEMINATE THIS MATERIAL IN
MICROFICHE, AND IN ELECTRONIC MEDIAFOR ERIC COLLECTION SUBSCRIBERS ONLY,
HAS BEEN GRANTED BY
2A
\O
46'R
TO THE EDUCATIONAL RESOURCESINFORMATION CENTER (ERIC)
Level 2A
7Check here for Level 2A release, permitting reproductionand dissemination in microfiche and in electronic media
for ERIC archival collection subscribers only
The sample sticker shown below will beaffixed to all Level 2B documents
PERMISSION TO REPRODUCE ANDDISSEMINATE THIS MATERIAL IN
MICROFICHE ONLY HAS BEEN GRANTED BY
23
TO THE EDUCATIONAL RESOURCESINFORMATION CENTER (ERIC)
Level 2B
Check here for Level 2B release, permittingreproduction and dissemination in microfiche only
Documents will be processed as indicated provided reproduction quality pennits.If permission to reproduce is granted, but no box is checked, documents will be processed at Level 1.
I hereby grant to the Educational Resources Information Center (ERIC) nonexclusive permission to reproduce and disseminate this documentas indicated above. Reproductkin from the ERIC microfiche or electronic media by persons other than ERIC employees and its systemcontractors requires permission f713171 the copyright holder. Exception is made for non-profit reproduction by libraries and other service agenciesto satisfy information needs of educators in response to discmte inquiries.
slanaltiolliegyPrinted Name/PositionfTitle:
Richard M. Felder Professor
OTAltrtnol ina State Univ Dept of ChemicalEngineering, Raleigh, NC 27695,7905
Telephone:919-515-2327E-M
oSePe aAn VA)4Mress:FAX q I itric-3111,r
/ MP/Date:
(over)

III. DOCUMENT AVAILABILITY INFORMATION (FRbM NON-ERIC SOURCE):
If permission to reproduce is not granted to ERIC, or, if you wish ERIC to cite the availability of the document from another source, pleaseprovide the following information regarding the availability of the document. (ERIC will not announce a document unless it is publiclyavailable, and a dependable source can be specified. Contributors should also be aware that ERIC selection criteria are significantly morestringent for documents that cannot be made available through EDRS.)
Publisher/Distributor:
Address:
Price:
IV. REFERRAL OF ERIC TO COPYRIGHT/REPRODUCTION RIGHTS HOLDER:
If the right to grant this reproduction release is held by someone other than the addressee, please provide the appropriate name andaddress:
Name:
Address:
V. WHERE TO SEND THIS FORM:
Send this form to the following ERIC Clearinghouse:-
ERIC CLEARINGHOUSE ON HIGHER EDUCATION
THE GEORGE WASHINGTON UNIVERSITY
ONE DUPONT CIRCLE, SUITE 630
WASHINGTON, D.C. 20036-1183
However, if solicited by the ERIC Facility, or if making an unsolicited contribution to ERIC, return this form (and the document beingcontributed) to:
ERIC Processing and Reference Facility1100 West Street, rd Floor
Laurel, Maryland 20707-3598
Telephone: 301-497-4080Toll Free: 800-799-3742
FAX: 301-953-0263e-mall: [email protected]
WWW: http://ericfac.piccard.csc.com
EFF-088 (Rev. 9/97)PREVIOUS'VERSIONS OF THIS FOR.M ARE OBSOLETE.