93 5 11 198 - dtic
TRANSCRIPT

AD-A264 210
Final Report March, 1993
OPTICAL AND KINETIC PROCESSES INEXCIMER LASERS
David L. Huestis, M. J. Dyer, W. K. Bischel, D. C. Lorents, and G. BlackMolecular Physics Laboratory
SRI Project No. PYU-7123
Contract No. N00014-84-C-0256
MP 92-279
Prepared for: DTICOffice of Naval Research NJ..';
800 North Quincy StreetArlington, VA 22217 MAY 12 1993U
Attn: Dr. Vern N. Smiley
- . .. 93-10531
93 5 11 198

Final Report- March 1993
OPTICAL AND KINETIC PROCESSES INEXCIMER LASERS
D. L. Huestis, Associate DirectorM. J. Dyer, Physics SpecialistW. K. Bischel, Program ManagerD. C. Lorents, Sr. Staff ScientistG. Black, Sr. Physicist
SRI Project PYU 7123
MP 92-279
Contract No. N00014-84-C-0256
Prepared for:
Office of Naval Research800 North Quincy StreetArlington, VA 22217
Attn: Dr. Vern N. Smiley
Approved:
Donald J. Eckstrom, Laboratory DirectorMolecular Physics Laboratory
David M. GoldenVice PresidentPhysical Sciences Division
SRI Infliefa fl 333 Ravenswood Avenue e Menlo Park, CA 94025-3493 * (415) 326-6200 * FAX: (415) 326-5512 * Telexý 334486

REPORT DOCUMENTATION PAGE # FWm AAVedIOWBN&O07041W8lmm rniig bu..6 I&W eOWW n."a ae Om N eemsed S ewuep. I hew p. ummsrne. awyaam0 Ih o*e % gmofa 6.N. eM m "W sops" o
4 M4m Se e6meede18 s eee0 eIV e U. eIm 01 1Wuee. S . lyeetiomn b M e 4 A m eII$ jaw~emweai af kdwmeeu! euue eagedeeme 6. inmvabu Ie hme. U tmeebbupem NeeNmuueee S•.. Swr.. 6. Opmu emmeern4 uiepm. 1210 1eem
1. AGENCY USE ONLY (uwe bWank) 2. REPORT DATE 3. REPORT TYPE AND DATES COVERED
1 921214 IFinal 840329-8903014. TITLE AND SUBTITLE S. FUNDING NUMBERSOptical and Kinetic Processes in Excimer Lasers Contract No.
N00014-84-C-0256
6. AUTHOR(S)D. L. Huestis, M. J. Dyer, W. K. Bischel, D. C. Lorents,and G. Black
7. PERFORMING ORGANIZATION NAMEIS) AND ADDRESS(ES) S. PERFORMING ORGANIZATIONSRI International REPORT NUMBERMolecular Physics Laboratory MP 92-279
333 Ravenswod Avenue PYU-7123
Menlo Park, California 94025-3493
9. SPONSORING/MONITORING AGENCY NAME(S) AND ADORESSIES) 10. SPONSORING/MONITORINGOffice of Naval Research AGENCY REPORT NUMBER
800 North Quincy Street 290384010389Arlington, VA 22217Attn: Dr. Vern N. Smiley (619) 553-6128
1I. SUPPLEMENTARY NOTES
12a. DISTRIBUTION/AVAILABIUTY STATEMENT 12b. DISTRIBUTION CODEApproved for public release; distribution unlimited Unlimited
13. ABSTRACT (Maximum 200 words)This report summarizes a program of research on optical and kinetic processes ofimportance for excimer laser systems. The research consists of four major topics:(1) investigations of the spectroscopy and chemical kinetics of XeF and XeCl lasersusing theoretical techniques, synchrotron radiation excitation, and laser-inducedfluorescence, (2) measurement of the angle, wavelength, temperature, and densitydependencies of vibrational and rotational Raman gain in H2, D2, and N2, (3) studiesof stimulated Rayleigh-Brillouin scattering in gases, and (4) investigation of othertopics in lasers and nonlinear optics.
14. SUBJECT TERMS 15. NUMBER OF PAGESExcimer Lasers, Laser Kinetics, XeF and XeCl Lasers, NonlinearOptics, Raman and Brillouin Scattering 16. PRICECODE
17. SECURITY CLASSIFICATION II. SECUR.,"Y CLASSIFICATION 19. SECURITY CLASSIFICATION 20. UMITATION OFOF REPORT OF THIS PAGE OF ABSTRACT ABSTRACT
Unclassified Unclassified Unclassified UL
N .75001200-66 ;Stndard Form 298 (Rev. 2-89)ftemmedbW AM Sw 2U5-1129.&102

CONTENTS
SU M M A R Y .............................................................................................
Excimer Laser Spectroscopy And Kinetics .......................................................... 1Stimulated Vibrational And Rotational Raman Scattering ......................................... 2Stimulated Rayleigh-Brillouin Scattering ............................................................ 3Other Topics In Lasers And Nonlinear Optics ...................................................... 4
APPENDICES
A EXCITED STATE KINETICS FOR XeCl
B THE ROLE OF ELECTRONS IN EXCIMER LASERS
C RADIATIVE LIFETIMES OF THE 0- SUBLEVELS OF THE RARE GAS EXCIMERS
D THREE-BODY REACTION OF XeCl* TO FORM Xe2CI
E CURRENT UNDERSTANDING OF THE XeCl LASER
F NUMBER OF QUASIBOUND LEVELS BEHIND A ROTATIONAL BARRIER
G COLLISIONAL PROCESSES IN XeF(X)
H ANGULAR DEPENDENCE OF THE VIBRATIONAL RAMAN LINEWIDTHS FORSTIMULATED RAMAN SCATTERING IN H2
I VIBRATIONAL RAMAN CROSS SECTIONS OF THE FUNDAMENTAL ANDOVERTONE TRANSITIONS IN H2 , D2, and N2
J OPTICAL STARK SHIFT SPECTROSCOPY: MEASUREMENT OF THE v = 1POLARIZABILITY OF H2
K TEMPERATURE AND DENSITY DEPENDENCE OF THE LINEWIDTHS AND LINESHIFTS OF THE ROTATIONAL RAMAN LINES IN N2 AND H2
L TEMPERATURE AND WAVELENGTH DEPENDENCE OF THE ROTATIONALRAMAN GAIN COEFFICIENT IN N2
M MODEL OF THE ROTATIONAL RAMAN GAIN COEFFICIENTS FOR N2 IN THEATMOSPHERE
N CW STIMULATED RAYLEIGH-BRILLOUIN SPECTROSCOPY OF GASES0 HIGH RESOLUTION STIMULATED RAYLEIGH-BRILLOUIN SPECTROSCOPY OF LI
Xe AND SF6 0
P HIGH-POWER 80-ns TRANSFORM-LIMITED Nd: YAG LASER
Q LASER FREQUENCY CONVERSION USING TWO-PHOTON EMISSION IN BARIUMVAPOR .
ili d#-
.j~I

SUMMARY
This report describes the results of a five-year research program to provide the basic
information needed to design and develop high performance lasers systems, operating in the visible
and near ultraviolet, for use in blue-green optical communication systems and in weapon systems.
All such systems require a reliable, scalable, and efficient laser. In several applications, operation
within a specific wavelength range is required, along with narrow spectral output to improve
optical conversion efficiency or to match fixed-frequency narrow-band receivers.
Over the past twenty years, the search for and development of efficient, high energy,
visible and ultraviolet lasers have been extremely productive. This phenomenally rapid progress
was made possible by exploiting the previously established base of molecular concepts and
experimental data. Detailed understanding of the kinetic and optical processes operating within the
laser medium is needed to identify new molecules, pumping mechanisms, or optical conversion
schemes that could lead to high performance lasers and to guide the achievement of the best
possible performance. Sustaining the accelerated pace of development requires a continuously
improving description of the microscopic processes within the laser medium, which in turn
requires continuing research programs to investigate these processes.
During the period covered by this contract, our research program emphasized the
quantitative characterization of optical and kinetic processes important for XeCl and XeF excimer
laser systems. The documents included in this report as Appendices describe our major research
accomplishments. These may be divided into four areas, as briefly outlined below.
EXCIMER LASER SPECTROSCOPY AND KINETICS
Excimer lasers are among the most complicated of gas lasers because many chemical
reactions are involved in production, relaxation, and quenching of the upper and lower laser levels.

Nevertheless, rare gas halide excimer lasers are remarkably efficient. The complicated chemical
pathways are, in fact, very selective.
The kinetics of the XeCl laser are especially worthy of investigation. Even after years of
study, significant inconsistencies and contradictions remain. We have used vacuum ultraviolet
synchrotron radiation from the Spear storage ring at the Stanford Synchrotron Radiation
Laboratory to excite Xe atoms and halogen-containing molecules. The resulting fluorescence was
time resolved and analyzed to derive rate coefficients for production and quenching of XeCl and
Xe2CI. These experiments provided branching ratios for production of XeCl from various Xe*
states reacting with a number of chlorine donors. These studies show that pathways that might
have been expected to dominate, e.g., Xe*(6s) + HCl, in fact have a low probability for producing
XeCl*. These results strongly support the need for developing a consistent understanding of the
role of moderate energy electrons in mixing the excited states of the Xe atom and in exciting the
higher vibrational levels of HCl.
The XeF laser is unusual among the rare gas halide lasers in that the ground state of XeF is
bound. Nonterminating laser action requires that the lower laser level be removed, in this case by
collisional vibrational relaxation and dissociation. We measured the rates of collision-induced
dissociation of XeF(X) by He, Ne, Ar, Kr, Xe, N2, SF 6, and XeF2 , and of vibrational relaxation
by XeF2. In our experiment XeF(Xv-) was produced by KrF or ArF excimer laser
photodissociation of XeF2 and then excited by a doubled dye laser to XeF(Bv,), whose
fluorescence was detected. The time-evolution of the XeF(Xv-) population was monitored by
varying the time delay between the excimer and dye lasers.
Our work on excimer laser spectroscopy and kinetics is described in Appendices A
through G.
STIMULATED VIBRATIONAL AND ROTATIONAL RAMAN SCATTERING
Stimulated Raman scattering (SRS) is a convenient means of frequency shifting of
ultraviolet excimer lasers to permit transmission through the atmosphere. Stimulated Raman
2

scattering is also useful for improving the optical beam quality of excimer lasers by combining
several excimer laser beams at small angles in a Raman conversion cell. Finally, the atmosphere
itself can lead to stimulated Raman scattering, which can limit the power density of lasers beams
propagating through the atmosphere.
Our research program was intended to obtain the detailed quantitative experimental data
required to design practical frequency converters and beam combiners and to quantify the effects of
Raman scattering in the atmosphere. Our work on vibrational Raman scattering in H2 included
measurement and modeling of the angular dependence of the Raman linewidth, measurement and
ab initio calculation of the Raman scattering cross sections of the fundamental and overtone
transitions, and determination of the refractive index or polarizibility of H2 in its first vibrationally
excited level. We investigated rotational Raman scattering in considerable detail. Our nearly
complete determination of the Raman scattering parameters allowed us to develop a comprehensive
model of Raman gain coefficients for N2 in the atmosphere. This work had a substantial influence
on development of strategies for using power lasers in the atmosphere.
Our work on stimulated vibrational and rotational Raman scattering is described in
Appendices H through M.
STIMULATED RAYLEIGH-BRILLOUIN SCATTERING
Stimulated Brillouin scattering (SBS) is used in optical phase-conjugation mirrors to
compensate for refractive distortions in the excimer laser medium. We developed a high-resolution
(10-MHz) coherent Brillouin spectrometer that, for the first time, clearly resolves the Rayleigh and
Brillouin components of the low frequency scattering spectrum of gases. We measured the SBS
gain coefficients, linewidths, and line shifts for Xe and SF6, improved the accuracy of previous
measurements, and illustrated the power of the technique for characterizing potential SBS media.
Our work is described in Appendices N and 0.
3

OTHER TOPICS IN LASERS AND NONLINEAR OPTICS
The SRS and SBS measurements described above require lasers with a combination of
narrow spectral width and relatively high power. To perform such measurements, we developed a
Nd:YAG laser with exceptional performance characteristics: 80-ns pulse duration, 8-MHz
bandwidth, 300-mJ pulse energy and 10-Hz pulse repetition frequency. The laser system has
formed the basis of numerous state-of-the-art experiments in nonlinear optics. It is described in
Appendix P.
The high efficiency of the KrF laser has led to numerous schemes to convert its wavelength
from 248 nm to the visible, which would allow it to propagate through the atmosphere. Such a
conversion of a 248-nm photon to a 400 - 600-nm photon results in a loss of at least 40%-60% of
the photon's energy. We have investigated a new scheme by which a single KrF photon would be
converted into two visible photons, by four-wave mixing with a 10-gm photon from a C02 laser:
248 nm + 10 gim -* 484 nm + 484 nm.
This process, which we called frequency halving, could accomplish the conversion to the visible
with, in principle, no loss of energy. Generation of two waves at the same frequency is known to
occur in a number of parametric processes in solids. Appendix Q describes our first attempt at
frequency halving-in barium vapor.
4

Appendix A
EXCITED STATE KINETICS FOR XeCI
International Conference on Lasers '8426-30 November 1984, San Francisco, CA

REPRINTED FROM PROCEEDINGS OF THE INTERNATIONAL CONFERENCE ON LASERS '84, NOVEMBER 26-30, 1984
EXCITED STATE KINETICS FOR XeCl t
Donald C. LorentsChemical Physics Laboratory
SRI InternationalMenlo Park, California
Although the XeCl laser has operated with e-beam and discharge pumping for nearly 10years now several intriquing mysteries remain in both the ion and excited state kineticbehavior of its medium. In the positive ion chemistry the pathways to the formation ofcenon ions in a neon buffer are complex and ill defined. In mixtures containing HCl thenegative ion formation processes are still confronted with apparently contradictoryexperimental results.
Although the excited state kinetics of XeCl are understood on a qualitative basis,many of the important kinetic rate constants remain uncertain or unmeasured. As we look inmore detail at the various kinetic pathways more questions arise in the overall model ofKeCl formation, radiation, and quenching particularly as it pertains to laser performanceand modeling. Such issues as the collisional mixing and vibrational relaxation of the Band C states remain highly uncertain in spite of their importance to the understanding oflaser performance. Indeed the spectroscopic location of the C state relative to the Bstate remains uncertain by about 200 cm-1. Evidence of 'the poor understanding of the XeCllaser medium is particularly clear for the case where HCI is used as the Cl donor. In e-beam pumped XeCl a vexing question is why the laser turns off before the pump pulse doeswhile the fluorescence continues, indicating that the cause is not depletion of thedonor. The laser behavior at low RC1 concentrations giving high initial peak power andrapid termination is not understood. These problems are frequently assigned to unidenti-fied absorbers formed through some unknown kinetic reaction scheme. These characteristicspose difficult problems which the current models find difficult to reproduce.
At LASERS '80 the first results of our synchrotron studies of the kinetics of XeClwere presented. In the intervening time we have extended, and improved the measurements,the data analysis, and ability to extract rate constants based on an improved understandingof the overall excited state kinetics of XeCl.
We present here results of our extended set of excited state kinetics measurementsusing the tunable uv synchrotron source at SSRL which has ideal temporal and intensitycharacteristics for such studies. These experiments provide a means for obtaining in asimple reliable and readily interpretable manner many of the important kinetic para-meters. Very briefly, uv photons of specified energy are used to excite an atom ormolecule to a desired electronic state in a gas mixture containing the desired reactantsand or quenchers. The formation and decay of a fluorescing excimer is followed in time andintensity as a function of the concentration of individual components of the gas as well asthe total pressure. As far as possible an individual reaction is isolated by arranging thegas mixtures and excitation conditions to make it the dominant process in which case itsreaction rate can be determined uniquely. When that proves impossible it becomes necessaryto model the several processes involved using initial estimated rates and a large set mea-surements taken over a large range of gas mixtures and pressures.
These measurements were done on the 8 degree port of the SSRL facility which delivers0.3 nm pulses at 1.28 MHz tunable from 40 to 300 nm. The gas cell is equiped with entranceand exit windows to transmit the uv radiation and a third window looking perpendicular tothe beam to monitor the fluorescence. Filtered photomultipliers were used to detect thefluorescent photons. MgFl windows used on the gas cell limit the short wavelength trans-mission to 115 nm. Gas mixtures are made up in advance of a measurement using a ballasttank and a well passivated gas mixing apparatus. Gas pressures are measured with cali-brated capacitance manometers.
An absorption scan of a He/Xe mixture at 1027/1 Torr is shown in Figure 1 for thewavelength range of 115-150 nm taken with a resolution of 0.25 nm. The intensity scale is
A-1

2.0 proportional to the absorption cross sec-tion having been normalized to the beam
HeIXe* 1027/1 Tort intensity profile obtained from a scan at
5_Absorption zero pressure. All of the absorption lines5d3/2 observed are identifiable Xe lines colli-
. 73/2 sion broadened by the high density He. It
> -is noteworthy that not only are the allowedS6s1/2 transitions broadened but also some transi-z 1.0 tions normally disallowed in atomic Xenonw
are observed to absorb in the presence of- high density buffer (e.g. 5d1 / 2 and
5d 5 / 2 ). A similar scan for an Ar/Xe mix at05 5dS/2 1021/1 Torr shows that the broadened struc-
ture o f the lines d if fe rs from thoseobserved in He but otherwise is similar.
0.0 These collision induced absorption features1150 1220 1290 1360 1430 1500 have been observed and analyzed in higher
WAVELENGTHIA) resolution by Castex.1
JA-7123-I5
In Figure 2, 0.2 torr of C1 2 has beenadded to an Ar/Xe mix of 1000/1 Torr pro-ducing a very complex absorption spectrum.
Figure I Absorption scan of 1 Torr Xe in In addition to the Xe lines, strong absorp-1027 Torr He. tion features are observed that have been
identified in higher resolution studies2 astransitions to various Rydberg states ofCl 2 . In this measurement the fluorescence
at 308 nm was monitored and the intensity was normalized to the absorption spectrum at theXe( 7s 3 / 2 ) state. It is clear that the major XeCI 308 nm fluorescence is due to excitationof the Xe states and very little comes from the C12 excitation. However it is important tonote that there is some fluorescence signal at 136 nm where the major Cl2 absorption lies.This signal increases as the Xe concentration increases and is clearly due to the reactionof Cl2 with Xe to produce XeCl • The chlorine excitation at 136 mm is rapidly quenched byAr to lower states so that this mechanism of XeCl formation is kinetically fast and thus avery useful means of producing it for rate measurements on other kinetic reactions. InFigure 3 the XeCl 308 signal is plotted together with an absorption scan of Ar/Xe containingno C12 and shows that the Xe excited states give high but not 100% yields for the lower
2.0Ar/Xe/CI2 - 10001110.2 ton" 1.2
- Absorption Ar/Xe/CV2 - 1000/1/0.2 Torr
1.5 * * XeCI (308 nm) - Absorption
T - 0"C C12 0.9 00 XeCt 306 nm
7s3/2 >z 1.0 5d3/2 6s3/2 twJ Z 0.6Z I-
C •
0.5 6 0.3
0. 0.0115 122 129 136 143 150 1150 1220 1290 1360 1430 100
EXCITATION WAVELENGTH (nm) WAVELENGTH IAJJA-1622-105
Figure 2 Absorption/Fluorescence scan of Figure 3 Fluorescence data of Figure 2an Ar/Xe/C1 2 mix, normalized to an absorption scan in Ar/Xe.
A-2

2.4 lying states. The yield for the 6s3/2state which is 53 ± 5% is surpising in view
He/Xe/HC- 100013/1Torr of the I00% yield reported3 for the nearbybut lower lying 6s 3 / 2 metastable
1.8 5d32 Absorption level (J - 2). In Figure 4 an absorp-. .. XeCe 308nm tion/fluorescence scan is shown for a mixt-
> 6s312 ure of He/Xe/HC1 of 1000/3/1 Torr. This
t shows that HCl which is commonly used forS1.2 6s1/2 Lhe Cl donor in XeCI lasers gives good
fluorescence yields only for the 5d and 7s7s3/2 and presumably higher states lying above
about 10 eV. At this energy the reaction
0.6 5d5/2 is about 1.5 eV exothermic which seems to
be a typical requirement for a high yield5d 1/2 harpoon reaction. This reaction is thermo-
0.0 neutral for Xe(6s 3 / 2 ) where the yield is1150 1220 1290 1360 1430 15310 zero.
WAVELENGTH 1A) Flourescence yields obtained by thetechnique described above for several
fluorine and chlorine donors are shown inTable 1. The quanitities in parenthesesindicate where the yields have been
Figure 4 Absorption/Fluorescence scan of normalized. In the cases of ClF and HCI
a He/Ze/HC1 six. the XeCl* yields were normalized to theXe(7s 3 / 2 ) yield in C1 2 . It is interesting
*that CIF reacting with Xe has a strongpreference to form XeCl relative to XeF
indicating that the harpoon reaction is strongly influenced by the higher electron affinityof the Cl atom.
Kinetic information is obtained from measurements of the time history of, thefluorescence signal as a function of total and component gas pressures for each gasmixture. To obtain unique kinetic information on a specific reaction it is necessary to
Table 1
QUANTUM YIELDS FOR Xe + RX + XeX + R
XeF XeCl
Xe P2 NF 3 N2 F 4 CIF CIF HC1 Cl 2
663/2 0.45 0.05 0.21 0.02 0.29 0.0 0.53
6si/2 0.75 0.50 0.58 0.04 0.46 0.05 0.95
5dl/ 2 1.0 0.70 1.0 ? 0.60 0.30 1.00
5d5/2 1.0 1.0 1.0 0.05 0.60 0.7 1.00
5d 3 / 2 0.90 0.90 0.90 0.04 0.50 0.65 0.95
783/2 (1.0) (1.0) (1.0) 0.05 0.60 0.72 (1.0)
A-3

isolate that reaction as much as possible by arranging the gas mixture and pressures such asto make it the dominant process controlling either the fast or slow component of thesignal. It is also important that the rates of the fast and slow components are wellseparated if a realistic exponential fit is to be obtained from a least squares fittingroutine.
In Figure 5 is shown the results of a measurement of the rate of formation of XeClfrom Xe(5d 3 / 2 ) reacting with lCI. This rate is found to be dependent on both the HCI and Xeconcentrations. Evidently the 5d /2 state is collisionally deactivated by Xe to a lowerstate that does not proditce XeCl giving a Xe pressure dependence which appears very clearlyby using two different Xe/RCI ratios. The decay frequencies as a function of HCI pressureshown for 100/1 and 10/1 Xe/HCl ratios are observed to be linearly dependent on pressurewithin the error limits. Thus we can readily assign the slope of these as the sum of theHCI and Xe reaction rates and using the two equations, derive the two rate constants shownon the figure.
To obtain the XeCI* quenching rate due 24to HCl we used a constant mixture of Xe/C12 X * M Xecto which HCl was added. In this case the - . * X-XeCl was formed from the Cl reaction with *XMUM- @
Xe in order to produce the XeCl fast com- 9 10 XeflCI
pared to its radiative and quenched life- 100/1time. The decay rates as a function of HCI •are displayed in Figure 6 for Xe/Cl 2 pres- 12sures of 200/0.3 and 50/0.3 and in each 10/1case a linear dependence on HCl is observed I
with a common slope but differing 5asymtotes. An accurate HCl quenching rate 6constant is easily derived from the slope Vic 7.5 , 010 C"e/Sof the two straight line least squares KX- I K 10-12 ¢HS/5fits. In addition the two asymtotic valuesgive the XeCl decay rate for the respec- 0 2 a 4 stive Xe/Cl 2 mixtures indicating a strong HO- PRESSURE TOWR)dependence of this rate on the Xe concen- JA-7123-31tration.
Similar measurements using a 450 nm Figure 5 Formation rate of XeCl fromfilter were carried out to obtain the life- Xe(5d 3 / 2 ) + HCL and removal rate oftime and quenching of Xe 2 Cl. In this case Ie(5d 3 1 2 ) by Xe.
it was found that the decay rate of Xe 2 Clwas independent of the Xe pressure and onlydependent on the C1 2 and HCI concentrationspermitting a direct measure of the halogen _
quenching. The measurements shown inFigure 7 carried out in Xe/Cl 2 mixtures at Cie* e 0•m)
various Xe pressures from 50 to 2000 torr -XgC306W
gives the Cl 2 quenching rate. The a , * . 0"-MCIO-Aiassymtote gives the radiative decay rate of • X/IC1Xe 2 Cl of 3.8 x 10⁶ a corresponding to alifetime of about 260 ns, a value longerthan any previously reported. The HC1 2quenching rate was derived from a measure- a ACi M N4C1ment of the 450 nm decay in a Xe/Cl2 mix- Cture of212/0.3 Torr to which HCl was added. V K,•j-4CI 7. 3x 10⁻¹⁰ 3/S
Finally the decay and quenching ofXeCl itself is more coaplex because of theinvolvement of the two close lying 4 , 72 6. ILlelectronic B and C stdtes. Since the B and to L4 4. S 7.2 iLO
C states of XeCl are known to lie within HL RE UTHD
- 200 cm-L of each other they are strongly JA-7123-33
coupled by collisions and thus at mostpressures act as a single state with anintermediate lifetime. Our measurements Figure 6 Quenching rate of XeCl by HCI.
A-4

reflect this by the observation that the- X - C-A and B-X transitions at 340 nm and
Cl 2CI2/HCI 308 nm respectively have identical decayXeCl.2Xs-Xe2Cl 212/W3flC1 rates. The radiative lifetimes of each of
• X02CI* h(45&, these states have been recently measuredXse~l* RX tor~• under collision free conditions but the
mixed state lifetime and the equilibriumX@/Cl2 i constant are not yet well established for
this excimer; the reported energy separa-
tions vary from 0 to -200 cm-l. 5 " Because
. " •the mixed state is quenched by both Xe and
2AtXCI) -AZ -/-0.4K I. O C 2 , and the dependence on Xe could be bothX 1-0 CN3/ linear and quadratic corresponding to
.0 1/S quenching and to Xe 2 Cl formation respec-
KC12 i- S-19 I'IOe 3 tively, it was necessary to obtain a large.1 1 1 1 2 1 4data set with a large range of pressures
1ALOGE0 PRSSUME (TOM) and mixture ratios. The decay rate, R, was
JA-7123-34 assumed to obey a four parameter function Rgiven as equation (1).
Figure 7 Radiative and quenching race of R - KI + K2 CI 2 + K3 Xe + K4 Xe 2 (1)
"I 2 CL by HCI and C1 2 .
Some 47 sets of data were fit to R with amulti-parameter least squares fitting rou-
tine to determine the Ki's. This fit for the Xe/Cl 2 case indicated that the linear Xe termis small but that the three-body quenching is predominant even at low pressures. This isillustrated in Figure 8 where the XeCl decay frequency measurements corrected for the C12quenching rates are plotted versus the square of the Xe pressure. The plot clearly exhibitsa linear dependence that indicates that the two-body Xe quenching is very small even at lowpressures. Additional date not shown, extending a factor of 6 high in (pressure)2 fits thesame function. Nevertheless the least squares fitting does give a small positive value forthe linear Xe term with a large (factor of 2) uncertainty. The value we quote is the upperlimit that the statistical analysis on our data allows.
Finally an additional large set of data for mixtures of Ar/Xe/Cl 2 was combined with theXe/Cl 2 data set and a least squares fitting of the total set was performed to an R functionwith an additional term in Ar Xe. The resulting fit gave essentially the same parametervalues as found for the Xe data with the addition of the term for Ar Xe. The fit for thistotal data set of 87 points is excellent and clearly indicates that the overall modeldescribes the decay processes of XeCl verywell. This model that prescribes slow 24
2-body and fast 3-body removal of XeCI by C12 *. X.- XC*Xe differs from the recent measurements of XnI*-C0Othe Kansas group 4 who determined a 2-bodyarate a factor of ten larger than our mea- W C12- l°
surements indicate. However a recent set '2 C
of measurements carried out by a European o
group7 using synchrotron radiation in an .
experiment very similar to ours has pro-
duced Xe and C1 2 removal rates nearly
identical to those reported here. i
3.- -C12" 5.60 m 10OConAn additional important parameter that NX - 1. 10-MU•O/S
results from these measurements is the A015C1) 5.4 1mixed state radiative rate of XeCl*. Thisquantity is given by the pressure indepen- &0.
dent term in the least squares fitting and DMENON PRESSLWE 2 CTOIR2xI0-4)
is interpreted as the mixed state life-time. This lifetime obtained from thefitting of the total data set described Figure 8 Three body removal rate of ZeCIe
above taken together with the individual B by Xe. Note that the C1 2 quenching rate
and C state lifetimes 4 can be used to has been *ubstracted from the total decay
determine energy separation of the two rate.
A-5

electronic states. The mixed state radiative rate A. is given in terms of the B and C stare
rates and the equilibrium constant Ke in equation (2)
Am . (ABKe + AC)/(Ke + 1) (2)
Using the recently measured rates for AB and AC and our value for Am of 5.0 x 10⁷/s we find
that Ke ~ 1 indicating an energy separation near zero. This finding is consistent with
the recent work of the European group7 but differs from other observations.
The rate constants and lifetimes derived from the present analysis of our synchrotron
data are presented in the Table II. In these table KSU refers to Kansas State University,
SAC refers to reference,7 and RICE to reference 8.
Table II
RATE CONSTANTS FOR XeCl KINETICS
FORMATION
REACTION RATE CONSTANT REF
Xe(3P 2 ) + C1 2 XeCl 7.2 x 10 CM3/ KSU
X(I) + C12 XeC 7.9 ± 0.9 x I0 Co- 3 S SRI+ C1 2 XeCI 7.6 ± 0.7 x 10 •CH/S SRI
Xe('p 1 ) + Cl2 *XeCl *•
Xe(5d3/2) + Hld o XeCl 7.5 ± 0.7 x 10- 1 0 CM3iS SRI
Cl 2 4- Xe * XeCi 1.1 0.1 x 10⁻¹⁰ CM 3 /S SRI
RADIATION AND QUENCHING
XeCl* (B) * hv(308) 9.0 ± 0.2 x 10⁷/S KSU
XeCI*(C) * hv(340) 7.6 7 0.6 x 10⁶/S KSU
XeCl (M) + hv 5.0 ± O.6x107 /S SRI,SAC
XeCl* + C1 2 * QUENCH 5.6 + 0.25 x 10- 1 0 CM 3 /S SKI
5.8 x 10⁻¹⁰ CM 3 /S SAC
XeCl* + HCi * QUENCH 7.3 + 0.1 x o_1-OCM 3 /S SRI
XeCl* + Xe * QUENCH < 4 I0- 12 CM3/S SRI,SAC
2.3 x 1O- 1 CM3 /S KSU
XeCI + 2Xe * Xe 2 CI 1.53 + 0.1 x 10 CM6 /S SRI
1.3 x 10⁻³⁰ CM 6 /S SAC
XeCl* + Xe + Ar 4 Xe 2 Cl* 1.01 ± 0.05 x 10 3 0 CM6 /S SRI
Xe QUENCHING
Xe(5d3/2) + Xe * Xe + Xe 8.1 ± 0.8 x 10- 1 2 CH3/S SRI
Xe( 3 P2 ) + HCI PRODUCTS 5.6 x 10o- 1OCM 3 /S KSU
Xe( PI) +sCl 4 PRODUCTS (7 t Io- CM/s- SRIPRODUCTS 8.2 ± 0.8 x 10 1 0 CM3 /S SKI
Xe 2 * + HCI - POUTXe2 + C1 2 * PRODUCTS 5.0 ± 0.6 x 10- 1 0 CM3 /S SRI
Xe 2 Cl* RADIATION & QUENCHING
Xe 2 Cl* + hv(470nm) 3.8 + 0.4 x i0 6 /S SRI7.4 x 106/S RICE
Xe 2 Cl* + Cl 2 PRODUCTS 5.2 ± 0.2 x 10- 1 0 CH3 /S SRI
Xe2Cl * + HCl PRODUCTS 6.1 ± 0.2 x 10- 10 CM3 /S SRI
Xe2 CI + Xe * PRODUCTS < 4 x 10- 1 4 CM3 /S SRI
A-6

Acknowledgments
This research was supported by the Defense Advanced Research Projects Agency throughthe Office of Naval Research. The experimental measurements and data analysis describedhere were carried out with the able assistance of R. L. Sharpless and D. L. Huestis of SRIInternational, K. Tang of Western Research, and M. Durrett, L. Houston, and G. K. Walters ofRice University.
References
1. M. C. Castex, J. Chem. Phys. 66, 3854, (1977).2. T. Moeller, B. Jordan, P. Gurtler, G. Zimmerer, D. Haaks, J. LeCalve, M. Castex;
Chemical Physics, 76, 295, (1983).3. J. H. Kolts, J. E. Velzaco and D. W. Setser, J. Chem. Phys. 71, 1247 (1979).4. Gen Inoue, J. K. Ku, D. W. Setser J. Chem. Phys. 80, 6006, (1984).5. R. E. Drullinger and R. N. Zare, J. Chem. Phys. 51, 5532, (1981).6. A. Sur and J. Tellinghuisen J. Mol. Spectros. 88, 323, (1981).7. J. LeCalve, M. C. Castex, B. Jordan, G. Zimmerer, T. Moller, and D. Haaks, private
communication.8. G Marowsky, G. P. Glass, M. Smayling, F. K. Tittel, and W. L. Wilson, J. Chem. Phys.
75, 1153 (1981).
A-7

Appendix B
THE ROLE OF ELECTRONS IN EXCIMER LASERS
International Conference on Lasers '8526 December 1985, Las Vegas, NV

-jwCl)0
w
L Ww 0 z6-40 N
X .a)4 CO 0 0 q
04 0040 U.5nx (D a wu
cl) C. c 1- P- -4 C.3 _~jz r4F L X -1 u LLzwO .. J 0 0L I-1- P
C.>% 4.) 0 M CL j 0L)1-- *0 C cCO. 0 Cn L Z.-w >0 - -4PcW 0 0~ C c ux a J
W .C u LL wL
z zZ z0 x
U "zI--w
B-1

4-) 4.)
E0
L 0 3z 4) LO0
ml0 L
0a 0cL 0
o00 4C0)L
CD aa 0'-4au CY- 0 L
C.. +1 + C + 0 01 CL
Z *M 4C\I + + aCO zz L L m
I.-- +b +b 0 cO0i + lb lb "-1 0
W C NC\ 4.-)-1 3 Z 0 L + Ou-
W Ci C < L 0 .0 0'-
w + +' + >a
z ai V4 QLU) 0 m E m
U) 00
< L 0-~ 4-) *-
zC 0 cU) 4-) E0
<(-00 LW
01 C -40zC 0 CD
4.) L- -4m 44) 01
z 01 4- a 0-0 0 CD
B-2 0

L)LI- 0
0 Lu 0) 04 CD 01ow~ LL
m0 L01 0.q
w 0 C 4340) 3: 0
in) co + Xw x 0J
01 C\J LL*aa.. c c + LL C1 0 .04 + + + L 4)2: *NClý
CMCt z 101 + I a14)0 CO co L LL + Lit4 0 a C
>- o + M 01m L 01 CMI L
L C) a x L LL + 0..
w E 01 + 1 0I.- J3f + + + LL 4)
z 41 0* 01 + 001 X +
O 44 E L
W X4) 4)01" C)-r
: 4-) a1
Ul) c 01 01Wr - 0Uf) co00
L E0101 c 0
wEZ4 C).01
X. Xo a
C CP
B-3

NF3 +
NF3 -11PUMP NF3 NF3 PUMP
Ne+ 2Ne Ne2+ e Neo
NeF° NF3 Ne2 Xe107 nm 85 nm
Xe
F" Xe :[ Xe+/NeXe+ PUMP97 nm
158 nm Xe351J460 nm .- j Xe2+
NF3 NF3 elPMP
Xe2* Xe + Ne Xe"173 nm I
Figure 2.THIS ILLUSTRATION DEPICTS THE MAJOR ENERGY FLOW PATHWAYS INE-BEAM PUMPED NelXelNF3 MIXTURES. ENERGY INPUT FROM THEELECTRONS COMES IN ALONG THE PUMP ARROWS. THE SPECIE IN EACHBOX. PLUS THE COMPONENT ALONG THE REACTION ARROW. YIELDS THERESULT IN THE NEXT BOX. THE WAVELENGTHS OF THE EMITTING SPECIESARE INDICATED. THEY MAY BE SUBJECT TO QUENCHING BY NF3 OR Xe (NOTSHOWN). NeF" IS PRESUMED TO PREDISSOCIATE.
B-4

-o ow
%0 L
+ 0
e.0 A I>
L 01 CD U-lO) -e()C/) 0D 0 2 9W co 13 L w IOdO) cDco ifin 0 c a V 1 -4
< 0 0 3
0 C" 0 %Wecr L 0 1 .-4 M MCO WD-4< 0L 4)+ I* ICM \JCYiCYl:LW0 0 0)1
-c * c %M# m
00 aL. Su + 1 0) NC t- vO)0 0) 0% + I cor- N *%t%.co
0 L + cc 1 u I I.e 5P 0) w I 00000 d
0 L r-4 I00: +I
0 OX II 0) L 41 1
O 13L Ix 0 01< So 1 0 1 -4 t,,0 ODfLO
0)0)m + c U I MCY NC\--L0 1
S - 0 1.C 0 >0 OPI
W 0. >1 d)C Td0- 0 0 1 uiocc
0 -0 %of I ~)~Ci~c -P A I
" L 0 5 I
0I4-)C a 0) 1 WS0L LWinl.44xImz<cX
B-5

0 L6
4-) 0 H0ai L
P-4 a 0 >
w. 13 W .0MV0- -a c .c ou. 4) a 0 4i6- 0 4) "me.6 *LL. 0 aIC E.LL 0 cC1 "q HW 1 -P4 L4 r- 0
E X 4~- 0 +cii 0rC - a
W 4) J0U) C *'L
aL 0i a 0< <0 c (3 U)t- 4-) a 0 ii
**-N 0 C4--4 )S14)z P 0 0 CiI -4(3 4-) C%40 0 C
W E C. X VPu. NOD 11 ~ Cz4))CW I CC L 0u c C) ao ""ICU) C ") 4)w a - ar a
C.) 0 -l t00 P(4.. L
ai .'4- 0Ici 4-).4L CI0 0x
La. 0 aeC\Of a 0 -
- 04) aL rL Ccp (9 C0 0 at 0
a 00 a- ~ c 01 C0
L X0 i
0C L-L a
LL a 0 r
B1-6

Iz
ILccuil
LL.0w
oxc
U U)
00
A 5 -u
wLWx I-.i
U)C0 I.w0 -o
M% ADN3I3IJA3 HI3SV-1 OISNWIILNI
B-7

a4-
-o
L
Ul) - L LW 0 4)
- Cl) a CD 4JW 0 0. E -9.0.. L .4 01 0..Cfl 4-) 4-) C
0) D C) (Dj a P< -4 -4 a0C
u. a1 a1 zC-4) 0o
X LL cW L M0 0
m a - + +u. E m -o
.r4 a 01a I 01< L V- 4P 01 LL CDa.L 0 a a
c) a 0CL + .0<C.% ) ".4 +
M0 C) C~ CCn >... P4 + CM LL. r--z mo -4 4-) 0o 010 a1 13 L + m
cr 4) P. aI- a C.. C. + a E
01 aW L. L CD 01 (D
-1 C ccW CD 0 0
WD c L "4L. 0 4-) 4)0 L. CCD 4) 01-L. C -4C
a 01 o0 0x) - C3
01 0ocl) L 01 4-)
C.. CDLC. - 0
U) a 2.r4 14P C L01 0 -4 01c C) 0 1o.P 01 0 c
x UC) C.)3
*Cj M
B-8

-jw
00
xr 0m- 00) 3 -ui 4) co 4
W L C3 -P0 co Ou-
Sa- 01 01 L L r-w L 4- CLCa)
Zj * 0 0 1.uC 0)w ap co
WL I I. I.01X4 C 0 4C) XC0 0
Wo cu 01 W01V41 Ea - - p x
0 0 ~ L RtO IW
4-) (a- 0 1I 1W 0 0.L NCT) m)
L 01
LL 0 -oCl (- C 0 +
La. CP r40 0 01 0.. 4-) 01
.4 4-) 01 0 01cJ) 4) 01 'a C) +z 0 r-4.40 C) 0. 9 130
s-i 0 s- C Lc Lu) Ix
0 4-) 01z C) L
L ~
B-9

C4.(4-0
4.)
E
0 LCP 0
a Xa02E CL
w C.-o >a 4-)z C U0 4.0w -P C a
001 0 c N
-L XW
co. P 4) +
CM L 0..
rr r-..
0) 0X
La L +*CL LL 01
01 X
00+
E a'
LL C 4
0B-1

1023,.
Excitation
1 o22J
ý3 Fluorescence
E C
E 0z
1021 \
0
Jeb Plocal --
Model Exp't (A/cm2 ) (W/cm3 )0 5 2.8x 10⁴
-- 18 8.4 x 10 4
0 400 800 1200 1600 2000t . ns
JA-330522-82
Figure 3
B-1I

8I-
z(a
Lu
Lu
02
U.
0.4
0 0
1.6
1.2Z E
- b.
ETM In10s)
tz - 0.80 c
JA-6-211
0.4 -1
00 00 0 W 600 o 1000
TIME(ns)JA-1 522-41 A
FIGURE 8 (a) FLUORESCENCE AT 172 nm AND (b) ABSORPTIONAT 304 nm OF XENON AT 380 torr (solid lines) ANDWITH ADDED NITROGEN AT 100 torr dashed lines)UNDER ELECTRON-BEAM EXCITATION (100-400 n$)
B-12

4-)
01
(4-'4-
0 0o a)
4-) 4-)a a 4-)L 4-) .
CDCD
000o 4J
C) 0LD 41 x L
Z 01 4-)0- c N% 01cX U) c 01 4-)u a 0 r- aZ 2 L 01 Lw 4)
CD C) 13 coP a1 0 0- 4-)
z c 0 a 4-).6.4 C4)
L) m) 0 C -w CP -0 x-j1 4.) C) 0w or c
01 0C C01 E c
4) L CD L
a 4) aLL 010. x L L 4
L) C
.6. 4J
a 0
0B-1

KrF* + e PRODUCTS
25
%zo
S ~ rd•2g•1. ,Ik
-Ii 190 TORR KRYPTON7.6 AMPS/cm210,J
to I I,
0 i 2 3
n. XI10"14 (cm"3 )
II I4 2 I 0.5
F2 DENSITY (TORR)
FIG. 2. Modified Stern-Vollmer plot of l/sipgl (corrected for F2 quench.ing) vs electron density (or l/F 2 density).
676 Appl. Phys. LetL, Vol. 37, No. 8, 15 October 1980
B-14

L C0 0E"-
4.)4J 01 .
4-)C .C
0 0 0.r4 L a1
4.) 01 4P)
.r4 4P) 04- a I*
Z r-44- 0o a1a0.. I 4
O E 01 -oz a1 0 01 C.
<L 0o 01 4.-L .C 01
Cf) -P 01 .5.1C Aw 0 > x >
W . 0 c 00%1
z 01 01 > 0 uM 13 C C 0 01
0 4.P L
0 C ) 4.o40) c 0C
w 4.) Co 0 CO0 01 r- ca0M4
U) E9 2 4-0.. -4 (4- a0) 0 0OX .0 Ow-
co 4) 01. a 01
Ul) L C 4-) 01 4-a )4.) 0 01 -4 L 010 EWc E~ 01a01
> 01o0 (4- C>0D 4J 0 L "e 0-
r-. a E 01- P4.)co a) 0 0) 4- 01ma L a- o a0 0 1aE r-O4 E 45.) 00a1
01 4.) 01 L4-01 13 40)> 0 C
r-4 0.5. 0~ .C 0101CL. E 2-@ co C 0) E ME 3 L 01
a1C a. 01 c L M0 C r V-a- L r4
4J Cg. 01 Go0a101 4- 39-m > ao0
C 0*94 010 09 a1.z<- 1 LLE U) M: 0
B-15

2.0
---fO-- Experiment
1.6 Model .Q
z1.2
0.4-
0
0 400 800 1200tIME (ns)
JA-330522-38
Figure 10
B-16

1.0XENON - 300 psi0
o EXPERIMENT
0.8 THEORY.- .- I .6 1 x O10 cm51s
ioO6 • 8 xIO "
0. .o ° . 006510
q 00.4
0.
0.2- -. -- .--
D• • --. . . . ..
"" ° - -- - ,, "- a4
00 0 0 0 000
0 5 IO 15 20 25 30 35 40
"(a TIME 0ns)(a)
o! - I -o-T-XENON
-300 PSi-It a 8 X 10⁷ I cm53/s
E 0 40 n0
aw--TM loons
zw
- 0 1
0 5 10 15 20 25 3 5 4
FIG. 2. (a) Comparison of experimental (open circles) and
theoretical (dashed and solid lines) absorption in xenon for a
thebretrichargdshvoltage of 30 kV (0. 1 cm from the foil).Febetron charging vtaeusponds' to a different value of the
Each theoretical curve corresp.ndS to a trvale ofe
rate constant k for Eq. (2). The solid line is for a triplet life-
time of 40 nsec, whereas dashed lines are for a correspond-
ing lifetime of 100 nsec. (b) Predicted temporal evolution of the
electron density for two triplet lifetimes (k = 8 K10-1 cm3! sec).
B-17

0
w0D
0 a.44
z- 0 4
-0 10
w c L 4)4) 0
o0 0w C co
Ix 0 a 0L 0- LC0 CD
-. a- c 0
0 0 0)-J-
X 0 Lo0 ai c a
IL M. L0 ~ 0Ico 4
Li. > 0o 00Z0 L 4Lw a CL 0
0 09 0
0 C)
B-18

4Ja'4J 4a
C4 UCl) 04JCa cn4J 4-)La>
a' w4) 4)
xl F4Co 13xl L8-' LL co
a- E C Cl
I-- cu a cCl) L a) cn)'a (4 'i- z w
L) O 0L 0 a' 3Z V-4 al '
W C' 0 C4..>
IrE u-P.C Z.L (4- 4J 0 a I-
00U 0 .04 u I-- ClLL rq-30OC W4) (4. -1 I--
L 0 0:aa<.4 -4 4.) QC V4Cl)
U. X CD4.)0 C.. 0r4 -fI a' rq >- U- C)
L) 0- L 0) 4-)W a' c . 0
mW0 0* 0P x'o *P0 a tC4- C -e 0) m
r4 0 i
E0 M 0000- u-W l
a a a-a' E **LL
0 0) W D
010 L c
M 4) 400r4C
B-19

3.2
A Calcium 41S -, 41p Ref. 512.8 0 Strontium 5 1S -. 51P Ref. 52
0 Barium 6 1 S -, 6 1 P Ref. 53
2.4 * Hydrogen 12 S1/ 2 -• 22P1/ 2 Ref. 54N * Lithium 22S1/ 2 -, 22 P1 / 2 Ref. 55
2.0 A Sodium 32 $1 /2 -S 32 P,1 2 Ref. 56(N
1.6
S1.2 Ofi.A • "r • -
0u 00.8
3.6 x 10- 13 (1 - j/ l1/2 / (e + 15)0.4 - 3.13 x 10⁻¹³ (1 -1/e) / (e + 15)
0 -1 1 10 2 4 6 8 10 12 14 16
E= E/ETJA-330522-22A
Figure 11
B-20

00
+
aa$
+ ap
1 +
II I
IB 2

_____U,)
dL.C0-M00
x~0
L4J L
-L 0
a'>% 40
L 41ao cf)w C4.
0 0,
L 4.)
' Co
W 0o
d Ncs -V
EL0zx
In 0
dJ 6
( bJ'~O)80404S 40 kATSUBO 016 0 -1
B-22

4--C.) 4D00q PCu
- 040 LJC c
".r4 D a .6-I CCD 4-) E 4-)01 *F4 01 *64I
L 4.) >L CD CDL *e.. 01 c -4
a.- CL C)x m >L co~ 01 C
00 C 0 4) m)r6 4 0m 0m 0
CO t-C 0 .)M o0 ) t C1)o -P 0.a1- QWE 0'0 a 4 r-Cl) E r- ' CC.
r4 CJ X (0011 L 4~-.) 01 4-)O
0. M ~ .CLZ C) ."4 C U.0 L m0)0 *64r-- 0 0 r.4 C
C.. 4) *'' e- L 4- C.o 01 Cm 4) 00M3:C
.r40c D(4- -1 C ..4-)0 .0 01 0 -0 -r4 - > r~. 04P)c L C9 4) C)'-
00 04J)-4)4)P *.4 CD 0r 00CcO 0 0 0 01r-0 N 4)01
4J-4 c 0 13 cm(DC C r. C 4)00.r4 0 091> 0 CD ECD r4 E.M EC N -o N 4- c0 4- 44)>41C 4) 0 -040 0 r0-4% r-
0OE 0 E m>.. c m 0101
-4 0 a 0 -1 L01*'-e- 1C c .001o44 4) 0100 01c 0 4)010.. r.4 r44 -P P L C
W- E 4.- -4Z C4 CCL 3r4 3 cn r.00
E CD 13 C -4 m 01000 0ODGIu 0 C Cu 4. N xI- c
B-23

Appendix C
RADIATIVE LIFETIMES OF THE 0uSUBLEVELS OF THE RARE GASEXCIMERS
39nd Annual Gaseous Electronics Conference
7-10 October 1986, Madison, WI
[Bull. Am. Phys. Soc.32, 1160 (1987)]

RADIATIVE LIFETIMES OF THE 0u SUBLEVELSUOF THE RARE GAS EXCIMERS
David L. Huestis
Chemical Physics Laboratory
SRI International
Menlo Park, CA 94025
OUTLINE
Introduction
Origin of Transition Probability
Model Hamilitonian
Results and Conclusions
C-1

INTRODUCTION
The prototype "excimer" molecules.
Still interesting as efficient light sources,
and still incompletely understood.
The weakly bound ground state complicates
conventional spectroscopic investigation.
In the present study we are investigating
theoretically the fine structure of lowest of
the excimer excited states, 3+
We are especially interested in the radiative
properties of the 0' sublevel, which previous
studies have supposed to be completely
metastable.
C-2

3p55d -3p55s
2u '1000
110,000 , - 110,0g
0u-
- lu
/%/
w 100.000lii HUMP 40-100 cm-1 n0
Mi
"100.000 190,000
j I 1u, u 0g,, 0, 1g. lu 1g. 2u
tli' oo 42"'
+ u\" i - -I
01 oUoo Ar -- io=oo
0 0
HUMP140 R-1
GO 00 8.80 - 190,000N€ ou o+, o+, lg, lu
C-3Re9 -' HM 3p(20)A
•,•~ ~ =•A 6-4 cm1 ,
0 0
R -i
.Re 1925.IR
O -C-3

ORIGIN OF TRANSITION PROBABILITY
le 0e weak P2 1 and R2 1 branches
if 0e weak Q31 branch
Of 0 e very weak Q11 branch, - J(J+l)
le and If mix with 1in by spin-orbit coupling
of mixes with if by Coriolis coupling
C-4

PERTURBAT ION TREATMENT IN HUND' S (a)
A\ m E( 3 E) - E(3z0 ) is large
1/73 1 /72 - 1~l /Ti I pol 2
p- <3E11lks zo> - <3EIH5 0 i'IZ <1 31I 1 z>/(1 ll..3Z)
A- <3 IoipI1Zo> - <:3zoIHr4,tI3 1i> Pi/(3 kl-3zo)
<32ZoIHrotI3Xi> m- i2Bl[J(J+1)J½
17 < 3ZOIL .+SAl3 E> -12 ?
72/Tim 2(Bui/A)2 J(J+1)
<72/71> = 2BkTti2/A\2 .4BkT/AX2
C-5

M CV
E-4II I
z C4
0 n + 0o) a. 0.N
I-. 1lmV.V. .
oo DC14 -: -4
0L CM
0 C14 3: C4.
ad I
E4 I to- -+
adi 0. e- C . W.W
-L II0
0-4 O
10 9-(C9 9 io~~ "cla. a
U 006

C114
++'%MO
0 %000-1
U% 1-
04
bo A4 4
+- C4C4 - N f4 -
CC-7

CALCULATED Rg*ENERGIES (cm"I)
N42Ar K42 Xe2
3 + 0 0 0 0
1E 930 785 765 950
31 18100 15800 14200 16000
in 19300 16800 16100 17400
S-5 1 7 -9 4 0 - 3 4 8 0 - 6 3 0 0
Be 0.523 0.106 0.052 0.028
A 0.5 1.0 12 34
C-8

3Z,RADIATIVE LIFETIMES (ps)
oNe2 Ar 4xe
T1 26 13.7 3.1 8.5
'2 13 6.3 0.45 0.24
'3 26 11.6 0.53 0.24
<-> 20 9.4 0.68 0.35
<expt> 5.9 3.2 0.26 0.099
8 4.7 1.2 2.4
4 2.1 0.18 0.067
9§ 8 3.9 0.21 0.067
C-9

4-)
004 i-4 .
0)e > ) a t-
Ca)a) 0 k4'- IA. m Ar 4.1
G- o C#) C) 0r00 .V4 N t C
U%- C)4f
U) al m
E- t CA 0OS U
0 3. ICO) .
i-4J 0
0! --A__ _ _
94 00 5
C; "4 caP
v-I ~4) ~30 0 0 CD 5
II 0 0* ~ 0
334 00 .10 i~- 10) C ~ ~ 4

* I I
1,
B~po 1 To B7d';, B6p7r 2, o
22-" C ;,. O . A• i.,• ,906mS"1, 1. 2. 2
. .• .0o o I 't • , . • 2 . 3 .- , 5 C 7
A7d~r i~4
/ 8152.'
A7Ps \Apr
0; 0;out-o-0;2 5P,.F6 s
A~s\States of Mtolecule Ion
A', 7r
/ ~o,5p irSp ff5p •.5IIBhII,
2 5 4 2
DZ 4 4 2
It i i I .
2 2.85 4 5 6NUCLEAR SEPARATION (Au)
SA-201 8-3
FIGURE 1 XENON INTERMOLECULAR POTENTIAL CURVES
FROM THE WORK OF MULLIKAN
C-11

CONCLUSIONS
The 0- sublevels of the rare gas excimers havenon-negligible radiative transitions induced byrotational coupling.
In high pressure rare gases the sublevels ofthe % state should be well mixed. Theobserved radiative rates should be averages ofthe rates from the 1u and 0- sublevels.
There remains a factor of 2-3 disagreementbetween theory and experiment.
The lifetimes of the 0 sublevel in Kr* and Xe•are in a favorable range for molecular beaminvestigation.
C-12

Appendix D
THREE-BODY REACTION OF XeCI* TO FORM Xe2 CI
39nd Annual Gaseous Electronics Conference
7-10 October 1986, Madison, WI
[Bull. Am. Phys. Soc. 32, 1170 (1987)]

Thirty-Ninth Annual Gaseous Electronics Conference7- 10 October, 1986 * Madison, Wisconsin
PLEASE TYPE NAME. ADDRESS
& TELEPHONE NUMBER DO NOT WRITE IN THIS SPACE
D. C. Lorents Indicate topic(s) covered In the Serial No.
SRI International paper by selecting a letter and a digit Accepted: Yes - Nofrom the attached list. If more than
333 Ravenswood Ave. one, present in order of importance.
Menlo -Park, CA 94025 Indicate preferred Letter 0ith Session
(415) 859-3167 mode of presentation. I) 2 Number
[D] Poster 'Doe. Conf.
[D Lecture
[D Either
Please use this form for all papers including invited papers and papers for arranged sessions. Please indicate
at the top of this form If the abstract is for an invited paper or if the abstact Is intended for an arranged session.
Three-body Reaction of XeCl* to Form Xe2 CI,*
D. C. LOFJRNTS, R. L. SIIARPILESS, D. L. HUESTIS, SRI INTlER-
NATIONAL -- Synchrotron measurements of the decay rate of
XeCl* and the formantion rate of Xe2 CI* in Ne/Xe/Cl 2 and
Kr/Xe/Cl 2 mixtures i g composed of three components:
radiation, two-body quenching and three-body reaction.
The measurements at pressures up to 5000 Torr show that
the reaction, XeCl* + Xe + Ne + Xe2 CI* + Ne, is not a
linear function of the [Xe]iNe] product and therefore is
not a simple three body reaction. Measurements at Xe
pressures of 50 and 150 Torr and Ne pressures ranging
from 0 to 5000 Torr can be fit with the simple pressure
dependent three-body rate constant given by kp = 7x10 3 1
[XeJ[NeI/j1 + 1O-20fNe]l. This result can be quali-
tatively understood in terms of the Lindemann mechanism
that implies that the reaction proceeds through an inter-
mediate complex that is relatively long-lived.
*Work supported by ONR
D-1

Stonford Positron- Electron Accelercting Ring
(SPEAR)
S- - - rf ACCELERATING
/ CAVITY
9 ,K Storage time = 3-5 hrM -c Pulse width= 60-400 psecRep. rote = 1.28 MHz
(every 780 nsec:
FOCUSING MIRRORS
SPEAR
-- GRATINGREFOCUSING
MIRROR -2 x10 photons/A/sec/mA
Through filter tophoton counting
PMT w/ scintillotor
To scintillotor Monochromaticand Synchrotron
linear PMT Radiation
M gF2 <le- Torr
Gas Inlet
D-2

cnco
-u) cn
XCI) (T) N
CM~ d
x NN
.4U a CD 0
UN **.c *
x U~ N W)a - Ix
X U CLxU
40 0
cm NE 00 C L 3u )( 0 m~
co inx' t 11v4 t
%0>
x + t +.
u ucm * *MC
*.0 a a-* x U U
CO co NM 00
(S/L+OT) AON3flO38 AV2330
D-3

0
0V-4 U) c)
I* Ci. ) C.NY d o o
-N+ 0 0
LN X XO
NmCD 0) rI
u N. (d i
X U a ..
Z C.)
.4 0
0 C L
a Iinx t v m
ta > x(Ca 6Y
x + *
*1 1 - L ~ U
C.) )(T )3(n38 AV3
D-4

z- N- mUc m
U)~U U) U) U)xu ) % 4 % %
m x~I 1 1 I
U'- 000
LL urn urn x~
2 O)( U)
Aj 0I*l M
M M InU) K m
x' x x * * U20 - D-5-

U) U) U) (A
U) U) U
C.) U) 0% 0.u z U0 0
- C') W" 9-CDV I q Iý 1X40 XX
*-I o Cd o
+1 X V-4 +1 +01W" (O NOC
z
zw ao 1I- F-
xi w mU
0 0t c0
'%+ x C. x
+ + U 4
CYN N
D-6

w
(n.U)U)(I 0 *-
M0 U) I I z0 ** 0 0 L
9--4 CO " Vx o x x.-
P"4 +1 +1 +1 XLi 0z m 0d vw
00
z0
I.-U) U)
o 0 Li< 00 8
00 0
L M qw t
Li X
+ + +'
* * u *CY CYCw 4
D-7

U) U)a 1
U) U)
U) U ~ ~C ~ ) U)~ U) ) U) U) U)~ U) U) U
UU)mU) UzN m z N 0u N(1 z NO0UCI) ) 0 UC (IU) U) I" u U) U)0 11% L
NN N I V" (1 mI I voN% cD 0 00 1 1z0 0 x0 00 9.4q- 0 U U C1) m tn
. XI W"' C ' x 1 0Z X XX V) O X "q 0- 0M- to (D CNW- I 1 6 0Z . 0 +1Z +1 +1 +1 +1 +1 X X mI 0UJ0to (D (Do D mI q* m 1) IDC
OOwez UC NY
z *) L)xz U U u Uu
F-u 00 W* 1. Z w a<(c3(1) 0 0 :3 LP"u %0 %0 a0 > >' > t t
t t t - u a x 0
UK 4'z + +' + +*" *- *0 *- * **
D-8

CM m
z ZL1j LJi
m m01 + +
05i I- I1
C) z0 z z
< u Cf) *
LLJ N 0al
Z- *u 01- m.CW LL I 05c Nm co M1 Go II w 1
m z c1*+ z z- LO)
w w X X+ Z + X U.
S 0
05 0D 0o < 0
z0
LL
D-9

0
U)
0 0
I mI x0 0 1-0
X U') 0x0 cmX
If cr.
NY X
ux E C'
qcn
* 0 Nv 0CE L 0
Cm) cCL 0x Z)C 0? t tZt Al' Na a
S> "4) Xa.
+ + +'
N O I L - I I I- I10
CD tv ID 0
(S/8+01) 1213J~3 23 - O38A AVJ3G
D-10

Cl)N U)C' N U
u C'3'-0
0 ~
x V)0 00 5 '-
a V; In.uuU )~ E ('o
CY x'
OO4.,Y0*w
a CDX' 0?t t 01
!T) Caz>W #of x
F-' 'U
('JU U U
NAI 0) 00( 0
(S/8+Or) r[2jj13323 . 0381 AV330
D-1 I

C00
LC3 L
-0 0* m
U-)
L ,q0 (\
+ W cocr >F-" () L
(o CL00-
L LW
+ c
+ C3
* 00 cp
C*\j 0) U3 m 03
(S/8+0I) 2 lax] ex M (13)13>1 V - 3Y AV330
D-12

+ ++0
x LU') C3L
m
L I
+ i. +I".. L ><+ cc 3D
L N\ : -u0 C3LU
+ X I cu0(Lh + 0 +9
r-4 0o X L
++ 0~ ClbX CO >e+ ~X*
L u XL
+ + i
+ 0
01+ X
C'j 0) CO m 0
(S/8+01) 2 lx] ax A- [IJJ3 >l3 - JV- 31V8I AV330
D-13

0
xxx 0 0 P
aloi 00 01
+ A z
Z> LfUUU L-
C~j C:, <~ ~ CjLN u UNNNN UZ 0
%% %..%% NNa. LL.+1100 N l
+ v A v
+0
- wcp ~0-
R- 0
d cs d
(1- s BOT) 2taX3'X>1 - -2313 V - 31V8 AV330
D-14

030U')Lfl
(\J
-0 IN.
ZZOII) N
0 00 ) 0:
w000 co cm-
uca)U))U mol <~ ~ ClU
+ ZZZ WP 0 %mi a w a X xC
a-o Cl, N.N. %NC JC'JC\u al C~
al 0 6
+ EK
a 0 -X* 0 k 1
I~ IM C II
CF) C\J Lfl
(S/8+01) 21x xm- 1 2 3J~1 - - 31V8I AVJ3O
D-15

00CD
U 0
UL LL 0 X1
0 I-
M1 11 01C 0 MQ 0V
-" wa 000
001o
+ (.* C\jzu z >
+ vd
03 u+ a v a 0 wi
CU 0
C5 601 01
(S/8+0t) la8x] ax - 1 tJ)T31 To -1 V Ri AV330
D-16

U z_ 0
a al0 11
Go' 0 01
+- CT U0M 1 .4I
x~~~ Xw01 6.1 L4> Z+ CY x a<0
+ N j
+ 00
+ N w
N x9 x ~
z 0 0 <l cc;
N2333 V(0NA33 VV
D-17

Appendix E
CURRENT UNDERSTANDING OF THE XeCI LASER
39nd Annual Gaseous Electronics Conference7-10 October 1986, Madison, WI
[Bull. Am. Phys. Soc.32, 1174 (1987)]

CURRENT UNDERSTANDING OF THE XeC2 LASER
David L. Huestis
Chemical Physics Laboratory
SRI International
Menlo Park, CA 94025
DECEMBER 1985 WORKSHOP AT SRI
HISTORY
FUNDAMENTAL CONCEPTS
SPECTROSCOPY
ENERGY DEPOSITION
EXCITED STATE FORMATION
EXCITED STATE RELAXATION
ABSORPTION AND EXTRACTION
SUMMARY
E-1

0 c
U ON
0) v-4w c 0 0
0. 0) 0ccP4 C"4 -0
R4 0 00 to0rz 4 a 0 0J H14 0 ~ 0r 0 4
60 04
00
U, 0 .41C 04 d) v) 6000
0~ w- r0 "444~J~g0o 0- 41 >l r.410 -00 wo o w wO w
00 ,u $. 0 l 4 0w 44 0 0 0
>0 1 0 m 0rlw~ 0 04 0 0 0V
H x-4 u- 0 JI 44 Un 0
n 0 0 0 0 C0 00V- n )enCa 00 'c 0 cn mgGo c "4 Ov-O 0 0 4 K4 C4C* nr0 C) b 0~ 0 V4"4V- - -r4~ P4
~ l~aE022

on 4.)
m" 0": 0r
0) CJQ >w) '0 44 4 Cu
CQ 0Icu 0o
0d 0 0 Cu0 w0 "A0 C.. ' r-
N, d A4 *0 0 44Cx C ~ ~ ' 4 ) to *'44 0
E- 0 * 0 U4 41 44> W Q)x~4O 444 '-4
44 Cu 0on U, bo
0% m O 0% VO 4 0W1-4 1-4 r-4 0) r,4 r4
E4 r 4 fr -er
En4 04 *e.44HO 4)) "-1C
Cu *A444 0) Cuto) 0 004 b.0 4) >90 0c 00
ý40 4-4
44 U)44
E-3

14.
CI-
"4.
44 "4) 0
$4 0
04 03 p .
0. 0 w~
0 "4 bO0
pq CU 0 r.1 ,0 "AI. I)0-
0: 0 93-4E4U) 0p 0 0d
00 4J 44 4p 4)I 0 a Eao Mto
41- C. I 4.) QJ4.) dci o r4 ,4 r4 ~ C-U r4
00 ) 0 W4~ obOCd1
o 9:
U (4-40 E-4~4

00
U U)
o o~0Lu: 0C
0 c
Cu*
E-5

10 I I I I
8o*-Xe~ (2p 4 C1
C
>2 11112
31/2
2 - 1/2
1e.3/2C1 (20 1 1/2 .Xe+C1PI/2)V-Xe + C' (2P32)
-2 2 3 4 5 6 7 8
R (A)
Graphical Data. A-l.O. Electronic states of XeCt including spin-orbitcoupling.
E-6

co 0V4.) "-1-
000- 0dC N-o to0
l0 01 " %.o) 4)VU CU
10 0 P4 4)20z 4.) ca MC 0 0u
0 WI 1-4 4-1 r-4 00 044.1 0) Cfl0 En 4
o) p) 0 0 > 00) :3 ,4 r-4 r-i
10 0 0 Ný k4
o. CU4r 0) 00 U +
wi 0 CU0)c 44 0 4-1 CR
4.1 r- C C- ti4i1 0 pC 0 +0) Pi4 r00
r-4 CUcd 4-1 .14 4..)
0 41)0 CU
000C, ~z
E-7

ao
(/) *C\J01 0u
-~ L r. % X _U) 0 L >% c
cu 00 L 0) 4-).r.J c ' -4 C)
L 0 c 001c-0 0 a C: X5_0 u u) 0 x
01 Cl) 0 0 + 4c)
X 0 0 4C.).) 0 1% 4-) I
01 0 C. CVj a 0m z0u1f. 4.)
+ CMJ 01 C) 001+ X 01
cmJ + + G 41-)
CO + Z + *o 0..1cu 01 0 Z L
I-- + +0 x%
U) Z 01LJ0
w + xO3 0u + ED0 C
+ U+
uD + L L 01co Um0 0-)
W 0- _0 U)Z >. c c V 0W L 0 0 NC
a C) 0.E 01 01 L
0). W 0 0L + W0..L . E
0 L Ca CD 01
01 L
01 0\1c0
E-8

LILJ
E-
LJ
a)-
CLU
0E
'p.
+=
0 LLJ
LUJ
E-9

C3)
II0) c II
.5) -I I I
co (4- 1
La WiI NM IU)I IL
C) CO4 I IDw ci) I IL
>1 - CD -0 110co IL*4.-) 0) r"e 1 1cu
CU .,-§)cjiIXa _r_ _J . I I L.
V) Q>I I c
O3 _0 > I La I DLU c ..C W) I %..# I
Ln (DI La I C)Cf U.) c- m I +I~f
a) <I m m 1W-IV41r-f r I
LI u - IC0CLi I X X _xIII I 0u
CDc 0) I 1 0) I
a c C c C C 0r. C I
I- LL I LL
E-10

I I I
[HCI] = 0.3 to& •
* [Xe] = 50 torr
0 [Xe] = 30torr
o [Xe] = 10 torr
0
L 0
co
0 00 0
0
I I I
0 5 10 15 20
[Ne] [Xe] (1037 cm 6 )
JA-1522-47
FIGURE 1 THREE BODY QUENCHING OF XeCI"
E- 11 dlh03811 6

y-4
En)
4-)
Ciz
CD 0u
Ci0
z u
* I
4-) 4P 1OL 4ILf
XI X
L Lr
1 ~4.
Ia 0)
a 0
4-) 1 0o- _-)
LO f co c ( D ý
E- 12

4-.0 It
- 50
0.0
Li 3 L 4j.a m 0 "we13c
LL CL0 41 + L50.
z 4.- 01 X 0 1 x.00O 0 Cr-4 a A -4 0
- L > L) + 00
- a+ 0 - +*
o co Ci L
0 0 a 4 00. + a +#%+ C>
- >0 0)( 04I~ ~ o,% w o
-> C >+>Li 0 1
.5"4 '-4* - 0 0 a0Li 4) LiL+ A-
0- -4 .0 .*
x * + 0 + + + L -La. a U) 0 .L Li
a0 -0 00
.0 aL LCL CL Sr
E- 13
20[HoL]= 0.04%
CO 0.06%I
0 15- 0.08%
0
0.12%
zwC
zz05cc 0.16% 0
m/
0j 02 L0n"
20 40 6
TIME (NSEC)
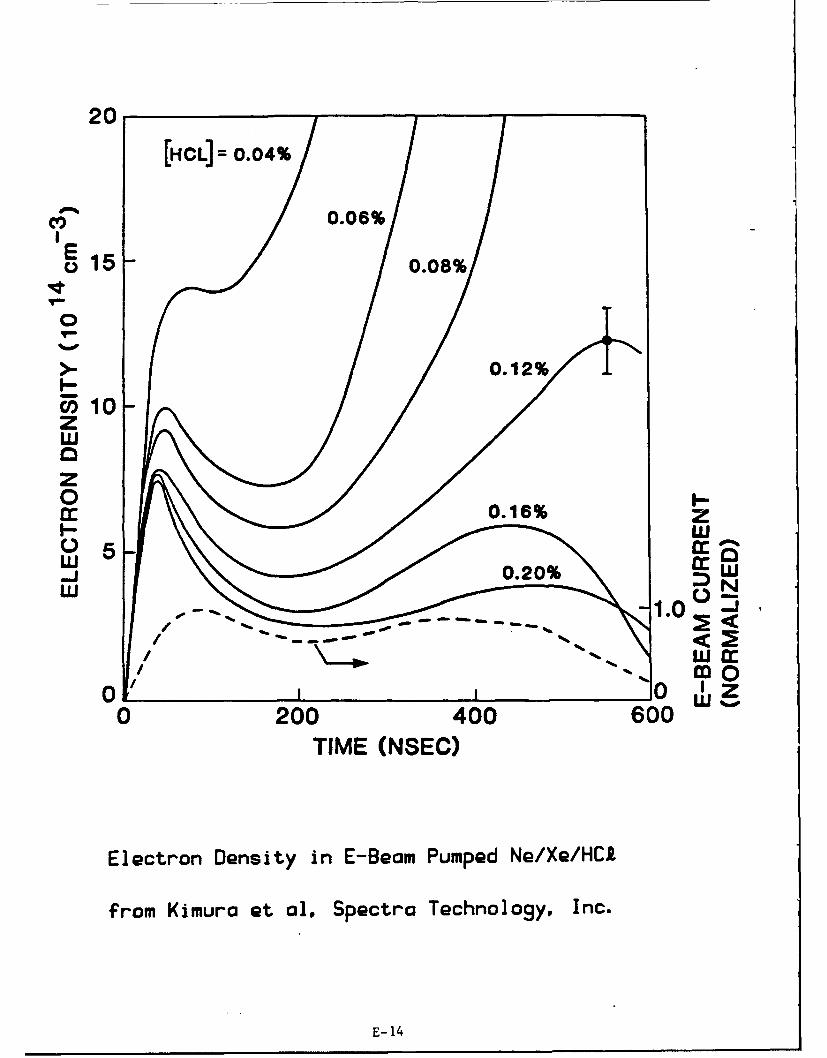
Electron Oensity in E-Beam Pumped Ne/Xe/HCA•
from Kimura et al, Spectra Technology, Inc.
E-14

0 p o)o- 04 pa
44 C0 c
E-4 41 PI
E-4-
E- 04-4 rz * U
H 3~~ 4)4 -4 C
110 4) 10 co CU s-
011a4 E! $4i 0-a 0 4-) r. CU 0 C
r bO CU CU P.1-i P 0
0 ".4 C oPd UP 4-4
o- p.- 0- 0 SH to Cd.r 01orU)~ 41. Ar- (A. CoO CU 41) v-Iw- r..00 0 e
0 lS4.) j Coco CU0 trI o 39: 0 0 bO
61- rT-4 0zz 4j4 W) Co94 v-I 0) >- - 0
01 CU r-4 0r 4)0rJL4 41)U 3 .0 ar4 .,
41) 41) 0*v4 0) CU0 eP4-4 P.. CU v
Pd ~ 4 Qp. co >ad 0.0 0 44 4) 0 U
E- 15

bCor. 0
4)Cobwo * 0
a) 0 )W 0 h Q 44
En 41 x 0 a) 0. 4
wCo r4 4 )j r-I0 *-4 p. a) wzo mat 44
z41i 0 0 CUo CU "r4 CU b0 41H- goa) 41i 9 CU
E141l CU0*-
o0a 41i CU 2r .4 p.O p- C/2v-4 p- 0
9 bO CU a) 4-4w ~U C bO '0
O 4-4 r-4 'r4 CU a9 0 'd go
41i 0 r. boH 4 0 CU0
0 "4- 4.) *r-4 Coo.dI41 En , c
CU 4i CU $. 0 0Cd 2 4 ) -r
a)~c 2-I p O '~ a410 0 -r4 :1 4 )
or-I orn 4E:j CU
0'
E- 16

L L00 a
Ul C U) Ix 0x - U) U)
(nU) NU)
0 0 N.
x 0 co 0 X 0
wJ +1 + +1I-0C) - O 0
ar D 0) CD Ul)
w
0 CD 0< 0 q
cc) m m
%A-CmX
a + + +
-E 1

00
U) 0
%00V-4a do +1
-+
x 0
a a54.'W
z a w
x 0c
_ 'C
LI L)
z a a
E- 18

uU)cr U) 0r a
U) U) wU) xU) U)
U) U
CI))
O UI U)- ~0N
0 0 0 I 0
In 0 0 x 0 - - -
a~ 0 0 0
+1+1 x x(D CD (I) ml mI Xw x m
z
z Lu w za a
U aYa -
L) L)aI a
E- 19

(n (n
N zto U) L)
0 x ICl Li 0
0 0 X-4 (l) Lflx 1 0
- N dc5 +1+1 X W-
z V 0nCV
z -Li *m -Y
--
0 a 40 0 L.
I- a
*) *
a a
E- 20

LflL()
N~
0 Ln Lr) GDCT) V r) qwz
z
co 0 0 00 (nO CZ vl Lf LfLfU) I+ a a CP zz z zz w 0
N N Nb NNN (n xCP @-" 0." P" P"W w
ql*%%41.%,..%.N- 0 -C LL
*G %%% %l Z ui
+ aZZ DOA
0 O0x 0
+ >-4
* L<W
x LiCP
CD n N V
(S 01 -OX -i -23T 31V8 AV33O
E- 21.

CM m%%.00 %00
z zLJi L-J
m m'-I Ieý01 + +
Z- II I
L) F- 01-< ) U) *
WL C\J a) - l01: a ) (Vx u
- 3* 01 LL-. m TQ LI u- Xu LMm 01 01 Xu 01 cu
I Z x 0mT z 01*
+ :z z ) -11<01 01c + 01 .. j WX wu x x wi F-
M 0u -<+ z + X LL r
F- - -
x - x X -z0P"
F-
E- 22

* z
U, ma+ I
I-i 6 0ix 01
*5l i w z
x W"01x 0 ILn <-~z ma+ cT) aU
+ N I w -
0 a "M Is
u~ -. L' n w x
01 X q-- L
ux _j c~N~ t~ 11 x L) N
01 0
+ + * w
00
In 0In dN t%- '. 0
1213J13y, -V - 3V8 AV33O :VIVOE- 23

o0, 0 41 (D
o bo - 4. 41)C.)0 o*4
z~ 4) 4)o bI -iý 0 1=
0 cU. a) (n/
r4~ :3: 4-4
r -4 CU 0 0N-, r4Co 4-4 Co
E-1 4. 4)CU 0 Co 4.)H ~ 4-) CU
0)-V. -r- *-A~h- ~CU 4-) V-
CU ,-.4 4.) dP TIe . ) Cd bom CoO 'o4a) w
z r.0 Ln~ C/) r-4
o- 41 0 1 CUCo
P4 -4 CIn r4 0 0Pd 0 bo ~ 4) p-
o- or r.)C* 0 4 ) (a) r-4
0, 000 . )41) 0
4-) CU V. C44 aU Co ho 4-4 a) 0 >
r40 " -4 Co co C
,- 24

0)
C,,)z
ooo CL
o. 0 I C', C; 61 C; C)
z00 > M
ow~ 0
15' 0 N
2(Do .2 .2
Q0 0
2 E-
oa z CL~
E- 25

coo4. C) ,
II 0
x0D
E 0L
* zow 0* CL
z cc0
<U
0))
I- i 0 00 0CL(w3 sd ie~id) Nt~d~OSZ
E- 26

>b0)0
0) C _
z cc.0 E 0
EL x
z w - C
U0 0
LI. j G U-) Cc0 .. 00) CD 0
LLm 00 0 EM ~~ Q)0
LU ,ic,)m LL .
0 0.(D 0
>) CL o) 00.2Cl)O Z * (
0 ~ 0It 0 0.
E- 27

100
0
COCO-
LL.
x 0.b- CO
(0 V
0J *%0
x>I~-
000
400CL~ 0
(U) .. am)
0 b0b.0 0)
0o 0I ) c 0 c0 M
cm))
E- 28

0)
0
.2Of C3
0 CV)
a) T0 C.)(I)) V,~
060
C.) 0
o -o
E-2

b) 4.)
U) wU:5 0,I 4) 0 0P-
5.4 05. ~4)
0 (a)1MU) 0) 0) 54-W) 00
4) 4-) 4.)44)
0 05.
s4r4 4.0 4.44.Jr41 4.)5.4 4.4
U0 U) 0 U) V"1~z 04)mi $4)w-4V 0 *U "4 ) w4 Cd :s 00w 04 4 ) )
0 V 0 0z4.) w.5 $4v-1"- 4.1 ".)
09 0010 :3 Vtk.
0 0v- Uoz 41zU f- 0)"-
04. 04.1
00 0 0 00<4) 0 0 %A
M "4 .4 a )5..
EU-) of4 eI0 24 0 - w4.
"U) C, 4) 0 i
" "-4 0 4) 4-) 0 009: 4)r- 4 4.) c c
E- 30

Appendix F
NUMBER OF QUASIBOUND LEVELS BEHIND A ROTATIONAL BARRIER
Phys. Rev. A37, 4971 (1988)

PHYSICAL REVIEW A VOLUME 37, NUMBER 12 JUNE 15, 1988
Number of quasibound levels behind a rotational barrier
David L. HuestisChemical Physics Laboratory, SRI International, Menlo Park, California 94025
(Received 21 January 1988)
The number of quasibound or rotationally predissociating levels of diatomic molecules is investi-gated using a long-range approximation of the difference between the Jeffreys-Wentzel-Kramers-Brillouin estimates of the vibrational quantum numbers at the maximum of the rotational barrierand at the dissociation limit. It is found that for a fixed J the expected number of quasibound levelsis approximately J/20, essentially independent of the magnitude and form of the potential and in-dependent of the mass of the nuclei.
The effective interatomic potential for a rotating dia- Thustomic molecule, Uj(R), is typically represented at large R itR 1o0by adding the rotational kinetic energy to a single-term Vb - Vo a f a)eb )[Eb -- U.1(R )]12 dRmultipole expansion, giving an expression of the form R2(0)
U,(R)---* 2J(J + 1 )/2 1.R 2-Cn /R+a (f) 1af () [E6 - U,(R)]" 2
Such a potential has a maximum value of -[ - U,(R)]"2 IdREb' l -2)(nC,)-2/-2)(I-l/n) , (2) + Rt2(Eo) -U,(R)]i12dR
~42JJ /~M~fl2 ~2C +aftR(0) [Ei,-U, R)'d (6)
at Following the approach of LeRoy and Bernstein,3 we
npCn I I/(i-2) plan to ignore the first term [supposing thatR6= *j( j+l) (3) R,(Ei,)-R1 (O) is small and that the repulsive wall is
I J steep] and to replace U,(R) by its asymptotic expansion.
derived from the condition U;(Rb ) = 0. We are interest- This givesed in estimating the number of quasibound vibrational Ub UO-=--9 I - U,(R)Eb ]1/2levels that can exist behind this barrier. To do this wefollow Stogryn and Hirschfelder' and Dickinson and +[_U,(R)/Eb ]"2 1-'dyBernstein2 and construct the Jeffreys-Wentzel-Kramers- Rb IROBrillouin (JWKB) estimate for the vibrational quantum +0f4 [l-U,(R)/Eb]112dy (7)number Vb at the barrier maximum E =Eb, and compareit with the vibrational quantum number uo at the dissoci- where we have substituted g9=aR 0V'b and y =R /Ro.ation limit E =0. Suppose that R I(Eb) and R2(Eb-)=Rb See Fig. I(b) for a comparison of the exact [Eq. (6)] andare the left- and right-hand turning points for E =Eb, as long-range approximation [Eq. (7)] to the JWKBshown in Fig. 1(a); then, difference integrand. Deriving
R (Eb) W
Vb.-F=afR(Eb)[Eb--Uj(R)12dR (4) J 2 n /i--2) (8)
where a-= V(-2i/(r,-i). Similarly, if R1(0) and R 2(0) 1* 2J(J+l)
=R0 are the left- and right-hand turning points for from the condition U,(R 0 )=0, we are ready to perform aE =0, we have number of back substitutions.
o A (o) . The remarkable result of these substitutions is that theT =a ft(0) [Uj(R))dR (5) molecular parameters 14 and C. disappear entirely, and
37 4971 @1988 The American Physical Society
F-1

4972 BRIEF REPORTS 37
Rb TABLE I. Numerical values for the integral I.(a) R-(Eb) E- E n Present Ref. 2
E.0 3 0.04514 0.0498 0.04985 0.04986 0.0482 0.04827 0.04628 0.0441 0.0449 0.0420
(b) Lo-'n"g Rae Appmximation 10 0.0401
NQB(J)=Vb -v 0 =0.048±0.02[J(J + 1)]1/2
FIG. 1. (a) Upper curve: Effective potential Uj(R) based on --J/20 (12)a Leonard-Jones (12,6) form. (b) Lower curves: JWKBdifference integrands for the exact potential and for the long- is entirely independent of the molecule, under considera-range approximation. tion.
To assess the applicability of the expressions derivedabove, we have examined the published compilations ofquasibound levels in which it is claimed that all the quasi-bound levels have been calculated. The formula forNQW(J) above indicates the average number of quasi-
only the dependencies on n and J remain. We first note bound levels expected. For any specific J, we expect tothat Rb/Ro=(n/2)t1 °t- 1lpn, then we evaluate find at least J/20-1 and at most J/20+l levels. To13= [d(1 + 1)/y, ]t~2/ir, where evaluate whether the number of levels found matches our
(n / 2 )fn/(A -2) expectation we count all the levels expected for angularVfl = (n/2-1) ' (9) momenta up to the specific value of J,
J
and further observe that -U,(R)/Eb=yn(y-y- 2). TQ(J)= , NQB(L)_J(J+2)/4O. (13)
Thus we have L=O
Vb -VO U [J(J + 1)] 12 ... (10) Figure 2 shows a graphical comparison of the numbers
where".
1n ff-2(. . )] 1/2[2 100' -zl
+[Y'(y-nY fl....y 2)Jij dyL1 +[y/(y- __ -y)]/ '-dy Joo.-(11) o*+f [~l+'Y.(Y-n-Y- 2)]l/2dy " 641 -3
j36
We have just shown that the number of quasibound levelsdoes not depend on A and C.. 16 ,
An even more surprising result is obtained when weevaluate the integral I,. Integrating numerically we findthe results given in Table I, and we conclude that thenumber of quasibound vibrational levels is effectively in-dependent of n as well. Also included in Table I are the 0 I I
numbers derived by Dickinson and Bernstein2 for n =4, 0 10 20 30 40 so 6 70
6, and 8. They considered potentials for which theJWKB integrals for Vb and vo could be evaluated explicit- FIG. 2. Graphical comparison of expected number of quasi-ly in terms of elliptic integrals and extracted the leading bound levels with the numbers found in exact calculations. x 's,term in J of the difference between them. They noticed HeH+ (Ref. 4); + 's, CH+ (Ref. 5); diamonds, H2, HD, D2 (Ref.the near independence on n, but their formulation did not 6) and HT, DT, T2 (Ref. 7); squares, HgH (Refs. 8 and 9); trian-make clear that the expected number of quasibound Iev- gles, H2+ (Refs. 10 and 11); filled circles, more than one super-els for low J, imposed symbol.
F-2

37 BRIEF REPORTS 4973
TABLE II. Numbers of quasibound levels in ranges of J.
TQB TQB NQB in ranges of JXs, TQB(J)-TQB(J-10)J,. obs calc 0-9 10-19 20-29 30-39 40-49 50-59 60-69
3He'H+ ' 26 20 19 2 8 104He'H+ ' 27 21 20 2 7 143He 1H+ & 34 32 31 1 8 14 7CH+ b 36 37 34 2 6 15 144He 2H+& 36 39 34 2 8 17 12H2 C 38 47 38 2 8 19 18HgH1 39 43 40 5 9 10 10H 2+4 41 46 44 2 6 12 23 2HDc 44 65 51 3 8 18 19 7HTr 47 73 58 2 8 16 30 17D2 54 96 76 2 7 15 17 36 8Dr' 59 113 90 1 8 15 25 36 28T2 r 67 144 116 1 7 16 24 34 45 17
Eq. (13) 2.5 7.5 12.5 17.5 22.5 27.5 32.5
'Reference 4.b Reference 5.'Reference 6.d References 8 and 9.'References 10 and 11.(Reference 7.
of quasibound levels found in exact calculations from the tegral; however, the exact calculations continue to exhibitliterature with the above simple formula (we have used a a common dependence on J.square-root scale on the y axis to make the low J values Table I1 shows numerical summaries of these samemore discernible). For low J (say < 30), the present comparisons. The levels have been grouped in ranges oftheory is clearly consistent with the exact results. The ten values of J. Again, we see that essentially perfectonly exceptional case is HgH, for which the potential is agreement for low J and rather good agreement even forknown to have an abrupt change of form at R =4 A (Ref. the total number of quasibound levels up to the highest J12) and thus cannot be represented by a single long-range for which quasibound levels are supported by the poten-multipole term. For higher values of J, the present tial.theory consistently underestimates the number of quasi-bound levels, because of the increasing contribution of This work was supported by the U.S. Office of Navalthe left-hand turning points to the JWKB difference in- Research.
ID. E. Stogryn and J. 0. Hirschfelder, J. Chem. Phys. 31, 1531 J. LeRoy and C. Schwartz, University of Waterloo Chemical(1959). Physics Research Report No. CP-301R (revised 2nd printing,2A. S. Dickinson and R. B. Bernstein, Mol. Phys. 18, 305 (1970). 1987) (unpublished).
3R. J. LeRoy and R. B. Bernstein, J. Chem. Phys. 52, 3869 8W. C. Stwalley, A. Niehaus, and D. R. Herschbach, J. Chem.(1970). Phys. 63, 3081 (1975).
4R. I. Price, Chem. Phys. 31, 309 (1978). 9M. Hehenberger, P. Froelich, and E. Brindas, J. Chem. Phys.5H. Helm, P. C. Cosby, M. M. Graff, and J. T.. Moseley, Phys. 65,4571 (1976).
Rev. A 25, 304(1982). 10M. Kuriyan and H. 0. Pritchard, Can. J. Phys. 55, 34206R. J. LeRoy, J. Chem. Phys. 54, 5433 (1971); University of (1977).
Wisconsin Theoretical Chemistry Institute Report No. WIS- I1J. P. Davis and W. R. Thorson, Can. J. Phys. 56, 996 (1978).TCI-387, 1971 (unpublished). "2W. C. Stwalley, J. Chem. Phys. 63, 3062 (1975).
7C. Schwartz and R. J. LeRoy, J. Mol. Spec. 121, 420 (1987); R.
F-3

Appendix G
COLLISIONAL PROCESSES IN XeF(X)

COLLISIONAL PROCESSES IN XeF(X)
G. Black, L. E. Jusinski, and D. L. HuestisMolecular Physics Laboratory
SRI InternationalMenlo Park, CA 94025
ABSTRACT
Collision-induced dissociation of XeF(X) has been studied with He, Ne, Ar, Kr, Xe, N2,
SF 6 , and XeF2 as collision partners, giving dissociation rate constants of 0.58, 0.62, 0.76, 0.68,
0.75, 1.13, 1.05, and 7.3 (±10%) x 10-12 cm 3 molec -1 s-I respectively. The values for He and
Ne are in reasonable agreement with those found previously [Fulghum et al. Appl. Phys. Lett. 35,
247 (1979)]. Except for XeF2, there is only slight dependence on the nature of the collision
partner. By following the approach to association/dissociation equilibrium in Xe, we are able to
determine that the yields of bound XeF(X) from photodissc.iation of XeF 2 at 193 and 248 nm are
only 0.4% and 0.08% respectively, with fragmentation to give three atoms the dominant pathway.
Vibrational relaxation is observed and studied in detail for collisions with XeF2, with which it is
found to be very fast.
G-1

INTRODUCTION
The XeF(B-X) laser operates in the near ultraviolet on a number of bound-bound
transitions, as listed in Table I and illustrated in Figure 1, terminating on various vibrational levels
of the ground X21+ state. The ground state of XeF is weakly bound (De = 1175 cm-1 ),
supporting a total of 15 ± 2 closely spaced vibrational levels (we = 226 cm cm-1). [2,3] In the
absence of collisional processes depleting these levels, the ground-state population would
accumulate and eventually exceed that in the upper laser level, resulting in termination of laser
action. Vibrational relaxation in the lower levels is insufficient to adequately deplete the
population, since the small vibrational spacing leads to estimates that 9.6% and 4.4% of the ground
state molecules will be in v" = 2 and v" = 3, respectively, in equilibrium at room temperature [4].
On the other hand, the binding energy of the ground state of XeF is sufficiently weak that the
lower level population can be depleted by collision-induced dissociation, which removes the
ground state entirely (rather than simply changing its vibrational distribution).
Determination of the rates of collision-induced dissociation is a complicated task with an
extensive literature (e.g., see Dove et al. [5]). Experimental measurements exist on a number of
systems, usually from shock tube studies. These have been modeled by master equation
treatments using semiempirical microscopic rate coefficients. In a number of cases, ab initio
collision dynamics studies helped supply these rate coefficients. For XeF(X), the previous work
consists of (1) modeling studies [8,9,10], (2) inferences from laser gain and fluorescence
measurements [4,6,7], and (3) direct measurements of vibrationally resolved collision-induced
dissociation by He and Ne [11,12,13]. In addition to these gases, collision-induced dissociation
has been studied with Ar, Kr, Xe, N2 , SF 6 , and XeF2 in the work described here. We also report
some measurements of vibrational relaxation in XeF(X) by XeF2.
G-2

EXPERIMENTAL
The source of the XeF(X) for these experiments was photodissociation of XeF2.
Photodissociation was carried out at both 193 nm (ArF) and 248 nm (KrF) using an excimer laser
(Lambda Physik EMG 102 in the unstable resonator configuration). A schematic of the apparatus
is shown in Figure 2. A similar approach has been used previously in our laboratory [14,15] and
elsewhere [12,13]. At 193 nm, the absorption cross section of XeF2 is 6 x 10 -19 cm2 and at
248 nm, a factor of 3-4 smaller [16,17]. The apertured excimer beam (6-mm diameter ) irradiated
the sample with typically 10 mJ at KrF and 2 mJ at ArF in a 10-ns pulse, dissociating <1% of the
XeF2. The path length through the cell was -30 cm and the cell volume -300 cm 3. Gas mixtures
were made up in a stainless steel mixing tank (= 4 liter volume) and then slowly flowed through
the cell to avoid buildup of photolysis products.
The XeF(X) ground state was detected by LIF on the B +- X transition. Observations
were made on v" = 0-5, in all cases pumping up to the v' = 0 level and monitoring either (0,2) or
(0,3) emission. The pumping source was a Quanta-Ray Nd:Yag-dye laser system that, after
doubling provided -5 mJ in the cell in the 340 - 360-nm region of the B-X (0,0-5) transitions in a
pulse of =5-ns duration with a linewidth of =0.5 cm-1. For these measurements, the lasers were
operated at 10 Hz and were adjusted to overlap spatially along the length of the cell. The time
delay between the photodissociation and probe lasers was set by a digital delay generator
programmed in a nonlinear ramp from a VAX 11/750 computer in another room. [DID WE
CALIBRATE THE TIME BASE?]
The detection system, situated perpendicular to the laser beams, consisted of a 0.35-m
monochromator equipped with an RCA C31034A photomultiplier. For most measurements, the
monochromator slits were set at 200 pm providing a spectral bandwidth of 0.4 nm. The
photomultiplier output passed to a boxcar averager (Stanford Research Systems Model SR250) and
G-3

then to the computer for storage and subsequent analysis. [WHAT WAS THE SETTING ON
THE BOXCAR? WINDOW POSITION AND WIDTH?]
Most measurements were made with the dye laser wavelengths close to the band origins, in
which case a number of rotational lines overlapped the dye output and the largest signal was
obtained. Because this approach favors low values of J", many measurements were made with the
dye pump wavelength shifted several A to the red of the band origin, where higher J" levels would
be excited. Since no significant difference could be found in the results, rotational energy
apparently was rapidly equilibrated within each vibrational level (i.e. faster than vibratkinal
relaxation or collision-induced dissociation). Because the dye laser power is sufficient to saturate
the B--X transitions within its =4.5cm-1 bandwidth, the intensity of the LIF signal had only very
slight dependence on dye laser energy. Hence, the signal intensity is relatively independent of the
absorption cross section for the pumped transition and effectively proportional to the ground-state
population.
G-4

RESULTS AND DISCUSSION
COLLISION-INDUCED DISSOCIATION
Figure 3 shows the temporal behavior of the XeF(v"=0) level when XeF2 at a pressure of
0.5 torr is photodissociated at 248 nm. The solid line is a two-exponential least-squares fit. The
monochromator is set to observe the (0,3) B4-X emission, and the spike at the origin originates
from the production of this emission feature by the KrF laser alone. This interfering emission was
observed to exhibit a squared dependence on the KrF intensity, as expected, since direct
production of XeF(B) is not energetically possible at 248-nm. In previous work in this laboratory
[15] the production of B--X emission in 248 nm photodissociation of XeF2 was attributed to the
sequence of reactions
XeF2 + hv (248 nm) - XeF(X) + F (1)
XeF(X) + hv (248 nm) - XeF(D)v'=7,8,9 (2)
XeF(D) + M -* XeF(B,C) + M (3)
It was also shown previously [14] that photodissociation of XeF2 by the KrF laser leads to a
strongly nonthermal vibrational distribution in XeF(X). The behavior shown in Figure 3, in which
little v" = 0 is produced directly but builds up rapidly by vibrational cascade from higher levels
followed by a slower removal by collision-induced dissociation, supports this conclusion.
Figure 4 shows a similar experiment using 193 nm to photodissociate the XeF 2.
Interference from the ArF laser is also apparent. In this case, the B-X (0,3) emission produced
by the 193-nm radiation exhibited a first-power dependence on excimer energy, since direct
production of XeF(B) is possible at this wavelength. Figure 4 shows that, in this case, any rise of
G-5

XeF(v"--0) due to vibrational relaxation was small compared to the direct production by
photodissociation at 193 nm. This finding conflicts with earlier work [12] on this same system.
As with 248 nm, the subsequent slow decay reflects collision-induced dissociation.
Confirmation of this view was obtained from observations of the other v" levels. Figure 5
shows temporal profiles of v" = 0-3 using KrF photodissociation. Up to v" = 3, effectively the
same slow final decay could be seen, confirming collision-induced dissociation from a relaxed or
steady-state distribution of vibrational levels. For v" = 4 and 5, only the much faster initial
disappearance could be detected. Thus, we interpret the fast initial decays of v" >1 and build up of
v" = 0 in terms of vibrational relaxation, (see below). The steady-state vibrational distribution is
expected to be Boltzmann-like for low values of v, with the higher levels (within kT of the
dissociation limit) suppressed owing to more rapid collision-induced dissociation [18]. The
experimentally observed rate of collision-induced dissociation is then an average of the state-
specific rates weighted by the steady-state vibrational populations.
Figure 6 shows the rate of collision-induced dissociation as a function of XeF2 pressure for
experiments with both 248- and 193-nm photodissociation using observation on only the v" = 0
level. With 248-nm photodissociation, where both the rise and fall of the XeF(X)v-=o signal could
be observed, the addition of other gases was observed to increase both the rate of v" = 0
production by vibrational relaxation and its rate of removal by collision-induced dissociation. The
effect of He on the rate of collision-induced dissociation (after correcting for the effect of XeF2) is
shown in Figure 7. The other gases studied gave similar effects, and the resulting rate coefficients
are shown in Table II.
As can be seen from the results in Table II, except for XeF2, there is very little dependence
of the rate coefficients on the nature of the collision partner. This finding agrees with theoretical
expectations [4]. Clearly, specific chemical effects are associated with the much higher rates for
XeF2. Within the respective error bars, the value for He is in agreement with the value of (0.44
0.10) x 10-12 cm 3 molec-I s1 determined by Fulghum etal. [121, but it is a factor of 2 larger than
G-6
their subsequent value of 0.31 x 10⁻¹². The intercept value in Figure 2 of this earlier work [ 12],
which should be due to collision-induced dissociation by XeF 2, gives a very large rate coefficient,
=2 x 10-11 cm 3 molec 1 s-I when interpreted in this way. Perhaps the accumulation of photolysis
products, resulting from the lack of a flow system in this earlier work is the source of the
disagreement (despite the use of very low photolysis intensities to minimize the extent of
photodecomposition). Our rate coefficient for Ne is somewhat larger than the 0.33 0.2 x 10⁻¹²
found by Fughum et al. and more than three times the value of 0.18 x 10⁻¹² inferred independently
by Tang et al. [8,101 and Rokni et al. [9] from laser gain and from sidelight-fluorescence
suppression measurements, respectively.
XENON EXPERIMENTS
With xenon as the added gas, the observations were somewhat different, as Figure 8
shows. A rise is seen to a steady-state intensity lasting several milliscads. The steady-state signal
arises from the steady-state concentration of XeF(X)v"'o established in the equilibrium
Xe + F+ XeE--- XeF+ Xe (4)
and the rate of approach to this steady state will reflect the rate of collision-induced dissociation (if
vibrational relaxation is the faster process, as found in the other systems). On this basis, the value
for Xe shown in Table II was obtained. The Xe dependence of the rise frequency is shown in
Figure 9. The steady-state signal, whose magnitude is roughly proportional to the Xe density as
expected [at high density, Xe quenches XeF(B)], eventually decays as F atoms and XeF molecules
diffuse out from the common volume illuminated by the two laser beams.
It is interesting to compare our results to those of Appelman and Clyne [ 191, who studied
the disappearance of F atoms in a mixture of Xe and Ar buffer gases. They attributed this loss to
three-body formation of XeF in the reaction
Xe + F + Ar -, XeF + Ar (5)
G-7

with subsequent loss of XeF resulting in formation of XeF2. They performed these measurements
under a single set of conditions, [Xe] = 3 x 1016 cm-3 and [Ar] = 5 x 1016 cm-3, and observed a
decay frequency of 5.6-s- 1. Our results suggest that under these conditions the three-body
formation of XeF will reach equilibrium with collision-induced dissociation on a much faster time
scale (6 x 10⁴-s-1). Thus, the net loss of F atoms Appleman and Clyne observed must be
controlled by other reactions. Possible candidates are
XeF + F2 -XeF 2 + F (6)
and
XeF + F -F2 + Xe (7)
Our Xe studies also allow us to estimate the branching ratio for the process
XeF2 + hv --+ (/XeF + F\\Xe + F + F/ (8)
We can use steady-state concentration of XeF at long time to calibrate the XeF produced directly by
the photolysis laser. Figure 10 shows temporal profiles of XeF(X)-_--o resulting from 193-nm
photolysis at two relatively low Xe pressures (25 and 50 torr). In both cases, the amount of
XeF(X) produced by the laser is comparable to that in the eventual steady state. For pressures >50
torr, the signal rises to the steady-state value, where as for [Xe] <_25 torr, the signal falls. A
similar relationship holds for the higher vibrational levels, v" = 1-4, confirming that vibrational
relaxation is much faster than collision-induced dissociation. [COULD THIS JUST MEAN THAT
THE INITIAL DISTRIBUTION IS SIMILAR TO THE STEAD-STATE DISTRIBUTION?]
Thus, we conclude that for 193-nm photolysis at Xe pressure of about 35 torr,
G-8

[XeF(X)]initia1 - [XeF(X)Iequilibrium (9)
when summed over the first five vibrational levels. Our previous calculation of the equibrium
constant [4] allows us to infer that at 35 torr
v O XeF(X)]equilibrum - 0.002 [F'equilibrium (10)
Hence, we can conclude that the production of XeF(X) is a minor product of XeF2
photolysis at 193 nm, with a quantum yield of 0.4 0.1% (note that two F atoms are produced for
each dissociation). Furthermore, the direct yield of XeF (B) at 193 nm must be very small
(<0.O 1%).
A similar investigation with 248-nm photodissociation gave an even smaller yield of the
v" = 0 4 bound levels (quantum yield =0.08%). Within the experimental errors, the bound levels
above v" = can be neglected, and the above numbers represent the total yield of bound levels.
VIBRATIONAL RELAXATION
As mentioned above and illustrated in Figure 5, with XeF2 alone and with the KrF laser,
the v" = 0 rise time and the initial decays of v" = 2-5 were sufficiently slow that they could be
measured despite interference from excimer-produced fluorescence. Figure 11 shows the results
as functions of XeF2 density, and Table III lists the slopes. The rate of formation of v" = 0 should
correspond to an "effective" rate coefficient for vibrational relaxation from all the higher levels.
Because of the suggestive pattern exhibited by the effective rate coefficients listed in Table Il, it is
tempting to infer that vibrational relaxation occurs in Av" = 1 steps, for which the numbers listed in
Table III would then be the state-to-state rate coefficients (the rise of v" = 0 being the relaxation of
v"=1). This inference poses two problems. First, the rates observed are very high, and could
result from a "chemical" rather than "physical" relaxation mechanism. A possibility is F atom
exchange,
G-9

XeF + XeF2 --* XeF2 + XeF (I1)
which might be expected to accomplish energy scrambling. Second, in each case, the separation
between the neighboring vibrational levels is less than kT, so that in addition to cascade filling
from above, any given vibrational level is also significantly repopulated by vibrationa' excitation
from the next lower level. The net result is that multiple-exponential decays should always be
observed and the rate coefficients derived from fitting the data should depend on the initial
conditions, on the rate of decay of the resulting equilibrium distribution, and on the signal-to-noise
ratio.
In an attempt to quantify these arguments, we tried to simulate the data shown in Figure 5
using a model similar to that developed previously [4,7] (The vibration and dissociation
parameters, Q and C, respectively, were increased by a factor of 17, and a constant, 4.4 x 10⁻¹²,
was added to each state-specific dissociation rate coefficient). The result, assuming the population
is initially in v" = 3 is shown in Figure 12. Table ElI lists the model rate coefficients for single-
step vibrational relaxation and excitation, along with the total-removal rate coefficient, for each
level. We are encouraged in our interpretation of the experiments by the agreement between the
observed effective rate coefficients and the Av" = 1 values from the model, despite the fact that the
model predicts that the total rates of removal from each level are a factor of 2 to 3 larger.
ACKNOWLEGMENTS
We are pleased to acknowlege the assistance of Dr. M. R. Taherian in preparing the
apparatus and computer interface for these experiments. The VAX 111750 computer used in these
experiments was purchased under Grant No. PHY-8114611 from the National Science
Foundation. The research reported here was supported by the Office of Naval Research.
G-IO

REFERENCES
1. J. Tellinghuisen, P. C. Tellinghuisen, G. C. Tisone, J. M. Hoffman, and A. K. Hays, J.
Chem. Phys. 68, 5177 (1978).
2. P. C. Tellinghuisen, J. Tellinghuisen, J. A. Coxon, J. E. Velazco, and D. W. Setser, J.
Chem. Phys. 68, 5187 (1978).
3. P. C. Tellinghuisen and J. Tellinghuisen, Appl. Phys. Lett. 43, 898 (1983).
4. D. L. Huestis, R. M. Hill, D. J. Eckstrom, M. V. McCusker, D. C. Lorents, H. H.
Nakano, B. E. Perry, J. A. Margevicius, and N. E. Schlotter, "New Electronic Transition
Laser Systems," Report No. MP 78-07, SRI International, Menlo Park, CA (May 1978).
5 J. E. Dove, M. E. Mandy, N. Sathyamurthy, and T. Joseph, Chem. Phys. Lett. 127, 1
(1986).
6 C. Duzy and V. H. Shui, "Theoretical Study of XeF Vibrational Excitation and
Dissociation," presented at the 31 st Annual Gaseous Electronics Conference, 17-20 October
1978, Buffalo, NY.
7. D. L. Huestis, D. J. Eckstrom, B. E. Perry, R. M. Hill, W. K. Bischel, K. Y. Tang, and D.
C. Lorents, "Electronic Transition Laser Systems," Report No. MP 81-004, SRI
International, Menlo Park, CA (March 1981).
8. K. Y. Tang, R. 0. Hunter, Jr., and D. L. Huestis, "Lower level removal in XeF," presented
at the 31st Annual Gaseous Electronics Conference, 17-20 October 1978, Buffalo, NY.
9. M. Rokni, J. H. Jacob, J. C. Hsia, and D. W. Trainor, Appl. Phys. Lett. 36, 243 (1980).
G-11

10. K. Y. Tang, R. 0. Hunter, Jr., and D. L. Huestis, "Lower level removal in XeF," Appendix
D in Reference [7].
11. S. F. Fuighum, I. P. Herman, M. S. Feld, and A. Javan, Appi. Phys. Lett. 33, 926 (1978).
12. S. F. Fuighum, M. S. Feld, and A. Javan, Appi. Phys. Lett. 35, 247 (1979).
13. S. F. Fuighum, M. S. Feld, and A. Javan, IEEE J. Quantum Electron. QE-16, 815 (1980).
14. H. Helm, D. L. Huestis, M. J. Dyer, and D. C. Lorents, J. Chem. Phys. 79, 3220 (1983).
15. H. Helm, L. E. Jusinski, D. C. Lorents, and D. L. Huestis, J. Chem. Phys. 80, 1796
(1984).
16. G. Black, R. L. Sharpless, D. C. Lorents, D. L. Huestis, R. A. Gutcheck, T. D. Bonifield,
D. A. Helms, and G. K. Walters, J. Chem. Phys. 75, 4840 (1981).
17. N. K. Bibinov, I. P. Vinogradov, L. D. Mikheev, and D. B. Stavrovskii, Kvanovaya
Electron. (Moscow) 8, 1945 (1981) [Soy. J. Quantum Electron. 11, 1178 (1981)].
18. C. A. Brau, J. C. Keck, and G. F. Carrier, Phys. Fluids 9, 1885 (1966).
19 E. H. Appleman and M.A.A. Clyne, J. Chem. Soc., Faraday Trans. I, 71, 2072 (1975).
G-12

Table 1XBF LASER TRANSITIONS [1]
348.8 nmV=2 v=5
351.1lnmnV v
-351.3 nmV=0 v=2
353.2 nm V 4v
353.2 nm V'=1 -4 v = 6
Table 2
Rate Coefficients for Collision-inducedDissociation of XeF(X) at 300 K
Gas Rate Coefficients (10.12 cm3 molec1l srl
Present Work Previous Work
He .58 ±0.06 0. 44 ±0.1 a0.1
Ne .62 ± 0.06 0.33 ± 0 .2a0.8Ar .76 ±0.08Kr .68 ± 0.07
Xe .75 ± 0.08N2 1.13 ±0.11SF6 1.05 ±0.15
XeF2 7.3 ± 0.8 -20
a Reference [12]b Reference [13]c References [8,9,10]d Estimated from intercept in Figure 2 from Reference 11 2]
G- 13

Table 3
Effective Rate Coefficients for Vibrational Relaxationof XeF(X) by XeF2 at 300 K
Rate Coefficients from ModelaProcess Observed vi AV" AV" = +1 Total
Rate1
0 0.4 0.5
Rise of v"=0 0.78 1 1.1 0.6 1.8
Decay of v"=2 1.2 2 1.4 0.9 2.5
Decay of v"=3 1.7 3 1.9 1.4 3.7
Decay of v"=4 2.8 4 2.6 2.1 5.8
Decay of v"=5 3.4 5 3.6 3.3 10.2
a In units of 10-10 cm3 molec"1 s-1
G-14

FIGURE CAPTIONS
1. Schematic XeF energy level diagram.
2. Schematic of the experimental apparatus for XeF production by photodissociation of XeF2
and for monitoring its decay by LIF.
3. XeF(X)v,- = 0 production by 248-nm photodissociation of XeF2 at 0.51 torr and its
subsequent disappearance by collision-induced dissociation.
4. XeF(X)v,, = 0 production by 193-nm photodissociation of XeF2 at 0.42 torr and its
subsequent disappearance by collision-induced dissociation.
5. Comparison of time histories of XeF(X),"=0,1,2,3 populations following KrF laser photolysis
of 0.66 torr of XeF2 .
6. XeF(X),."=0 decay rate by collision-induced dissociation versus concentration of XeF2 .
7. XeF(X),"--0 decay rate by collision-induced dissociation versus concentration of He.
8. Temporal profile of XeF(X),-=0 in the 248-nm photodissociation of XeF2 at 1.0 torr in the
presence of 50 torr of Xe.
9. Rate of collision-induced dissociation of XeF(X) by Xe, derived from the rate of rise of
XeF(X)v-_-O.
10. Temporal profile of XeF(X)v"=0j in the 193-nm photodissociation of XeF 2 at 0.33 torr in the
presence of 50 torr of Xe (upper curve) and at 0.50 tor" in the presence of 25 torr of Xe
(lower curve).
G-15

11. Fast decay rates of XeF(X)v"=2-5 and vibrational relaxation rate into XeF(X)v"=0 versus
concentration of XeF2.
12. Comparison of model calculations with observed XeF(X)v"_-0,1,2,3 populations following
KrF laser photolysis of 0.66 torr of XeF2.
G-16

Xe+ + F°
2 B -2
A 340-360 nmExcite/detect
2
RAM-7123-1
Figure 1. Schematic XeF energy level diagram.
G-17

680-1.064 532 720
JU nm nm__ PrismNd: Yag_ " 0 =Dye Laser ==: D
DlyPressure Gauges 340-Generator J 360
1 , Gas Flow s j Pump nm
,, ArF Laser•- \ \ \\--rz-L-- //Delay o oh o a rGenerator Ioohoao I
=.w Boxcar I-- Signal Out toComputer
JA-3021 -UA
Figure 2. Schematic of the experimental apparatus for XeF production by
photodissociation of XeF2 and for monitoring its decay by LIF.
G-18

I II I I I , I I I
Excimer-Produced12 Fluorescence
LI-
Rise T- =1.48 x 10⁶ 11
-a 8 Decay =T0.115Mx 106 S1
a
U.0x 4E0
-1 5 11 17 23 29
TIME (10-6 S)JA-8041 -12
Figure 3. XeF(X)v-.o production by 248-nm photodissociation of XeF2 at0.51 torr and its subsequent disappearance by collision-induceddissociation.
G-19

16 1 1
Excimer-ProducedFluorescence
S12
--
S8 Decay r- 1 = 0.092 x 10⁶ s-1
-Lx
S-
u.-
-J-
0
-1 5 11 17 23 29
TIME (10-6 s)JA-8041-13
Figure 4. XeF(X)v-O production by 193-nm photodissociation of XeF 2 at0.42 torr and its subsequent disappearance by collision-induceddissociation.
G-20

2
XeF2 = 0.66 torr KrF Laser
= 30
v 2
xx
-1 4 9 14 19 24
TIME 110.6 s)RAM-71 23-2
Figure 5. Comparison of time histories of XeF(X)v._O, 1, 2, 3 populations following
KrF laser photolysis of 0.66 torr of XeF2.
--- 21

67-0
00
4 0
000
S00
2 0 0
000 KrF
0 ArF
0 I I I I I I
0 2 4 6 8
XeF2 (1016 molec cm- 3 )JA-8041-14
Figure 6. XeF(X)v-.o decay rate by collision-induced dissociation versusconcentration of XeF 2 .
G-22

40
06 0
- 0000
00
7 2
_ KrF6 *ArF
0
0 2 4 6
He (1018 molec cm- 3 )JA--8041 -15
Figure 7. XeF(X)v--o decay rate by collision-induced dissociation versusconcentration of He.
G-23

2 12
S8
"Excimer-ProducedU. ! Fluorescencex 40
0-1 1 3 5 7 9
TIME (10-16 s)JA-8041-16
Figure 8. Temporal profile of XeF(X)v--0 in the 248-nm photodissociation ofXeF2 at 1.0 torr in the presence of 50 torr of Xe.
G--24

6 .0 1 1 1
4.0 -
0
2.0 -o °°0 a
o KrF
* ArF
0 I I
0 2 4 6
Xe (1018 molec cm- 3 )JA-8041-22
Figure 9. Rate of collision-induced dissociation of XeF(X) by Xe,derived from the rate of rise of XeF(X)v--O.
G-25

1.60
1.15
C 0.70
x
0.25
-0.20 I I I I !-1 1 3 5 7 9
TIME (10-6 s)RAM-7123-3
Figure 10. Temporal profile of XeF (X)v. -0 in ,he 193-nm photodissociation of
XeF 2 at 0.33 torr in the presence of 50 torr of Xe (upper curve) and at
0.50 torr in the presence of 25 torr of Xe (lower curve).
0--26

8
'l) Decay of v" =5o /oz"D Decay ofv = 4
L.Z 40< Decay of v" =3q:
0 Decay of v" =2LL
0>2 2
LU Formation of v" =00*
0 00 1 1 1 1 1 1 1I0 2 3 4 5
XeF2 (1016 molec cm-3 )RAM-7123-4
Figure 11. Fast decay rates of XeF(X)v'. 2-5 and vibrational relaxation rate intoXeF(X)v.o versus concentration of XeF2.
G-27

4
XeF 2 = 0.66 torr KrF Laser
E 2 v"=3
Cu
x.
x -2
-4 v I
-1 4 9 14 19 24
TIME (10"6 s)
RAM-71 23-5
Figure 12. Comparison of model calculations with observed XeF(X) v" =0o, 1, 2, 3populations following KrF laser photolysis of 0.66 torr of XeF2.
C-28

Appendix H
ANGULAR DEPENDENCE OF THE VIBRATIONAL RAMAN LINEWIDTHSFOR STIMULATED RAMAN SCATTERING IN H 2
International Laser Science Conference19-24 October 1986, Seattle, WA

Presented at: International Laser Science Conference, Seattle, WA,October 19-24, 1986, paper III-WEI0.
ANGULAR DEPENDENCE OF THE VIBRATIONAL RAMANLINEWIDTHS FOR STIMULATED RAMAN SCATTERING IN H2
G. C. Herring, Mark J. Dyer, and William K. BischelChemical Physics Laboratory, SRI International
Menlo Park, CA 94025
ABSTRACT
We have measured the angular and density dependence of the Dickenarrowed vibrational line shapes for stimulated Raman scattering inH2. Measurements were made on the Q(l) transition for angles of0-165 deg and for densities of 1-25 amagat. We have found an empiri-cal formula that agrees with the results of these linewidth measure-ments to within 5%. This empirical formula will be useful formodeling the Raman gain coefficient as a function of angle for Ramanbeam clean-up and aperture combining.
INTRODUCTION
Raman beam clean-up and aperture combining is currently a topicof intense research within the laser community. This techniqueimproves the spatial mode of coherent light sources by using stimu-lated Raman scattering in H2 to amplify a high quality stokes beam.Energy is simultaneously transferred from several high intensity,poor quality pump beams to the high quality Stokes seed beam bycrossing the pump beams at small angles to the stokes beam. Thus theangular dependence of the Raman gain needs to be well characterizedbefore this type of beam clean-up process can be accuratelymodeled. For pump and stokes beams that are linearly polarized inthe same directions, the angular dependence of the gain comes onlyfrom the angular dependence of the linewidth (the peak value of thesteady-state gain coefficient is inversely proportional to line-width). Previous experimental work reports linewidth measurementsfor only the forward and backward directions. 1 This work presentsexperimental results for the angular dependence of the vibrationalRaman linewidth in gas phase H2.
EXPERIMENTAL DETAILS
Using a standard quasi-cw stimulated Raman spectrometer, 2 wehave measured the linewidth of the Q(l) line for angles of 0-165..egrees and densities of 1-25 amagat. Both the cw probe (683 rum) andthe pulsed pump (532 nm) are single mode lasers, with the 10 nspulsed laser limiting the spectral resolution to about 100 MHz. Thislaser linewidth was determined from the excess linewidth notaccounted for by pressure or Doppler broadening in a copropagating
H-1

geometry, where the lineshape is well known, and from assuming thatthe laser line shape is Gaussian. For small angles (less than30 deg) and small densities (less than 10 amagat), this laser line-width was accounted for by fitting the data to Voigt line shapes.For large angles or large densities the 100 MHz width of the laser isnegligible. These data were fit to pure Lorentzian line shapes.
EMPIRICAL MODEL
The density dependence of these measured linewidths was comparedto an empirical model given by
- AA 1 + Bp (1)
n
[Pn + (LA~n]n
and to the diffusion model 3 given by
Am - A + Bp (2)P
where 6vD is the Doppler broadened linewidth, B is the densitybroadening coefficient, p is the density. The quantity A is given by
A - R 12kpks(1 - cos8) + 2 (3)if p S
where B is the crossing angle, D is the self-diffusion coefficient,and kp, ks, and kR are the pump, stokes (probe), and Raman shift wavenumbers respectively.
We find that Eq. 1, with n - 1.5, gives the best fit to our dataand predicts the linewidths to within 5% of our measurements for allangles and densities. At densities below 1 amagat, the differencesbetween the data and the model become larger. Because Eq. 1 isempirical, no physical significance should be attached to the valueof 1.5 for n. The experimental data and the empirical fit of Eq. 1for four different crossing angles is illustrated in Fig. 1.
Although useful for modeling purposes, the empirical Eq. 1 doeslittle to help the understanding of the physics of the collisionalcontribution to the line shape. However, line shape measurementswith uncertainties of less than 1% are necessary to compare with morephysically meaningful models such as the Galatry and related lineshapes. 4 We plan to make improved measurements (modifying our pulsedpump laser with a single mode seed laser) to make this comparison.
H-2

S I I I I I I I I
5000 - k Angle (deg) Symbol
-4000 30 -
604 165 0
_3000-"
12000X
-- - -,
00 5 10 15 20 25
DENSITY (amagat)
Figure 1. Comparison of the experimental data (symbols) and theempirical model (solid and dashed lines) of Eq. 1, withn - 1.5.
ACKNOWLEDGEMENT
This work was supported by the Defense Advanced Research Agencyunder Contract N0014-84-C-0256, through the Office of Naval Research.
REFERENCES
1. J. R. Murray and A. Javan, J. Mol. Spectrosc. 42, 1 (1972).2. P. Esherick and A. Owyoung, "High-Resolution Stimulated Raman
Spectroscopy," in Advances in Infared and Raman Spectroscopy,R.J.H. Clark and R. E. Hestor, eds. (Heydon, London, 1983),pp. 130-187.
3. W. K. Bischel and M. J. Dyer, Phys. Rev. A 33, 3113 (1986).4. P. L. Varghese and R. K. Hanson, Appl. Opt. 23, 2376 (1984).
H-3

C C
0) L U) 03 ---C 0 \J c_ -o
4-P (4- m cu C ar, 0 --
C4- 4-) c 4-) L u.o C *- cu 003 4- L
03 '-'- a) 0 0 (3-o u cu u a .C3'4- cu 0)C 0
-0 4- L r.4 V~-qc 03 :tJ U0C) ..P03 0 £ 4.)- C *~ 00. u Ca L a -£03 c w3 4.)J
C0 c a. 0- 0*-q L 13 L u. L
L 0 -0 03:Z U 0 -0C) C3 4-) CL c a) U)
F- U7 01. c E a 0 c 03 3
ZU 0 C c .r4 003ý 0D I 0 -P C3 4-~) 0- LC0 03 .0- [ -I r" L
Of C -0 4-) u. C) C z C3-P c.u0 U r-f '-' ) C '
:z.) L r--e E 03CU 03 U 0 £L a. 0 C -0L - *-f 0. C3 U-4 *D > 3Ur) E
C3 4-) -.C '- \i
0
4.)
0
H- 4

ftAP.4oh.9-+
cn
01 1 .00
/ Ow
.Pq.2 c I-
I-IU
LU 0
C Oav/WHMiavin A,4.)
.9-
0u 0) 0 L 41)
a -L L 0O 0 L0E 0 0 4)
OL Z 01co z
H1-5

C)4
00-
coo
0)
r-i
a0 -<wo'-40C
0 J
1VN9IS 3ALV3
H-(6

ow4 I il4
~CN4
AV
w
W-43Clp .m aP
.meLL
1*U)
C32:
u-f
0 C l ,I0
H-7f

Comparision Between Data and Empirical Fit
: I I I I I I I i, 00 " Angle (deg) Symbol
z 0t4000 30 0
60 A4 165 0:j3000T
u. 2000z
00 5 10 15 20 25
DENSITY (amagat)
H-,8
H1-8

00
.9-I Cl 4-) 0 cu4-) 4-) c
0- 01c0L L#- E r"
>L 01
S0-) 41 )
U E U) 01C3 _ .. 4-) L4)4-) L c
L :3 CU0 Lo U) 0- E 0U4-0 01 01£-E *-0 C4- L 4.)U) U _. 0 0 D 001 0m E C0O \J -0 - ' Ll 01£C 1 E D.
a) '-" U- ) C
WC L -C CA L
E 3:C r-c U) 0 I aU c 01 0 0 (.oE 01 C- -P 4-)U -0 0) U1 00 ~ _ -o .. :
-0 cl) 01 4-) C cLu>C _i U) 001 0N\ > - )"-U
O Ti > C L L01 C 1 *3.0
U11 0 u-i - 0.
H-9

Appendix I
VIBRATIONAL RAMAN CROSS SECTIONS OF THE FUNDAMENTAL ANDOVERTONE TRANSITIONS IN H 2, D2, AND N2

VIBRATIONAL RAMAN CROSS SECTIONSOF THE FUNDAMENTAL AND OVERTONE
TRANSITIONS IN H2, D2, and N2
G. C. Herring,t and William K. BischelttMolecular Physics Laboratory
SRI International, Menlo Park, CA 94025
and
Winifred M. HuoNASA Ames Research Center
Moffett Field, CA 94035
ABSTRACT
Theoretical and experimental results are presented for Raman scattering cross
sections of the vibrational fundamental overtone transitions in gas phase H2, D2, and N2 .
Cross sections for the first overtones of H2, D2, and N2 have been measured at 488 nm,
while cross sections for the fundamental and first two overtones of H2 and D2 have been
calculated as a function of wavelength from ab initio theory. For H2, the first overtone
experimental result of 5.1 ± 1.5 x 10⁻³³ cm2 sr-I, is in reasonable agreement with the
theoretical value of 4.0 x 10⁻³³. The measured value for N2 of 1.3 ± 0.5 x 10⁻³³ is to be
compared with the theoretical value of 0.64 x 10⁻³³ of Langhoff et al. The role of
nonadiabatic effects, arising from the breakdown of the Born-Oppenheimer approximation,
is discussed for the overtone transitions.
t Current Address: NASA Langley Research Center, Hampton, VA 23665-5225tt Current Address: Coherent, Inc. 3210 Porter Drive, Palo Alto, CA 94304
NP 89-046July 30, 1990
I-i

INTRODUCTION
In the vibrational Raman spectroscopy of diatomic gases, rigorous selection rules
governing the change of vibrational quantum numbers do not exist. However, most of the
past studies have been restricted to the 0, Q, and S branches of the fundamental
transition. 1"3 This limitation is mainly due to the fact that the overtone transitions are
orders of magnitude weaker, making quantitative measurements difficult. Although the
Raman overtone frequencies do not provide any new information about the vibrational
constants of diatomic molecules, they can furnish an independent check of the constants
derived from previous quadrupole experiments.4 More importantly, experimental overtone
cross sections can be used to verify or improve the approximations employed in the
calculation of Rarnan transition probabilities. Since overtone transitions are related to the
second and higher derivatives of the dynamic polarizability, they generally provide a more
stringent test of the quality of the calculation than the fundamental transition. Overtone
cross sections will also be useful for experiments 5 that require populating the higher lying
vibrational levels of molecules.
The first overtone (Av = 2) has been measured6 in solid H2, and theoretical work
for the first overtone of gas phase H2 has also been published, 7 but very little work has
been reported on overtones of neutral diatomic molecules in the gas phase. In this paper,
measurements of Raman scattering cross sections for the first vibrational overtone of H2,
D2, and N2 gases are reported. Theoretical calculations of the transition polarizabilities of
H2 and D2 based on a sum-over-states method, are also presented for transitions from the
ground state (v = 0-+ v' = 0,1,2,3) and the first vibration state (v = 1 -+ v' = 1,2,3,4).
These results are compared with the experiment for Av = 1,2. For N2, an overtone cross
section is determined from the dependence of theoretical static polarizabilities8 on the
internuclear separation. The present experimental results ae compared with Knippers et
al. 9 and Veirs, 10 who have also observed Raman overtones in diatomic gases. No
1-2

previous calculations of Raman overtones of H2 and N2 have been reported, even though
accurate calculations of the dynamic polarizabilityI 1-15 and Raman fundamental cross
sections 12 "15 have been reported for H2 . A number of theoretical calculations on N2 have
also appeared in the literature. Good agreements with experimental data are found in the
recent calculation of Langhoff et al.8 on the static polarizability and polarizability
derivatives of N2 .
1-3

EXPERIMENTAL DETAILS
The experimental apparatus used for the overtone measurements is similar to those
used routinely in spontaneous Raman spectroscopy.I An Ar ion laser provided from one to
five watts of linearly polarized light at wavelengths of 458 nm, 488 nm, or 515 nm. This
beam was focussed into a cell containing H2 at 295 K and 760 torr or into the room air for
the N2 experiments. In both cases, a 25-cm focal length lens was used to produce a beam
diameter of 50 gm at the focal plane. The Raman-scattered light was collected over a solid
angle of I steradian at right angles to both the propagation direction and the electric field
direction of the pump beam. This light was then directed through a polarization scrambler
and into a 0.75-m Spex 1402 double monochromator (ff7). Slit widths were set at 800
gtm, giving the monochromator a resolution of 5 A at visible wavelengths. The Raman
signal was detected with a RCA 31034A photomultiplier tube which was cooled to -300 C
and biased at 1300 volts. Output pulses from the photomultiplier tube were amplified by a
factor of 250 and a pulse height discriminator was set to reject pulses smaller than 200 my.
Under these conditions, the dark count was typically 75 counts/s, while the Raman
overtone signals were about 5 and 20 counts/s for N2 and H2 respectively. Time constants
were 2 s and 40 s for the fundamental and overtone scans, respectively. The combined
relative efficiency of the monochromator and photomultiplier tube was calibrated with an
Optronics 220C spectral standard which is traceable to the NBS.
Overtone cross sections were experimentally determined by measuring the ratio of
the overtone signal to the fundamental signal and using this ratio with the previously
measured fundamental cross sections. 2 The Raman signal ratio of the overtone to the
fundamental was measured by sequentially tuning the monochromator over these two
transitions and comparing the integrated areas of the two transitions. Corrections in all of
these ratios were made for changes in laser power, monochromator transmission and
dispersion, and photomultiplier tube sensitivity. In N2, all of the individual rotational
1-4

transitions of the Q branch are so closely spaced that only a single spectral line was
observed under the experimental conditions described above. Thus the nitrogen cross
section measured here is the integrated cross section over the entire Q branch. In H2 , the
rotational transitions were resolved in the overtone, but were not resolved in the
fundamental transition. Because of the long time constants used in the overtone scans,
only the Q(0) and Q(1) transitions were typically recorded, while the entire integrated Q
branch was recorded for the fundamental scans. Thus an additional correction (ratio of
Q(0) plus Q(I) to the integated Q branch) was made for the measured ratio in 112 to obtain
the total integrated Q branch ratio.
Results of the present measurements of the Raman overtone cross sections in H2
and N2 are shown in Table I, where the reported values are the average of five separate
measurements. Uncertainties for each individual measurement were estimated to be ± 20 %
and 40 % for H2 and N2 respectively. The uncertainties shown in Table I for this work are
one standard deviation of the average for the five different measurements. Previous
measurements of the fundamental cross sections and present theoretical results are also
shown in Table I.
Our current overtone measurements have varying degrees of agreement with two
previous overtone measurements. Our H2 result is about 30% larger than the result of
Veirs. However, this difference is well within the error bars of both experiments. In
contrast, our N2 and D2 results are a factor of 3 greater than the results of Knippers et al. 9
Since we have carefully calibrated the wavelength response of our Raman spectrometer,
and our results are consistent with those of Veirs, 10 we believe our determination of the
cross section is the most accurate.
An attempt to observe the second overtone (Av=3) in both H2 and N2 was made
using the 364 nm line of the Ar& ion laser. No signal was found in either case. This was

not surprising since calculations show that the signal exacted for a 2:1 signal-to-noise ratio
was 40 times smaller than the detection limit.
1-6

THEORETICAL CALCULATIONS
In the case of a linearly polarized pump beam, with the scattering angle 900 to both
the polarization vector and the direction of incidence (without polarization analyzer), the
Raman cross section for a Q(J) branch transition of a diatonic molecule in the Is state is
given by1
aavJ~v'J= (2xt) 4 (Vp - VR) 4 (21 + 1)
[(JJ0)2 2v7v( J ( )2 ",v J] (1)
where v and v' are the vibrational quantum numbers of the initial and final states, J is the
rotational quantum number, vp is the frequency (in cm- 1) of the incident beam and VR is the
Raman transition frequency. Also, avJv'J and l'vj.v'j are the isotropic and anisotropic
components of the transition polarizability. For v--v', they reduce to the standard definition
of the isotropic and anisotropic components of the polarizability of a molecule in the (vJ)
state. Since this paper deals with Q branch transition only, the simpler notation avv' and
"Y)'v' will be used and their J dependence will be implicitly assumed.The quantities avv' and Yvv' are related to the parallel and perpendicular components of thetransition polarizabilities, au and a,.
a = i a + 2a. ,2)avv' =3 1 ,vv' v-L ) (2)
a±, -. (3)
Yvv 1,vv' aIvv'(
1-7

Using the Kramers-Heisenberg formula, oa ,vv' can be expressed as
Svv' = < 'ov'J I All I iVivii >< 'ivjij I 9'ii I VovJi vi
I + (4)Ev(ji - Eov - Vp Eiviji - Eov + (
where lll denotes the parallel component of the dipole operator, i is the rovibronic
wavefunction of the molecule, o denotes the initial (=final) electronic state, and vs is the
frequency of the scattered beam. The index i sums over all electronic states, vi the
vibrational levels of i, and Ji its rotational quantum number. The summations over i and vi
include integration over the continuum portion of the electronic and vibrational manifold.
The summation over Ji, (Ji = J, J ± 1), has been carried out implicitly in the derivation of
the 3-j symbols in Eq. (1), with the assumption that the dipole matrix elements of the three
possible Ji are the same. Notice that Eq. (4) is applicable to a molecule without a
permanent dipole moment.
In Eq. (4,) nuclear motions are included explicitly in the summation. On the other
hand, in the Born-Oppenheimer approximation, the electronic polarizability is first
calculated in the fixed-nuclei approximation and then integrated over the initial and final
rovibronic states:
al (vp,R) = i i < 0o(r,R) I llgl I (Di (rR) >r < Oi (rR) I gli I 4 o (rR) >r
X( + ]..(5)Ei (R) - Eo (R) - vp E+ (R) - Eo (R) + vs)
1-8

and
a11I, vv' = <Xv (R) I cq, (Vp R) I Xv(R)>. (6)
In Eq. (5), r and R denote the electronic and nuclear coordinates, and the subscript r
attached to the bracket denotes integration over electronic coordinates alone. Also, 0 is the
fixed-nuclei electronic wavefunction and X is the vibrational wavefunction of the electronic
state o. The difference between Born-Oppenheimer and nonadiabatic treatments have been
discussed in detail by Bishop and Cheung.II In their calculation on H2, they recast the ro-
vibronic problem into a secular equation problem. Their results are considered intermediate
between the fixed-nuclei and nonadiabatic treatments. The calculations of Rychlewski, 12
Huo and Jaffe, 14 Ford and Browne, 15 and Langhoff et al,8 are all based on the Born-
Oppenheimer approximation, even though different methods are used in the treatment of the
electronic part of the problem.
In the present calculation on H2, a method which is a combination of Eq. (4) and
(5) was employed. 16 From a previous sum-over-state calculation, 14 it was found that
approximately 75% of aoo and 90% of aol come from the contributions of BlI+ and
Cl'lu states, the two lowest excited singlet states of H2. Thus, in this study, the
nonadiabatic effects from these two states were accounted for by carrying out explicit
summation over their ro-vibrational levels, as given in Eq. (4). The contributions from the
remainder of the electronic states were calculated using the Born-Oppenheimer
approximation, as in Eq. (5). In this manner, a major portion of the nonadiabatic effects
has been included. The electronic wavefunctions used are configuration-interaction (CI)
wavefunctions constructed to satisfy the Dalgarno-Epstein condition,17 which enables us to
replace the infinite sum over electronic states by a finite sum. The details of the electronic
calculations have been described previously. 14 The vibrational wavefunctions were the
numerical solutions of the one-dimensional Schrbdinger equation of vibrational motion,
1-9

obtained using the Numerov-Cooley technique. The potential functions for the X, B, and
C state vibrations were taken from the work of Kolos and Wolniewciz. 18 "20
A summary of the H2 Rayleigh and Raman cross sections from the present
calculation is given in Tables 11 and MII. Average polarizabilities and polarizability
anisotropies are also given for each transition. Table II contains results for transitions
originiating in v = 0, while Table III contains results for transitions originating in v = 1.
The numbers given in Table 1I are used in Fig. 1 to show the relative wavelength
dependence of the square of the polarizabilities (proportional to the scattering cross section
-- for the different scattering processes in H2. In addition to illustrating the difference in
the wavelength dependence of the different processes, Fig. 1 also shows the preresonance
enhancement for the fundamental with the 2pa 1 + state at 90,000 cm-1. All cross
sections given in Tables II and HI are averaged over the thermal distribution of initial
rotational levels. One of the interesting results of these calculations is that the polarizability
anisotropy for the first overtone crosses zero between 250 and 300 nm. Thus the cross
sections for the S branch of the v = O-42 transition will vanish for pump lasers in this
wavelength region.
Theoretical cross sections at 488 nm are compared to experimental cross sections in
Table I. For H2 , the theoretical overtone values of Table I are taken directly from Table II.
The corresponding quantity for N2, calculated from the theoretical static polarizability of
Langhoff et al. using Eq. (6), is also presented. An RKR potential is used for the N2
vibration.2 1 For comparison purposes, previous calculations of the fundamental cross
sections are also listed. Since Rychlewski, and Ford and Browne, did not include 488 nm
in their calculation of H2 fundamental, the tabulated cross sections are obtained by spline
fitting the frequency dependence of their published ao0 and 701.
I-10

DISCUSSION
It is illustrative to compare the experimental cross section of the fundamental
transition with theory first. Overall, good agreement between theory and experiment is
obtained for both molecules. In particular, the three calculations on H2 using the adiabatic
approximation are in excellent agreement with each other. Among the three, the
wavefunction employed by Rychlewski is of the highest quality. The nonadiabatic result,
from an unpublished calculation of Huo,16 is . 10% smaller, and is in somewhat closer
agreement with experiment. The electronic wavefunctions used in the nonadiabatic
calculation are determined in a manner similar to those used in Ref. 14. The difference
between the results in Ref. 14 and 16 is partially due to the diffMrence in the basis sets, and
partially due to nonadiabatic effects. The calculation of Cheung et. al. 13 also includes
nonadiabatic effects. Their cross section is not included in Table I because their a0m is not
tabulated in Ref. 13. There is no reported nonadiabatic calculations in the literature for N2.
However, N2 is a heavier molecule. It is possible that, at least for the fundamental, the
nonadiabatic effect in N2 is smaller than in H2. Indeed the theoretical cross section of the
N2 fundamental agrees well with experiment. It should be noted that the N2 cross section
is deduced from a static field calculation. However, aoi and '0o of N2 are weakly
dependent on vp at 488 nm, and only a small error is expected to result from the neglect of
frequency dependence in these two quantities.
For the overtone transitions, the calculated cross section of H2 is approximately
20% smaller than the experimental value, but lies inside the experimental error limit. For
N2, the theoretical value is also smaller than our experiment by a factor of two. There are
two possible sources for the discrepancies: the quality of the electronic wavefunctions
I-. .1

used, and incomplete treatment of nonadiabatic effects. In the simple harmonic oscillator
approximation, avv,' and Yvv, for the first overtone transition are expressed in terms of the
second derivatives of the dynamic polarizabilities a(vp, R) and ylVp, R). Thus, a
calculation of these quantitites generally requires wavefunctions of higher quality than the
fundamental transition. Even though exact vibrational wavefunctions are used in our
calculation, the stringent demand of high-quality wavefunctions probably still holds.
Certainly it is one possible source of the observed deviation.
Nonadiabatic effects is another possible source of error in the theoretical treatment
of the N2 overtone cross section. To understand the importance of vibronic coupling in
overtone transitions, it is worthwhile to analyze the two nonadiabatic calculations of H2.
For the fundamental, 91% of "0l and 112% of 101 comes from the contributions of B and
C states. (For ^016, the contribution from the remainder of the electronic states are opposite
in sign from the B and C contribution, resulting in a final value smaller than the B and C
contribution alone.) It is reasonable to assume that most of the nonadiabatic effects are
accounted for if Eq. (4) is used for those two states. On the other hand, only 72% of aO2
and 34% of Y0 come from the B and C contribution. Thus, nonadiabatic treatment of
those two states alone is probably insufficient. It is even more illustrative to compare the
contributions from the bound and continuum vibrational levels of those two states. For
d0ol the contribution from the continuum portion of B state vibrational manifold is 4.1% of
the bound level contribution, and it is 14.5% for the C state. In the case of cay2, the ratios
are 77.4% and 74.2%, respectively. The heavy participation of the B and C continuum in
the overtone is a reflection of the vastly different spatial extent of the v=O and v=2
vibrational wavefunctions of the ground state, much more so than the case between v=O
and 1. This finding strongly suggests that contributions from other electronic states should
also be calculated using Eq. (4) instead of Eq. (5).
1-12

For N2, nonadiabatic studies have not been reported in the literature. However, a
comparison of the adiabatic cross section with experiment indicates that nonadiabatic
effects, assumed to be unimportant for the fundamental, may well play a more important
role in the overtone transition. Another possible source of error, resulting from the use of
static-field a0j2 and 702, is estimated to be 1-2%, based on the corresponding frequency
dependence found in H2.
Finally, we can compare the theoretical results for the v=1 polarizability aL1 to
measurements22,23 of the change in the index of refraction between the ground and first
vibrational state at 693 nm. The index of refraction for the v=1 level is particularly
important for calculating phase perturbations (and hence the beam quality) that occur in
large scale Raman amplifiers.24 From Tables II and III, we obtain the value for Aax = al I-
aoo = 7.08 x 10⁻²⁶ cm 3. The theory predicts that the index of refraction of the v = 1
vibrational level is 8.6% larger than that of the v = 0 level. This can be compared with the
previously measured value23 of Az = 1.53 ± 0.22 x 10⁻²⁵ cm3 (19% larger than the v = 0
level) and a semi-empirical calculation25 of 1.40 x 10⁻²⁵ cm 3. The discrepancy is larger by
more than the estimated error of < 5% in the present theoretical calculation. Since the
present theory predicts (ZOO of v = 0 to within the error bars of the index of refraction data16
(<1%), or01 for the v=0-41 transition to within the error bars of Raman scattering data,2
(<5%), and o:02 for the v=0-2 transition to within the experimental error bar (20%), it is
hard to rationalize such a large discrepancy between the experiment and our theory. We
therefore conclude that additional experimental and theoretical research is required to
resolve the differences.
1-13

10. K. Veirs, "A Raman Spectroscopic Investigation of Molecular Hydrogen," Materials
and Research Division, Lawrence Berkeley Laboratory, University of California,
Report LBL 20565, UC 34A, December 1985.
11. D. M. Bishop and L. M. Cheung, J. Chem. Phys. 72, 5125 (1980).
12. J. Rychlewski, J. Chem. Phys. 78, 7252 (1983).
13. L. M. Cheung, D. M. Bishop, D. L. Drapcho, and G. M. Rosenblatt, Chem. Phys.
Letters 80, 445 (1981).
14. W. M. Huo and R. L. Jaffe, Phys. Rev. Letters, 47, 30 (1981).
15. A. L. Ford and J. C. Browne, Phys. Rev. A7, 418 (1973).
16. W. M. Huo, unpublished, 1985.
17. A. Dalgarno and S. T. Epstein, J. Chem. Phys. 50, 2837 (1969).
18. W. Kolos and L. Wolniewicz, J. Chem. Phys. 43, 2429 (1965).
19. W. Kolos and L. Wolniewicz, J. Chem. Phys. 45, 509 (1966).
20. W. Kolos and L. Wolniewicz, J. Chem. Phys. 48, 3672 (1968).
21. A. Lofthus and P. H. Krupenie, J. Phys. and Chem. Refereine Data 6, 113 (1977);
2429 (1965).
22. U. S. Butylkin, G. V. Venkin, L. L. Kulyuk, D. I. Maleev, V. P. Protasov, and Yu.
G. Khronopulo, ZhETF Pis. Red. 19, 474 (1974) [JETP Lett. 19, 253 (1974)].
1-14

23. M. I. Baklushina, B. Ya. Zel'dovich, N. A. Mel'nikov, N. F. Pilipetskii, Yu. P.
Raizer, A. N. Sudarkin, and V. V. Shkunov, Zh. Eksp. Teor. Fiz.73, 831 (1977)
[Soy. Phys. JETP 46, 436 (1977)].
24. A. Flusberg and D. Korff, "Effect of Beam Quality on Transient Refractive-Index
Changes in Stimulated Raman Scattering," Conference on Lasers and Electro-Optics,
San Francisco (9-13 June 1986).
25. B. Wilhelmi and E. Heunamn, Zh. Prikl. Spektrosk. 19, 3 (1973).
1-15

CONCLUSION
In summary, experimental and theoretical results are presented for the fundamental
and overtone Raman cross sections in H2, D2 , and N2. The H2 fundamental measurement
is in better agreement with the partially nonadiabatic calculation than with the completely
adiabatic calculation. In addition, the H2 overtone measurement is in satisfactory
agreement with the partial nonadiabatic calculation. For N2, although the fundamental
adiabatic result is in good agreement with experiment, the overtone adiabatic result is a
factor of 2 smaller than the experiment. These results suggest that the partially nonadiabatic
treatment describes the Raman process in gas phase diatomic molecules better than a purely
adiabatic treatment. To further test this conclusion, purely nonadiabatic calculations and
more accurate experimental measurements would both be helpful.
1-16

ACKNOWLEDGMENT
G.C.H. and W.K.B acknowledge support from the Defense Advanced Research
Projects Agency under Contract NOOO14-8884-C-0256 through the Office of Naval
Research. W.M.H. gratefully acknowledges the use of unpublished data from S. Langhoff
in the calculation of the N2 overtone polarizability.
1-17

REFERENCES
1. H. W. Schr6tter and H. W. Klkkner, in Raman et al.Spectroscopy of Gases and
Liquids, edited by A. Weber (Springer, et al.Berlin, 1979).
2. W. K. Bischel and G. Black, in AIP Conference Proceedings, No. et al. 100,
Subseries on Optical Science and Engineering, No. 3, Excimer Lasers 1983, edited
by C. K. Rhodes, H. Esser, and H. Pummer (AlP, New York, 1983).
3. D. G. Fouche and C. K. Chang, Appl. Phys. Lett. 20, 256 (1972).
4. U. Fink, T. A. Wiggens, and D. H. Rank, J. Mol. Spectry. 18, 384 (1965).
5. T. Kreutz, J. Gelfand, and R. B. Miles, "Overtone Stimulated Raman Pumping of
H2 from v=0 to v=2, and Subsequent Time Domain Photoacoustic Detection of
Vibrational Relaxation," Ohio State University Molecular Spectroscopy Symposium,
Columbus, OH, June, 1985.
6. W. C. Prior and E J. Ellin, Can. J. Phys. 50, 1471 (1972); N. H. Rich and
W.R.C. Prior, Raman News Letter 36, (1971).
7. A. 1. Sherstyuk and N. S. Yakovleva, Opt. Spectrosc. 45, 23 (1978)
8. S. R. Langhoff, C. W. Bauschlicher, Jr., and D. P. Chong, J. Chem. Phys.78,
5287 (1983).
9. W. Knippers, K. Van Helvoort and S. Stolte, Chem. Phys. Lett. 121, 279 (1985).
1-18

cc
Go0
_ C M
CC
x
16. +1z (o
L ~ VI 0ý
0 030 0
Oilg CM co
Cd 04
C*+1 +4
I.-W m~OO%
v-ID
Qd0
C~~~C NI~+11.2~V o~C C0C Nc; 6
UII" t Z
L 0n
C4 C
ME Lo.0 0 C
0 00C)+ - mr
CC
03 a
1-19

n W)00C
Uo- .-
tg c"" .4 -4 C4
Nili
('e4
-Ap.
00 0 % hQII O
00
ei -~ A cn 0 00a Is 4 i V:0
IIn
~bO~ e~E1-20

.- C.) 000
eq C4 N0 Q 0 0 0C~
-~% C4 0000009
%n0 c oc 0 %0 00
000
r- ~ 0 00 a%
000 %Ce"
is i i C4 i vi OZ v*
ItnC40 04 C4 V4 c 0% C4 C4 00ci l
Alc: cn Ch (b - - -
e~0-
64
ts~ 0%O0%1% 21

FIGURE CAPTIONS
Figure 1. Relative frequency dependence of the square of the average polarizabilities,
I_(v)/Oc(v = 0)12, for Rayleigh scattering with Av = 0, (solid), fundamental
Raman with Av = 1 (medium dash), 1st overtone Raman with Av = 2 (short
dash), and 2nd overtone Raman Av = 3 (long dash).
1-22

2.2
1.8
AV 0
> 1.4 " -
1 .0 ... ....
0.6 I
0 10,000 20,000 30,000 40,000 50,000
EXCITATION FREQUENCY (cm- 1)CM-33011 -A
1-23

Appendix J
OPTICAL STARK SHIFT SPECTROSCOPY:MEASUREMENT OF THE V = I POLARIZABILITY OF H2
Phys. Rev. A44, 3138 (1991)

PHYSICAL REVIEW A VOLUME 44, NUMBER 5 1 SEPTEMBER 1991
Optical Stark shift spectroscopy: Measurement of the v =1 polarizability in H 2
Mark J. Dyer and William K. Bischel*Molecular Physics Laboratory, SRI International, Menlo Park, California 94025
(Received 12 November 19901
We report a quantitative determination of the v I polarizability in H, by measuring the optical Starkshift and splitting of the Q(0) and Q(1) vibrational Raman transitions. For the Q(1) transition, theM,= ± 1,0 components are resolved, thereby allowing a determination of the polarizability anisotropyfor the v = I state. The measured optical Stark shift of the Q (0) transition at 1060 nm is 23MHz GW- -cm 2, giving a polarizability difference between the v = I and 0 states of Aa = 0.49±0.03 a.u.,in good agreement with ab initio theory.
INTRODUCTION of-2 discrepancy between current measurements [8] andab initio theory [6]. An accurate measurement of the op-
The optical Stark effect will cause the rotational- tical Stark effect for the vibrational Raman transition invibrational energy levels in small molecules to shift and H2 would resolve this controversy.split due to the presence of a high-intensity nonresonant The goal of our experiments was to measure the opticallaser field. This effect has recently been observed for both Stark effect for the Q(O) and Q(1) vibrational Raman tran-vibrational [1] and rotational [2] Raman transitions in sitions in H 2 and compare the measurements to ab initiohigh-resolution Raman gain experiments using an opti- theory. The energy levels and splittings in an optical fieldcally applied Stark field. Because shifting of the energy for the Q(I) transition are illustrated in Fig. 1, where thelevels effectively broadens the observed linewidths, it is magnitude of the shifts in units of MHz/(GW cm-2) areone of the important mechanisms that limit the spectral calculated from the data presented in this paper and Ref.resolution of coherent Raman experiments. Hence, the [6]. Without the high-intensity nonresonant optical field,optical Stark effect has recently been included in the the zero-pressure Raman frequency shift for the Q(1)theory [3] of saturation processes in coherent anti-Stokes transition is 4155.247±0.007 cm-' as measured byRaman spectroscopy (CARS). In other experiments, the Fourier-transform Raman spectroscopy [9]. When thebroadening and shift of the anti-Stokes radiation generat- nonresonant field is applied, there is a shift of the v=Oed by multiwave Raman mixing has been interpreted to and 1 vibrational levels from their zero field values, andbe due to the optical Stark effect [4,5]. While all these ex-peei'izents have tried to interpret their results based onorder-of-magnitude estimates of the optical Stark effect,there have been no quantitative experiments that have zeo Fil Raman WHIh Nonremonentused the nonresonant optical Stark effect to derive funda- Optical FIemental constants for the excited vibrational states of V-1small molecules. J,1
We report an experiment to use optical Stark spectros- , Sh i - 262 MHz GWI cn2copy for quantitative measurement of the polarizability I\M -1
and the polarizability anisotropy of the v= 1 vibrationalstate in H2. Hydrogen is a particularly interesting firstmolecule to study for a number of reasons. First, there
are accurate ab initio calculations [6] of polarizabilities in (R = 4H2 that can be used to make a quantitative comparison Pohezd IIbetween theory and experiment.
Second, accurate knowledge of the optical Stark shiftin H2 is of great practical importance in the design of Ra-
H 2 is the gas most often used for stimulated Raman fre- uJ1
is quite important to know the polarizability of the v-- I 4
in H 2 since the change in the polarizability between the 3 17 1v=O and the v= 1 vibrational states (Aa) will determinethe phase perturbations (and hence the beam quality) that 0
occur across the spatial aperture of a large scale Raman Secnc Fi X. 106 nm
amplifier [7]. The exact value of Aa has been an issue for FIG. 1. Schematic illustrating level shifts of the Q(1) brancha number of years due to the fact that there is a factor- in H2 under the influence of a strong electric field.
44 3138 @ 1991 The American Physical Society
J-1

44 OPTICAL STARK SHIFT SPECTROSCOPY: MEASUREMENT... 3139
the Mj degeneracy of the J= 1 rotational level is split. millijoules of transform-limited light at 1.06 Am in a 20-(The J=0 levels will only show a shift since they are non- ns FWHM (full width at half maximum) duration, whichdegenerate.) As illustrated in Fig. 1, the magnitude of when doubled to 532 nm yields a 14-ns pulse with a band-shift in the vibrational levels (which is proportional to the width of 22 MHz. The dye laser was operated at 683 nmaverage polarizability; see theory section) is approximate- to probe both the Q(O) and Q( () transitions in H2 with aly six times larger than the magnitude of the M, splitting few hundred milliwatts and a time-averaged bandwidth of(which is proportional to the polarizability anisotropy). roughly 8 MHz.We can indirectly observe these energy-level shifts by As shown in Fig. 2, both pump and probe beams werecarefully measuring the shift of the Raman transition fre- spatially filtered immediately after their sources, expand-quency (illustrated by the arrows in Fig. 1) with and ed and collimated with telescopes, then combined on awithout the nonresonant field. The shift of the Raman 683-nm dichroic mirror before being focused together byfrequency is due to the difference in the optical Stark a 40-cm focal length lens into a cell containing hydrogenshifts of the v=0 and 1 levels, and hence the Raman fre- gas. The cell was constructed from stainless steel andquency would not change if the polarizabilities for these designed for high pressure. Both ends of the cylindricallevels were the same (i.e., if Aa =0). cell were sealed by fused silica windows with triple "V"
In our experiments we use linear polarization for both antireflection coatings at the three wavelengths usedthe Raman pump-probe field and the nonresonant field. here. The spot diameters at the input lens of the RamanTherefore we have a selection rule of AM= 0 for the Ra- cell were 1.6 and 2.1 cm for pump and probe, respective-man transitions. As illustrated in Fig. 1, we expect to ob- ly, producing FWHM beam waists, which were scannedserve two Raman transitions for Mj=0 and ±1. The in profile by a 1 -Am pinhole, of 25 /sm in the center of thesplitting between the Mj =-0 and ± 1 Raman transitions is cell. Assuming a shift coefficient of 25 MHz GW-' cm 2 ,only -9 MHz/GWcm- 2 ) making these splittings ex- this relatively tight focusing of the pump-probe beamstremely difficult to observe experimentally. meant that the energy of the 532-nm pump had to be held
below 120/pJ for a 14-ns FWHM pulsewidth (an intensityEXPERIMENT of 1 GW/cm2 ) in order to avoid more than a 5% shift or
broadening contribution on a 500-MHz Raman linewidthThe experimental apparatus is illustrated in Fig. 2 and by the 532-nm pump. Intensities at or below this level,
consisted of a quasi-cw Raman gain spectrometer [10] us- however, provided adequate Raman gain signals at theing a Molectron MY-34 Nd:YAG (where YAG hydrogen densities investigated, and the small Rayleighrepresents yttrium aluminum garnet) laser, modified and ranges of the pump and probe allowed selection of a tightinjection-locked to a Lightwave Electronics S-100 injec- confocal parameter for the ir beam that would push thetion seeding system [11] as the pulsed pump laser source, intensity of the applied optical field beyond 100and an argon-ion pumped Coherent CR699-29 Ring Dye GW/cm2 , well above the intensity expected to resolve theLaser as the continuous tunable narrow-band probe laser. shifted from unshifted line shapes.The Nd:YAG laser typically produces several hundred The high-intensity nonresonant optical field was sup
1064ps Pow EOC PL aSinglePMode--o-•- 1 n -F - -
(1 [p 532 nm rnv (5 pps)PQ Spatial Felterr• ~Vac
Ring Dye LIs 683 V2
SPol te*
m 1 Spatial Filters, C tn Meterl • U Telescopes___ +fl, HR 532H nm
!.! 4f 10654 nm HR. HRJ
G -a-jL_ *To Power Meter AOM Low-Pass/
FIG. 2. Experimental layout for the measurement of the optical Stark effect in H2 .
.1-2

3140 MARK J. DYER AND WILLIAM K. BISCHEL 44
plied by the residual ir fundamental of the Nd:YAG the waists of the pump and probe beams; the opticallaser. The beam was first passed through a Laser Metrics paths between laser source and cell center for the 1064-Electro-Optic Chopper (EOC), then into a vacuum spatial and 532-nm beams were made equal so that the peaks offilter, and collimated for delivery to the Raman cell. The both would overlap in time as well. Figure 3(a) shows thechopper served dual purposes as a switch and a polarizer spatial profiles and Fig. 3(b) shows the temporal overlapfor the ir beam. The spatial filter under vacuum cleaned achieved in the experiment. Upon exiting the cell, the irup the transverse mode quality of the beam and beam was picked off by an identical ir dichroic reflectorsignificantly reduced power fluctuations of the ir due to and sent into a power meter.air particulates and pinhole breakdown. This ultimately After passage through the Raman cell, the 532-nmproved vital in reducing broadening effects on the shifted pump was separated from the probe by a dichroic, mea-line shape associated with ir field variations. The col- sured and integrated by a pyroelectric energy detectorlimated ir beam was then passed through a 50-cm lens and boxcar averager, and recorded by computer for nor-and counterpropagated against the pump-probe beams malization. The transmitted probe was down-collimated,after being directed into the Raman cell by an ir high filtered to remove residual pump light, mildly focusedreflector (HR) transparent to the pump-probe combina- through an acousto-optic modulator (AOM) operating intion. The waist of the beam, measured to be 75,um in di- first order, and sent into an EG&G FND 100 photodiodeameter at FWHM, was carefully positioned to overlap having a 1-ns rise-time response. The resulting gain sig-
nal detected by the photodiode exhibited the form of the14-ns pump pulse shape superimposed atop the 2 0 0-Ms-wide chopped CW probe background. This signal was
100 enhanced through a 5-500-MHz bandpass, 20-dB gaineProbe.. Avantek amplifier, where the CW probe offset was
filtered out, and sent into two SRS boxcar integratorsS50 ~operating with 2-ns gate widths and toggled at 5 Hz, half
- the trigger rate of the pump laser.0" An example of the Raman gain signal is given in Fig.ZZI f 3(b). The single-shot trace was acquired as the ring laser
0 Prmswept in frequency over the transition. The result of theoptically induced Stark shift of the transition away from
- the probe frequency is manifested here as a dip in the<t -50 gain signal at peak ir intensity. All boxcar channels were
triggered off the Q-switched Nd:YAG laser oscillatorcavity emission in order to reduce boxcar gate jitter on
100the signals to below 0.2 ns. The averaged output of the-10 -6 -2 2 6 10 integrators were then recorded by computer. This entire
PROPAGATION DISTANCE (mm) arrangement made possible the controlled application of(a) the ir field to the Raman interactio,, region on altering
pulses of the pump laser as the frequency of the probelaser was tuned through the vibrational Raman transi-
tion, thus facilitating collection of shifted and unshifted
"Z spectral data on the same scan.
,-J
z
__0 LINE-SHAPE ANALYSIS
J 2o n Analysis of the data was performed on a DEC VAX11/750 using a routine designed to remove the Gaussian
O laser linewidth contribution and then generate a fit to theProbe experimental data. The line shapes used to fit the unshift-
Raman Gain Peak Shift ed data were the theoretically predicted LorentzianI I I II I I I profiles, and the optical Stark-shifted data should, under
0 20 40 60 so 100 conditions of a homogeneous, steady-state field, remainTIME (ns) Lorentzian with a shift in frequency being the only dis-
(b) tinction from the optical field-free data. The ir Stark field
FIG. 3. Spatial and temporal overlap for optical Stark-shift applied in our experiment, however, had Gaussian tem-measurements. (a) Ile 2 intensity data points for spatial cross poral and spatial mode distributions, so its slightly variedsections of the ir and probe. The theoretical curves for the lie 2 temporal and spatial behavior over the regions sampledintensity plots for the ir probe and pump (dashed) beams are in time and space contributed to a broadening of the idealshown. Digitized oscilloscope traces (b) depict the time evolu- line shape. As a rule, our fits were started using the un-tion of the ir, pump, and the Raman gain signal. shifted linewidth and allowing the peak position to be the
J-3

44 OPTICAL STARK SHIFT SPECTROSCOPY: MEASUREMENT... 3141
only adjustable parameter; then width and height param- 1.0
eters were freed to obtain the best fit to the side of theLorentzian furthest from the unshifted line position. -- 2600 MHz
This method of analysis was based on the fact that the MHZ--peak position is theoretically predicted to shift linearly 0.8 -- 1850with peak field intensity, and the part of the Lorentzianshifted the furtherst corresponds to gain in the regionsubjected to the most intense part of the ir field; hence, if 'there are intensity gradients away from the peak intrud- 0.6 -ing upon the Raman gain region, the line shape willbroaden in a direction favoring the lower intensities or -smaller shifts. As an alternative, assuming nothing aboutthe temporal and spatial distributions of the ir field, the _04
data were also fit in entirety by floating all parameters, CL
and although the differences in the fitting techniques were , MJ-±1 MJ.0observable, shift results agreed to within the experimental Shitederror of the measurements. 0.2 /
RESULTS
Typical data are given in Fig. 4 at a density of 1.81amagat of H2 and a laser intensity of nearly 100 0GW/cm2. The observed shifts were density independent 0 1250 2500 3750 s500
for both transitions in the absence of four-wave mixing FREQUENCY (MHz)
for counterpropagating ir and pump-probe geometries.Polarizations of the pump and probe were identical for all FIG. 5. Unshifted and shifted line shapes from Ra0an gainmeasurements, and the ir polarization was initially fixed on the Q(1) branch of H2 at 1.81 amagat and 300 K.parallel to the pump-probe beams. Measurements involv-ing different combinations of ir polarization and propaga- of the optical Stark shift versus ir field intensity for thetion direction were also made but the data will not be o h pia tr hf essi il nest o htodreentedion whispapere alsogmades butnd5so the da wQ(0) and Q(0) transitions, along with a linear least-squarespresented in this paper. Figures 4 and 5 show the raw fit to each of the Ms levels undergoing the shift. For thedata and fit as a function of frequency for an ir laser n- Q(O) transition (Fig. 6), the line shifts scaled with ir fieldtensity of 100 GW/cm2 and Fig. 6 graphs the dependence intensity and the data yielded a shift coefficient of 23
MHz GW-1 cm 2. Shifting of the Q (1) transition (Fig. 5)
2.0 was measured to be 27 MHz GW-I cm 2 for M, =0 and19 MHz GW-1cm 2 for Ms--±l. The M, splittings of arovibrational level have been resolved, thus allowing the
S 235o M~z determination of the polarization anisotropy of the excit-ed state.
1.6
2500
S1.2 •(0 - ,. /
0( eT 1) ---
ui--/-/ :
0 )wr"/•I' •Q1.j0 27MHzGW' cn
2
0.4 u. 625 - // nO(o).M~: 3zGem
0 187 I
00 24 48 72 96 120
0 25
0 1250 2500 3750 5000 PEAK W INTENSITY (OW/cm2)
FREQUENCY (MHZ)
FIG. 6. Plot of the optical Stark shifts of Q(O) and Q(I) in H2FIG. 4. Raman gain of the unshifted and shifted Q(0) branch vs peak ir intensity, and linear least-squares fits to individual Mj
of H2 at 1.81 amagat and 300 K. levels.j-4

3142 MARK J. DYER AND WILLIAM K. BISCHEL 44
TABLE I. Wavelength dependence of the optical Stark shift for the Q(O) and Q(1) vibrational Ramantransitions in H2. I atomic unit (a.u.)= 1.481 845X 10-2 cm 3.
Optical Stark shiftWavelength Polarizabilities (a.u.) AVs (MHz GW- cm2 )
X Q(1) Q(l)(nm) ao 'yo all yr Aa Ay Q(0) MJ=0 Mj=±I
S5.469 2.013 5.923 2.473 0.454 0.460 21 27 18600 5.584 2.085 6.062 2.576 0.478 0.491 22 29 19500 5.637 2.118 6.125 2.623 0.488 0.505 23 29 20400 5.736 2.181 6.249 2.716 0.513 0.525 24 31 21300 5.965 2.331 6.529 2.936 0.564 0.605 27 34 23250 6.218 2.501 6.845 3.193 0.627 0.692 29 38 25200 6.757 2.881 7.536 3.789 0.780 0.910 37 48 31
Uncertainties in the final fits were relatively small corn- where the agreement is surprisingly good for an experi-pared to the experimental uncertainty, which we conser- ment where the laser intensity had to be measured.vatively estimate to be less than 10%, arising primarily Analysis of the Q(1) shifts gives Aa=0.462±0.02 andfrom beam overlap and peak intensity measurement er- Ay=0.450±0.02. No significant differences for Aa ofrors. J= 1 and 0 were found. These results indicate that the
v= 1 excited-state polarizabilities can be accurately calcu-lated for the simplest diatomic molecule (H2), and pro-
THEORY AND DISCUSSION vide a favorable basis to judge the accuracy of the calcu-lations of the v= 1 polarizability at other wavelengths as
The optical Stark shift of a molecular rotational- well as that of higher-order polarizabilities [6]. We canvibrational level with quantum numbers v,JM can be also compare our results to those of a previous experi-calculated from the following expression (2,12]: inent [13] that reported a shift of approximately -0.02
12 ) cm-1 for the Q(1) transition under a field of about 30,GW/cm 2, which gives a shift coefficient of -20
MHzGW-t cm2 .where a is the isotropic part of the polarizability The difference in the index of refraction between v= 1[au = 4(a11 +2a,)] and y is the anisotropic part of the po- and 0 (proportional only to Aa) is also given in Table IIlarizability (-=an--a.), Eo is the ir laser field, and to be 8.4%. This is compared with the only other experi-
2 J(J +I)-3M2 ments [8] that have measured this quantity to be 19%.)3 (2+3)(2--I) (2) We conclude that the previous experiments published a
An that was too large by over a factor of 2. The practical
Using the definition for the intensity 1E0 12=88rI/c,where I is the peak ir laser intensity, we then calculatethe optical Stark shift Avs for a Q branch transition to bethe difference in shifts between the upper and lower 170
states,
Avs(MHz)=46.81 J[Aa+C(JM)Ar] (3) E'JGm 2oIt a 1.60 Theory
where we have introduced the notation Aa = aII - a0 o to - -- v -1denote the difference between the v =1 and the v =0 pX- - Present Expernent
larizabilities (similarly for Ay). In Eq. (3), Avs is in units 150-
of MHz, the polarizabilities are in atomic units (1a.u.=l.481845XlO 25 cm 3), and I is in units of ,o:GW/cm2. The calculated optical Stark shifts as a func- • 1.40 =Pus Epiments
tion of wavelength are listed in Table I, where the owavelength-dependent polarizabilities are taken from aRef. (6]. We see from Table I that the optical Stark shift - 3 1around X =1060 un ranges from 19 to 29 1.30 30 700 300 1100100 30 S0 70 90 10
MHz GW- 1 cm 2 for the different M, components with an WAVELENGTH (nm)
average value of 23 MHz.The ab initio theoretical values from Table I are com- FIG. 7. Index of refraction of H 2 (v=0) and (v= 1) vs wave-
pared to the experimental measurements in Table 11, length. Experimental data for v=O taken from Ref. [14].
3-5

44 OPTICAL STARK SHIFT SPECTROSCOPY: MEASUREMENT... 3143
TABLE II. Index of refraction measurement of H2 (v= 1) at X = 1060 nm using the Stark effect. Er-ror bars are one standard deviation for the fit illustrated in Fig. 6.
Av (MHz/GWcm- 2) W(n -1)av (%)
Transition Expt. Theory Expt. Theory Ref. [8]
Q(0) 23.0±1.2 22Q(1) Ms=0 27.0±0.7 28 8.4±0.3 8.4 19Q(l) M,=±l 19.0±0.6 19
consequence of this measurement is that the beam unifor- v= 1 excited state in H 2 from a measurement of the non-mity of the pump laser required for large scale Raman resonant optical Stark shift for the Q(0) and Q(l) Ramanamplifiers [7] can be significantly relaxed from previously transitions. In these experiments the M, splitting of theused values, thus reducing the overall cost of the device. Q(1) line has been observed, thus allowing the determina-
Finally, we illustrate in Fig. 7 the comparison between tion of the polarizability anisotropy. The results are intheory [6] and experiment for the absolute index of re- good agreement with ab initio theory, thus givingfraction for the v=0 state (where the data have been tak- confidence in the ability of theory to predict higher-orderen from Ref. [14]) and the v =-1 state (data from the polarizabilities in H 2.present experiment). Once again we see that the ground-state polarizabilities are well known and can be used todetermine the absolute polarizability of the v= 1 excited ACKNOWLEDGMENTstate. We acknowledge support for this work from the De-
CONCLUSION fense Advanced Research Projects Agency under Con-We report a quantitative measurement of the average tract No. NOOO 14-8884-C-0256 through the Office of Na-
polarizability and the polarizability anisotropy of the val Research.
"Present address: Coherent Inc., 3210 Porter Drive, Palo Baklushina, B. Ya. Zel'dovich, N. A. Mel'nikov, N. F. Pi-Alto, CA 94304. lipetskii, Yu. P. Raizer, A. N. Sudarkin, and V. V.
[1] L. A. Rahn, R. L. Farrow, M. L. Koszykowski, and P. L. Shkunov, Zh. Eksp. Teor. Fiz. 73, 831 (1977) [Sov.Mattern, Phys. Rev. Lett. 45, 620 (1980). Phys.-JETP 46, 436 (1977)]; B. Wilhelmi and E. von
[2] R. L. Farrow and L. A. Rahn, Phys. Rev. Lett. 48, 395 Heumann, Zh. Prikl. Spectrosk. 19,550 (1973).(1982). [9] D. A. Jennings, A. Weber, and J. W. Brault, Appl. Opt.
[3] M. Pealat, M. Lefebvre, J.-P, E. Taran, and P. L. Kelley, 25,284 (1986).Phys. Rev. A 38, 1948 (1988). [10] P. Esherick and A. Owyoung, High Resolution Stimulated
[4] William K. Bischel, Douglas J. Bamford, and Mark J. Raman Spectroscopy, in Advances in Infrared and RamanDyer, Proc. SPIE 912, 191 (1988). Spectroscopy, edited by R. J. H. Clark and R. E. Hestor
[5] Wallace L. Glab and Jan P. Hessler, Appl. Opt. 27, 5123 (Heydon and Son, Ltd., London, 1983).(1988). [11] Mark J. Dyer, William K. Bischel, and David G. Scerbak,
[6] Winifred M. Huo, G. C. Herring, and William K. Bischel Proc. SPIE 912, 32 (1988).(unpublished). [12) W. H. Flygare, Molecular Structure and Dynamics
[7] A. Flusberg and D. Korff, J. Opt. Soc. Am. B 3, 1338 (Prentice-Hall, Englewood Cliffs, NJ, 1978) p. 193.(1986). [13] R. Farrow and L. Rahn, in Raman Spectroscopy: Linear
[8] V.S. Butylkin, G. V. Venkin, L. L. Kulyuk, D. I. Maleev, and Nonlinear (Wiley, London, 1982), pp. 159 and 160.V. P. Protasov, and Yu. G. Khronopulo, Pis'ma Zh. Eksp. [14] G.A. Victor and A. Dalgarno, J. Chem. Phys. 50, 2535Teor. Fiz. 7, 474 (1974) [JETP Lett. 19, 253 (1974)]; M. I. (1969).
j-6

Appendix K
TEMPERATURE AND DENSITY DEPENDENCE OF THE LINEWIDTHS ANDLINE SHIFTS OF THE ROTATIONAL RAMAN LINES IN N2 AND H2
Phys. Rev. A34, 1944 (1986)

PHYSICAL REVIEW A VOLUME 34, NUMBER 3 SEPTEMBER 1986
Temperature and density dependence of the linewidths and line shiftsof the rotational Raman lines in N 2 and H 2
G. C. Herring, Mark J. Dyer, and William K. BischelChemical Physics Laboratory, SRI International, Menlo Park, California 94025
(Received 10 February 1986)
The temperature and density dependence of the rotational Raman linewidths and line shifts forthe diatomic molecules N, and H2 has been measured using stimulated Raman gain spectroscopy.Room-temperature results for the density-broadening coefficients, B, in N2 are compared with ab in-itio calculations, while the low-temperature (80 and 195 K) results are the first to be reported, to ourknowledge. Values of y in the relation, B cc T, were determined from fits to the data for self-broadening in N, yielding 0.25 < -y < 0.39. Foreign-gas (02) broadening coefficients for the N2 tran-sitions were also measured and found to be 10-15 % smaller than the self-broadening coefficients.Our linewidth and line-shift results for H2 are in general agreement with previous measurements.
I. INTRODUCTION perature dependence of N2 is compared to that found instudies of CO and CO2. Finally the present H 2 results are
Modeling the rotational Raman gain in N2 is of interest compared with previous measurements.since stimulated Raman scattering will alter the modequality of a high-intensity beam propagating through air.I II. EXPERIMENTAL PROCEDUREAccurate knowledge of the Raman linewidths is neces-sary2 for any useful model because the steady-state Ra- A. Apparatusman gain is inversely proportional to the linewidth. Re-sults of previous studies 3- 7 of the room-temperature rota- An overview of the experimental setup is shown in Fig.tional Raman linewidths in N2 typically differ by 30%, 1. This quasi-cw stimulated Raman spectrometer is simi-while results at other temperatures have not been report- lar to that developed by Esherick and Owyoungs and con-ed. The main purpose of this work is to measure the tem- sists of a cw probe laser, a tunable, pulsed pump laser, aperature dependence of the linewidths and line shifts for pair of gas (sample and reference) cells, and fast photo-the rotational Raman transitions (S branch) in N2. diodes to detect the induced Raman gain on the probe
This work differs from previous measurements of rota- beams.tional Raman linewidths 3- 7 in three aspects. First, we The probe laser is a Kr+-ion laser, operating at 568 nmhave measured the temperature dependence of the line and forced into single-mode operation with the insertionbroadening over the range 80-300 K. Previous work in of a temperature-stabilized etalon into the cavity. ThisN2 has been only for room temperature. Second, the den- laser has a time-averaged linewidth less than 30 MHz.sities, used in this work (0.01-2.0 amagat) are 2 orders of The probe beam *'as split into two equal intensity beamsmagnitude lower than those (1.0-100 amagat) used in so that Raman signals could be simultaneously obtainedprevious measurements. Complications due to overlap- from two separate gas samples. After passing throughping of adjacent lines are eliminatW by working at lower their respective sample cells, both of the cw probe beamsdensities where the Raman lines are typically separated by were chopped at 10 Hz with a mechanical chopper (not100 linewidths. Finally, all previous measurements have shown in Fig. 1). This resulted in 170-p--. square-waveused spontaneous Raman 'scattering, whereas we have pulses that were incident on the photodi K es. Choppingused stimulated Raman scattering, which has a frequency of the probe increases the saturation intensity for the pho-resolution several orders of magnitude higher than its todiodes. The average power of the probe beams was 150spontaneous counterpart. mW in both the sample and reference cells.
This paper reports experimental results for line-' The pump laser was a tunable, single-mode (I-MHzbroadening and line-shift coefficients for Stokes rotational linewidth) cw dye laser that was pulse amplified using aRaman transitions in N2 and H2. Results are presented Quanta-Ray PDA-1. The cw dye laser input to thefor the even-J transitions, S(2) through S(16), at tempera- PDA-1 was typically 400 mW. The PDA-I was pumpedtures of 80, 195, and 295 K in N2 and for S(0) and S(l) at with the 532-nm output (130 mJ per pulse) from atemperatures of 80 and 295 K in H2. The foreign-gas (02) frequency-doubled YAG laser (where YAG denotes yttri-broadening and shifts of the four strongest N2 transitions urn aluminum garnet). At 565 nm, the tunable output ofhave also been measured at 195 and 295 K. The room- the PDA-I consisted of 2-mJ, 10-nsec [full width at halftemperature broadening coefficients in N2 are compared maximum (FWHM)] pulses at 10 Hz. The linewidth ofwith ab initio calculations, whereas the low-temperature the pump laser was 100 MHz, about a factor of 2 largerN2 self-broadening and the 02 foreign-gas results are the than the Fourier transform for a 10-nsec pulse. Peakfirst to be reported to our knowledge. The present tern- pump intensities at the focal planes were estimated to be 5
K-1 ) ® 1986 The American Physical Society

34 TEMPERATURE AND DENSITY DEPENDENCE OF THE ... 1945
GW/cm2 in the sample cell and 70% of that in the refer- .. _p__ence ca]]. Cel
The pump probe beams were mode-matched and then 1/2 X Plate-were focused and crossed in the gas cells using 40-cm fo- Polarzer Reterence
cal length lenses. The crossing angle was 1.00 in both of Combination Ce
the cells. A series of diaphraxns placed around the probe Pulsedbeams was used to eliminate scattered pump light. Both Dye Photodiooes
probe beams were monitored with reversc-biased photo- X1 X10 Ge00
diodes that had rise times of less than 1.0 nsec, and were Gaottic
terminated with 50-11 resistors. The total probe power in- t
cident on the photodiodes during the 170-jisec probe-laser Tunable 10 Hz w
pulses was 10 mW. Capacitors (300 pF) were used to c Pulsed t,
block the 170-Assec pulses and to pass the 10-nsec Raman Laser Lase ,msignals. These signals were amplified by a factor of 100and then averaged with gated integrators. Output time FIG. 1. Schematic of experimental apparatus for quasi-cwconstants for the integrators and total scan dimes were stimulated Raman spectroscopy.usually 0.5 sec and 4 min, respectively. Occasionally, forweak transitions, time constants and scan times were in- Doppler broadening (5 MHz), and hence the Dicke nar-
creased to 2.5 sec and 10 rain, respectively. After the rowing, is negligible. This is also a good approximationpump beam exited the reference cell, it was also moni- for the H 2 transitions, since the instrumental width typi-tored with a third photodiode. This signal was used to cally accounts for one-half the total linewidth and uncer-normalize the two Raman signals for slow-pump power tainties in the instrumental linewidth will mask the smallvariations during the scans. difference between the Voigt and Galatry profiles. Thus
The sample cell was constructed by attaching a pair of we have used Voigt profiles to fit our data using the pro-3.0-cm-diam Brewster window extensions to a drilled-out cedure described here.10 cm3 cube of aluminum. One face of the aluminum Since the laser linewidth was comparable to the low-cube is in contact with a second reservoir that can be density Raman linewidth, it was important to account forfilled with either liquid N 2 or an acetone dry-ice bath. this instrumental width in the data analysis. AlthoughThe cooled sample cell was insulated with a vacuum, and the pump-laser frequency profile was not directly mea-the temperature was monitored with a thermocouple that sured, it was indirectly determined by scanning the laserwas imbedded in the aluminum cube. The reference gas over a narrow Raman line [e.g., S(0) in H 2 at 5 Torr].cell was kept at room temperature and a pressure of 10 This transition has negligible (1 MHz) collisional broaden-Tort for N2 scans and 200 Torr for most of the H 2 scans. ing compared to 100 MHz of Doppler broadening. The
The temperature dependence of the linewidths and line proffle for this transition was found to fit extremely wellshifts was measured by taking measurements at three tern- to a pure Gaussian. Since the convolution of two Gauss-peratures: 80, 195, and 295 K. At each temperature the ians results in another Gaussian, we concluded that theline shape was recorded for several densities over the pump-laser profile could be approximated as a Gaussian.range 0.01-2.0 amagat. For the low-temperature runs, Fitting Voigt profiles to low-density, narrow N 2 line pro-there was a time period ranging from a few to 15 minutes files with known Doppler and Lorentzian contributionsbetween scans with different densities, so that any gas confirmed this conclusion. The probe-laser linewidth wasadded between scans always had sufficient time to come assumed to be negligible when convolved with the pumpto thermal equilibrium with the cell. For each set of runs linewidth; thus all the data presented here were analyzedat constant temperature, the density was randomlycnanged rather than constantly adding or eliminating gas 1.00from the sample cell for each succeeding run.
The pressure in the experimental cells was measured us- >ing a 10000-Torr MKS Baratron gauge, and the tempera- Wa.7
ture was measured using a Chromel-Alumel thermocou- u_pled gauge referenced to 273 K. The density for both N2 _and H 2 was calculated using the perfect gas law since the -density calculated using the second virial coefficient 9 devi-ates from this calculation by less than 1% at the densities (_>
and temperatures used in these experiments. 0.25
B. Data analysis - .0
All of the experimental line shapes were fit to either 0 2400 4800 720 9600 12000
Voigt or Lorentzian profiles rather than the more accu- RELATIVE LASER FREQUENCY DIFFERENCE 1MHz)
rate Galatry profile, which accounts for Dicke narrow- FIG. 2. Example of S(10) line shape in N2 at 295 K and 10ing. Using the Voigt profile is a good approximation for Torr (narrower profile) and at 195 K and 400 Torr (wider pro-the N2 rotational transitions studied here since the file). Individual dots are data and the solid lines are Voigt fits.
rK-2

1946 G. C. HERRING, MARK J. DYER, AND WILLIAM K. BISCHEL 34
6000 Z ý TABLE I. Temperature dependence of the self-broadening
"X ,coefficients for the rotational Raman lines of N,.:= " 295 K- 2 95K, i B (MHz/amagat)
"X 4500' 195 K S (J) 295 K 195 K 80 K
S0 4730±700 3140±470z I"M 3000 - 80 K 2 4160±400 3560±350 2700±270z0z 4 3580±60 3230±320 2490±250
I 6 3560+30 3070±30 2520±40S1500- - 8 3270±60 2860±30 2120±60
10 3060±60 2660±30 1940±40"12 2870±50 2340±260 1690±_100
0 14 2660±270 2150±2150 0.4 0.8 1.2 1.6 2.0 16 1840±185
DENSITY (amagat)
FIG. 3. S10) linewidths in N, at temperatures of 80 K (0), typically a few percent and further iterations were not195 K (O), and 295 K (AL). Solid lines are linear least-squares necessary.fits to the data. For the H2 transitions studied, experimental constraints
did not allow the density in the cell to be larger than 3assuming a Gaussian profile for the instrumental width. amagat. Therefore the approximate density-broadening
The fitting procedure used to determine the Lorentzian coefficient could not be determined from the high-densityportion of the line shapes was different for the N 2 and H 2 data. Hence, the above procedure was not applicable. In-data. We first describe the fitting procedure for the N 2 stead, all of the H 2 line shapes were fitted to Voigt pro-transition. For high densities in N 2, Doppler broadening files with freely adjustable Lorentzian and Gaussian com-(5 MHz) and the laser linewidth (100 MHz) can be ponents.neglected. This fact is confirmed with the following re-sult: Fitting Voigt profiles with freely varying Lorentzian III. RESULTS
and Gaussian parameters to our higher density (greater A. Line broadening in N2
than 0.1 amagat) data gave negligible Gaussian com- An example of the S(10) Raman profile in N 2 is shownponents. Thus sample cell line shapes for high densities in Fig. 2. The narrower profile was taken at 10 Torr andwere first fitted to pure Lorentzians to get a first approxi- 295 K and the wider profile was taken at 400 Torr andmation to the Lorentzian width. The low-density reter- 195 K. Individual dots represent the data, and the solidence cell data were then fitted to Voigt line shapes with a line represents the fit for a Voigt line shape, which isfixed Lorentzian (determined from the high-density fits) dominated by its Lorentzian component for the 400-Torrand variable Gaussian components. This Gaussian com- data. A slight asymmetry is observable in the data of Fig.ponent, representing the pump-laser profile for that par- 2 and was characteristic of most of the N 2 data obtained.ticular scan, was then used in a final Voigt fit to the sam- An asymmetry of this magnitude will not have an appre-ple cell profile. Any fluctuations in the pump-laser ciable effect on the linewidth determinations, but couldlinewidth from scan to scan were accounted for with this produce significant systematic errors in the line-shiftprocedure. These Gaussian components were typically determinations -because the line shifts are so small. Thiswithin ±20 MHz of an approximate average value of 100 asymmetry is discussed later in Sec. III C.MHz. The change in Lorentzian linewidth determined For densities larger than 0.004 amagat (-3 Torr at 298from the first Lorentzian fit and the final Voigt fit was K), the rotational Raman lines of N 2 are collision
broadened giving a Lorentzian line-shape function.4500 Hence, the linewidth will be a linear function of density.
We have therefore taken the Lorentzian component result-•- ing from the data-fitting procedure described in Sec. IIBL- 3750U- 0 TABLE II. Comparison of different measurements of the
U room-temperature self-broadening in N2.
zo 0 B (MHz/amagat)zi 0o .- S(J) Present work Ref. 3 Ref. 6 Ref. 7
02250 2 4160±400 3370c0 4 3580±60 3050 2590 3280±300
0 6 3570±30 3050
010 I I 1 I I I 8 3270±60 2660 2300 3150±3000 4 8 12 16 10 3070±60 2590
LOWER ROTATIONAL QUANTUM NUMBER (J) 12 2870±50 2400 1980 2820±30014 2660± 270 2205
FIG. 4. J dependence of the N2 rotational Raman broadening 16 2080coefficients for 80 (0), 195 (0), and 295 K (L).
K-3

34 TEMPERATURE AND DENSITY DEPENDENCE OF THE... 1947
4500 400
A Gaussian
0LorentziarrS3750 ,-00ao
;6 3000 - \ 200
0<- '2-- F
c 2250- 10016 This WorkI
0 Reference3 A A 3
1500 II I I I fI 0 I0 4 8 12 16 0 0.5 1.0 1.5 2.0 2.5 3.0
LOWER ROTATIONAL QUANTUM NUMBER (JA DENSITY (arnagat}
FIG. 5. Comparison of theoretical calculations with experi- FIG. 6. Lorentzian (0) and Gaussian (A) components frommental data for collisional broadening of the rotational Raman Voigt fits to data as a function of density for S(1) in H1. Solidlines in N2 at room temperature. The calculations are from Ref. line is a linear one-parameter fit to Eq. (1).I I (long dash), Ref. 12 (short dash), and Ref. 13 (solid line).The experimental data are from Ref. 3 (0) and this work (A). compared with our measurements in Fig. 5, where the
room-temperature broadening coefficients are shown as aand determined the density-broadening coefficients B for function of rotational quantum number J. We also showeach temperature studied by fitting the linewidths to a the experimental values of Jammu et al.3 for comparison.straight line. The data and the linear fit (solid line) for It should be noted that Srivastava and Zaidi12 have usedthe S(10) transition are given in Fig. 3 for temperatures of an adjustable parameter to obtain their fit to the data of298, 195, and 80 K. Individual points indicate the data, Jammu et a3.,3 whereas the calculations of Grey and Vanand the solid lines represent the least-squares fits. The Kranendonk1 1 and Robert and Bonamyi3 do not use anystatistical uncertainties (one standard deviation) for the adjustable parameters. Figure 5 shows the ab initio calcu-broadening coefficients determined from the fits in Fig. 3 lations of Robert and Bonamy13 to be in the best agree-are 1-2 %. Systematic errors, due to uncertainty in the ment with our measurements.dye-laser scan width, are about 1% or less. To compare the pure rotational linewidths to the pure
Table I summarizes all of the N2 self-broadening coeffi- vibrational linewidths, we first note that the present rota-cients measured in this study. These values are graphical- tional broadening coefficients are 10--15 % larger thanly illustrated in Fig. 4 as a function of rotational quantum previously measured14-'•6 Q-branch vibrational broaden-number. Odd-J transitions in N2 were not studied. For ing coefficients for low densities (0.1 amagat). BecauseS(4) through S(12), the specified uncertainties are one negligible Doppler broadening of the rotational transitionsstandard deviation for the least-squares fit. For S(O), S(2), means that Dicke narrowing is also negligible, the rota-S(14), and S(16), data were obtained at only one density, tional line shapes are accurately described by Voigt pro-and the uncertainties shown for these transitions represent files, while the vibrational transitions (with 20 times morethe error in the linewidth determination of a single-line Doppler broadening) require Galatry profiles for the mostprofile. accurate fits. Also, because the vibrational transitions (0.3
Earlier room-temperature measurements by different -1) are more closely spaced than the rotational (8authors '6 , 7 have shown considerable disagreement (30%). cm -) transitions, coherent line-mixing effects must be in-Table II compares these earlier results with our present re- cluded to precisely describe the vibrational line shapes at
sults. It can be seen that the three earlier studies show densities of 1 amagat or larger.
significant differences, while our current measurement is
consistent with that of Ref. 7. The results of the three Previous to this work, only atomic foreign-gas (He andAr) broadening of the N2 rotational transitions had beeti
previous studies that are shown in Table II were obtained A boeninga f the N als tansu iationha bfoat densities where adjacent lines appreciably overlapped investigated. We have also measured diatomic foreign
with- one another, whereas the present results were ob- gas (0,) broadening coefficients at 195 and 295 K for the
tained at densities where there was no overlapping. We' four strongest N2 transitions. Our 02 results in Table III
postulate that the differences in the experimental resultsof the previous studies given in Table II are due to sys- TABLE III. Temperature dependence of the foreign-gas (0.)tematic errors arising from the overlapping of adjacent broadening coefficients of N, rotational Raman lines.lines. B (MHz/amagat)
Theoretical calculations of the collision-broadened Ra- S(J) 295 K 195 Kman linewidth have been perfomed by Grey and Van 6 2970±130 2690±120Kranendonk," Srivastava and Zaidi,12 and Robert and 8 2770±80 2600±100
Bonamy.13 The difference in these three approaches is in 10 2750±50 2410±100
the treatment of the short-range intermolecular inter- 12 2450±70 1980±100actions. The results of these different approaches are
K-4

1948 G. C. HERRING, MARK J. DYER, AND WILLIAM K. BISCHEL 34
TABLE IV. H 2 rotational Raman parameters for an ortho:para ratio of 3:1.
T VR AVD Do& A Pc(K) S(J) (cm - ) (MHz) (cm2 amagat sec- 1) (MHz amagat) (amagat)
80 0 354 48 0.871 1.37 0.0951 587 80 0.493 2.10 0.088
295 0 354 92 1.19 1.87 0.0681 587 153 1.42 6.15 0.134
"3Reference 18.
show that the foreign-gas broadening by 02 is typically where vR is in MHz, T is the temperature in K, and m is85-90 % of the self-broadening at both temperatures. the mass in amu. For densities larger than p,, the lineThus the foreign-gas broadening by 02 is approximately shape is Lorentzian and the widths can be effectively30% larger than the foreign-gas broadening by the atomic modeled using Eq. (1).gases. 3 For example, the experimental data set for the S(1)
transition at 298 K is given in Fig. 6. From the Voigt fit,
B. Line broadening in H 2 we determine both the Lorentzian and Gaussian contribu-tions to the experimental linewidth. Since the Raman line
The Raman linewidth for H 2 has a much more complex shape is Lorentzian for all densities shown in Fig. 6, thedensity dependence than that for N 2. This results mainly Gaussian contribution is due to the spectral width of thefrom the fact that the H2 density-broadening coefficient is pulsed dye laser. The Lorentzian and Gaussian contribu-approximately a factor of 30 smaller than the N 2 broaden- tions to the linewidth are plotted in Fig. 6, where we seeing coefficient, and thus Dicke17 or collisional narrowing that the Gaussian contribution is approximately constantof the Raman linewidth can be observed"' 19 in the low- while the Lorentzian contribution varies approximatelydensity regime if the resolution is high enough. A sum- linear in density.mary of the relevant collisional processes that contribute Unfortunately, the 100-MHz resolution of our currentto the linewidth at various densities is given in Ref. 18. laser system does not allow the Dicke narrowing of the H 2
For densities above a certain cutoff density (Pc defined rotational Raman linewidth to be resolved with any pre-below), the Raman line-shape function is Lorentzian with cision. We have therefore chosen a fitting procedure thata FWHM linewidth Av that can be expressed as uses Do determined from our previous study's to calculate
Av=A/p+Bp, (1) A from Eq. (2). The Lorentzian component of the experi-mental linewidth for densities larger than p, is then fitted
where A (MHz amagat) is a coefficient proportional to to Eq. (1) with one free parameter B. The parametersthe self-diffusion coefficient Do (cm2 amagat sec-'). For used in this fitting procedure are given in Table IV.forward scattering,"8 A is equal to The density-broadening coefficients B determined using
A=4irv 2 Do (2) this procedure are given in Table V, where the uncertain-ties shown are one standard deviation for the one-
where vR is the Raman transition frequency in cm parameter linear least-squares fit. This fit is illustrated byThis model is known as the diffusion model of the Ra- the solid line in Fig. 6 for the S(O) transition. The max-
man linewidth and it diverges as the density approaches imum correction to the linewidth due to including the col-zero. There is a cutoff density, Pc, at which this model lisional narrowing term in Eq. (1) is on the order ofpredicts a linewidth that is 10% larger than that predicted 5-10%.by the "hard collision" line-shape theory.'" We have pre- We have also included in Table V data from the previ-viously determined that ous work of Van Den Hout et al.20 and Cooper, May, and
Gupta.2' There are small discrepancies with the results ofPc=3.33A/AvD, (3) Refs. 20 and 21. Some of these differences could be due
where AvD(MHz) is the FWHM Doppler width of the Ra- to small errors in our estimate of A for these rotationalman transition given by (forward scattering) transitions. We emphasize that the N 2 results of Sec.
HI A are free of this problem since Dicke narrowing isAvD =7.15X 10-'vR(T/m) 1 /2, .(4) negligible.
TABLE V. Self-broadening coefficients for the rotational Raman lines of H2.
B (MHz/amagatl295 K 80 K
S(J) This work Ref. 20 Ref. 21 This work Ref. 20
0 77±2 84±2 84±2 67±2 63±11 114±5 104±2 105±4 110±3 99±1
K-5

34 TEMPERATURE AND DENSITY DEPENDENCE OF THE... 19AQ
C. Line shifts in N2 and H 2 30.0
In all of the above cases for which density-broadeningmeasurements were reported, we have also made density -Z 22.5
line-shift measurements. In all cases the line shifts were _ _only a few percent of the linewidth, and hence any asym- [ C
metries in the line shapes need to be carefully analyzed. 150.o
The asymmetry in Fig. 2 is typical of that observed in C
our data for the higher-density N2 data. The lower- cn
density N2 data contained an asymmetry that occurred • 7.5
only further out in the wing of the spectral profiles. --About 80% of the total number of line profiles at all den-sities and temperatures exhibited this small asymmetry, 0 I I I I Iwhere the data were slightly larger than the symmetric fit 0 0.5 1.0 1.5 2.0 2.5
on the high-frequency side of the line. Roughly 20% of DENSITY (amapt)
the line profiles were symmetric and only rarely did the FIG. 7. Example of data for line-shift determination for S(l)asymmetry appear such that the data were smaller than in H2 at 295 K. The solid line is the least-squares fit.the fit on the high-frequency side. It was determined thatthis asymmetry was not due to the saturation of the detec- tween our results and those of Ref. 21 is consistent withtion system by either the probe beam or the Raman signal. the combined uncertainties for the two experiments.By scanning the dye laser backwards, it was determined It should be noted that the density shift for the rota-that the asymmetry always remains such that the data are tional Raman line in H2 is substantially different fromlarger than the fit on the high-frequency side of the line, that observed for the vibrational Raman lines.'8 For ex-where the high-frequency side corresponds to a larger Ra- ample, at 80 K, the shift of the Q(1) vibrational transitionman shift. For densities above 0.5 amagat and for the is 13 times larger than the S(1) rotational Raman line.pump-laser intensities used here, this asymmetry is not This difference results from the perturbation of the vibra-consistent with the measured magnitudes of Stark effects tional frequency of the H2 molecule during an elastic col-in N2.
22 At this time we are unable to determine the lision, an effect not present for the rotational transition.cause of these asymmetries.
In N2, both the self-density shifts and the 02 foreign- IV. DISCUSSIONgas density shifts were found to lie in the range 50-150MHz/amagat for the transitions and temperatures dis- A simple qualitative understanding of this temperaturecussed above. There was no uniform dependence with ei- dependence for the N 2 rotational Raman broadening datather temperature or quantum number J. More important- given in Table I can be obtained from a consideration ofly, there were inconsistencies observed in both the data ac- Anderson's impact theory of the collisional broadening. 3
quired during the course of a single day and in the data The linewidth can be expressed ascollected from day to day. These inconsistencies have Av---n~v())n(v)( ,(v)) (6)forced us to conclude that the line-shift measurements inN2 are substantially disturbed by the asymmetric line where n is the molecular number density (cm- 3), v is theshapes. The data can, however, be used to establish an relative velocity of the collision partners, a is theupper limit to the magnitude of the line shifts. For all collisional-broadening cross section, and the angulartransitions and temperatures indicated for N 2 in Tables I brackets denote an average over the velocity distributionand III, the density line shifts are less than 150 of the gas. As can be seen from Eq. (6), the temperatureMHz/amagat. Future elimination of the asymmetry dependence of the density-broadening coefficient is impli-would enable us to detect line shifts as small as 10 cit in the velocity dependence of the collisional cross sec.MHz/amagat with our current experimental apparatus. tion. For example, if we assume a "hard-sphere" model
The densiýv shifts observed in H2, unlike those in N 2, for the cross section (velocity independent), the density-were free -. the inconsistencies mentioned above. Data broadening coefficient (Av/n) measured in our experi-for S(1) in H 2 at 295 K are illustrated in Fig. 7, where the ment would be proportional to T70 '.density shift is defined as The broadening cross section is composed of contribu-
tions from several different types of collisions. Both elas-6V=VR(p)-VR(0), (5) tic phase-perturbing collisions, and rotationally inelastic
where vR (p) is the Raman transition frequency at the den-sity p. Hence a negative shift results in a smaller Raman TABLE VI. Temperature dependence of the density linefrequency. Density shifts were plotted as a function of shifts for H2 rotational Raman lines.density difference between the sample and reference cells Bv=vR(p)-vR(0) (MHz/amagat)rather than density because data were collected for refer- 295 K 80 Kence cell pressures of 50, 100, and 200 Torr. The tern- S(J) This work Ref. 21 This work Ref. 20perature is 295 K for the data of Fig. 7. A summary of 0 6.5±3 3.1±1.5 -22.3±0.6 -22.3our H2 density-shift results is given in Table VI, along 1 5.9±1 4.0±1.5 -23.0±0.6 -17.8with the results from Refs. 20 and 21. The agreement be-
K-6

1950 G. C. HERRING, MARK J. DYER, AND WILLIAM K. BISCHEL 34
collisions contribute to the linewidth. However, there are TABLE VII. Fit parameters for temperature dependence ofseveral cases where the contribution from elastic collisions density self-broadening coefficients in N,.is small. For example, the linewidth for isotropic vibra-tional Q-branch Raman scattering have no contribution BM atfrom elastic collisions 24 if collisions perturb the ground S() (MHz amagar-') (MHz amagat K1
and final vibrational level the same amount. This appears 2 4160 0.33±0.02 6.8__0.4to be a good approximation for all cases except for hydro- 4 3580 0.28±0.01 5.1=0.7gen.18 6 3560 0.26±0.04 4.8±0.1
Rotational Raman linewidths, on the other hand, have 8 3270 0.33±0.004 5.4±0.7contributions from phase-perturbing elastic collisions. 10 3060 0.35±0.002 5.2tO.6This is the primary reason why rotational Raman transi- 12 2870 0.39±0.03 5.4±0.1tions usually have larger linewidths than vibrational Ra-man transitions. However, for the case of N,, CO, and fact that a much larger temperature range needs to be in-CO.,, it has been calculated't that elastic collisions contri-bu,,it nmehasbeen 15%culatof thatelasticrs section. T rnt vestigated to accurately determine this small temperaturebute no more than 15% of the cross section. The present denec.N2 rotational linewidth measurements are 15% larger dependence.than the previous N2 vibrational mentsre , 14-16 in However, the scaling given in Eq. (9) may not be valid
good agreement with the conclusion that elastic collisions over a wide temperature range. By theoretically examin-account for 15% of the rotational linewidths. Therefore, ing temperature dependence of the rotational Ramanin most cases, the primary problem is to calculate the linewidth over a wide range, Pack"- proposes a quadraticvelocity dependence of the cross section for rotationally temperature scaling law for density-broadening coeffi-
inelastic collisions. cients that can be written as
The calculation of the collisional cross section has been B =B 0 +Co(T-295)+D 0 (T-295)2 (10)the subject of considerable research. A good review of thevarious approaches to this calculation for Raman transi- where B0 is the broadening coefficient at 298 K [same astions has been given by Srivastava and Zaidi.25 One ap- in Eq. (9)], and Co and Do are fitting coefficients. Weproach to this calculation is to expand the long-range part have previously used this temperature scaling formula inof the intermolecular potential in a multipole expan- modeling Raman linewidths in H2.
8 The data fromsion,' 1.21.21 and then calculate the contribution to the Table I have been fitted to Eq. (10) assuming DO =0, andcross section of each term in this expansion. Using this the results are also given in Table VII. We find that thisapproach, Gray and Van Kranendonk" have shown that expression is just as useful as Eq. (9) in modeling thefor molecules such as N2, CO, and C0 2, the most impor- dependence of the density-broadening coefficient over thetant terms in this expansion for self-broadening are the limited temperature range investigated in our experiment.quadrupole-quadrapole (QQ) potential and the dispersion Both Eqs. (9) and (10) can be used to predict B to betterpotential. than 3% over the range of 80-300 K. Recent studies
It can be shown23 in general that the velocity depen- show that the temperature dependence for vibrational N2dence of these contributions to the cross section scales as line shape is accurately described by a modified exponen-
( 2fAMi)) , tial lap scaling law27 or a polynomial inverse energy-gaplaw. Thus, although Eqs. (9) and (10) are useful for
where n is the exponent of the radial dependence of the' predicting low-temperature rotational Raman linewidthslong-range part of the potential in the form V(r)--r-". for N2, additional data (more data points covering a largerFor the QQ potential, n = 5, while for the dispersion po- temperature region) are necessary to unambiguously deter-tential n-=6. Substituting Eq. (7) into Eq. (6) and mine the temperature dependence.remembering that v o TO-5 , we find that the density- There are few molecular systems for which the rota-broadening coefficient should scale with temperature as tional Raman linewidths have been determined as a func-
tion of temperature, and no other studies in N2. However,(8) there have been extensive studies of the temperature
dependence of absorption linewidths in CO (Ref. 29) andFrom this simple argument, we would expect our CO2.3) The absolute magnitude of the linewidths deter-density-broadening coefficients to scale as T i'2 o-0n3, de- mined from absorption will be different from those deter-pending on the relative contribution to the cross section of mined from Raman scattering. This is due to the factthe QQ and dispersion forces. that different states are involved in the calculation of the
To test this simple model of the temperature depen- collision cross section. However, the temperature depen-dence, we have fitted our data in Table I to the equation dence will be similar if the same terms in the multipole
B =Bo(T/295), (9) potential are responsible for the broadening. This is thecase t t for both CO and CO2 where the most important
where Bo is the density-broadening coefficient at 295 K. terms in the potential are the same as for N2.The results are given in Table VII as a function of initial Most of the data for linewidths in the literature arerotational state. We find that 0.26 < y <0.39, in reason- given in terms of pressure-broadening coefficients. Weable agreement with this simple picture. We believe that can compare results by noting that y in Eq. (9) is relatedmost of the scatter in r as a function of J is due to the to 71 by y = I - 17, where il is the exponent of the tempera-
K-_7

34 TEMPERATURE AND DENSITY DEPENDENCE OF THE ... 1951
ture for pressure-broadening coefficients. The 77 values linewidths. The room-temperature results of this workfor the N2 rotational Raman linewidths of this study cov- are in agreement (less than 5% differences for J> 2) wither a similar range of values as observed for the N2 vibra- the most recent ab initio calculations. Foreign-gastional Raman linewidths28 and the absorption linewidths broadening of these N2 transitions, due to 0,, was alsoin CO (Ref. 29) and CO2.3 ° measured and found to be 10-15 % smaller than the
The details of the exact theoretical temperature depen- self-broadening coefficients. We have also determineddence of the rotational Raman linewidths requires an ab that the density self-shifts and 02 foreign-gas shifts forinitio calculation of the velocity-dependent collisional these same N2 lines are no larger than 150 MHz/amagat.cross section, and is beyond the scope of this study. How- In a previous paper,2 we have used the above results in theever, the precision of the data presented here should allow modeling of the temperature dependence of the steady-a detailed comparison with linewidths calculated from the state Raman gain coefficient in N 2.various theoretical approaches thus allowing new theoreti- The rotational Raman density broadening and shifts incal advances to be made. H 2 were measured at 80 and 295 K. Our results were in
general agreement with previous experimental work. ThisV. CONCLUSIONS agreement of our H 2 data with other independent mea-
surements provides confidence in the new temperature-The density self-broadening coefficients have been mea- dement pres presene anove.
sured at temperatures of 80, 195, and 295 K for the even- dependent N 2 results presented above.
J rotational Raman transitions in N 2. The temperature ACKNOWLEDGMENTdependence of these coefficients was found to fit bothlinear and TY models to within 3%, however, additional This work was supported by the Defense Advancedtemperature-dependent data are necessary to accurately Research Projects Agency under Contract No. N00014-determine the temperature dependence of these rotational 84-C-0256 through the U.S. Office of Naval Research.
IM. Henesian, C. Swift, and J. R. Murray, Opt. Lett. 10, 565 (Paris) 46, 1925 (1985).(1985). 17R. H. Dicke, Phys. Rev. 89, 472 (1953).
2G. C. Herring, Mark J. Dyer, and William K. Bischel, Opt. 18Willim K. Bischel and Mark J. Dyer, Phys. Rev. A 33, 3113Lett. 11, 348 (1986). (1986).
3K. S. Jammu, G. E. St. John, and H. L. Welsh, Can. J. Phys. 19B. K. Gupta and A. D. May, Can. J. Phys. 50, 1747 (1972).44,797(1966). 2K. D. Van Den Hout, P. W. Hermans, E. Mazur, and H. F. P.
4(G. V. Milahailov, Zh. Eksp. Teor. Fiz. 36, 1368 (1959) ISoy. Knapp, Physica (Utrecht) 104A, 509 (1980).Phys.--JETP 9, 974 (1959)]. 2 1V. G. Cooper, A. D. May, and B. K. Gupta, Can. J. Phys. 48,
5Yu A. Lazarev, Opt. Spectrosc. 13, 373 (1962). 725 (1970).6F. Pinter, Opt. Spectrosc. 17, 428 (1964). 22R. L. Farrow, and L. A. Rahn, Phys. Rev. Lett. 48, 3957H. G. M. Edwards, D. A. Long, and S. W. Webb, Self- and (1982).
Foreign-Gas Broadening of the Pure Rotational Raman Lines 23C. H. Townes, and A. L. Schawlow, Microwave Spectroscopyof Oxygen and Nitrogen, Proceedings of the 9th International (Dover, New York, 1975), pp. 368 and 369.Conference on Raman Spectroscopy, 1984 (unpublished) p. 24R. P. Srivastava and H. R. Zaidi, in Raman Spectroscopy of760. Gases and Liquids, edited by A. Weber (Springer, Berlin,
8p. Esherick and A. Owyoung, in Advances in Infrared and Ra- 1979).man Spectroscopy, edited by R. J. Clark and R. E. Hester 25R. P. Srivastava and H. R. Zaidi, in Raman Spectroscopy of(Heyden, London, 1983), Vol. 9. Gases and Liquids, edited by A. Weber (Springer, Berlin,
9Joseph 0. Herschfelder, Charles F. Cartiss, and R. Byron Bird, 1979), pp. 167-198.Molecular Theory of Gases and Liquids (Wiley, New York, 26Russell T. Pack, J. Chem. Phys. 70, 3424 (1979).1954). 27L. A. Rahn and R. E. Palmer, J. Opt. Soc. Am. B (to be pub-
1°Philip L. Varghese and Ronald K. Hanson, Appl. Opt. 23, fished).2376 (1984). 28B. Lavorel, G. Millot, R. Saint-Loup, C. Wenger, H. Berger, J.
"IC. G. Grey and J. Van Kranendonk, Can. J. Phys. 44, 2411 P. Sala, J. Bonamy, and D. Robert, J. Phys. (Paris) 47, 417(1966). (1986).
12R. P. Shrivastava and H. R. Zaidi, Can. J. Phys. 55, 542 29Jeffrey N-P. Sun and Peter R. Griffiths, Appl. Opt. 20, 1691(1977). (1981); Prasad Varanasi and Sunil Sarangi, J. Quant. Spec-
13D. Robert and J. Bonamy, J. Phys. (Paris) 40, 923 (1979). trosc. Radiat. Transfer 15, 473 (1975).14G. J. Rosasco, W. Lempert, W. S. Hurst, and A. Fien, Chem. 30W. G. Planet and G. L. Tettemer, J. Quant. Spectrosc. Radiat.
Phys. Lett. 97,435 (1983). Transfer 22, 345 (1979); Lloyd D. Tubbs and Dudley Will-15M. L. Koszykowski, L. A. Rahn, and R. E. Palmer, J. Chem. iams, J. Opt. Soc. Am. 62, 284 (1972); R. Ely and T. K.
Phys. (to be published). McCubbin. Jr., Appl. Opt. 9, 1230 (1970).160 . Millot, B. Lavorel, R. Saint-Loup, and H. Berger, J. Phys.
K-8

Appendix L
TEMPERATURE AND WAVELENGTH DEPENDENCEOF THE ROTATIONAL RAMAN GAIN COEFFICIENT IN N2
Optics Lett. 11, 348 (1986)

Reprinted from Optics Letters, Vol. 11, page 348, June, 1986.
Copyright @ 1986 by the Optical Society of America and reprinted by permission of the copyright owner.
Temperature and wavelength dependence of the rotationalRaman gain coefficient in N2
G. C. Herring, Mark J. Dyer, and William L Bischel
Chemical Physics Laboratory. SRI International, Menlo Park, California 94025
Received August 12, 1985; accepted March 6, 1986
The temperature, wavelength, and J dependence of the rotational Raman gain coefficient has been determined forthe S-branch transitions in N2. First, the temperature dependence (80-300 K) of the density-broadening coeffi-cients was measured using stimulated Raman spectroscopy. Second, the wavelength dependence (250-400 nm) ofthe polarizability anisotropy was empirically determined by fitting to the most recent experimental data. Thesetwo results were then used to calculate the rotational Raman gain coefficients with accuracies estimated at 5%. Atroom temperature, the high-density limit of the steady-state gain coefficient of the strongest line, S(10), is 4.8 X10⁻¹² cm/W for a Stokes wavelength of 568 rim.
There are many applications, such as laser fusion, that Stokes-branch rotational transitions in N2. In addi-require the propagation of high-intensity lasers tion, the relative scattering cross sections were mea-through the atmosphere. Recently there has been sured for these same rotational lines. Using the re-renewed interest in the nonlinear optical processes suits of these measurements and previously publishedthat limit the maximum transmitted laser intensity values" 9 of the polarizability anisotropy, we have cal-for a given propagation distance. Several different culated the high-density Raman gain in the tempera-nonlinear effects may be important, and some of these ture region 80-300 K for four of these rotational tran-were summarized by Zuev' in 1982. However, it has sitions.only recently been suggested that rotational stimulat- For a Lorentzian line-shape function, the peaked Raman scattering (RSRS) in N2 may ultimately plane-wave, steady-state Raman gain coefficient is10
limit the maximum intensity that can be propagatedthrough air if the frequency and divergence of the laser g 2>,2&N =g (1)are to remain unchanged. This suggestion is support- hvw~v 4111ed by recent experiments 2 at Lawrence Livermore Na-tional Laboratory, where RSRS in N2 was observed where P, is the Stokes frequency in hertz, >, is thewhen the NOVA fusion laser was propagated through Stokes wavelength in the medium, AN is the linewidth100 m of air at intensities in the range of a few giga- (FWHM) in hertz, and AN is the-population differ-watts per square centimeter. ence, which is equal to N(J) - [N(J')(2J + 1)/(2J' +
This observation has reinforced the need for accu- 1)]. N(J) is the Boltzmann statistical populationrate modeling of stimulated Raman scattering in air. density in a state with rotational quantum number J.Unfortunately, the existing uncertainties 2,3 in the The rotational Raman scattering cross section for inci-steady-state gain coefficient in N2 limit the usefulness dent and scattered waves linearly polarized in theof any potential model. In particular, no data exist for same direction is given by 11the temperature dependence of the gain coefficient, an CIO 2(2rvy (j + 1) (J + 2) 2
important consideration in any model. In this Letter - i-5\ (2J + 1) (2J +3) 7 ' (2)we present new experimental results for the tempera-ture dependence of the Raman gain coefficient for the where y is the polarizability anisotropy. Themost important S-branch rotational transitions in N2. linewidth in Eq. (1) varies with J, density, and tem-
Direct measurement of the gain coefficient requires perature, while y varies with pump-laser frequency.an accurate measurement of the laser intensity in the Thus it is necessary to know this parametric depen-interaction region. For low-gain Raman systems such dence in order to calculate the Raman gain accurately.as N2, this is extremely difficult since a focused geome- The experimental setup is a quasi-cw stimulatedtry is usually required if adequate signal strengths are Raman spectrometer similar to that in Ref. 5. The cwto be obtained. Alternatively, it was recently experi- probe laser, which provides 150 mW of power in thementally demonstrated4 that the gain coefficient can interaction region, is a single-mode Kr+-ion laser oper-be accurately calculated if the line-shape function for ating at 568 nm. The pump laser is a Coherent 699-29the Raman transition and the polarizability anisotro- single-mode cw ring dye laser that is pulse amplifiedpy are known precisely. We have chosen this alterna- using a Quanta-Ray PDA-1 amplifier. At 565 rim, thetive method for determining the rotational Raman tunable output of the pump laser consists of 3-mJ, 10-gain coefficients in N2. Using stimulated Raman gain nsec (FWHM) pulses at 10 Hz. The frequency resolu-spectroscopy,5 we have measured the density and tem- tion of this system, limited by the linewidth of theperature dependence of the Raman linewidths for the pulsed laser, is approximately 100 MHz. A 250-srm-
0146-9592/86/060348-0352.00/0 C 1986, Optical Society of America
11-I

June 1986 / Vol. 11. No. 6 / OPTICS LETTERS 349
j4ooo fitting Eq. (3), with vi±,11 fixed, to recent experimentalE determinations6.8,9 of all and aj to obtain a.11 and a,±.
35The N2 parameters derived using this procedure are viiz1 3250= 1.260 X 105 cm-1, aq± = 1.323 X 105 cm-1 , a.11 = 2.200
295 K X 10-24 cm 3 , and a,.fi = 1.507 X 10⁻²⁴ cm 3 .SD In Fig. 2, the wavelength dependence of -y(v), from
o 195 K Eq. (3), is shown along with several experimental val-0• ues. We have used data from Refs. 6, 8, and 9 only to
150 o0 determine the a,, j, because these measurements have08Ksubstantially smaller uncertainties than those of the
0 I other references cited in Fig. 2. Equations (2) and (3)cc 0yield cross sections that are in agreement with direct
4 6 8 10 12 14 measurements.'5.16LOWER ROTATIONAL QUANTUM NUMBER Ui) In N 2, the J dependence of the polarizability anisot-
Fig. 1. Measured temperature dependence of the density- ropy, y, is negligible1 7.18 for J S 20. We have verifiedbroadening coefficient for Stokes-branch rotational Raman this conclusion by determining the relative cross sec-transitions in N_,. The solid line indicates the most recent tions from our stimulated Raman line-shape measure-room-temperature ab initio calculations given in Ref. 12. ments. Thus we have used Eq. (3) to determine the
polarizability anisotropy for all transitions studied inthis Letter.
diameter pinhole is used to improve the spatial mode The reliability of Eq. (3) can be checked by using theof the pump beam and to verify that the beam does not parameters a,±,• and vi±,11 to calculate the index ofmove when the dye laser is tuned over wavelength refraction n; the result can then be compared withintervals of 10 nm. The pump and probe beams were experimental data. The expression for n - 1 isfocused and crossed (angle of 1 deg) at the center of a 2 - 1 4rNgas sample cell using a 40-cm focal-length lens. After - (n - 1) ffi 2the cell, stray pump light was isolated from the probe 3 n2 +2 9beam with a second pinhole while an ac-coupled pho- rX 2vi_ 2 Vi l l,2 2todiode was used..o monitor the probe intensity. The XL, - )+a ( )], (4)Raman gain signal, which appears as a 10-nsec pulse 2Skvi 2 - 2 -
on the probe-laser intensity, is averaged with a gatedintegrator and stored on a disk for later analysis. where N is the density. Over the wavelength range
Density-broadening coefficients were determined' 250-600 nm, expression (4) agrees with experimentalfor the S(6), S(8), S(10), and S(12) rotational transi- data' 9 to better than 0.5%, verifying a high accuracytions in N2 . The data were taken at three tempera- for y(p) of Eq. (3).tures (295, 195, and 80 K) for densities spanning the We have used Eqs. (1)-(3) and our linewidth data torange 0.01-2 amagats. The results of these measure- calculate the Raman gain coefficient for the rotationalments are shown in Fig. 1 and listed in Table 1. The transitions as a function of temperature in the limitvalues for the density-broadening coefficient at room where density broadening is the dominant contributortemperature are in agreement with ab initio theory12 to the linewidth. For N2, this high-density limit cor-(solid line in Fig. 1) and are in good agreement withrecent linewidth measurements' 3 made using sponta-neous scattering. Simultaneous recording of the Ra- Table I. Temperature Dependence of Rotationalman signals at two different pressures also permitted Raman Linewidths, Fractional Populationthe observation of density shifts of the Raman transi- Differences, and Gain Coefficients for S Branch in N2etion frequency. We have determined that the density S-Branch Fractional Broadening Gainshifts are less than 150 MHz/amagat for all rotational Transition Population Coefficient Coefficientlines and temperatures studied. These broadening S() Difference (MHz/amagat) (10-12 cmIW)and shift measurements will be described in greaterdetail in a future publication.' 4 T - 295 K
The ground-state polarizability anisotropy is de- 6 0.0282 3570 3.6fined asy - all - a•, where (1, 11) indicate the perpen- 8 0.0337 3280 4.6
dicular and parallel components, respectively, of the 10 0.0335 3070 4.8
polarizability a. We can model the wavelength de- T = 195 Kpendence of -y by using an empirical formula6 6 0.0485 3070 7.2
Vi2 N_ i, 2 8 0.0491 2860 7.6
( ' 1) - a-- aI- -- , (3) 10 0.0399 2660 6.5\Pil2 - v2 J Vi - ' 2, 12 0.0271 2340 4.9T-80K
where v is the pump-laser frequency, au iJ is the static 6 0.0897 2530 16.1or dc polarizability, and Pi I is an effective intermedi- 8 0.0452 2120 9.3
ate state. The vi,: were determined first by fitting 10 0.0156 1950 3.4
Eq. (3) to the results of recent ab initio calculations7 12 0.00378 1690 0.91for aland a.. The a5 , and a,.L were then obtained by a (. 5nm).
L-2

350 OPTICS LETTERS / Vol. 11. No. 6 / June 1986
10 atm (80/20% mixture of N 2/O2) at X, = 1.07 ,m. This>. Reference 2 is 25% smaller than the value of Henesian et al.2 butcc Refernces consistant with their error bar of a few tens of per-
O Reference I
0• Reference Re 5_ In conclusion, we have made linewidth and cross-t• Reference 15c9s
E section measurements that will facilitate the modeling
S •of stimulated rotational Raman scattering in N 2.Linewidths are linear with density for densities from
• •0.01 to 2.0 amagats and are also linear with tempera-, 7 ture for temperatures from 80 to 300 K. Within the
o t 7Laccuracy (15%) of our relative measurements, the po-_ larizability anisotropy was found to be independent of600 300 5 7 9 J for S(2) through S(16). The new linewidth data
100 W00 E00 700 900 1100 presented here can now be used to predict accuratelyWAVELENGTH (nm} ('['5%) the rotational Raman gain over a wide range of
Fig. 2. Wavelength dependence of the N2 polarizability temperatures and densities in N 2.anisotropy. Solid line is given by Eq. (3), which was derived This research was supported by the Defense Ad-with a fit to the data of Refs. 6, 8, and 9. Data of Refs. 2 and vace research Pjs Agency une contrAct15 were not used in the fit but are shown for comparison. vanced Research Projects Agency under contract
N00014-84-C-0256 through the U.S. Office of Naval
Research.
15 - SM References
1. V. E. Zuev, Laser Beams in the Atmosphere (Consul-E S•,, tants Bureau, New York, 1982), pp. 243-314.
10 1\ 2. M. Henesian, C. Swift, and J. R. Murray, Opt Lett. 10,565 (1985).
3. V. S. Averbakh, A. I. Makarov, and V. 1. Talanov, Soy. J.Quantum Electron. 8, 472 (1978).
4. W. K. Bischel and M. J. Dyer, J. Opt Soc. Am. B 3,677(1986).
5. P. Esherick and A. Owyoung, in Advances in Infraredo and Raman Spectroscopy, R. J. H. Clark and R. E.
100 140 18O 220 260 300 Hestor, eds. (Heyden, London, 1983), pp. 130-187.TEMPERATURE (W) 6. G. R. Alms, A. K. Burnham, and W. H. Flygare, J. Chem.
Phys. 63, 3321 (1975).Fig. 3. Temperature dependence of the plane-wave, 7. P. W. Langhoff, J. Chem. Phys. 57, 2604 (1972).
steady-state Raman gain in N2 calculated from Eq. (1) for 8. P. P. Bogaard, A. C. B ha,. K. Penad.the high-density limit (p > 0.01 amagat). The pump and 8 . iP. Bogaard, A. D. Buckingham, R. K. Pierens, and A.Stokes polarizations are linear and parallel. H. White, J. Chem. Soc. Faraday Trans. 1 74, 3008(1978).
9. N. J. Bridge and A. D. Buckingham, Proc. R. Soc. Lon-don Ser. A 295, 334 (1966).
responds to densities greater than 0.01 amagat. The 10. J. R. Murray, J. 0 oldhar, D. Eimerl, and A. Szoke, IEEEresults are summarized in Table 1, while the tempera- J. Quantum Electron. QE-15, 342 (1979).ture dependence is illustrated in Fig. 3. These results 11. D. A. Long, Raman Spectroscopy (McGraw-Hill, Lon-were obtained by assuming that the rotational don, 1977).linewidths are linear with temperature and the polar- 12. D. Robert and J. Bonomy, J. Phys. (Paris) 40,923 (1978).izability anisotropy is constant with J. 13. H. G. M. Edwards, D. A. Long, and S. W. Webb, "Self-
The accuracy of the gain coefficients reported here and foreign-gas broadening of the pure rotational Ra-man line of oxygen and nitrogen," presented at the IXthis limited by the uncertainties in the linewidths and International Conference on Raman Spectroscopy, To-
the polarizability anisotropy. Our linewidth mea- kyo, August 27-September 1, 1984.surements have uncertainties of 2% (one standard de- 14. G. C. Herring, M. J. Dyer, and W. K. Bischel, "Tempera-viation) as given by the linear fits used to determine ture and density dependence of the linewidths and line-the broadening coefficients.14 The uncertainty in the shifts of the rotational Raman lines in N,- and H2" (sub-polarizability anisotropy was estimated to be 1.5% mitted to Phys. Rev. A).from the differences in the results of different investi- 15. C. M. Penny, R. L. St. Peters, and M. Lapp, J. Opt. Soc.gators. Thus the accuracy of the gain coefficients Am. 64, 712 (1974).reported here is approximately 5%. 16. W. R. Fenner, H. A. Hyatt, J. M. Kellam, and S. P. S.
We can compare the pure N2 gain coefficients re- Porto, J. Opt. Soc. Am. 63, 73, 1604 (1973).ported her compa the air eN2gan coefficients rey e- 17. C. Asawaroengchai and G. M. Rosenblatt, J. Chem.
ported here with the air coefficients reported by Hene- Phys. 72, 2664 (1979).sian et al.,2 since we have also measured14 the foreign 18. H. Hamaguchi, A. D. Buckingham, and W. J. Jones, Mol.gas broadening coefficients of 02. After correcting for Phys. 43, 1311 (1981).N2 and 02 densities, X,, and the wavelength depen- 19. Landolt-B6rnstein, Zahlenwerte und Funktionen. IIdence of the polarizability anisotropy [Eq. (3)], we Band, 8 Teil, Optische Konstanten (Springer-Verlag,obtain a N 2 gain coefficient of 2.0 X 10 -12 cm/W for 1 Berlin, 1962).
L-3

Appendix M
MODEL OF THE ROTATIONAL RAMAN GAIN COEFFICIENTS FOR N2 INTHE ATMOSPHERE
Appl. Optics 26, 2988 (1987)

Reprinted from Applied Optics, Vol. 26, page 2988, August 1, 1987Copyright 0 1987 by the Optical Society of America and reprinted by permission of the copyright owner.
Model of the rotational Raman gain coefficients forN2 in the atmosphere
G. C. Herring and William K. Bischel
A model for stimulated Raman scattering in the atmosphere is described for the pure rotational transitions inN 2. This model accounts for the wavelength dependence of the N 2 polarizability anisotropy, altitude andseasonal temperature variations in the atmosphere, and the 02 foreign-gas density broadening. Thisinformation is used to calculate the steady-state plane-wave Raman gain profile over the lower 100 km of theatmosphere. Over altitudes of 0-40 kin, temperature variations produce 30% changes in the gain coefficientsof 1 km-1 cm 2 MW-1 for the strongest lines at Stokes wavelengths of 350 nm.
I. kdroductlm man gain coefficient as a function of altitude (0-100Several nonlinear effects, summarized by Zuev,1 are kin) in the atmosphere.
possible when a high intensity laser beam propagates The modeling of the propagation of a high intensitythrough the atmosphere. Recent work" has focused laser pulse through a Raman medium, such as theon the possibility that stimulated rotational Raman atmosphere, requires a propagation code that includesscattering in N2 may have the lowest threshold intensi- transient effects, off-axis propagation for the generat-ty. Stimulated Raman scattering then limits the max- ed beams, the inclusion of all possible Stokes and anti-imum laser intensity that can be transmitted through Stokes orders that can be generated, and the provisionthe atmosphere if the divergence of the beam is re- for a variable pump laser bandwidth. Codes includingquired to remain unchanged. To establish this maxi- some of these effects are currently being developed inmum intensity, it is necessary to obtain an accurate several laboratories including our own.6 The model ofdescription of the steady-state Raman gain coefficient the steady-state gain coefficient presented here is anin the atmosphere important input to these codes.
Thus paper dew-boas a model of the Raman gain 1.Mdles locoefficient for the ! 2 S-branch rotational transitions Iin the atmosphere. This model is based on our recent A. AtTlospheric Modelstudy3 of the tempe Ature dependence of the rotation- In our atmospheric gain model, the Raman gainal Raman gain. In the present atmospheric work, we calculation uses the altitude-dependent temperature,use the same temperature dependence as described in dens es thensitude-dependat Wem haveRef. 3, although we also include the effect of foreign- N2 density, and 02 density as input data We havegas (02) broadening on the N2 Raman lines. This taken these data from actual atmospheric measure-temperature-dependent Raman gain coefficient is ments at Wallops Island, VA (38dN), as published byused with a published atmospheric model5 to calculate Banks and Kckarts. Slightly different results arethe atmospheric N2 Raman gain coefficient. The im- expected if the standard atmospheric model7 is used.portant new contribution of this paper is a tempera- Temperatures and densities for N2 and 02 were takenture-dependant description of the rotational N2 Ra- from Table 3.1 of Ref. 5. Densities were extrapolated
for the first 15 km (omitted from Table 3.1 of Ref. 5) byassuming an exponential decay with increasing alti-tude, an e-1 altitude of 8 km, and relative densities of78 and 21% for N2 and 02, respectively. The averageatmospheric temperature profiles for this model are
The authors are with SRI International. Chemical Physics Lab- shown in Fig. 1. Maximum variations are indicated byoratory, Menlo Park, California 94025. horizontal bars for summer and by shading for winter.
Received 2 February 1987. Temperatures for the first 15 km (also omitted from0003-6935/87/152988-07$02.00/0. Table 3.1 of Ref. 5) were determined from the averageC 1987 Optical Society of America. of the summer and winter values in Fig. 1.
2988 APPLIED OPTICS / Vol. 26, No. 15 / 1 August 1987
M-1

SIThe spontaneous scattering cross section per molecule,90 - ..- a12, is temperature independent, whereas the popu-
lation difference AN and the line shape f(6) are thetemperature-dependent factors. At the peak (bif = 0)
80 of a Lorentzian-shaped transition, Eq. (1) reduces toEq. (1) of Ref. 3. Table I briefly summarizes the
70 parameters used in the present Raman gain calcula-tion.
"The cross section is
o0 a= 2 ( 2 rVs) 4 (J+1) J+2) 2
-a 1 / W-•+ 1) 2J + 3)^ (2)
-50 for pump and Stokes polarizations that are linear andt_ •parallel, which is the only geometry considered in this
work. The polarizabilty anisotropy y is wavelength-< 40 dependent, and the details for determining the wave-
"length dependence are given in Ref. 3. All the results
30 presented in this study are for a Stokes wavelength Xsof 350 nm and a polarizability anisotropy of 7.39 X"10-25 cm 3 . We neglect the rotational quantum num-
20 ber J dependence of y, an excellent approximation forN 2, as discussed in Ref. 3.
The population density difference is given by10 - •[/2J+ 12+ I\
AN= N(J)- 2J,+ 1/N(J). (3)
160 20 25so 2N N(J) is the number density of molecules with rotation-
TEMPERATURE (K) al quantum number J, where primed and unprimed J
Fig. 1. Temperature profiles used in the Raman gain calculations. denote the upper and lower state, respectively. The
Maximum variations are indicated by horizontal bare for summer population difference AN was calculated from a Boltz-
and by shading for winter (from Ref. 5). man distribution using the N2 rotational constants inRef. 8.
Only the high density limit wa, -onsidered for thegain calculations of Ref. 3, and thus Lorc-tzian func-
B. Pman Gain Model tions were used for f(5z). For the present atmosphericThe temperature dependence of the rotational Ra- model, we use a more general Voigt function for f(ap).
man gain is described in Ref. 3 and summarized below. In the most general case, the Galatry (or other relatedThe steady-state plane-wave Raman gain coefficient is line shapes9) line shape is a more accurate line profilegiven by2 for transitions that have line shapes with significant
X2AN ~contributions from collisional narrowing. However,g ( - , (1) our use of Voigt line shapes is a good approximation for
hvs 0 rotational N2 lines in the atmosphere for two reasons.
where f(60) is the area-normalized Raman line shape First, at low altitudes (<20 kin), pressure broadeningand 5v -=p - PS - PR, where vps are the pump/Stokes dominates over Doppler broadening (5 MHz), and thuslaser frequencies, YR is the Raman transition frequen- collisional narrowing is negligible. Second, at highercy, and Xs is the Stokes wavelength in the gain medium. altitudes where Doppler broadening is appreciable, the
Table L Parmwete Used in OW S(8) Gain Calculation for Xs : 350 1n
Altitude Temperature AN Voigt AMFWHM Gain coefficient
(kin) (K) N (MHz) f(ap - 0) (cm 2 km-1 MW-')
0 285 0.0349 2960 0.000215 0.68
10 225 0.0441 784 0.000813 0.92
20 219 0.0451 180 0.00354 0.95
30 235 0.0424 39.8 0.0164 0.87
40 268 0.0373 10.5 0.0595 0.64
50 274 0.0365 5.7 0.121 0.36
60 253 0.0396 4.9 0.166 0.17
70 211 0.0464 4.5 0.209 0.067
80 197 0.0489 4.3 0.216 0.016
90 197 0.0489 4.3 0.218 0.0029
100 209 0.0468 4.4 0.212 0.00049
1 August 1987 / Vol. 26, No. 15 / APPLIED OPTICS 2989
M-2

density is too small for significant collisional narrow- 7
ing. Thus pure Voigt line shapes were used for all our (a-results. 7 0.8
The width of the Lorentzian contribution to the .9M 0.6Voigt was obtained by adding the linewidths due to E
self-broadening and to 02 foreign-gas broadening. 0.4The linewidth measurements used here are summa- 0.2 Vojgtrized in Ref. 10. 'Self-broadening coefficients not giv- T 0.2
en in Table I of Ref. 10 were determined by assuming a Z5 0
linear J dependence. Foreign-gas broadening coeffi- 1o-1cients for temperatures and Jterms not given in Table 10-2V of Ref. 10 were determined by assuming that the 10-3 (bM
foreign-gas values are 85% of the corresponding self- 10i4-4
broadening values in Table I of Ref. 10. Finally, allbroadening coefficients were assumed to have the lin- z1°ear temperature dependence described in Ref. 10. 1' 10oThese three assumptions are based on the trends io-7shown by the data of Ref. 10. 1o-.
Our calculations assume that the laser linewidth ismuch smaller than the Raman linewidth. These cal-culations will also be valid if the laser linewidth is 102z 102 ©larger than the Raman linewidth, provided that theStokes field is phase locked to the pump laser field.' 1 4 10
Z
Ill. Results lo p -
A. Altitude Dependence 0.Figure 2(a) shows the peak (6P = 0) Raman gain coeffi- 0 20 40 60 80 100
cient of 3(8) as a function of altitude for the tempera- ALTITUDE (kin)
ture profile described in Sec. II.A. The two quantities Fig.2. Raman gain vs altitude. The solid curves show (a) the peak,
AN and APT that combine to produce this altitude steady-state plane-wave Raman gain coefficient; (b) the populationdifference AN, and (c) the Raman linewidth (Voigt FWHM) as aprofile are also shown in Figs. 2(b) and (c) for the same function of altitude for S(8) in N2. The dashed curve in (a) shows
temperature profile (APT is the FWHM Raman the gain if the approximation, A2T+_ A ,iusedinplaceoflinewidth.) The Raman gain is about constant below the Voigt calculation of (c). APT, AiG, and AVL are the total, Gauss-40 km and drops to zero above 40 km. This occurs ian, and Lorentzian linewidths, respectively.because the peak Raman gain depends on the ratioAN/APT. Below 40 km, Figs. 2(b) and (c) show thatAN and APT decrease with altitude at about the samerate, yielding an approximate constant value of gain. calculation of the S(0) through S(4) transitions. TheAbove 40 km, Fig. 2(b) shows that AN continues to comparison of Fig. 2(a) shows that a simple approxi-decrease, whereas Fig. 2(c) shows that APT becomes mation of the N2 line shape is sufficient to predictconstant with altitude; thus the Raman gain also de- accurately the atmospheric Raman gain for the mostcreases with altitude. The Raman linewidth is con- important transitions. However, we note that the reststant at high altitudes because the collisional broaden- of the results presented here were obtained with com-ing becomes negligible compared with the pleteVoigtcalculations.approximate constant Doppler broadening. The peak Raman gain coefficients for the strongest
Because the Raman line shape is predominantly Stokes transitions are summarized as a function ofcollisionally broadened over the 0-40-km region, a altitude in Fig. 3. The difference between Figs. 3(a)pure Lorentzian line shape should be a good approxi- and (b) is that the vertical scale of Fig. 3(b) is magni-mation in the atmospheric gain calculation. For corn- fied by a factor of 3 to better illustrate the small gainparison, the dashed line in Fig. 2(a) shows the gain if coefficients of S(0) through S(4). The number indi-the line shape function f(Av) in Eq. (1) is calculated cated next to each curve is the lower rotational quan-from a Lorentzian profile with a FWHM linewidth turn number J for that particular transition. Peaksgiven by and valleys that occur at an altitude of 15 km are due to
- 2 +&21the temperature minimum (200 K) that exists at this+ ) ) altitude. Decreasing temperatures tend to transfer
The quantities APG and APL are the Doppler and coli- molecules from the higher rotational levels to lowersional FWHM linewidths, respectively. The approxi- levels; thus AN for 3(14) and S(16) is decreasing whilemation is in good agreement with the full Voigt calcu- AN for S(6) and S(8) is increasing at the temperaturelation except for a 20% discrepancy in the 50-70-km minimum. In Fig. 3, S(8) and S(10) have the largestregion. This small difference is important for the gain gains at sea level, in agreement with the observation of
2990 APPLIED OPTICS / Vol. 26, No. 15 / 1 August 1987
M-3

t I I I I I I I I
1.0 86(a)
- , ,..-..
0.8 10
0.4/ 14
0.4 _-_16
S0.2 2
Y.,
E
S(21 S(4)S• , \(b)
0.3 \
I •I
0.2 / \
0.10.1 "
S(O)
00 20 40 60 80 100
ALTITUDE (kin)
Fig. 3. Peak Raman gain coefficients for (a) the strongest transitions and (b) some of the weaker transitions as a function of altitude.
Henesian et al.2 and our previous calculations. 3 Theresults of integrating the gain coefficients over thedepth of the atmosphere (from sea level to 100 km) are Ta0e 0 . ek 1) foa Stoke s (Rotatn d ro Sea Leveo totabulated in Table H, where we see that S(6), S(8), and 100 k) o e n o Traneu o N-S(10) dominate the Stokes conversion process in the Gain coefficientatmosphere. The odd-numbered J transitions are Transition S(J) (cm2 MW-1)
only half as strong as their adjacent even-numbered 0 2.16neighbors and are omitted from this investigation. 2 13.8
Raman gain coefficients for frequencies other than 4 29.1
those at the peak [5v - 0 in Eq. (1)] of the Raman 6 39.38 43.4
transitions were also calculated. Figure 4(a) shows 10 39.8the S(8) gain coefficient as a function of altitude for 12 32.6detuning values of 0, 10, 100, and 800 MHz. The 14 22.6integrated (from 0 to 100 km in altitude) gain coeffi- 16 15.2
1 August 1987 / Vol. 26. No. 15 / APPLIED OPTICS 2991
M-4

down by a factor of 2. From Fig. 4(b), this bandwidth1.0 is 2 MHz and is to be compared to the value of,-3 MHz
7•0.8 \ that we estimate from Eq. (16) of Ref. 4.
0.6 B. Temperature VariationsE
- 0.4 \ All the results of Figs. 2-4 were obtained for the-\o0.2 AO '10 \0 MHz specific temperature profile of Table 3.1 of Ref. 5.
-0.2 The effect of atmospheric temperature fluctuations is0 summarized in the four curves of Fig. 5. The change in
0 20 40 60 80 100 Raman gain of S(8), due to seasonal variations of tem-ALTITUDE (km) perature, is illustrated with four different gain profiles.
The four temperature profiles used in the calculationsS102 of Fig. 5 were determined from Fig. 1. The curves
labeled maximum are the gains for the highest tem-11 10b) peratures shown for that season, whereas those labeled2 minimum are the gains for the lowest temperatures
< t0 shown for that season. Figure 5 shows that maximumvariations in the Raman gain due to temperature
,o10t changes in the atmosphere are -10% at all altitudes.o IV. Discusson
_. 10- , I I
z 100 10t 102 103 le This is the first study to consider the effect of tem-DETUNING (MHz) perature variations on the Raman gain, and thus it is
Fig. 4. S(8) Raman gain coefficient (a) as a function of altitude for useful to compare the present work with a previousdetunings of 0, 10, 100, and 800 MHz from the line center and (b) atmospheric gain calculation that neglects the tem-integrated (from 0 to 100 km in altitude) gain coefficient as a func- perature effects. 4 These two models are compared in
tion of detuning. Fig. 6, where the S(8) gain coefficient is plotted vsaltitude for each model. Table III lists the most im-
cient for S(8) is plotted vs detuning in Fig. 4(b). The portant parameters associated wtih the gain coeffi-information illustrated in Fig. 4 is useful for determin- cient for both models. The two largest differences ining the effective bandwidth that experiences substau- these two models are the temperature distribution oftial gain over the entire lower 100 km of the atmo- the atmosphere and the density broadening coeffi-sphere. This bandwidth is needed to calculate the cients that were used. Both the density broadeningpump laser intensity required to reach threshold.2,4 coefficients and the population difference change byWe estimate this effective bandwidth from the detun- 20-25% for S(8) when the temperature changes froming value, where the generated Stokes intensity is
Minimum Winter1.0 Minimum Summer-. 1.0 Z• Max mu Wi te
0 , Maximum Summer
ES0.6
EzS0.4
00
S0.2
0 20 40 60 80 100
ALTITUDE (kin)Fig. 5. S(8) peak Raman gain variations for typical variations in atmospheric temperatures.
2992 APPLED OPTICS I Vol. 26, No. 15 I 1 August 1987
M-5

-1.2
1.0o TemperatureDependentS0.8 _7 \ , • ,,0.8 Temperature
E 06 r Inde~pendent
Zo.4
0.2
,n 0.00 20 40 60 80 100
ALTITUDE (km)
Fig. 6. Comparison of the temperature-independent model of Ref.4 and the present temperature-dependent model of the atmospheric
Raman gain coefficient for S(8).
Table IlL Ainoephwic Rotatiomal Raman Gain Coefficient and Aesoclated Parameters for the S(8) Une in N2 at Xs 350 nu
Room temperatureself-broadening Polarizability Sea level Sea level Sea level Threshold
coefficient anisotropy temperature 4N gain coefficient intensity(MHz/amagat) (10-2 cm- 3) (K) N (cm 2 km-' MW-') (MW/cm2 )
This work 3280 7.39 285 0.0349 0.68 0.85Ref. 2 0.850Ref. 4 2600 7.47 300 0.035 0.830 0.86
a Gain coefficients were scaled to 350 nm using a 1/Xs dependence.
300 to 200 K. The combined effect of the atmospheric Other smaller differences between our work and thattemperature variation on Raman gain coefficient is of Ref. 4 include the wavelength dependence of theillustrated by the difference between the solid and polarizability anisotropy and the 02 foreign broaden-dashed curves of Fig. 6. The broadening coefficients ing. We have used the wavelength dependence of theused in the present work10 are ,-20% larger than those1 5 rotational transitions,3 and the results of Ref. 4 areused in Ref. 4, and this difference is the major contrib- based on the wavelength dependence of the vibrationalutor to the 15% difference in the two sea-level (or room transitions.'6 Another small difference is that we havetemperature) gain coefficients of Fig. 6. To better accounted for the foreign-gas broadening contributionvisualize the effects on the gain due only to temperture due to 02. Each of these effects alters the gain coeffi-variations, this 15% sea-level difference should be ig- cient by a few percent.nored. Thus the maxrimum difference between the The uncertainties in the Raman gain coefficientstemperature dependent gain and the temperature-in- reported for this study depend on how well the tem-dependent gain occurs at 15 kin, where the tempera- perature of the gain medium is known. If the tem-ture-dependent model would give a gain coefficient perature is accurately known (e.g., laboratory condi-30% larger than the temperature-independent model. tions), the uncertainties in the gain coefficients are
Once the altitude dependence of the gain coeffi- limited by the uncertainties in the linewidths and thecients is known, the integrated gain can be computed polarizability anisotropy. Both of these uncertaintiesand used to estimate the threshold intensity for appre- are -1-2%; thus the gain coefficient uncertainties areciable Raman conversion. We calculate the threshold -5%. In the atmosphere, where the temperature isintensity with the expression not well known, the uncertainties in the gain coeffi-
1, - IN exp(-lpfg(z)dz), cients are dominated by temperature uncertainties.Therefore, gain coefficient uncertainties are -10%, as
where z is the atmospheric altitude, g(z) is the Raman illustrated in Fig. 5.gain coefficient, I. is the pump intensity, Is is thegenerated Stokes intensity, and IN is the spontaneous V. Summwynoise intensity from the first gain length.2 To com- The Raman gain of the Stokes rotational lines in N2pare with Ref. 4, we consider an atmospheric path has been modeled as a function of altitude for the lowerperpendicular to the ground and defime threshold to be 100 kin of the atmosphere. Calculations were com-Is/lp - 0.01. The threshold intensities for the two gain pleted for the even J transitions, S(O) through S(16).profiles shown in Fig. 6 are listed in the last column of The strongest lines, S(6) through S(10), have maxi-Table III. The agreement between these two numbers mum gain coefficients of 1 CM2 MW-1 km-1 at anillustrates the accuracy of the temperature-indepen- altitude of 15-20 km and smoothly decrease to zerodent model when averaging over the entire depth of the over the 20-80-km region. Effects on the Raman gainatmosphere. are described for altitude and seasonal temperature
1 August 1987 I Vol. 26, No. 15 / APPtIED OPTICS 2993
M-6

fluctuations in the atmosphere and detuning from the 7. U.S. Standard Atmosphere. 1976, NOAA-S/`T 76 1562 (Nation-
line center of the Raman transition. The results of al Oceanic and Atmospheric Administration, Washington DC.
this work provide useful input for simulation codes 1976).
that model the stimulated Raman process in the atmo- 8. K. P. Huber and G. Herzberg, Molecular Spectra and Mot rularStructure IV. Constants of Diatomic Molecules (Van Nos-
sphere. trand Reinhold, New York, 1979), p. 420.
We thank David L. Huestis for stimulating conver- 9. P, L. Varghese and R. K. Hanson, "Collisional Narrowing Ef-
sion during this study. This work was supported by fects on Spectral Line Shapes Measured at High Resolution,"
the Office of Naval Research under contract N00014- Appl. Opt. 23,2376 (1984).
84-C-0256. 10. G. C. Herring, M. J. Dyer, and W. K. Bischel, "Temperature andDensity Dependence of the Linewidths and Lineshifts of theRotational Raman Lines in N 2 and H2," Phys. Rev. A 34, 1944(1986).
11. A. Flusberg, "Stimulated Raman Scattering in the Presence ofReOfffCOI Strong Dispersion," Opt. Commun. 38,427 (1981).
1. V. E. Zuev, Laser Beams in the Atmosphere (Consultants Bu- 12. E. A. Stappaerts, W. H. Long, Jr., and H. Komine, "Gain En-ieau, New York. 1982). hancement in Raman Amplifiers with Broadband Pumping,"
2. M. A. Henesian, C. D. Swift, and J. R. Murray, "Stimulated Opt. Lett. , 4 (1980).Rotational Raman Scattering in Long Air Paths," Opt. Lett. 10, 13. W. R. Trutna, Jr., Y. K. Park, and R. L. Byer, "The Dependence565(1985). of Raman Gain on Pump Laser Bandwidth," IEEE J. Quantum
3. G. C. Herring, M. J. Dyer, and W. K. Bischel, "Temperature and Electron. QE-is, 648 (1979).Wavelength Dependence of the Rotational Roman Gain Coeffi- 14. A. Flusberg, D. Kroff, and C. Duzy, 'The Effect of Weak Disper-cient in N 2," Opt. Lett. 11, 348 (1986). sion on Stimulated Raman Scattering," IEEE J. Quantum Elec-
4. M. Rokni and A. Flusberg, "Stimulated Rotational Raman Scat- tron. QE-21, 232 (1985).tering in the Atmosphere," IEEE. J. Quantum Electron. QE-22, 15. K. Jammu, G. St. John, and H. Welsh, "Pressure Broadening of3671 (1986); see correction to be published in IEEE J. Quantum the Rotational Raman Lines of Some Simple Gases," Can. J.Electron. QE-23, 000 (July 1987). Phys. 44,797 (1966).
5. P. M. Banks and G. Kockarts, Aeronomy (Academic, New York, 16. W. K. Bischel and G. Black, "Wavelength Dependence of Ra-1973), Chap. 3. man Scattering Cross Sections from 200-600 NM," in AlP Con-
6. A. P. Hickman, J. A. Paisner, and W. K. Bischel, "Theory of ference Proceedings, No. 100, Subseries on Optical Science andMultiwave Propagaton and Frequency Conversion in a Raman Engineering, No. 3, Excimer Lasers-1983, C. K. Rhodes, H.Medium," Phys. Rev. A 33,1788 (1986). Ewser, and H. Pummer, Eds. (AIP, New York, 1983).
2994 APPLIED OPTICS / Vol. 26, No. 15 / 1 August 1987
M-7

Appendix N
CW STIMULATED RAYLEIGH-BRILLOUIN SPECTROSCOPY OF GASES
Third International Laser Science Conference1-5 November 1987, Atlantic City, NJ

THIRD INTERNATIONAL LASER SCIENCE CONFERENCE (ILS-III)
November 1-5, 1987
Harrah's Marina, Atlantic City, New Jerse)
0 NOT WRITE IN THIS SPAC-William K. Biscbel 415-859-5129
umber. Corresponding Author PhuncA14/0'
SRI International Molecular Physics LaboratoryInstitution Department
C5.ionl 333 Ravenswood Ave.
Street AddresN or Bo\ Numbc:rocranilumber Menlo Park, CA 94025
)Tgar er (.'it\ State(Countr\/
"poster preferred i oral preferred nv, prc(cý c,.
,. author Aill mo-1 likel preent this papc:? Gregory Herring
a :equirCmell- o-: commenw-
I Choice ol 'utl'ji' arc.. ,,econd Choi"___
)(;\01 T I'I CW Stimulated Rayleigh-Brillouin SpectroscopyT'. ,\----.- of Gases, G. C. HERRING, MARK J. DYER, and WILLIAM K.
BISCHEL, SRI International, Menlo Park, CA 94025--Wereport the results of CW stimulated Rayleigh-Brilliounspectroscopy of gases at 568 rm. These are the first
S\xt Mt •l' IL measurements that fully resolve the details of the\f-, T -1(011) line shapes and line shifts for the Brillouin doublet
in Xe, SF 6 , and freons with a resolution limit of less
than 10 MHz. The experiment consists of two single- TYPL A -T Nfrequency CW lasers, a Kr+ laser at 568 nm and a tun- ESTIRt!able ring dye laser operating at 568 nm, that counter- \I1HI\ III!,SPA( VRECTA-1.1,
sS•(I l• propagate through a multipass SBS cell that refocuses oETM i,• 105 ,m the beams to common foci for 30-60 passes. The lasers WITHIN THI
are configured in a counter-propagating geometry to LINESVIL_probe the backward SBS gain used in phase conjugation BE PRI•\TLi)
applications. The ring dye laser is amplitude modu-lated at 0.1-3 MHz. This modulation is transfered tothe Kr+ probe laser by SBS gain and is detected usinga lock-in amplifier. The resulting line shapes aresubsequently fit using line shape theories forRayleigh-Brillouin scattering. The data presentedhere is important for applications involving phase-ýonjugation using stimulated Brillouin scattering.
This work is supported by the Office of NavalResearch.
id this form to: Lynn Borders, Iowa Laser Facility, University of Iowa, Iowa City. Iowa 52242-1294; phone: (3191 33ý5-1299:
twx: 910-525-1398; Bitnet: BLAWCSPD@UIAMVS.
N-1

Appendix 0
HIGH RESOLUTION STIMULATED RAYLEIGH-BRILLOUINSPECTROSCOPY OF Xe AND SF 6

HIGH RESOLUTION STIMULATED RAYLEIGH-BRILLOUINSPECTROSCOPY OF XE AND SF 6
G. C. Herring,* Mark J. Dyer, and William K. BischeltMolecular Physics Laboratory
SRI International, Menlo Park, CA 94025
ABSTRACT
We have developed a high resolution (10 MHz) coherent Brillouin spectrometer that, for
the first time, clearly resolves the Rayleigh and Brillouin components of the low frequency
scattering spectrum of gases. Two narrow band cw lasers are used with a multi-pass cell to obtain
signal-tonoise ratios of 100. We have used this apparatus to directly measure the stimulated
Brillouin scattering (SBS) gain coefficents, linewidths, and line shifts for Xe and SF6. Our results
improve the accuracy of previous measurements and illustrate the power of the technique for
characterizing other potential SBS media for phase conjugation applications.
* Current address: NASA Langley, Instrument Research Division, Mail Stop 235AHampton, VA 23665-5225
t Current address: Coherent Inc., 3210 Porter Drive, Menlo Park, CA 94304
MP 90-126July 30, 1990
0-1

In recent years, phase-conjugate reflectors have generated much interest for a variety of
applications.I Many nonlinear techniques can be used as phase-conjugators, but stimulated
Brillouin scattering (SBS) is one of the techniques receiving the most attention.1- 3 Optimum
design of phaseconjugate reflectors will require high resolution experiments to accurately measure
the lineshape and related properties of Brillouin scattering. In the past,4 the frequency resolution of
SBS experiments in gases has been limited to 100 MHz by the Fourier limited bandwiths of the
pulsed lasers used to drive the Brillouin interaction. More recently, a resolution of 4 MHz has
been demonstrated using two cw single-frequency dye lasers,5 but the signalto-noise ratio (SNR)
was too small to observe the Rayleigh component. In the present work, the combination of large
SNR and high resolution has resulted in a clear separation of the Rayleigh and Brillouin
components.
In this paper we report the developement of a high resolution (10 MHz) SBS spectrometer
to study backward SBS in gases. We have demonstrated our technique on Xe and SF6, two gases
that have been previously studied because of their high SBS conversion efficiency. To achieve the
highest resolution, two single-frequency cw lasers are used, while a multipass cell is used to
increase the sensitivity. The high resolution of our system has allowed the direct measurement of
the Brillouin linewidths and line shifts, while our high SNR and the relatively well-known
Gaussian spatial profiles of the lasers has allowed accurate absolute gain coefficient measurements
for both Xe and SF6.
The experimental set-up is shown in Fig. 1. The probe is a Kre -ion laser operating at 568 nm
and uses a temperature stabilized oven to reduce the bandwidth to about 10 MHz. The pump is a
tunable ring dye laser that has a bandwidth of 1 MHz. Both of these laser beams are collimated to
the same size (3 mm diameter) and then directed into a multipass cell (30cm focal length), where
the beams are overlapped in a counterpropagating geometry. Both the pump and probe beams are
passed through a Faraday isolator to prevent laser instabilities due to optical feedback. The pump
beam is amplitude modulated at 100 kHz with an acousto-optic modulator that gives 85% depth of
0-2

modulation. This modulation is transferred to the probe through the SBS process when the angular
frequency difference of the two lasers is equal to
0oB = 2 (a0l v n/c) sin (8/2), (1)
where 8 is the crossing angle of the pump and probe beams, (o0 is the probe laser angular
frequency, v is the speed of sound, and n is the index of refraction. A small percentage of the
probe is then picked off with a glass slide and monitored with an EG&G SGD-444 photodiode,
where the 100 kHz SBS signal is detected with a lock-in amplifier.
An example of the SF 6 Rayleigh-Brillouin lineshape is given in Fig. 2. The dots are the data and
the solid line is a fit to the data based on a Lorentzian lineshape model. The left-hand and right-
hand peaks are the Brillouin loss and gain peaks respectively. The central structure is the Rayleigh
gain/loss profile, seen in SBS as the derivitive of the spontaneous Brillouin profile. Our best SNR
is better than twice that shown in Fig. 2 and is about 100. The exact stimulated Rayleigh-Brillouin
lineshape 6 for an atomic medium is actually more complicated than a Lorentzian, particularly at low
pressures. However at the high densities used in most of this study, the Lorentzian approximation
for the Brillouin profiles will not produce significant errors. At these high pressures the Rayleigh
linewidth is substantially narrowed by collisions, thus the central Rayleigh profile can also be
approximated as the derivative of a Lorentzian.
We have measured the pressure dependence of the Brillouin linewidths for pressures high
enough that the Brillouin and Rayleigh components remain distinguishable, These measurements
are shown in Fig. 3 along with the results of a Damzen et al.7 who have recently measured the
decay time of the acoustic intensity in pulsed SBS experiments. Their results yield the empirical
relations,
TB (ns)--0.65 X2 p (2)
0-3

for Xe (p = pressure in atm and 7, = laser wavelength (air) in Jim) and
TB-1 (sec"1) - x 109 + 1.6 x 10⁵ p (3)
for SF6 (p = density in kg m-3), that give decay times as a function of pressure or density. In
reproducing Eqn. (3) in Fig. 3, we have used the second and third virial coefficients for the
equation of state.8 We have converted the intensity decay times of Ref. 7 to FWHM linewidths
using Aco = lIt. The comparison in Fig. 3 shows good agreement between the decay time
measurements and the linewidth measurements. At the highest pressures, the present linewith
measurements are about 10 MHz larger than the linewidths predicted by Eq. 3.
We have also used our signal levels to determine the absolute steadystate plane-wave gain
coefficients. Assuming that the pump and probe beams have the same waist and confocal
parameter, the plane-wave gain coefficient, g, is related to the multi-pass focused fractional gain,
G, of the probe by9
G = (n g P/2) (IR• + N In (R) (4)
where P is the total power in the pump beam, N is the number of passes through the cell,
and R is the mirror reflectivity. We determine G by directly measuring the ratio of the
Brillouin signal and the probe power levels. This ratio is then corrected for pump and probe
laser power changes. The results of our measurements are given in Fig. 4 by triangles for
Xe and squares for SF 6.
The steady-state SBS gain coefficient can be calculated from10
0-4

g = (5)
X2 -L n c v pTB
where Ye is the electrostrictive coefficient given by
Ye = p (W•aep)T = - (n2 + 1) (n2+ 2). (6)-3
Using the literature 11,12 values of the density dependence of the index of refraction to
determine Ye, we have calculated the gain for Xe and SF6. These results are plotted by the
dashed lines in Fig. 4. This figure shows the agreement, within 10%, of absolute gain
coefficient determinations using two different and independent methods. The agreement
between the measurements and the calculations is remarkable given the uncertainties
inherent in mode-matcing and overlapping two counter-propagating laser beams for 50
passes. Thus we believe the present technique can be used to obtain absolute gain
coefficients at the 10- uncertainty level for unknown gases and liquids.
Lastly, we have measured the Brillouin frequency shifts (center of Rayleigh line to center
of Brillouin line) as a function of gas density. The data are plotted in Fig. 5. In SF6, the
vertical spread in the data at 20.5 atm shows typical variations for three successive scans
without any changes in the experimental apparatus, while the vertical spread near the 6 atm
region shows the variations for data taken on different days with the frequency scale
recalibrated between the two different days. These variations give an indication of the size
of the systematic errors associated with our measurements. The Brillouin shift, MB, is
related to the sound velocity, v, by Eq. 1 and has been previously studied 12 in SF6 with
spontaneous Brillouin experiments. The result of Ref. 12, also shown in Fig. 5, consists
of an empirical relation for the density dependence for the sound velocity and is consistant
with the current measurement. In contrast, the current Xe measurements are larger than the
0-5

standard sound velocity equation (see caption) at 20 atm. We believe that this discrepancy
in Xe is real since the difference is slightly larger than the error bars determined by the
scatter in the SF6 data.
In conclusion, we report the developement of a high resolution, high sensitivity
stimulated Brillouin spectrometer. The system has been demonstrated with gas phase Xe
and SF6, in which we have measured absolute gain coefficients to 10% accuracy and
lineshapes (linewidths and line shifts) to a few per cent accuracy. These types of
measurements will be important for the modeling of the SBS process. In addition, with
modest improvements in the signal-to-noise zatio and the frequency resolution, it should be
possible to obtain lineshapes accurate enough to yield new information on the collision
potentials 13 associated with atomic collisions.
REFERENCES
1. Optical Phase Coniugation, Robert A. Fisher, Ed. (Academic, New York, 1983)
Chapter 1.
2. B. Ya. Zel'dovich, V. I. Popovichev, V. V. Ragul'skii, and F. S. Faizullov, Sov.
Phys. JETP 15, 109 (1972).
3. Marcy Valley, Gabriel Lombardi, and Robert Aprahamian, J. Opt. Soc. Am. B3,
1492 (1986)
4. C. Y. She, G. C. Herring, H. Moosmuller, and S. A. Lee, Phys. Rev.Lett. S1,
1648 (1983).
5. S. Y. Tang, C. Y. She, and S. A. Lee, Opt. Lett. _, (1987).
06

6. A. Sugawara, S. Yip, and L. Sirovich, Fluids 11, 925 (1968)
7. M. J. Damzen, M. R. H. Hutchinson, and W. A. Schroeder, IEEE J.Quantum
Electron. QE-23, 328 (1987).
8. J. H. Dymond and Smith, The Virial Coefficients of Pure Gases and Mixtures,
(Oxford Univ. Press, New York, 1980) pp. 192 and 251.
9. W. R. Trutna and R. L. Byer, Appl. Opt. 19, 301 (1980).
10. W. Kaiser and M. Maier, "Stimulated Rayleigh, Brillouin, and Raman
Spectroscopy," in Laser Handbook, Vol. 2 (North Holland, Amsterdam, 1972) pp.
1077-1150.
11. Landolt-Bornstien, Zahlenwerte und Funktionen IL. Band. 8. Tiel, Optishe
Konstanten (Springer-Verlag, Berlin, 1962).
12. C. M. Hammond and T. A. Wiggins, J. Acoust. Soc. Am. 52, 1373 (1972).
13. N. A. Clark, Phys. Rev. A 12, 232 (1975).
0-7

FIGURE CAPTIONS
1. Experimental set-up for backward coherent Brillouin scattering. We use 50 passes
in a multipass cell that has a single-pass transmission (window losses and mirror
reflectivity combined) of R - 0.985. Laser powers into the cell are 70 and 150 mW
for the pump (ring-dye) and probe (ion) respectively.
2. Rayleigh-Brillouin lineshape for 5540 tort of SF 6 at room temperature. Dots show
data, while the solid line shows a fit that consists of Lorentzians for the Brillouin
gain and loss peaks and a Lorentzian derivative for the central Rayleigh peak.
3. Pressure dependence for Brillouin linewidths. The solid/dotted lines show
linewidths derived from the decay time measurements of Ref. 7, while the direct
measurements of this work are shown for Xe (triangles) and SF 6 (squares).
4. Pressure dependence of Brillouin gain coefficients at 568 nm. The present results
for Xe (triangles) and SF 6 (squares) are shown along with calculations of Eq. 5
(dashed lines). The H2 Raman gain for the Q(l) vibrational transition (solid line) is
shown for comparison.
5. Pressure dependence of the Brillouin shifts. Current results(squares for SF 6 and
triangles for Xe) are compared to the results of Ref. 12 (solid curve) for SF6 and
the sound velocity equation (dotted curve), v (y dp/dp)0.5 S, for Xe, where y is the
heat capacity ratio Cp/Cv - 5/3.
0-8

I A-0 ModulatorIL
50 PassesI
I xlooo~jt [VI Amplifier Lock-In
Diode
Ar+-IonSingle-modeAr+'I- Tunable Dye Laser
] Single-mode Kr-,o.JA-m-7123-74
Fig. 1
0-9

+3.00 5540 torr SF6
0 +2.000 FWHM 60 MHz
w +1.0
'E0 .0C•
0- -1.0 - 494 MHz
Co',
Co
0- -2.0
D -3 .0 I I I I i I I I
0 500 1000 1500 2000 2500
Relative Pump Laser Frequency (MHz)
JA-7123-90
Fig. 2
0-10

240
N180
.120S \Xe
LL 60SF6 -•.- =-
0 I I I I I I I I
0 5 10 15 20 25Pressure (atm)
JA.7123-SB
Fig. 3
0-11

625
575
S525
00
475
0 5 10 15 20 25
Pressure (atm)
JA-7123-89
Fig. 4
0-12

20
_/0~15SF6
S- ~/
10d
"!- /0"--10-/ /~X
0 -xo / -- A5 H20(1) Raman /
0 •J .• • i I I I I I
0 5 10 15 20 25
Pressure (atm)JA-7123-87
Fig. 5
0-13

Appendix P
HIGH-POWER 80-ns TRANSFORM-LIMITED Nd:YAG LASER
SPIE 912, 32 (1988)

Rertnt e or, SPIE Vol 912-Pulsed Single-FrueQuo.n Laws Twhnoiogy a" Aopicatonsa 198• by th. Societv of Photo-Optical Ilnsruinen.ation Enqi$nas. Box 10 Bellnqam WA 98227.•tO USA
High-power 80-ns transform-limited Nd:YAG laser
Mark J. Dyer and William K. BischelChemical Physics Laboratory, SRI International
Menlo Park, CA 94025
and
David G. ScerbakElectro-Optics Technology
Fremont, CA 94538
ABSTRACT
The construction and operation of a long pulse, single-mode Nd:YAG laser isdescribed. The laser is configured around an injection-seeded, unstable oscillator/singleamplifier and produces 80 ns pulses at 10 Hz with pulse energies of over 300 mJ. Whenfrequency doubled, the infrared is converted to a 56 ns pulse at 532 nm with a Fourier-limited linewidth of 8 MHz. This approach brings the Nd:YAG source to within the bandwidthdomain normally dominated by visible CW lasers, but at a considerably higher power, thusproviding an attractive alternative for applications in high resolution spectroscopy andnon-linear studies.
1. INTRODUCTION
The importance of narrowband laser light to high resolution spectroscopic studies iswell recognized. While pulsed sources have found some application, the use of linewidth-narrowed and stabilized CW ion and dye lasers has long been the convention in fulfillingexperimental requirements for narrow bandwidths of better than 10 MHz. Unfortunately, CWlasers rarely provide line-narrowed powers greater than several watts without extraordinaryattention to stabilization and cooling requirements. For kilowatt or greater powers, pulsedsources appear far more practical and efficient, but only if the coherence properties of CWlasers can be emulated. With the recent development of laser-diode-pumped, single-modeNd:YAG lasers',2, 3 and the demonstrations of injection locking4' 5 Fourier-limited operationof high-power Nd:YAG lasers is now easily performed and commercially available. Though mostattention has been directed toward highest power pulse durations of around 10 ns, to producelinewidths of less than 10 MHz, pulses of greater than 44 ns must be generated.
The production of long single mode pulses in Nd:YAG may be approached in severalways. Certainly the most versatile source would result from chain amplifying an acousto- orelectro-optically shaped single mode CW laser emission. In order to compete with the powerlevels of other available continuous lasers, however, this method can become quite costlyand complex, though multipass slab amplifier geometries promise to make this a moreattractive technique.6 Long pulses may also be generated in stable or unstable Q-switchedNd:YAG oscillator configurations. Lengthening the pulse build-up time or forcing thestimulated photons within the cavity to circulate longer before saturating the rod gainresults in a longer ejected pulse. Furthermore, injection locking these longer pulses to asingle mode master frequency yields narrowband light robust enough for immediate poweramplification.
We have constructed a stable source of high power, Fourier transform-limited, 80 nswide laser pulses using an injection-seeded unstable resonator and a single stage ofamplification, which provides more than 300 mJ of output energy per pulse. The design is aslightly modified version of an earlier system, 7 but the technique may certainly be appliedto virtually any Q-switched resonator.
2. SYSTEM DESCRIPTION
The entire system, illustrated in Fig. 1. consists of five principle stages: masteroscillator, slave oscillator, isolation, amplification and frequency doubling. The masteroscillator is a Lightwave Electronics S-100 Injection Seeding System. It is a compactpackage housing a well-stabilized, laser-diode-pumped, single-mode Nd:YAG ring laser,Faraday isolator and associated electronics, and provides almost 2.5 mW of CW power in a1 mm diameter beam at its output. The seeder is directly mounted to the Invar resonatorstructure within a Molectron MY34-10 Nd:YAG laser. This modified chassis contains the slaveoscillator, an adaption of a self-filtering unstable resonator 8 design, isolation andamplification stages, and frequency doubling and harmonics separation optics.
32 / SPIE Vol. 912 Pulsed Single.Frequency Lasers Technology andApplications (1988)
P-1

[CW master oscillator! MlIPCk
M2 owl !QW:21 Aperture Cell M3
M4 P2 M5
KDP -f.l. M9
Figure 1. Component schematic for single-mode long pulse generation and amplification.
2 M.71P6 Mast lave oscillator
The master frequency from the seeder is polarization-coupled into the self-filteringunstable resonator (SFUR), where it effectively fills the entire volume of a 7mm X 110mmNd:YAG rod housed in a Quantel SF51107 dual flashlamp pump chamber. When the flashlamps arefired, the rod gain is swept by aproximately .65 mW from the seed laser until Q-switchaction is initiated. At the peak of the rod gain, the Q-svitch is opened, momentarilyclosing the cavity off Co the seed and permitting the master frequency to be resbnantlyamplified within the slave. A piezo stack mounted behind the end reflector M3 andcontrolled by Q-switch buildup time (QSBUT) reduction electronics 9 in the S-100 seederprovides active stablization of the slave cavity length in order to support the masterfrequency. Quarterwave plates on either side of the rod provide the necessary suppressionof spatial hole burning° and adjustable outcoupling. When operated at high flashlampenergies near the limits of Q-switch hold-off, this resonator produces more than 200 mi in10 ns on a single axial mode and with near diffraction-limited beam quality.
2.1.1 Long pulse generation
200- .Stretching the pulses of a Q-switched resonator was rather
straightforward. It could have been150 t accomplished either by increasing the
length of the oscillator, introducinghigher intracavity losses, or by
cn 0e 80nsy bl tm e changing the gain of the active
oi amedium. Lengthening the slave cavity
* considerably to obtain 80 ns pulsefrq y ewidths was quickly dismissed due toof t hconsiderations of mechanicalab
and space limitations. We avoided2 introducing additional lossy elements0 S into the cavity because they would
0 -'... 0 €S 100 150 200 also reduce the seed laser powerpresented to the rod and possiblyPuIseLengthatFWHMinns degrade spatial performance. The two
Figure 2. Plot of the energy per pulse as a alternatives available to us tofunction of pulse duration for the injection increase the losses, Q-switch controlseeded SFUR cavity, and quarterwave plate rotation to
SPlg0Vo 972 Pul$e Sing/c-frqueny Lasera technology and Applicati•s (1988sl/ 33
P-2

diminish feedback, met with limited success.Long pulses were created, but they proved moredifficult to control and injection seed thanthose produced simply by lowering the appliedflashlamp energy and, therefore, the gain of therod. With some repositioning of end reflectorM4 to compensate for differences in rod lensing,
(a) this master/slave combination yielded seededpulses continuously variable in width from 10 nsto as much as 180 ns at FWHM, with relativelyhigh energies. Fig. 2 shows the variation ofoutput energy with pulse length and Fig. 3- illustrates the pulse shapes of the long pulses.
Active stabilization of the slave cavityfor 80 ns pulse generation is only slightly moredifficult than for 10 ns pulse operation.Because the 80 ns pulses emerge from the slave afew hundred nanoseconds past the Q-switchtrigger, instead of less than 100 ns for the 10ns pulse, a corresponding delay had to beintroduced into the trigger of the seederfor its QSBUT reduction electronics to lockproperly (this was less invasive than changing
(b) the dynamic range of the reduction circuit).Also, since the output timing of the slave isprocessed by the reduction electronics via aphotodiode monitoring the weak back reflectionF off a polarizer in the seeder, the photodiode| |* l signal had to be boosted for the lower long
- ' pulse intensities. Taking precautions toisolate the slave resonator from mechanical
Figure 3. Oscilloscope traces of the vibrations was the last concern before long terminjection-locked long pulses at 1.064um stable operation was possible. The final outputfor (a) 80 ns and (b) 180 ns at FWHM. at 80 ns was 10 mJ at 1.064 um with aprox. ± 10
ns timing jitter, attributed mostly to pulsebuild-up statistics, and lessthan 2 MHz frequency dither,determined by the piezo movementand the slave cavity's free-spectral range, imposed on thebandwidth from the activestabilization by the seeder.Figure 4 presents a spectrum ofthe frequency doubled output at
(a) 532 nm taken with a scanningconfocal interferometer.
2.2 Isolation
(b) Of paramount importance to
the stability of the seededresonator for the purpose ofpower amplification is theinsertion of an optical isolatorbetween the oscillator andamplifier. This decouples the
I two stages, preventing1.50 GHz spontaneous emission in the
amplifier from propagating backFigure 4. (a) Temporal profile of the second into the oscillator, during theharmonic and (b) optical spectrum of the .532um buildup of the long pulse, andshows good agreement with the expected Fourier- competing with the injectedtransform bandwidth of 8 Mhz to within the resolution frequency. Without adequateof the scanning confocal interferometer. isolation, seeding is at best
erratic ard active lockingimpossible. The isolation stage consists of a permanent magnet Faraday rotator manufacturedby Electro-Optics Technologies and positioned between paired thin film polarizers and aGlan-laser polarizer. With AR-coatings and a clear aperture of 8.5 mm, the entire isolator
34 / SPIE Vol. 912 Pulsed Single-Frequency Lasers: Technology and Applications (1988)
P-3

assembly furnishes an isolation of greater than 40 dB with less than 10% total insertionLoss.
Tracing the optical path in Fig. 1, the linearly polarized output from the slave cavityis rotated 45' from vertical by the halfwave plate HW1 , then transmitted through the thinfilm polarizers P4 and P5 before entering the Faraday rotator, where the polarization isrotated 45' back to the vertical and passed through the Glan-laser polarizer P6. The beamis then retroreflected through a quarterwave plate, used only for beam attenuation in thisscheme, and presented to the amplification stage by polarization coupling off polarizer P7.
600 -+ Double-pass, seeded +
S500 * Double-pass, unseededS0
.C +
S 400
C 3000. +
2 200 0
w + 01 100 1 0 Single-pass, seeded
- I a * Single-pass, unseeded
0 I I " a
20 30 40 50 60
Amplifier Flashlamp Energy in Joules
Figure 5. Single and double pass energy plots versus applied flashlamp energy for seeded
and unseeded operation.2.3 AMPLIFICATION
Amplified energies of several hundredmillijoules were initially achieved with single-pass amplification through a Nd:YAG pump chamberidentical to that used in the oscillator
(a) cavity. With less than 10 mJ into the rod,however, flashlamp-pumping the rod hard enoughto reach these energies severely distorted thespatial quality of the output beam and left thegain unsaturated. A polarization-multiplexed,double-pass geometry was then adopted. Thevertically polarized beam reflection frompolarizer P7 passes through the rod,retroreflects off mirrcr M9 through aquarterwave plate, where it undergoes a fullhalfwave rotation, and then passes back throughthe amplifier. The amplified beam is thentransmitted by P7 and down-collimated forfrequency conversion. For this amplificationscheme, the Faraday isolator was particularlyvaluable because It removed any undesirableenergy rejected from P7 that might retrace theoptical path back to the oscillator. Theresults of the single- and double-passamplification schemes are shown in FiR. 5
Figure 6. Pulse broadening related tolain saturation for (a) 450 mJ and (b)540 mJ double-pass output at 1.064 pm.
SPIE Vol 912 Pulsed Single-Frequency Lasers:Technology and Applications (1988)/ 35
P-4

We confirmed that gain saturation was occuring above 300 mJ for double-passamplification but observed that the pulse broadened in time. As seen in Fig. 6, the pulsewidth increases by 150% for a flashlamp energy of 60 Joules and a total pulse energy of 540mJ.2.4_Freauenpy doublin&
Frequency doubling efficiencies of the high power pulses are under investigation atthis time. With 50% down-collimation after the amplifier, we expect at least 10% conversionefficiency for the unbroadened 80 ns output. Spectral analysis of the doubled high powerwill determine if additional frequency components are created by the amplification anddoubling stages, and significantly influence the bandwidth integrity of the unamplifiedemission.
3. DISCUSSION
We found that pushing this technique further to longer pulses appears possible, butowing to mechanical and thermal instabilities in our slave resonator, the extremely longpulse build-up times and subsequent timing jitter of the pulse evolution, the seeder could
not maintain adequate lock for more than a fewseconds for pulses greater than 100 ns. By modifyingthe dynamic range and time constant of the time-reduction circuit within the seeder, and improvingthe mechanical and thermal stability of the slavecavity, we hope to push this system as far as themaster oscillator will successfully seed the SFUR
I- cavity. With .65 mW of injected power, this limitappears to be just under 200 ns before mode-beatingoscillations appear on the pulse waveform. Thisrestriction, along with the relative pulse builduptimes of different pulse lengths, is illustrated by
•-•, -wm•'.•-Fig. 7.
Figure 7. Oscilloscope traces superimposed to demonstrace the limits of this technique for.65 mW of injected seed power. Long pulses may be seeded from 10 ns to just under 200 nsbefore oscillations appear on the waveform.
4. CONCLUSION
We have demonstrated that long pulse, narrowband operation of injection-seeded Nd:YAGlasers is possible by varying the applied flashlamp energy to the slave oscillator. Withminor modifications and the addition of optical isolation between oscillator and amplifier,the output is stable and may be power amplified directly to produce several hundredmillijoules of 1.064 um radiation with a bandwidth of less than 10 MHz.
5. REFERENCES
1. B. Zhou, T.J. Kane, G.J. Dixon, and R.L. Byer, "Efficient, frequency-stable laser-diode-pumped Nd:YAG laser," Opt. Lett. 10, 62-64 (1985).
2. T.J. Kane and R.L. Byer, "MonoT-thic unidirectional single-mode Nd:YAG ring laser,"Opt. Lett. 10, 65-67 (1985).
3. W.R. Trutna, Jr., D.K. Donald, and M. Nazarathy, "Unidirectional diode-laser-pumpedNd:YAG ring laser with a small magnetic field," Opt. Lett. 12, 248-250 (1987).
4. Y.K. Park, G. Giuliani, and R.L. Byer, "Stable sing-Te-axial-mode operation of anunstable-resonator Nd:YAG oscillator by injection locking," Opt. Lett. 5. 96-98 (1980).
5. R.L. Schmitt and L. Rahn, "Diode-laser-pumped Nd:YAG laser injection seedingsystem," Appl. Opt. 25, 629-633 (1986).
6. T.J. Kane, W.--J. Kozlovsky, and R.L. Byer, "62-dB-gain multiple-pass slab geometryNd:YAG amplifier," Opt. Lett. 11, 216-218 (1986).
7. M.J. Dyer, D.G. Scerbia-, and W.K. Bischel, "Injection seeding of a self-filteringunstable resonator using a cw diode-pumped Nd:YAG ring oscillator," (in preparation, 1988).
8. P.G. Gobbi, S. Morosi, G.C. Reali, and A. Zarkasi, "Novel unstable resonatorconfiguration with a self-filtering aperture: experimental characterization of the Nd:YAGloaded cavity," Appl Opt. 24, 26-33 (1985).
9. L.A. Rahn, "Feedbac--k stabilization of an injection-seeded Nd:YAG laser," Appl. Opt.24, 940 (1985).
10. E.S. Fry and S.W. Henderson, "Suppression of spatial hole burning in polarizationcoupled resonators," Appl. Opt. 25, 3017 (1986).
36 / SPIE Vol. 912 Pulsed Single-Frequency Lasers: Technology and Applicaiions (19881
P-5

Appendix Q
LASER FREQUENCY CONVERSION USING TWO-PHOTON EMISSION INBARIUM VAPOR
Conference on Lasers and Electro-Optics (CLEO 88)25-29 April 1988, Anaheim, CA

VM34 LASER FREQUENCY CONVERSION USING TWO-PHOTONEMISSION IN BARIUM VAPOR
James J. Silva, C. C. Liu, Kenneth Y. Tang, Western Research Corporation;David L. Huestis, SRI International
ABSTRACT
We calculate the nonlinear susceptibility for conversion of ultraviolet krypton fluorideexcimer laser radiation to the visible using stimulated two-photon emission in barium vapor anddiscuss results of an experiment to measure this conversion.
Q-1

FREQUENCY HALVING
--- USES NONLINEAR MEDIUM (ATOMIC BARIUMVAPOR) TO GENERATE TWO VISIBLE PHOTONS FROMONE UV PHOTON.
()0KrF - ()C02 = 2wF.H. + AMetastable
--- SCHEME IS A HYPER-RAMAN PROCESS. NO PHASEMATCHING IS REQUIRED, AND HIGH EFFICIENCY ANDBEAM CLEANUP CAN BE EXPECTED.
--- LARGE FREQUENCY DOWNSHIFT FROM KrF(248nm) TO VISIBLE (660nm) DOES NOT RESULT INLARGE ENERGY WASTE AS IT WOULD IN RAMANSHIFTING BECAUSE TWO VISIBLE PHOTONS COMEOUT FOR ONE UV PHOTON IN.
--- HIGH EFFICIENCY VISIBLE LASER POSSIBLESTARTING WITH EFFICIENT KrF EXCIMER LASER
--- OUTPUT AT 660nm IS IDEAL BECAUSE OF HIGHOPTICS DAMAGE THRESHOLDS AND LOWATMOSPHERIC SCATTERING
Q-2

0 o
0m
u L -C C- 0)
w
w'I-C.)d
-I 0
C, 0000liii 0
C.0.
UJIU)UZo MW
a. Iii hII- U
0 cm:1 2Cc C.~I
N1 I IILn
00
Q-3

FREQUENCY HALVING GAINEQUATION
--- FREQUENCY HALVING PROCESS INVOLVES ASEVENTH ORDER NONLINEAR SUSCEPTIBILITY
--- HIGH SUSCEPTIBILITY REQUIRES NEARLYRESONANT INTERMEDIATE LEVELS
-- KrF AND CO2 LASERS CAN BE TUNED FORSTIMULATED RAMAN SCATTERING TO-BARIUM LEVELAT 39335 cm"1
--- SUBSEQUENT STIMULATED TWO-PHOTONEMISSION TO LEVEL AT 9034 cm"1 IS DETUNED BYONLY 7cm- 1 FROM INTERMEDIATE LEVEL AT 24192cm-1
Q-4

-- SUSCEPTIBILITY IS A FUNCTION OF LASERPOLARIZATION. FOR LINEAR POLARIZATIONS, KrFAND C02 POLARIZATIONS MUST BE PERPENDICULARTO EACH OTHER.
--- CALCULATION OF SUSCEPTIBILITY INVOLVESSUMS OVER INTERMEDIATE LEVELS OF PRODUCTSOF EIGHT TRANSITION DIPOLE MOMENTS DIVIDED BYPRODUCTS OF SEVEN DETUNINGS OR LINEWIDTHSX(7)(
X (- F wH.0KrF - wC2 - 'OF.H. WF.H. 0CO 2 - OKrFWF.H.)
= (N/i rA 2 )(2x 10-43) cm9/erg 3
WHERE N=ATOMIC NUMBER DENSITY (cm' 3),A=DETUNING FROM S.R.S. RESONANCE (cm-1) ANDr'=LASER LINEWIDTH (cm-1)
-- GAIN EQUATION FOR VISIBLE SEED
dIF.H!dz -= (6x 1042) (N/f`A2 )IKrFIco0(IF.H.)2 (cm2 /watt)3 (1/cm)
Q-5

WE
LU
>- L
0..
4 0
I~Ll
rxCL
UL
z
0
IM L
wU),
U.-
Q.-um6

IIQj E
zo~
LUU0<
cI--z L
o <<c0c
I-- <U >C 0
0J LU oJu.. U)> <
o > Ow
00 <-aC.)- U
<00 Z00
LLU0zo ~0Z
< a.0
Q En7

FREQUENCY HALVINGEXPERIMENTAL PARAMETERS
--- TO AVOID OPTICAL DAMAGE TO COATINGS, FINALEXPERIMENT INCORPORATED COLLIMATED BEAMSCROSSING AT VERY SMALL ANGLES IN BARIUMVAPOR
--- BARIUM VAPOR CONTAINED IN ALUMINA HEATPIPE (TOP TEMPERATURE ABOUT 1200 CELSIUS)WITH ARGON BUFFER GAS (ABOUT 20 TORR) ANDBaF2 WINDOWS TO TRANSMIT BOTH KrF (248nm) AND
CO 2 (10.6p) LASER RADIATION
--- CO2 LASER AND VISIBLE DYE LASER -POLARIZEDVERTICALLY AND INCIDENT FROM ONE END, KrFLASER POLARIZED HORIZONTALLY AND INCIDENTFROM THE OTHER END
--- LASER PARAMETERS FOR CENTRALOVERLAPPING 50 cm IN BARIUM VAPOR (+/- 20%)
C0 2: 1000 mjoule on 0.5 cm 2 in about 1 ps with a peakintensity in first 100 ns of 3.3 MW/cm 2 . Single linebandwidth of 0.07 cm-1
KrF: 55 mjoule on 0.2 cm2 in 16.2 ns, with 75%narrowband in correct polarization for12.7 MW/cm 2 . Bandwidth 0.05 cm- 1, tunable inmode hopping increments of about 0.2 cm-1
Visible: 0.52 mjoule on 0.005 cm2 in 8.7 ns for11.5 MW/cm 2 . Bandwidth 0.1 cm- 1, tunable in0.05 cm- 1 increments
Q-8

EXPERIMENTAL PROCEDURE
--- BEAM OVERLAP ASSURED BY CHECKING BEAMPOSITIONS AT BOTH ENDS OF BARIUM CELL
-- KrF LASER TUNED TO GIVE MAXIMUM CO2STIMULATED RAMAN SCATTERING TO LEVEL AT39335 cm-1 DETERMINED BY MAXIMIZINGSUBSEQUENT 470 nm AMPLIFIED SPONTANEOUSEMISSION TO LEVEL AT 18060 cm"1.
--- RELATIVE TIMING OF LASER PULSES SET TOMAXIMIZE A.S.E.
-- TIMING OF VISIBLE LASER SET SO THATBEGINNING OF VISIBLE LASER PULSE ENTERS CELLWHEN BEGINNING OF KrF LASER PULES EXITS CELL(RELATIVE JITTER ABOUT 1 ns)
-- KrF LASER DETUNED SOME AMOUNT FROM PEAKOF S.R.S. TRANSITION
-- VISIBLE LASER SCANNED IN WAVELENGTH WHILEIOUTAIN IS MONITORED ON BOXCAR INTEGRATOR ANDPLOTTED AS A FUNCTION OF TIME
Q-9

EXPECTED FREQUENCY HALVINGGAIN
--- FOR TEMPERATURE OF 1150 CELSIUS, BARIUMVAPOR PARTIAL PRESSURE IS ABOUT 28 TORR,CORRESPONDING TO N=2x10 1 7/cm 3
IKrF - 12.7 MW/cm 2, Ico0 - 3.3 MW/cm 2 ,
VISIBLE SEED LASER IF.H. = 11.5 MW/cm 2
--- WIDTH OF KrF - CO2 STIMULATED RAMANTRANSITION WAS MEASURED TO BE ABOUT 1.5 cm-1(AT THIS TEMPERATURE WITH THESE LASERINTENSITIES). A DETUNING OF 1 cm"1 LEADS TO AQUADRATURE A OF 1.8 cm- 1. LASER LINEW1DTH r=0.icm-1 .
Q-1O

--- GAIN EQUATION FOR VISIBLE SEEDdIF.H./dz = (6x10⁻⁴ 2 ) (N/*A 2 )IKrFICol(IF.H.)2 (cm2/watt) 3 (1/cm)
LINEAR GAIN (dlF.H/dz)/AF.H. = .18%/o/cm GIVINGMEASURABLE GAIN OF 9% FOR 50 cm INTERACTIONLENGTH.
-- EQUATION di/dz = a12 HAS SOLUTIONI(z) = (1/A(z=0) - az)-1 LEADING TO COMPLETECONVERISON AT z = 560 cm (IGNORING DEPLETIONOF KrF PUMP BEAM)
--- NO EXPERIMENTS (2% SIGNAL TO NOISE) SHOWEDGAIN
Q-II

wi
Z -- (
0 0
- 7 Q E. W > CJ
cc 0
- 0 0
CL w
E ~ o
z cc
z 00
w - (0
00
wwI.. COW
I .MCI0 0-c
CCoWZ
C',
wm
0-C1a C)o)c

DISCUSSION OF EXPERIMENT
--- BARIUM CHOSEN AS FREQUENCY HALVINGCANDIDATE ATOM BECAUSE OF NEARINTERMEDIATE RESONANCES AND ADEQUATEVAPOR PRESSURE AT ACCESSIBLE TEMPERATURES
FAILURE TO MEASURE GAIN ON VISIBLE SEEDLASER PROBABLY DUE TO TWO FACTORS: LARGERTHAN EXPECTED TRANSITION LINEWIDTHS ANDLOWER THAN EXPECTED DIPOLE TRANSITIONPROBABILITIES
--- MEASURED STIMULATED RAMAN SCATTERINGLINEWIDTH OF 1.5 cm- 1 WAS A FACTOR OF THREELARGER THAN EXPECTED. LARGE WIDTH OFRYDBERG TRANSITION MAY BE DUE TO STARKEFFECT FROM LARGE DENSITY OF IONS ANDELECTRONS CREATED FROM AUTOIONIZATION OFBARIUM ATOMS ABSORBING TWO KrF PHOTONS (ASEVIDENCED BY A.S.E. AT 650nm FROM Ba+)
-- FREQUENCY HALVING LINEWIDTH 1r CALCULATEDAS LASER LINEWIDTH OF 0.1 cm"1 MAY BE LARGERDUE TO ATOMIC EFFECTS
Q-13

--- WHERE POSSIBLE, TRANSITION DIPOLE MATRIXELEMENTS WERE CALCULATED FROM MEASUREDEINSTEIN A COEFFICIENTS. FOR RYDBERGTRANSITIONS, CALCULATIONS WERE BASED ON THECOULOMB APPROXIMATION.
--- SUBSEQUENT EXPERIMENTAL MEASUREMENTSINDICATE THAT ONE CRITICAL TRANSITION MOMENTFROM THE LEVEL AT 24192 cm"1 TO THE LEVEL AT39335 cm-1 MAY BE SUBSTANTIALLY LOWER THANCALCULATED. IT WAS NOT SEEN IN AN ABSORPTIONEXPERIMENT THAT DID MEASURE TRANSITIONS TOOTHER NEARBY RYDBERG LEVELS. THECALCULATED TRANSITION MOMENT WAS BASED INPART ON A PUBLISHED M.Q.D.T. CALCULATIONSHOWING MIXING BETWEEN THE 6s9d 1 D2 AND THE
5d8s 3 D2 LEVELS.
Q-14