9/21/20151 coachella valley 2011 competitiveness? john husing, ph.d. economics & politics, inc
TRANSCRIPT

04/19/23 1
Coachella Valley 2011Competitiveness?
John Husing, Ph.D.
Economics & Politics, Inc.
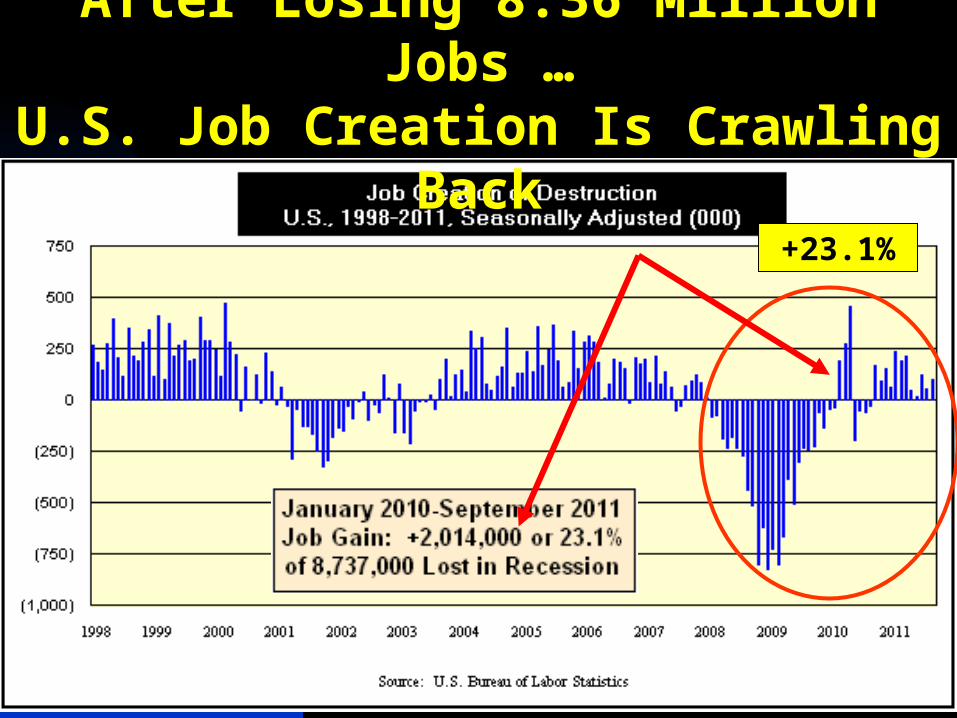
After Losing 8.36 Million Jobs …U.S. Job Creation Is Crawling Back
+23.1%

VV Pattern of Likely Recovery
UUxx

Fear Causing Consumers Confidence To Dive Again

04/19/23 5
So. CA Job Change, 1991-2011e
-488,700 -794,400-9.2%
+4.2%

04/19/23 6
Inland Empire Job Change, 1984-2011e
+20,600
-167,900-13.0%
-0.6%

04/19/23 7
Coachella Valley, Job Changes
-1,879
-14,121-13.0%

04/19/23 8
2nd Worst National Unemployment Rate

04/19/23 9
What About the Future?
… Look At Competitiveness

Labor Cost: 6th Lowest of 9 Markets
04/19/23 10

Labor Force Quality: 8th Lowest of 9 Markets
04/19/23 11

Office Space Cost: 5th Lowest of 9 Markets
04/19/23 12

Industrial Space Cost: Lowest of 9 Markets
04/19/23 13

Natural Gas: 3rd Lowest of 9 Markets
04/19/23 14
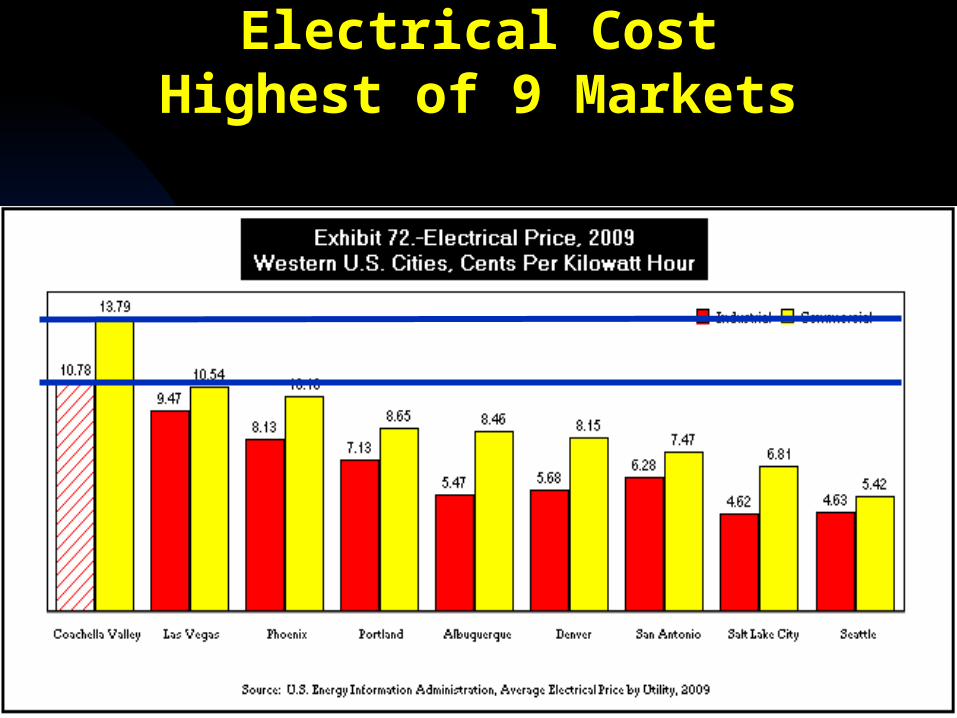
Electrical CostHighest of 9 Markets
04/19/23 15

Home Prices8th Lowest of 9 Markets
Indio 5th Lowest of 9 Markets
04/19/23 16

Water Surprisingly Inexpensive
04/19/23 17
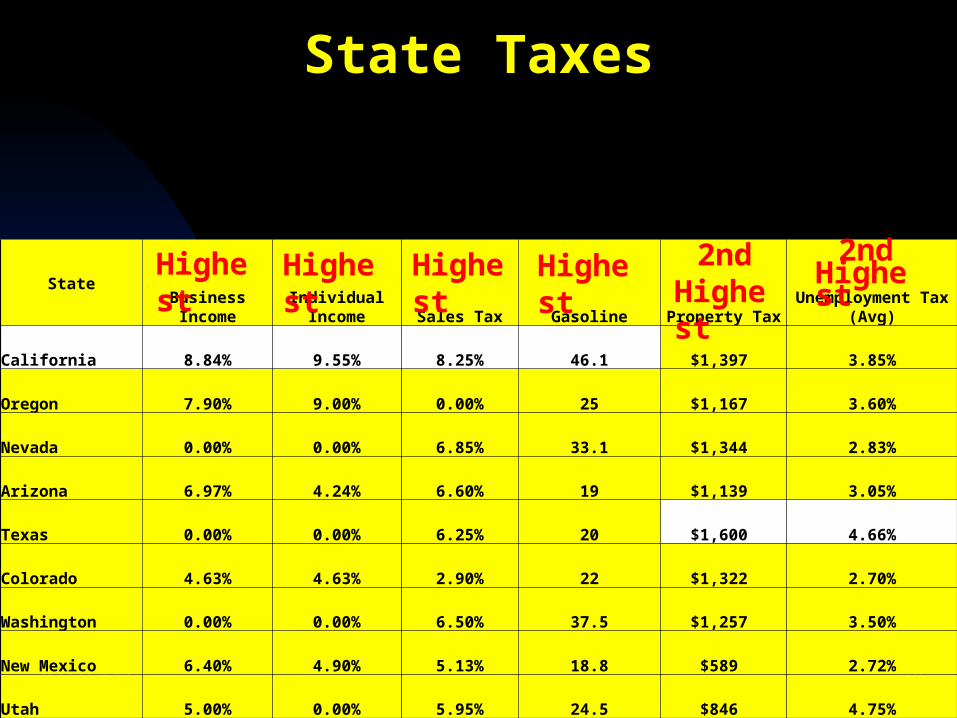
State Taxes
04/19/23 18
State
Business Income Individual Income Sales Tax Gasoline Property TaxUnemployment Tax
(Avg)
California 8.84% 9.55% 8.25% 46.1 $1,397 3.85%
Oregon 7.90% 9.00% 0.00% 25 $1,167 3.60%
Nevada 0.00% 0.00% 6.85% 33.1 $1,344 2.83%
Arizona 6.97% 4.24% 6.60% 19 $1,139 3.05%
Texas 0.00% 0.00% 6.25% 20 $1,600 4.66%
Colorado 4.63% 4.63% 2.90% 22 $1,322 2.70%
Washington 0.00% 0.00% 6.50% 37.5 $1,257 3.50%
New Mexico 6.40% 4.90% 5.13% 18.8 $589 2.72%
Utah 5.00% 0.00% 5.95% 24.5 $846 4.75%
Highest Highest Highest Highest 2ndHighest
2ndHighest
Policy Conflict:
Environment vs. Jobs
State Regulatory Environment

Public HealthBlue Collar Sectors
Bring Rising Asthma Asthma & & CancerCancer Risk From Airborne Toxics

Social Justice
Blue Collar Sectors Hurt Modest Income Families Living Near
Factories, Rail Yards, Ports, Freeways

California Solution
Single Issue Regulatory Agencies
CA Air Resources Board
South Coast Air Quality Management District
CA Environmental Protection Agency
CA Water Resources Control Board
& More

Two Results1. Air Quality Is Improving

BlueBlue Collar Collar Work Is Much of Our Workforce’s Best Chance To Reach The Middle ClassMiddle Class
2. Downward Pressure On Blue Collar Jobs

Few Training BarriersFew Training Barriers To Beginning Employment
Mining ($96,996) Blue Collar
Manufacturing ($47,933) Blue Collar
Logistics ($46,665) Blue Collar
Wholesale Trade ($43,492) Median Blue Collar
Construction ($41,453) Blue Collar
Retail Trade ($28,840)
Gaming ($28,385)
Hotel/Motel ($24,019)
Agriculture ($22,793)
Eating & Drinking ($15,132)
$13,000 Gap

Results Of Job Suppression
• Unemployment Higher Than It Needs To Be
• Underemployment A Constant Difficulty
• Lack of Access to Jobs Leading to the Middle ClassLeading to the Middle Class
• Health Issues of Poverty
• Divorce
• Spousal Abuse
• Drug & Alcohol Abuse
• Suicide
• Lack of Timely Medical Care
Public Health Issues!

Over 60% Of These Populations Also Stopped Their Educations With High School or Less Schooling
Suppressing Blue Collar Jobs Is Also A Social Justice IssueSocial Justice Issue
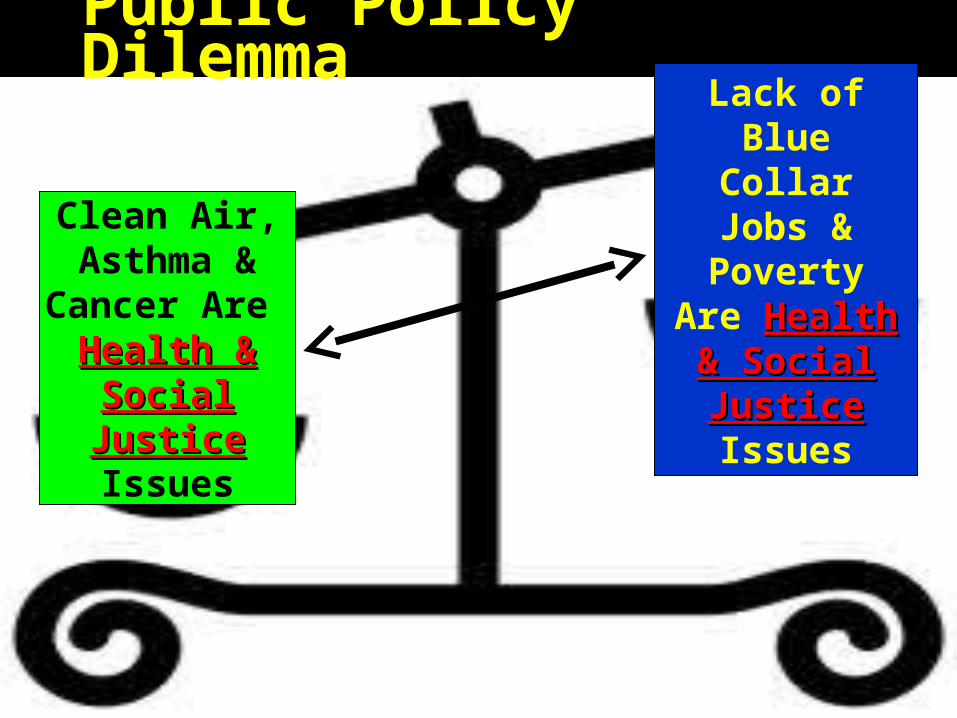
Clean Air, Asthma & Cancer
Are Health & SocialHealth & SocialJusticeJustice Issues
Lack of Blue Collar Jobs & Poverty Are
Health & SocialHealth & SocialJusticeJustice Issues
Public Policy Dilemma

After Years Of Focus on Concentrating Solely On The EnvironmentConcentrating Solely On The Environment
Job Creation Is Our Forgotten PriorityForgotten Priority!!

Competitiveness
04/19/23 30
Coachella Valley C
California F-

Gold Mine Theory
Primary Tier
Secondary Tier
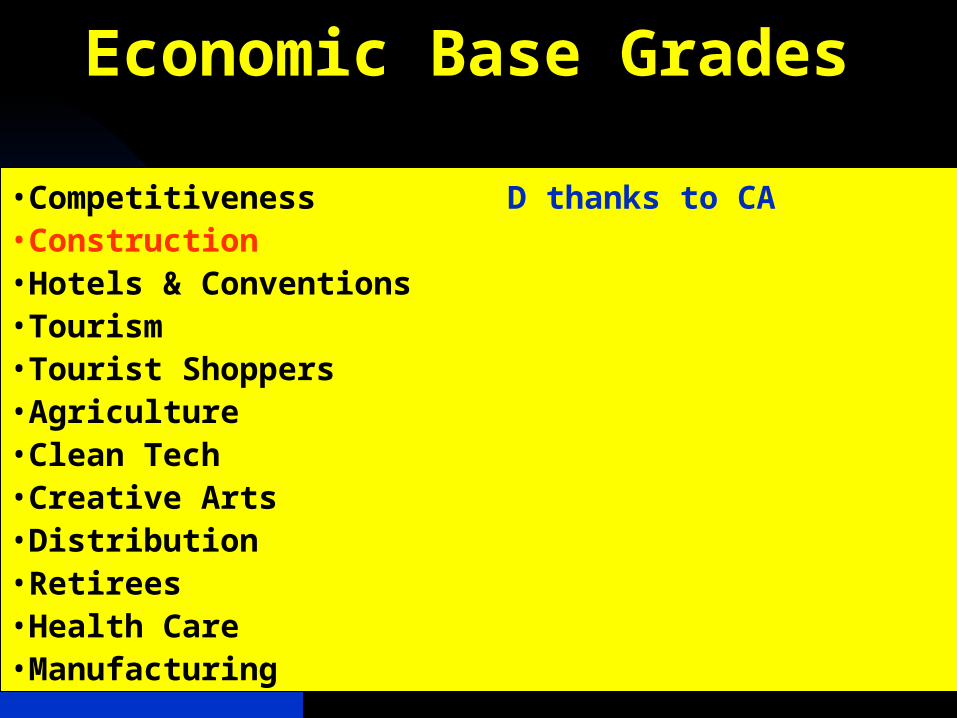
Economic Base Grades
04/19/23 32
•Competitiveness D thanks to CA•Construction•Hotels & Conventions•Tourism•Tourist Shoppers•Agriculture•Clean Tech•Creative Arts•Distribution•Retirees•Health Care•Manufacturing

04/19/23 33
Existing Homes Sales Remain Strong … Thanks To Short Sales/ Foreclosures

New Homes Sales Headed For A Record in 2011 … Thanks To Short Sales/ Foreclosures
04/19/23 34

04/19/23 35
Existing Home Prices Stable Between 2002 & 2003 Level

04/19/23 36
New Home Price Back To 2004Level … Well Above Existing Homes

Foreclosures Issue1,086,305 HomesIn Inland Empire
35.4%All Homes

Assessed Valuation
… Next Move Is UPUP?
04/19/23 39
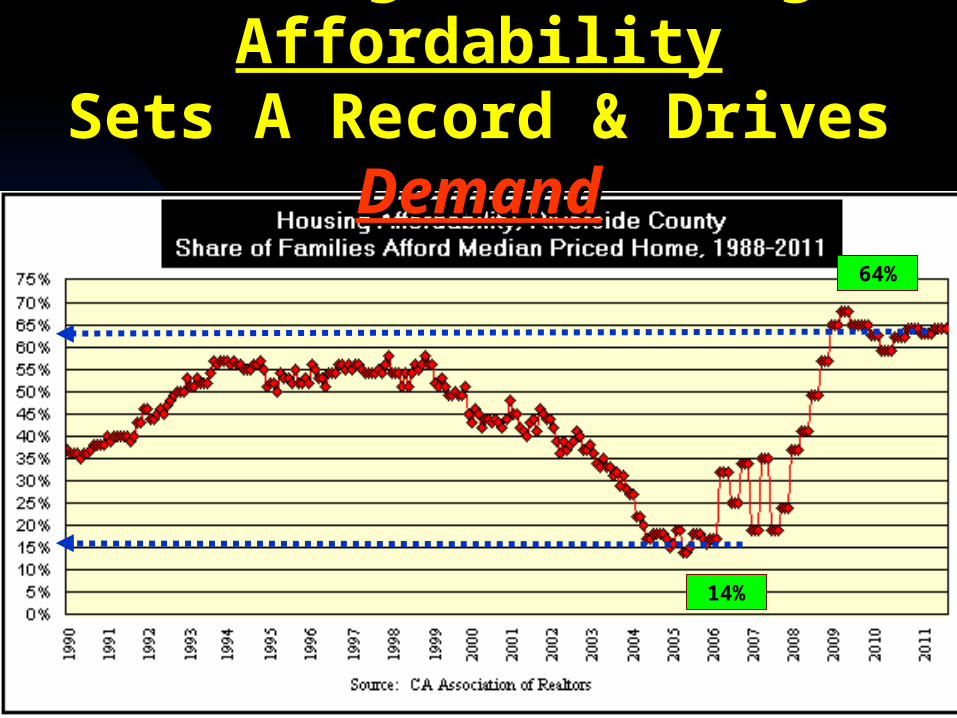
Soaring CV Housing AffordabilitySets A Record & Drives DemandDemand
64%
14%

Competitive Housing Prices
04/19/23 40

Economic Base Grades
04/19/23 41
•Competitiveness D thanks to CA•Construction D-•Hotels & Conventions•Tourism•Tourist Shoppers•Agriculture•Clean Tech•Creative Arts•Distribution•Retirees•Health Care•Manufacturing

Wheeler’s Desert Letter
Hotel Rates, Coming Back!
04/19/23 42
Corporate Meetings & Conventions Coming Back
2nd quarter 2011 Coachella Valley hotel occupancy up 14.8%
Average room rate up 5.4% Palm Springs Desert Community Convention Bureau
Labor Day hotel occupancy is 25% higher than 2010

Airport Volume Flat
04/19/23 43
Need More Flights To Compete With Phoenix-Scottsdale

Increased Tourist Options: Thermal Motor Sports Park
04/19/23 44
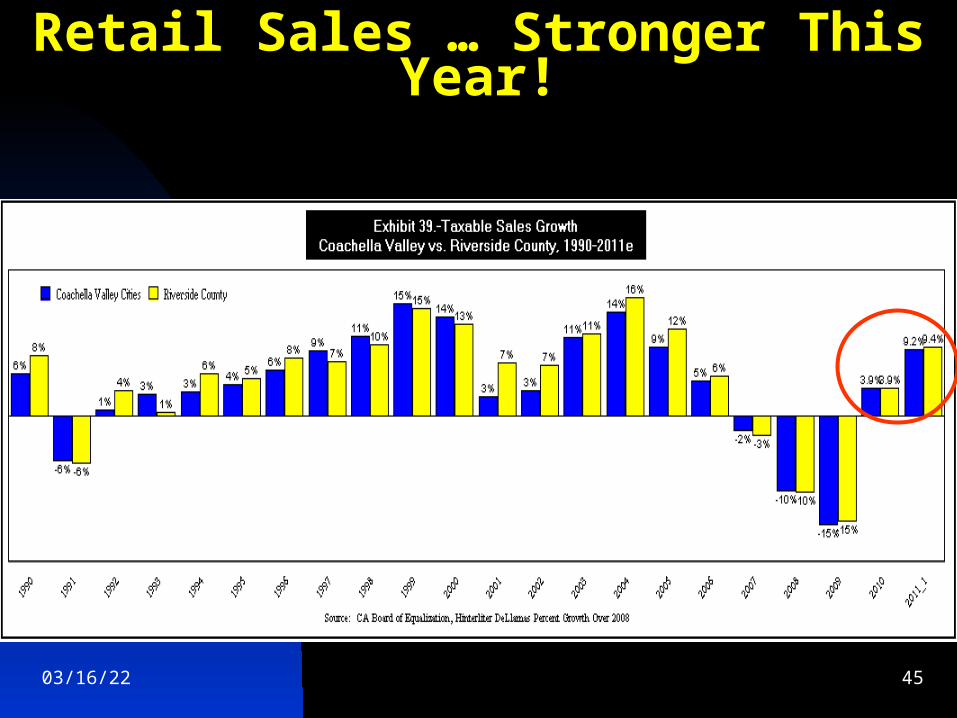
Retail Sales … Stronger This Year!
04/19/23 45

Economic Base Grades
04/19/23 46
•Competitiveness D thanks to CA•Construction D-•Hotels & Conventions C+•Tourism C+•Tourist Shoppers C•Agriculture•Clean Tech•Creative Arts•Distribution•Retirees•Health Care•Manufacturing
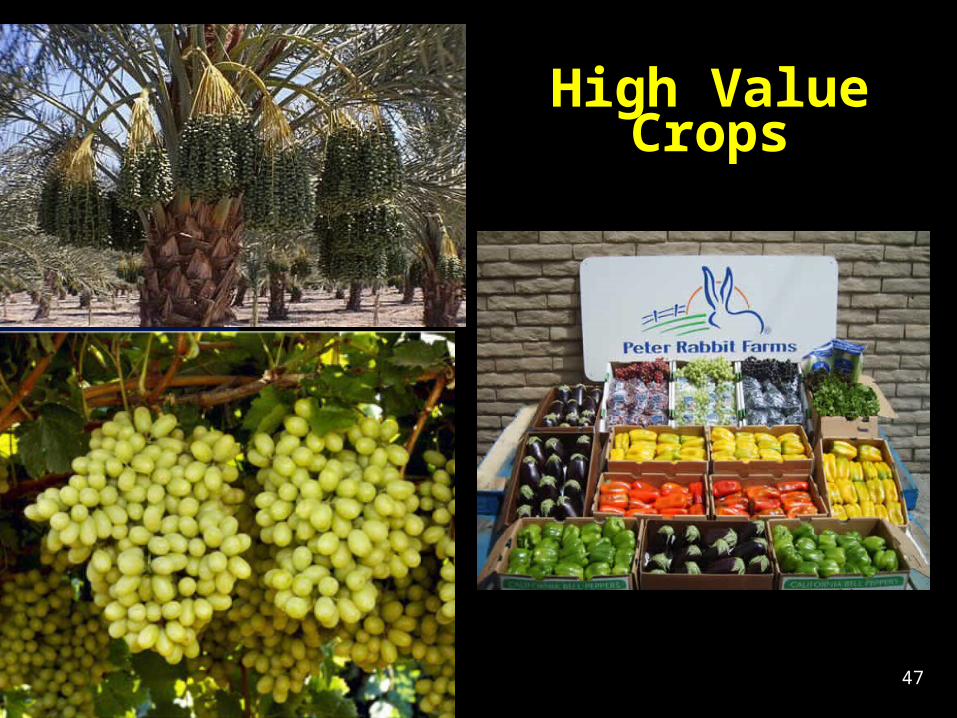
High Value Crops
04/19/23 47

Agricultural Production: A Record
04/19/23 48

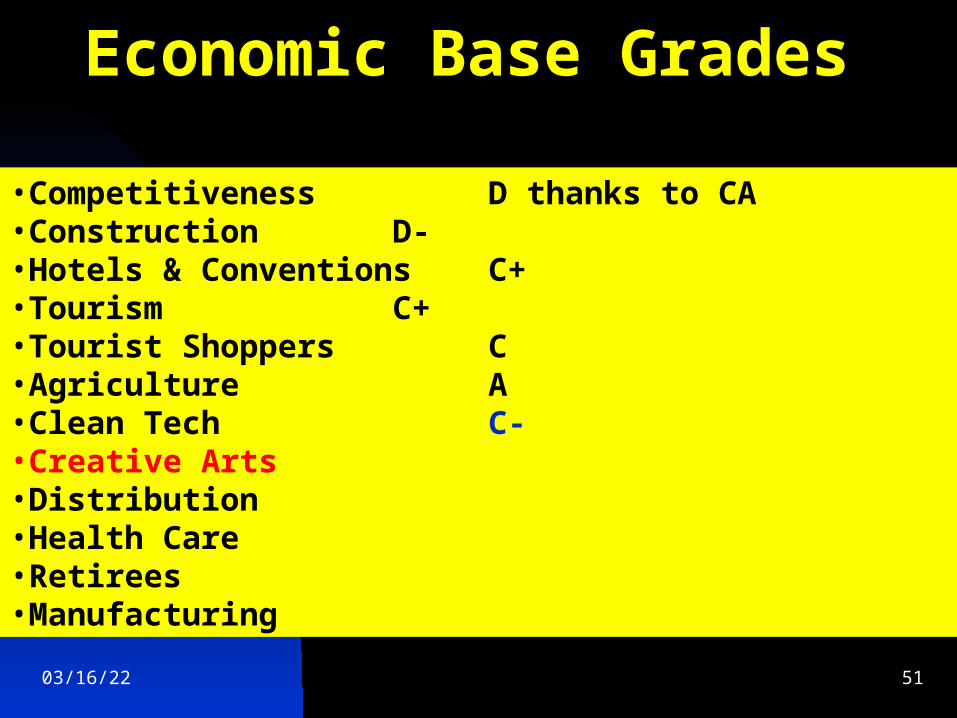
Economic Base Grades
04/19/23 49
•Competitiveness D thanks to CA•Construction D-•Hotels & Conventions C+•Tourism C+•Tourist Shoppers C•Agriculture A•Clean Tech•Creative Arts•Distribution•Health Care•Retirees•Manufacturing

Clean Energy Initiatives
04/19/23 50
DemandProperty Assessed Clean Energy
Financing (PACE)Palm Desert Municipal Program
AB 811Net Metering
DevelopmentSkill Training To Work In the
IndustryElectric Vehicle Production
Economic Base Grades
04/19/23 51
•Competitiveness D thanks to CA•Construction D-•Hotels & Conventions C+•Tourism C+•Tourist Shoppers C•Agriculture A•Clean Tech C-•Creative Arts•Distribution•Health Care•Retirees•Manufacturing

Creative Arts
04/19/23 52
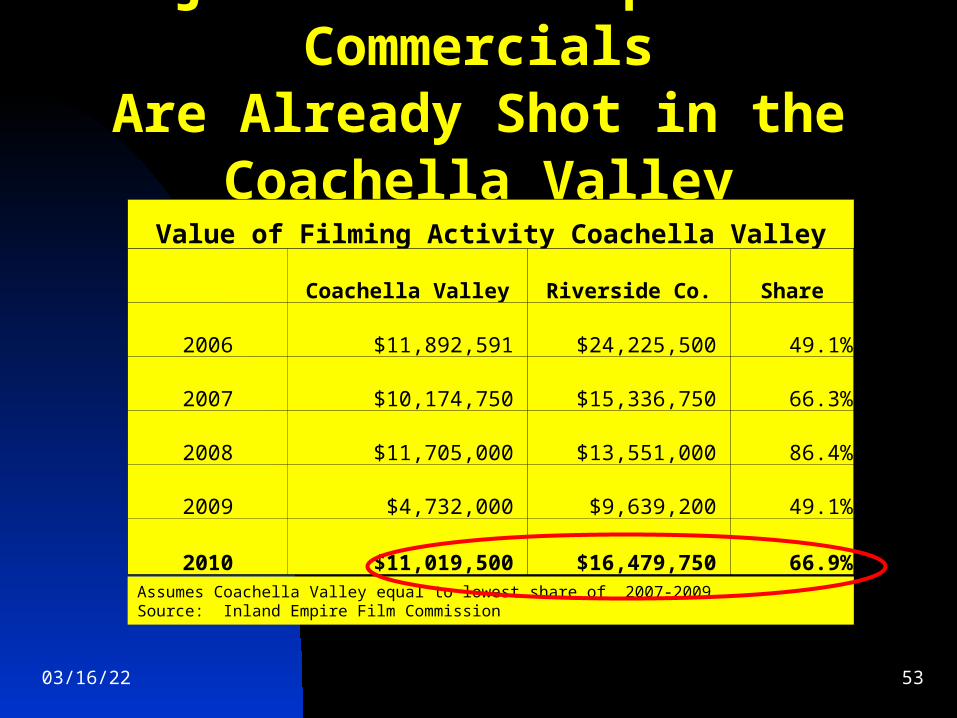
Major Films & Important CommercialsAre Already Shot in the Coachella Valley
04/19/23 53
Value of Filming Activity Coachella Valley
Coachella Valley Riverside Co. Share
2006 $11,892,591 $24,225,500 49.1%
2007 $10,174,750 $15,336,750 66.3%
2008 $11,705,000 $13,551,000 86.4%
2009 $4,732,000 $9,639,200 49.1%
2010 $11,019,500 $16,479,750 66.9%Assumes Coachella Valley equal to lowest share of 2007-2009Source: Inland Empire Film Commission

Economic Base Grades
04/19/23 54
•Competitiveness D thanks to CA•Construction D-•Hotels & Conventions C+•Tourism C+•Tourist Shoppers C•Agriculture A•Clean Tech C-•Creative Arts B-•Distribution•Health Care•Retirees•Manufacturing

Logistics Links
04/19/23 55

Key Transportation Links
04/19/23 56
To East
To Mexico
To East & Mexico
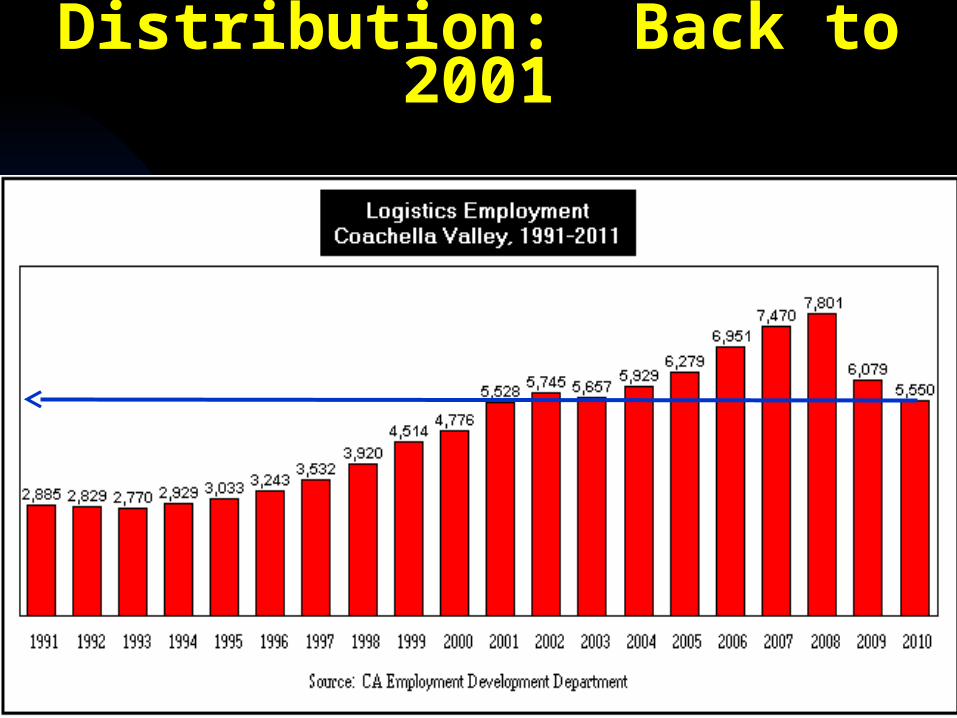
Distribution: Back to 2001
04/19/23 57

Economic Base Grades
04/19/23 58
•Competitiveness D thanks to CA•Construction D-•Hotels & Conventions C+•Tourism C+•Tourist Shoppers C•Agriculture A•Clean Tech C-•Creative Arts B-•Distribution D•Health Care•Retirees•Manufacturing

Facilities & Medical Staff
04/19/23 59

Health Care Employment:Continued Growth
04/19/23 60
OSHPD

Age Distribution: Young & Old
04/19/23 61
19.3 vs. 10.4%
27.6%

Economic Base Grades
04/19/23 62
•Competitiveness D thanks to CA•Construction D-•Hotels & Conventions C+•Tourism C+•Tourist Shoppers C•Agriculture A•Clean Tech C-•Creative Arts B-•Distribution D•Health Care A-•Retirees•Manufacturing

Is the Past … the Future?
04/19/23 63

No Longer Just This
Active Baby Boomer Retirees
04/19/23 64
Now This

Economic Base Grades
04/19/23 65
•Competitiveness D thanks to CA•Construction D-•Hotels & Conventions C+•Tourism C+•Tourist Shoppers C•Agriculture A•Clean Tech C-•Creative Arts B-•Distribution D•Health Care A-•Retirees A•Manufacturing

Manufacturing Jobs, 2011Back To 1997 Level
04/19/23 66

Setting Conditions For The Future
04/19/23 67
•Competitiveness D thanks to CA•Construction D-•Hotels & Conventions C+•Tourism C+•Tourist Shoppers C•Agriculture A•Clean Tech C-•Creative Arts B-•Distribution D•Health Care A-•Retirees A•Manufacturing D
Over All Grade
C- to C

Other Key Current Facts …
04/19/23 68

04/19/23 69
Population Growth Has Slowed

04/19/23 70
Academic Performance

04/19/23 71
What Jobs Grew?

04/19/23 72
Crime Per 1,000 Residents

04/19/23 73
2010, 2011
When Will “Normal” Start To Return?
x2012
If Mortgages Fixed! x2015-2016
Not
x

04/19/23 74
www.johnhusing.com