9 months 2004 results announcement
DESCRIPTION
9 Months 2004 Results Announcement. 26 October, 2004. Scope of Briefing. Address by Executive Chairman Group Financial Highlights Business Review & Outlook. Group Financial Highlights. 9M 2004 Performance. PATMI of S$352m, up 21% from 9M 2003 EPS of 45.4 cents, up 21% from 9M 2003 - PowerPoint PPT PresentationTRANSCRIPT

1
9 Months 2004 Results Announcement26 October, 2004

2
Scope of Briefing
Address by Executive Chairman
Group Financial Highlights
Business Review & Outlook

Group Financial Highlights

4
9M 2004 Performance
PATMI of S$352m, up 21% from 9M 2003
EPS of 45.4 cents, up 21% from 9M 2003
Annualised ROE increased to 15.6%
EVA improved by S$148m over 9M 2003
Free cash flow of S$320m
Divestments of S$160m
0.74x gearing

5
Earnings & EPS GrowthS$m 9M 20039M 2004 % Change
Turnover 4,7312,795 (41)EBITDA 536465 (13)Operating Profit 368346 (6)Profit Before Tax 399478 20PATMI 290352 21
EPS (cents) 37.545.4 21
Solid PATMI and EPS growth
PATMI (excl. deferred tax adjustment)
290338 17

6
S$m9M 2003 %9M 2004 % % Change
Offshore & Marine 1,035 221,632 58 58
Property 611 13550 20 (10)
Infrastructure 618 13556 20 (10)
Sub Total 2,264 482,738 98 21
Investments* 2,467 5257 2 (98)
Total 4,731 1002,795 100 (41)
Turnover by Segments
* Deconsolidation of SPC reduced Investments’ turnover

7
S$m9M 2003 %9M 2004 % % Change
Offshore & Marine 112 39143 41 28
Property 69 2489 25 29
Infrastructure 45 1533 9 (27)
Sub Total 226 78265 75 17
Investments 64 2287 25 36
Total* 290 100352 100 21
PATMI by Segments
* 9M 2004 PATMI includes deferred tax adjustments of S$10m in Offshore & Marine, S$3m in Property and S$1m in Investments

8
Consistent Growth
1H 2H
PATMI (S$m) EPS (Cents)
108
129
112
56132
9482
83
108
98100
39
988189
10593
'00 '01 '02 '03 '04
237267
356
13.9
16.8
14.5
7.317.0
10.7 12.2
10.9
13.9
13.1 12.75.1
10.5 12.611.5
1213.6
'00 '01 '02 '03 '04
30.734.8
46.3
1Q:
2Q:
3Q:
4Q:4Q:
3Q:
2Q:
1Q: 1Q:
2Q:
3Q:
4Q:
1Q:
2Q:
3Q:
4Q:
395 51.1
4Q:
3Q:
2Q:
1Q:
4Q:
3Q:
2Q:
1Q:
1Q: 1Q:
2Q: 2Q:
352 45.4
3Q:3Q:

9
Positive EVA
(800)
(600)
(400)
(200)
0
200
+ S$370m
+ S$170m
+ S$148m
‘01 ‘02 ‘03 9M ‘04
(665)
(295)
(125)
23
S$m

10
ROE above 15%
15.6%14.1%13.4%
10.1%8.6%
2000 2001 2002 2003 9M 2004*
* Annualised ROE

11
Healthy Free Cash Flow9M 2004
S$mCash flow from operating activities Operating profit 346 Depreciation & amortisation 116
Working capital changes (233)
Net cash from operating activities 187
Net cash from investing activities 133
Free Cash Flow 320
Operational capex (75) Proceeds from divestments 153
Interest & tax paid (42)
Dividend income 55
Dividends paid (264)
462

Business Review & Outlook

13
3Q Business Trends
Higher price benchmark by oil majors
Sustained momentum in E & P spending
Overall improvement in rig utilisation
Strong shipping and shipbuilding market
Higher refining margins
Stronger demand for regional residential properties
Improving domestic property market

14
Offshore & Marine

15
Positive Market Fundamentals
Favourable factors supporting E&P activities
• Additional secured supply needed to meet growing global demand for oil and gas
• Sustained high oil and gas prices
• Deeper and more challenging drilling requirements needing new rigs
Outlook for FPSO conversions and offshore support vessels is strong

16
Sustainable Offshore Cycle
Ageing rig fleet with current average age of 23 years versus 4.5 years in 1980
Improving rig utilisation and charter rates
Number of rigs built still modest
0
20
40
60
80
100
120
140
1979 1984 1989 1994 1999 2004
No.
of
dri
llin
g r
igs
bu
ilt
50
55
60
65
70
75
80
85
90
95
100
Avera
ge u
tili
sati
on
rate
s
All rigs Average utilisation of Jack ups + Semis
* Source: Rigzone, ODS-Petrodata (Utilisation rates as at Aug ’04)

17
2,5202,190
670
1,4301,210
2000 2001 2002 2003 9M '04
S$m
Record contracts secured

18
Strong Job Prospects
Products/Services Estimated Value
Semi-submersibles (Newbuildings/Repairs/Upgrading)
0.8
Jackups (Newbuildings/Repairs/Upgrading)
2.2
FPSOs (Conversions/Upgrades)
0.5
Shipbuilding (AHTS/Tugs/Supply Vessels etc.)
0.6
Total 4.9
Platforms/Topsides/Turrets etc. 0.8
S$b

19
Property

20
Growth Strategy:Regional Thrust
Regional economies in industrialization phase
Rising affluence and middle income earners
Supportive government policies
0%
2%
4%
6%
8%
10%
GD
P g
row
th
2003 2004 2005
* Source: Asian Development Bank, Apr ‘04
Growing pool of potential home owners

21
The Waterfront(Chengdu)
The Seasons(Beijing)
8 Park Ave(Shanghai)
Villa Riviera(HCMC)
Indicative sales from regional launches
73%
97%92%
52%
Units Launched in 2004
337 321 230 25
% Sold YTD

22
Overseas pipeline next two years
Shanghai Beijing Chengdu Bangkok HCMC Bangalore
Units to be launched
1,4231,538
2,778
587 588
2,002

23
Domestic market turns the corner
Outlook for private residential properties expected to improve
• Caribbean at Keppel Bay: 87% of 135 units launched in Aug ‘04 sold. Total % of Caribbean sold: 44%
• Urbana: 78% of 65 units launched in Jul ’04 sold. Total % of project sold: 40%
Expected recovery in prime office properties, supported by limited new supply in next two years
• Tenant took up 30% of South Tower at One Raffles Quay, largest office leasing transaction since 1998

24
Infrastructure

25
Finalising Keppel Cogen power project
Alternatives for power barges under consideration
Continue to build up core competencies in Environmental Engineering
• Enhancing technology capabilities
• Strengthening marketing network
• Developing strategic partnerships
Pursuing S$800m new contracts
Infrastructure Outlook

26
2004 Financial Targets
Sustained growth
EPS CAGR of 8-12% through 2005
Maintain ROE of 15%
Continued EVA improvement
Maintain dividend payout ratio of 30-35%

27
Keppel Corporation 9M 2004 Results
Thank YouQ&A

28
Additional Info

29
Keppel Corporation

30
Financial Highlights – Keppel Corp
S$m 1Q 20031Q 2004 % Change
Turnover 1,744896 (49)EBITDA 175147 (16)Operating Profit 121109 (10)Profit Before Tax 132148 12PATMI 94132 40
PATMI (excl. deferred tax adjustments)
94118 26

31
Financial Highlights – Keppel Corp
S$m 2Q 20032Q 2004 % Change
Turnover 1,476922 (38)EBITDA 172163 (5)Operating Profit 120121 1Profit Before Tax 122158 30PATMI 98108 10

32
Financial Highlights – Keppel Corp
S$m 3Q 20033Q 2004 % Change
Turnover 1,511977 (35)EBITDA 189155 (18)Operating Profit 127116 (9)Profit Before Tax 145172 19PATMI 98112 14

33
Total SingaporeOverseasS$m %%
Offshore & Marine 1,632 1288
Infrastructure 556 3961
Property 550 6832
Sub total 2,738 2971
Investments 57 3961Total 2,795 2971
9M 2004
71% of total turnover came from overseas customers
Turnover by Customers

34
S$m9M 2003 %9M 2004 % % Change
Offshore & Marine 197 37217 47 10
Property 137 25160 34 17
Infrastructure 90 1772 16 (20)
Sub Total 424 79449 97 6
Investments 112 2116 3 (86)
Total 536 100465 100 (13)
EBITDA by Segments

35
PATMI By Segments
69
6486
3345
86
133112
14
0
100
200
300
400
9M 2003 9M 2004
S$m
S$290m
21% growth
Offshore & Marine
InfrastructureProperty
Investments
S$352m
Deferred Tax Adjustments
17% growth
Note: 9M 2004 PATMI includes deferred tax adjustments of S$10m in Offshore & Marine, S$3m in Property and S$1m in Investments

36
Capital/Gearing/ROE
S$m
Shareholders' Funds
Capital Employed
Net Debt
Net Gearing
ROE
* Annualised ROE
30 Sep 2004 31 Dec 2003
2,969 2,890
4,067 3,959
2,994 3,040
0.74x 0.77x
15.6%* 14.1%

37
Offshore & Marine

38
S$m9M 20039M 2004 % Change
Turnover 1,0351,632 58EBITDA 197217 10Operating Profit 144174 21Profit Before Tax 143175 22PATMI 112143 28
Financial Highlights – Offshore & Marine
PATMI (excl. deferred tax adjustments)
112133 19

39
Financial Highlights – Offshore & Marine
S$m 1Q 20031Q 2004 % Change
Turnover 393547 39EBITDA 6582 26Operating Profit 4968 39Profit Before Tax 4870 46PATMI 3672 100PATMI (excl. deferred tax adjustments)
3662 72

40
S$m 2Q 20032Q 2004 % Change
Turnover 332498 50EBITDA 6463 (2)Operating Profit 4749 4Profit Before Tax 4748 2PATMI 3834 (11)
Financial Highlights – Offshore & Marine

41
S$m 3Q 20033Q 2004 % Change
Turnover 310587 89EBITDA 6872 6Operating Profit 4857 19Profit Before Tax 4857 19PATMI 3837 (3)
Financial Highlights – Offshore & Marine

42
Offshore & Marine Review
S$324m contracts secured in 3Q 2004:
1 JU newbuild, 2 JU repairs, 1 semi repair, TPG 500 suction cans, 1 derrick barge upgrade, 2 AHTS, 1 FSO conversion, 1 cruise vessel refurbishment
Major contract completions in 3Q 2004:
1 floating dock upgrade, 1 derrick barge upgrade, 1 semi upgrade, 2 AHTS, 1 tender barge upgrade, 2 JU upgrades, 2 shuttle tanker conversions, 2 tugs

43
Offshore & Marine OrderbookClients
For delivery in 20044 Jack Up Upgrades / Repairs / 1 Processing Platform
31 Ensco / GSF / JDC / Sedco / Petrovietnam
TOTAL as at 30 Sep 2004 S$3.6b
2 Semi Conversions / Upgrades / 2 FPSOConversions
23 JCE Group / Diamond / Halliburton / Perenco
For delivery in 20052 Jack Ups / 2 Jack Up Upgrades / Repairs / 1 Semi Modification
1 Cruise Vessel Lengthening / 1 Cruise Vessel Refurbishment / 1 Derrick Barge Upgrade / Suction Cans / 2 PSVs / 10 AHTS / 2 Tugs
240 BP / NDC / Ensco / Atwood / Boeing
Kvaener / easyCruise / Saipem / Technip/ Maersk / Gulfmark Offshore / Pacific Richfield / Bourbon / Smit / Hadi Hammam / PSA Marine
Contract Value
Balance Order
157
154
3 AHTS / 4 Tugs / 1 Support Vessel Refit / 1 Cement Carrier Conversion
29 Delba Maritima /CH Offshore / Hadi Hammam / Keppel Smit / PSA Marine / RFA / Windstor
122
659
For delivery in 20071 Semi (P52) 1,073 Petrobras1,073
S$4.5b
S$m
For delivery in 20064 Jack Ups / 3 AHTS 819 Skeie / Ensco / Odfjell / Bourbon / Smit / Hadi
Hammam871
For delivery in 20081 Semi (P51) 1,093 Petrobras1,093
363 272

44
Property

45
Financial Highlights - Property
NB: Property segment includes all property related businesses of KCL
S$m9M 20039M 2004 % Change
Turnover 611550 (10)EBITDA 137160 17Operating Profit 125150 20Profit Before Tax 120154 28PATMI 6989 29PATMI (excl. deferred tax
adjustments)6986 25

46
Financial Highlights – Property
S$m 1Q 20031Q 2004 % Change
Turnover 170139 (18)EBITDA 4437 (16)Operating Profit 4034 (15)Profit Before Tax 3839 3PATMI 2025 25
PATMI (excl. deferred tax adjustments)
2022 10
NB: Property segment includes all property related businesses of KCL

47
Financial Highlights – Property
S$m 2Q 20032Q 2004 % Change
Turnover 206209 1EBITDA 4057 43Operating Profit 3853 39Profit Before Tax 3552 49PATMI 2329 26
NB: Property segment includes all property related businesses of KCL

48
Financial Highlights – Property
S$m 3Q 20033Q 2004 % Change
Turnover 235202 (14)EBITDA 5366 25Operating Profit 4763 34Profit Before Tax 4763 34PATMI 2635 35
NB: Property segment includes all property related businesses of KCL

49
Infrastructure

50
S$m 9M 20039M 2004 % Change
Turnover 618556 (10)EBITDA 9072 (20)Operating Profit 3420 (41)Profit Before Tax 4536 (20)PATMI 4533 (27)
Financial Highlights – Infrastructure

51
Financial Highlights – Infrastructure
S$m 1Q 20031Q 2004 % Change
Turnover 183187 2EBITDA 3327 (18)Operating Profit 1411 (21)Profit Before Tax 1515 -PATMI 1915 (21)

52
Financial Highlights – Infrastructure
S$m 2Q 20032Q 2004 % Change
Turnover 218195 (11)EBITDA 2828 -Operating Profit 109 (10)Profit Before Tax 1315 15PATMI 1313 -

53
Financial Highlights – Infrastructure
S$m 3Q 20033Q 2004 % Change
Turnover 217174 (20)EBITDA 2917 (41)Operating Profit 100 (100)Profit Before Tax 176 (65)PATMI 135 (62)
54
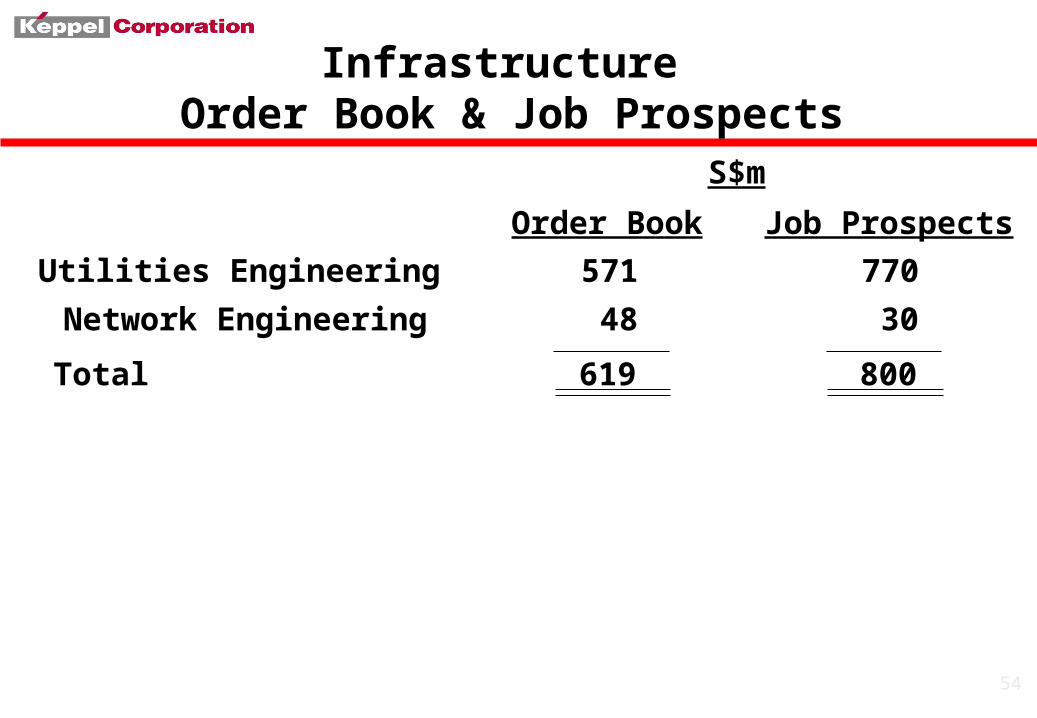
Infrastructure Order Book & Job Prospects
S$m
Utilities Engineering 571
Network Engineering 48
Total 619
770
30
800
Job ProspectsOrder Book

55
Investments

56
Financial Highlights - Investments
S$m9M 20039M 2004 % Change
Turnover 2,46757 (98)EBITDA 11216 (86)Operating Profit 652 (97)Profit Before Tax 91113 24PATMI 6487 36PATMI (excl. deferred tax
adjustments)6486 34

57
Financial Highlights – Investments
S$m 1Q 20031Q 2004 % Change
Turnover 99823 (98)EBITDA 331 (97)Operating Profit 18(4) NMProfit Before Tax 3124 (23)PATMI 1920 5
PATMI (excl. deferred tax adjustments)
1919 -

58
Financial Highlights – Investments
S$m 2Q 20032Q 2004 % Change
Turnover 72020 (97)EBITDA 4015 (63)Operating Profit 2510 (60)Profit Before Tax 2743 59PATMI 2432 33

59
Financial Highlights – Investments
S$m 3Q 20033Q 2004 % Change
Turnover 74914 (98)EBITDA 39- (100)Operating Profit 22(4) NMProfit Before Tax 3346 39PATMI 2135 67

60
This release may contain forward-looking statements which are subject to risks and uncertainties that could cause actual results to differ materially from such statements. Such risks and uncertainties include industry and economic conditions, competition, and legal,
governmental and regulatory changes. The forward-looking statements reflect the current views of Management on future
trends and developments.