2015 final results announcement
TRANSCRIPT
1
Hong Kong Exchanges and Clearing Limited and The Stock Exchange of Hong Kong Limited take no responsibility for the contents of this announcement, make no representation as to its accuracy or completeness and expressly disclaim any liability whatsoever for any loss howsoever arising from or in reliance upon the whole or any part of the contents of this announcement.
2015 FINAL RESULTS ANNOUNCEMENT CHAIRMAN’S STATEMENT Dear Shareholders On behalf of the Board, I am pleased to present my report on the operations of the Group for the financial year ended 31 December 2015. Profit Attributable to Shareholders The Group’s reported profit attributable to equity shareholders for the year ended 31 December 2015 amounted to HK$21,326 million, representing an increase of HK$4,574 million or 27% over HK$16,752 million for the previous year. Reported earnings per share were HK$6.46 (2014: HK$5.11 as adjusted for the bonus issue in 2015). Excluding the fair value change (net of non-controlling interests and tax) of investment properties and investment properties under development, the Group’s Underlying ProfitNote attributable to equity shareholders for the year ended 31 December 2015 was HK$11,009 million, representing an increase of HK$1,191 million or 12% over HK$9,818 million for the previous year. Underlying Earnings Per Share were HK$3.33 (2014: HK$2.99 as adjusted for the bonus issue in 2015). Note: In order to fully exclude the effects of changes in fair value from the Group’s Underlying Profit, any cumulative
fair value change of investment properties disposed of during the year (which has been included in calculating the net gain on disposal of investment properties and hence the profit attributable to equity shareholders of the Company during the year) was added back in arriving at the Underlying Profit. The comparative Underlying Profit and Underlying Earnings Per Share for the previous financial year have been restated to conform to the presentation basis for the year under review.
2
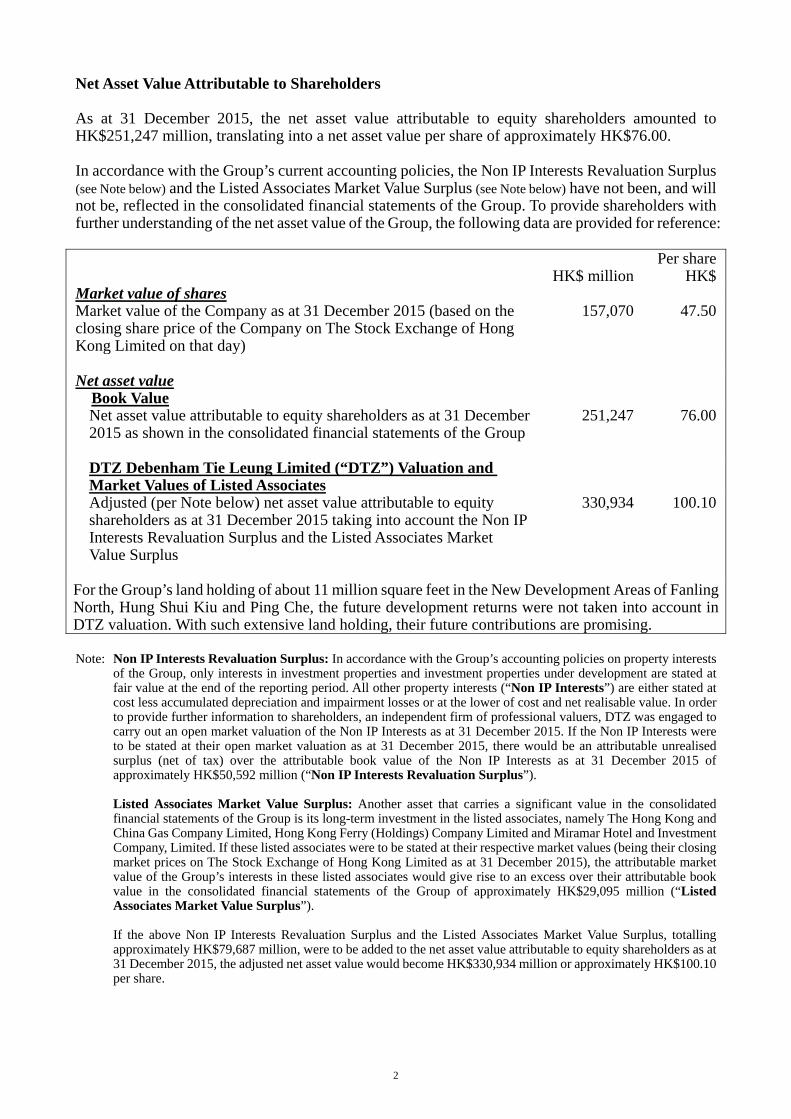
Net Asset Value Attributable to Shareholders As at 31 December 2015, the net asset value attributable to equity shareholders amounted to HK$251,247 million, translating into a net asset value per share of approximately HK$76.00. In accordance with the Group’s current accounting policies, the Non IP Interests Revaluation Surplus (see Note below) and the Listed Associates Market Value Surplus (see Note below) have not been, and will not be, reflected in the consolidated financial statements of the Group. To provide shareholders with further understanding of the net asset value of the Group, the following data are provided for reference:
HK$ million Per share
HK$Market value of shares Market value of the Company as at 31 December 2015 (based on the closing share price of the Company on The Stock Exchange of Hong Kong Limited on that day)
157,070 47.50
Net asset value Book Value
Net asset value attributable to equity shareholders as at 31 December 2015 as shown in the consolidated financial statements of the Group
251,247 76.00
DTZ Debenham Tie Leung Limited (“DTZ”) Valuation and Market Values of Listed Associates
Adjusted (per Note below) net asset value attributable to equity shareholders as at 31 December 2015 taking into account the Non IP Interests Revaluation Surplus and the Listed Associates Market Value Surplus
330,934 100.10
For the Group’s land holding of about 11 million square feet in the New Development Areas of Fanling North, Hung Shui Kiu and Ping Che, the future development returns were not taken into account in DTZ valuation. With such extensive land holding, their future contributions are promising. Note: Non IP Interests Revaluation Surplus: In accordance with the Group’s accounting policies on property interests
of the Group, only interests in investment properties and investment properties under development are stated at fair value at the end of the reporting period. All other property interests (“Non IP Interests”) are either stated at cost less accumulated depreciation and impairment losses or at the lower of cost and net realisable value. In order to provide further information to shareholders, an independent firm of professional valuers, DTZ was engaged to carry out an open market valuation of the Non IP Interests as at 31 December 2015. If the Non IP Interests were to be stated at their open market valuation as at 31 December 2015, there would be an attributable unrealised surplus (net of tax) over the attributable book value of the Non IP Interests as at 31 December 2015 of approximately HK$50,592 million (“Non IP Interests Revaluation Surplus”).
Listed Associates Market Value Surplus: Another asset that carries a significant value in the consolidated
financial statements of the Group is its long-term investment in the listed associates, namely The Hong Kong and China Gas Company Limited, Hong Kong Ferry (Holdings) Company Limited and Miramar Hotel and Investment Company, Limited. If these listed associates were to be stated at their respective market values (being their closing market prices on The Stock Exchange of Hong Kong Limited as at 31 December 2015), the attributable market value of the Group’s interests in these listed associates would give rise to an excess over their attributable book value in the consolidated financial statements of the Group of approximately HK$29,095 million (“Listed Associates Market Value Surplus”).
If the above Non IP Interests Revaluation Surplus and the Listed Associates Market Value Surplus, totalling
approximately HK$79,687 million, were to be added to the net asset value attributable to equity shareholders as at 31 December 2015, the adjusted net asset value would become HK$330,934 million or approximately HK$100.10 per share.
3
Dividends The Board recommends the payment of a final dividend of HK$1.07 per share to shareholders whose names appear on the Register of Members of the Company on Monday, 13 June 2016, and such final dividend will not be subject to any withholding tax in Hong Kong. Including the interim dividend of HK$0.38 per share already paid, the total dividend for the year ended 31 December 2015 will amount to HK$1.45 per share (2014: HK$1.10 per share). The proposed final dividend will be payable in cash and is expected to be distributed to shareholders on Thursday, 23 June 2016. Issue of Bonus Shares The Board proposes to make a bonus issue of one new share for every ten shares held (2014: one bonus share for every ten shares held) to shareholders whose names appear on the Register of Members on Monday, 13 June 2016. The relevant resolution will be proposed at the forthcoming annual general meeting, and if passed and upon the Listing Committee of The Stock Exchange of Hong Kong Limited granting the listing of and permission to deal in such new shares, share certificates of the bonus shares will be posted on Thursday, 23 June 2016.
4
BUSINESS REVIEW The Group’s Underlying Profit attributable to equity shareholders for the year ended 31 December 2015 was up by 12% to HK$11,009 million. Pre-tax profit contribution from property sales (including the attributable contribution from subsidiaries, associates and joint ventures) increased by 18% to HK$3,980 million, whilst pre-tax net rental income (including the attributable contribution from subsidiaries, associates and joint ventures) increased by 10% to HK$6,303 million. Hong Kong Property Sale Supported by stable external economic conditions and strong housing demand, the property market in Hong Kong remained buoyant in the first half of 2015 notwithstanding a new round of mortgage-tightening measures launched by the Hong Kong Monetary Authority in early 2015. However, growing concerns over the US interest rate normalisation and an expected increase in the near-term supply of first-hand residential properties resulted in a “wait-and-see” attitude among homebuyers, which rendered a slowdown in the property market towards the year end. During the year under review, the Group’s overall property sales performance was satisfactory. Projects launched during the year included “Double Cove Grandview” (Phase 4 of “Double Cove”) in Ma On Shan and an array of urban redevelopment boutique residences under “The H Collection” (namely, “Jones Hive” in Causeway Bay, “PARKER33” in Shau Kei Wan, “AXIS” in Hung Hom, “The Zutten” in Ma Tau Kok, as well as “High Park Grand” and “Eltanin˙Square Mile” in Mong Kok). Developments re-launched for sale such as “39 Conduit Road” in Mid-Levels, “Double Cove” (Phases 1-3) in Ma On Shan and “The Reach” in Yuen Long were also well received. In addition, four deluxe apartments at “39 Conduit Road” in Mid-Levels, which were previously held for leasing, were also disposed of during the year under review. Together with the disposal of certain quality industrial/commercial space, the Group sold HK$11,472 million worth of Hong Kong properties in attributable terms for the year ended 31 December 2015. After the end of this financial year, the Group continued to release various properties under development for sale, including the launching of “Harbour Park” in Cheung Sha Wan and “Wellesley” in Mid-Levels in January 2016 and “Double Cove Summit” (Phase 5 of “Double Cove”) in March 2016. Property Development In June 2015, a residential site in So Kwun Wat, Tuen Mun located in close proximity to Harrow International School with stunning sea views, was acquired through public tender at a consideration of HK$3,628.9 million. It is planned to be developed into a high-end residential development, providing about 1,900 housing units. Furthermore, the Group’s urban redevelopment projects with 80% to 100% of their ownerships acquired increased to 45 in number, representing about 3.8 million square feet in total attributable gross floor area. The Group has made use of multiple channels to expand its development land bank in Hong Kong. Purely through acquisition of old tenement buildings for urban redevelopment (excluding conversion of New Territories land, as well as public auction and tender), abundant land resources have been made available to the Group for property development. Together with the development projects which are sourced from land-use conversion of New Territories land and public tenders, with the exception of a few projects earmarked for rental purposes, sizeable areas will be available to the Group for property sales in the coming years (details are shown as follows).
5
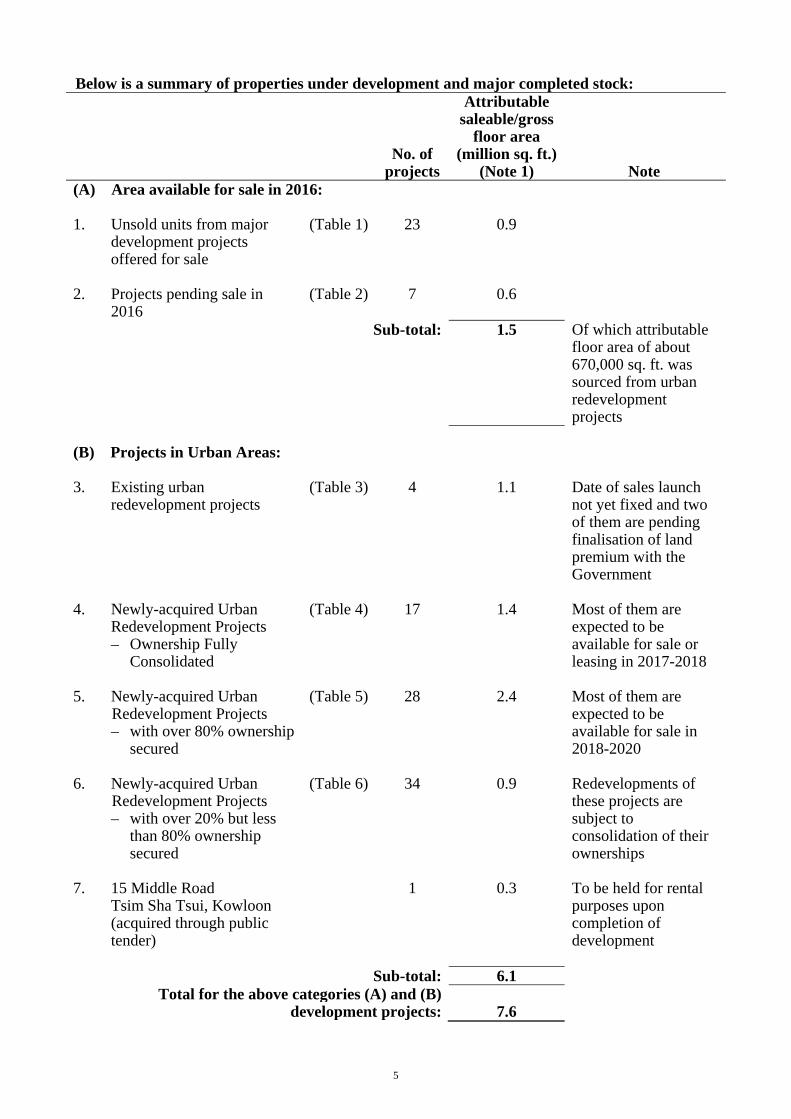
Below is a summary of properties under development and major completed stock:
No. of
projects
Attributable saleable/gross
floor area (million sq. ft.)
(Note 1) Note(A) Area available for sale in 2016: 1. Unsold units from major
development projects offered for sale
(Table 1) 23 0.9
2. Projects pending sale in 2016
(Table 2) 7 0.6
Sub-total: 1.5 Of which attributable floor area of about 670,000 sq. ft. was sourced from urban redevelopment projects
(B) Projects in Urban Areas: 3. Existing urban
redevelopment projects
(Table 3) 4 1.1 Date of sales launch not yet fixed and two of them are pending finalisation of land premium with the Government
4. Newly-acquired Urban Redevelopment Projects – Ownership Fully
Consolidated
(Table 4) 17 1.4 Most of them are expected to be available for sale or leasing in 2017-2018
5. Newly-acquired Urban Redevelopment Projects – with over 80% ownership
secured
(Table 5) 28 2.4 Most of them are expected to be available for sale in 2018-2020
6. Newly-acquired Urban Redevelopment Projects – with over 20% but less
than 80% ownership secured
(Table 6) 34 0.9 Redevelopments of these projects are subject to consolidation of their ownerships
7. 15 Middle Road Tsim Sha Tsui, Kowloon (acquired through public tender)
1 0.3 To be held for rental purposes upon completion of development
Sub-total: 6.1 Total for the above categories (A) and (B)
development projects: 7.6
6
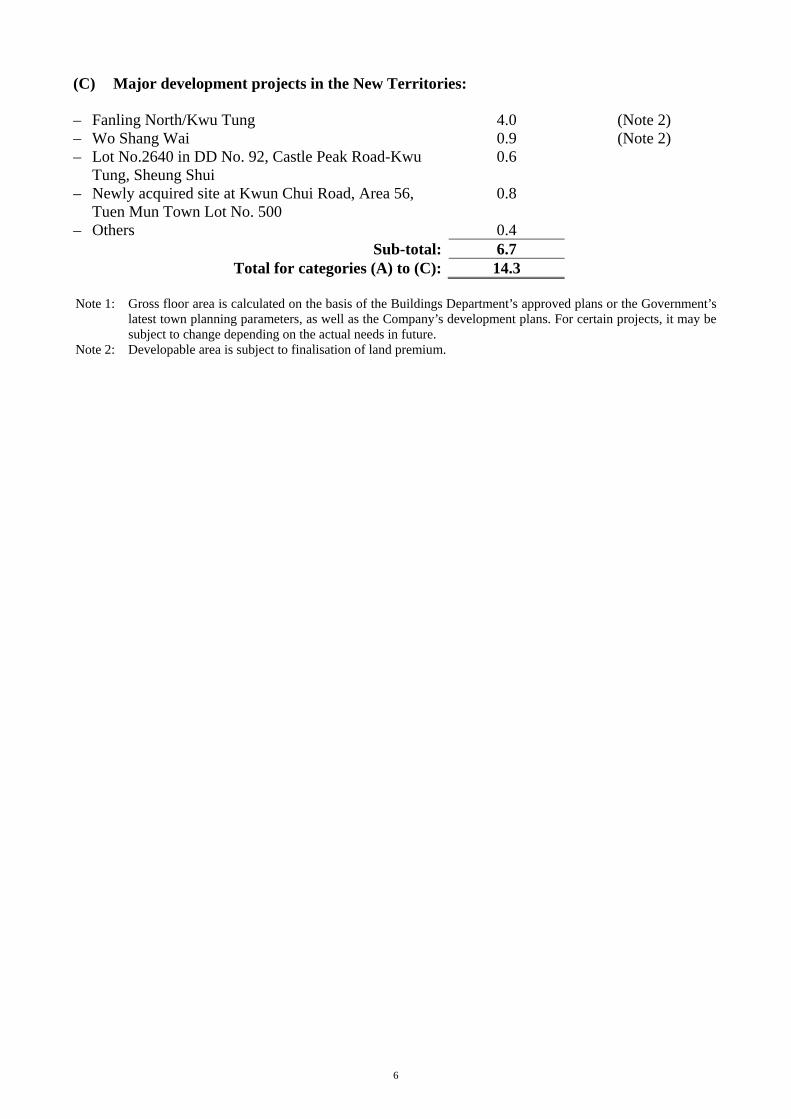
(C) Major development projects in the New Territories: – Fanling North/Kwu Tung 4.0 (Note 2) – Wo Shang Wai 0.9 (Note 2) – Lot No.2640 in DD No. 92, Castle Peak Road-Kwu
Tung, Sheung Shui 0.6
– Newly acquired site at Kwun Chui Road, Area 56, Tuen Mun Town Lot No. 500
0.8
– Others 0.4 Sub-total: 6.7
Total for categories (A) to (C): 14.3 Note 1: Gross floor area is calculated on the basis of the Buildings Department’s approved plans or the Government’s
latest town planning parameters, as well as the Company’s development plans. For certain projects, it may be subject to change depending on the actual needs in future.
Note 2: Developable area is subject to finalisation of land premium.
7
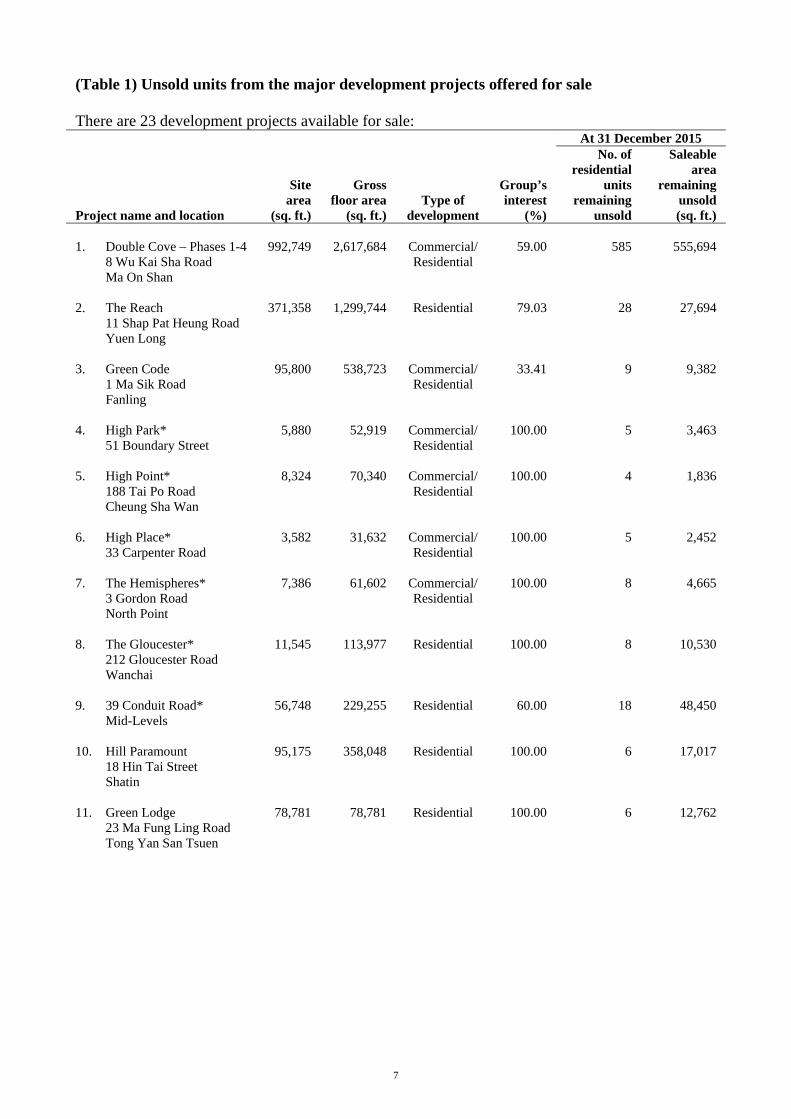
(Table 1) Unsold units from the major development projects offered for sale There are 23 development projects available for sale:
At 31 December 2015
Project name and location
Site area
(sq. ft.)
Grossfloor area
(sq. ft.)Type of
development
Group’sinterest
(%)
No. of residential
units remaining
unsold
Saleablearea
remainingunsold(sq. ft.)
1. Double Cove – Phases 1-4
8 Wu Kai Sha Road Ma On Shan
992,749 2,617,684 Commercial/ Residential
59.00 585 555,694
2. The Reach 11 Shap Pat Heung Road Yuen Long
371,358
1,299,744 Residential 79.03 28 27,694
3. Green Code 1 Ma Sik Road Fanling
95,800 538,723 Commercial/ Residential
33.41 9 9,382
4. High Park* 51 Boundary Street
5,880 52,919 Commercial/ Residential
100.00 5 3,463
5. High Point* 188 Tai Po Road Cheung Sha Wan
8,324 70,340 Commercial/ Residential
100.00 4 1,836
6. High Place* 33 Carpenter Road
3,582 31,632 Commercial/ Residential
100.00 5 2,452
7. The Hemispheres* 3 Gordon Road North Point
7,386 61,602 Commercial/ Residential
100.00 8 4,665
8. The Gloucester* 212 Gloucester Road Wanchai
11,545 113,977 Residential 100.00 8 10,530
9. 39 Conduit Road* Mid-Levels
56,748 229,255 Residential 60.00 18 48,450
10. Hill Paramount 18 Hin Tai Street Shatin
95,175 358,048 Residential 100.00 6 17,017
11. Green Lodge 23 Ma Fung Ling Road Tong Yan San Tsuen
78,781 78,781 Residential 100.00 6 12,762
8
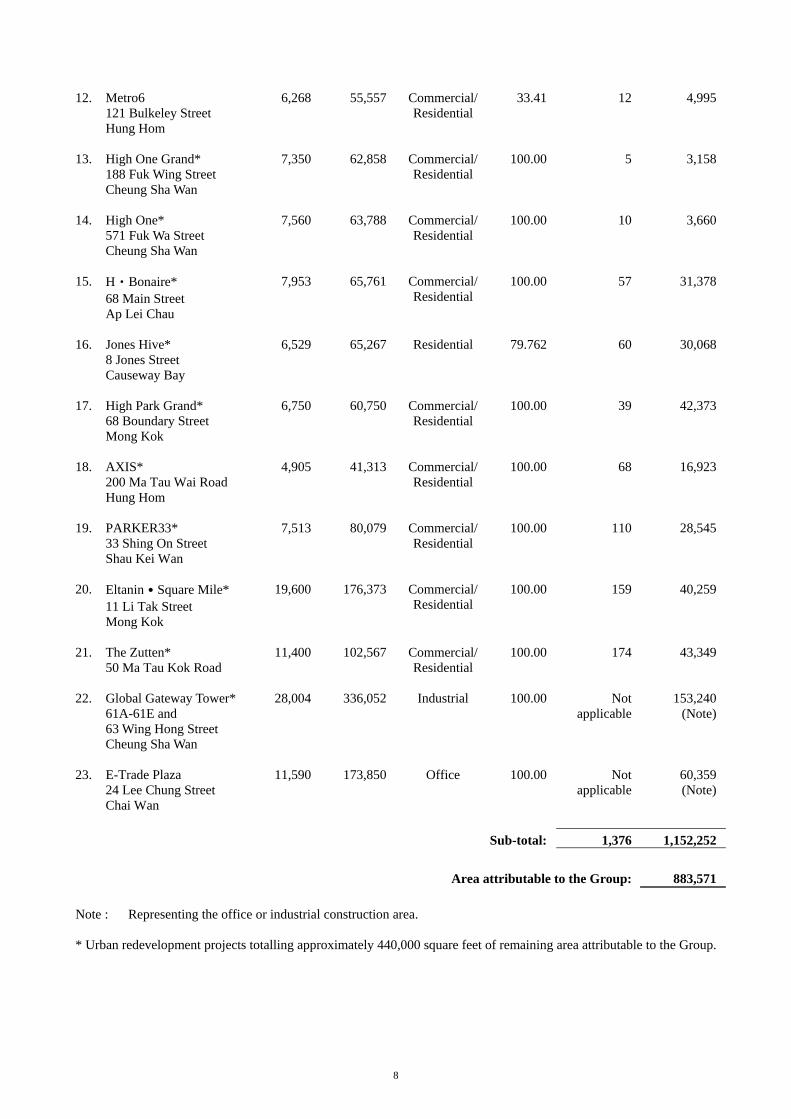
12. Metro6
121 Bulkeley Street Hung Hom
6,268 55,557 Commercial/ Residential
33.41 12 4,995
13. High One Grand* 188 Fuk Wing Street Cheung Sha Wan
7,350 62,858 Commercial/ Residential
100.00 5 3,158
14. High One* 571 Fuk Wa Street Cheung Sha Wan
7,560 63,788 Commercial/ Residential
100.00 10 3,660
15. H‧Bonaire* 68 Main Street Ap Lei Chau
7,953 65,761 Commercial/ Residential
100.00 57 31,378
16. Jones Hive* 8 Jones Street Causeway Bay
6,529 65,267 Residential 79.762 60 30,068
17. High Park Grand* 68 Boundary Street Mong Kok
6,750 60,750 Commercial/ Residential
100.00 39 42,373
18. AXIS* 200 Ma Tau Wai Road Hung Hom
4,905 41,313 Commercial/ Residential
100.00 68 16,923
19. PARKER33* 33 Shing On Street Shau Kei Wan
7,513 80,079 Commercial/ Residential
100.00 110 28,545
20. Eltanin˙Square Mile*
11 Li Tak Street Mong Kok
19,600 176,373 Commercial/ Residential
100.00 159 40,259
21. The Zutten* 50 Ma Tau Kok Road
11,400 102,567 Commercial/ Residential
100.00 174 43,349
22. Global Gateway Tower* 61A-61E and 63 Wing Hong Street Cheung Sha Wan
28,004
336,052 Industrial 100.00 Not applicable
153,240(Note)
23. E-Trade Plaza
24 Lee Chung Street Chai Wan
11,590 173,850 Office 100.00 Not applicable
60,359(Note)
Sub-total: 1,376 1,152,252 Area attributable to the Group: 883,571 Note : Representing the office or industrial construction area. * Urban redevelopment projects totalling approximately 440,000 square feet of remaining area attributable to the Group.
9
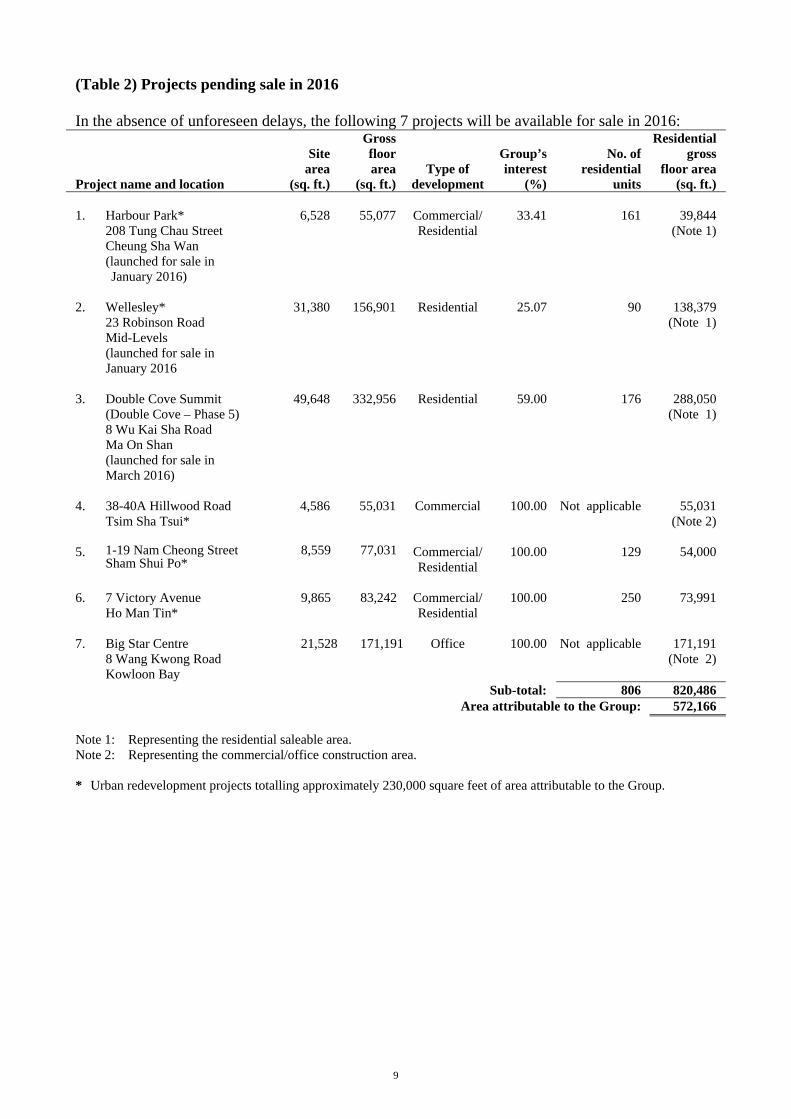
(Table 2) Projects pending sale in 2016 In the absence of unforeseen delays, the following 7 projects will be available for sale in 2016:
Project name and location
Sitearea
(sq. ft.)
Grossfloorarea
(sq. ft.)Type of
development
Group’sinterest
(%)
No. of residential
units
Residentialgross
floor area(sq. ft.)
1. Harbour Park*
208 Tung Chau Street Cheung Sha Wan (launched for sale in January 2016)
6,528 55,077 Commercial/Residential
33.41 161 39,844(Note 1)
2. Wellesley* 23 Robinson Road Mid-Levels (launched for sale in January 2016
31,380 156,901 Residential 25.07 90 138,379(Note 1)
3. Double Cove Summit (Double Cove – Phase 5) 8 Wu Kai Sha Road Ma On Shan (launched for sale in March 2016)
49,648 332,956 Residential 59.00 176 288,050(Note 1)
4. 38-40A Hillwood Road Tsim Sha Tsui*
4,586 55,031 Commercial 100.00 Not applicable 55,031(Note 2)
5. 1-19 Nam Cheong StreetSham Shui Po*
8,559 77,031 Commercial/Residential
100.00 129 54,000
6. 7 Victory Avenue
Ho Man Tin* 9,865 83,242 Commercial/
Residential 100.00 250 73,991
7. Big Star Centre 8 Wang Kwong Road Kowloon Bay
21,528 171,191 Office 100.00 Not applicable 171,191(Note 2)
Sub-total: 806 820,486 Area attributable to the Group: 572,166 Note 1: Representing the residential saleable area. Note 2: Representing the commercial/office construction area. * Urban redevelopment projects totalling approximately 230,000 square feet of area attributable to the Group.
10
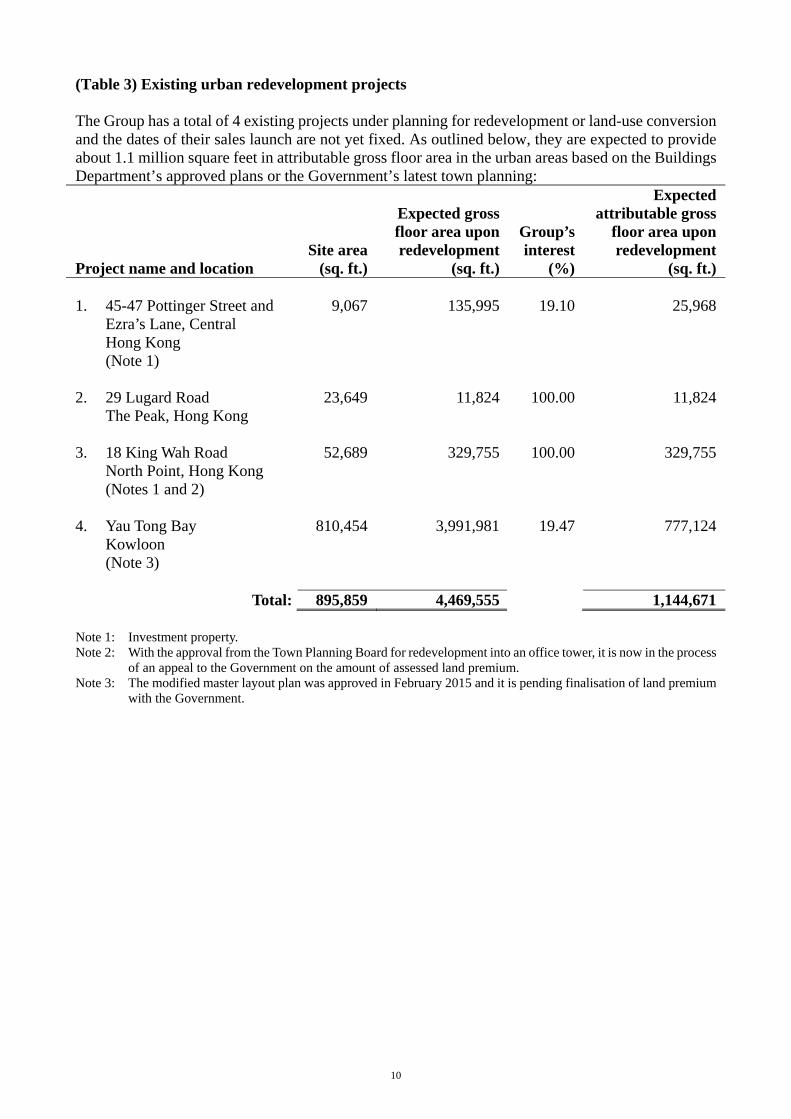
(Table 3) Existing urban redevelopment projects The Group has a total of 4 existing projects under planning for redevelopment or land-use conversion and the dates of their sales launch are not yet fixed. As outlined below, they are expected to provide about 1.1 million square feet in attributable gross floor area in the urban areas based on the Buildings Department’s approved plans or the Government’s latest town planning:
Project name and location Site area
(sq. ft.)
Expected grossfloor area uponredevelopment
(sq. ft.)
Group’s interest
(%)
Expectedattributable gross
floor area uponredevelopment
(sq. ft.) 1. 45-47 Pottinger Street and
Ezra’s Lane, Central Hong Kong (Note 1)
9,067 135,995 19.10 25,968
2. 29 Lugard Road The Peak, Hong Kong
23,649 11,824 100.00 11,824
3. 18 King Wah Road North Point, Hong Kong (Notes 1 and 2)
52,689 329,755 100.00 329,755
4. Yau Tong Bay Kowloon (Note 3)
810,454 3,991,981 19.47 777,124
Total: 895,859 4,469,555 1,144,671 Note 1: Investment property. Note 2: With the approval from the Town Planning Board for redevelopment into an office tower, it is now in the process
of an appeal to the Government on the amount of assessed land premium. Note 3: The modified master layout plan was approved in February 2015 and it is pending finalisation of land premium
with the Government.
11
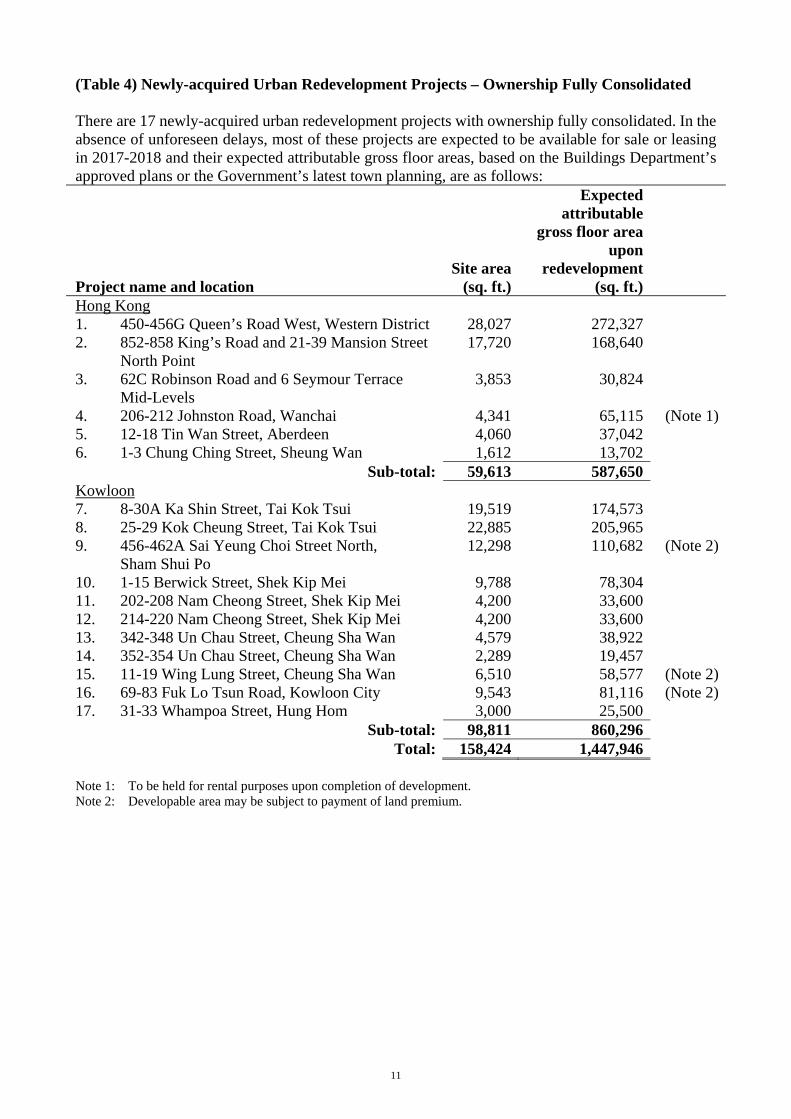
(Table 4) Newly-acquired Urban Redevelopment Projects – Ownership Fully Consolidated There are 17 newly-acquired urban redevelopment projects with ownership fully consolidated. In the absence of unforeseen delays, most of these projects are expected to be available for sale or leasing in 2017-2018 and their expected attributable gross floor areas, based on the Buildings Department’s approved plans or the Government’s latest town planning, are as follows:
Project name and location Site area
(sq. ft.)
Expected attributable
gross floor area upon
redevelopment (sq. ft.)
Hong Kong 1. 450-456G Queen’s Road West, Western District 28,027 272,327 2. 852-858 King’s Road and 21-39 Mansion Street
North Point 17,720 168,640
3. 62C Robinson Road and 6 Seymour Terrace Mid-Levels
3,853 30,824
4. 206-212 Johnston Road, Wanchai 4,341 65,115 (Note 1)5. 12-18 Tin Wan Street, Aberdeen 4,060 37,042 6. 1-3 Chung Ching Street, Sheung Wan 1,612 13,702 Sub-total: 59,613 587,650 Kowloon 7. 8-30A Ka Shin Street, Tai Kok Tsui 19,519 174,573 8. 25-29 Kok Cheung Street, Tai Kok Tsui 22,885 205,965 9. 456-462A Sai Yeung Choi Street North,
Sham Shui Po 12,298 110,682 (Note 2)
10. 1-15 Berwick Street, Shek Kip Mei 9,788 78,304 11. 202-208 Nam Cheong Street, Shek Kip Mei 4,200 33,600 12. 214-220 Nam Cheong Street, Shek Kip Mei 4,200 33,600 13. 342-348 Un Chau Street, Cheung Sha Wan 4,579 38,922 14. 352-354 Un Chau Street, Cheung Sha Wan 2,289 19,457 15. 11-19 Wing Lung Street, Cheung Sha Wan 6,510 58,577 (Note 2)16. 69-83 Fuk Lo Tsun Road, Kowloon City 9,543 81,116 (Note 2)17. 31-33 Whampoa Street, Hung Hom 3,000 25,500 Sub-total: 98,811 860,296 Total: 158,424 1,447,946 Note 1: To be held for rental purposes upon completion of development. Note 2: Developable area may be subject to payment of land premium.
12
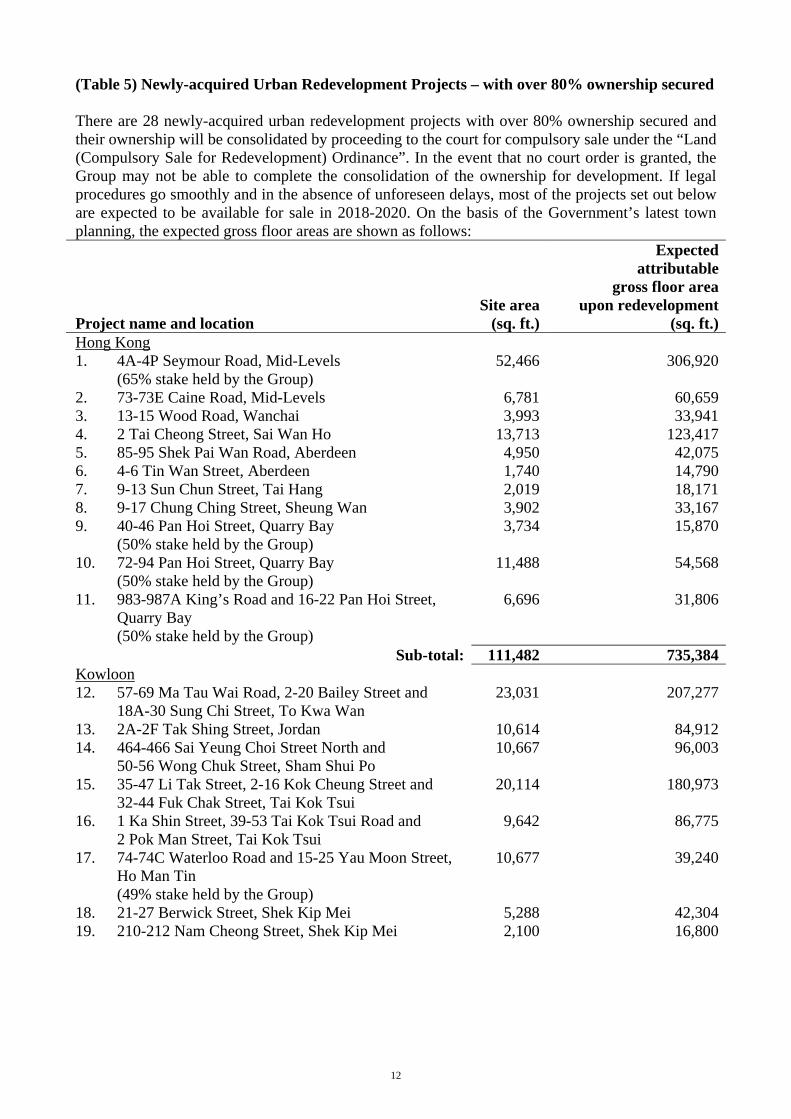
(Table 5) Newly-acquired Urban Redevelopment Projects – with over 80% ownership secured There are 28 newly-acquired urban redevelopment projects with over 80% ownership secured and their ownership will be consolidated by proceeding to the court for compulsory sale under the “Land (Compulsory Sale for Redevelopment) Ordinance”. In the event that no court order is granted, the Group may not be able to complete the consolidation of the ownership for development. If legal procedures go smoothly and in the absence of unforeseen delays, most of the projects set out below are expected to be available for sale in 2018-2020. On the basis of the Government’s latest town planning, the expected gross floor areas are shown as follows:
Project name and location Site area
(sq. ft.)
Expectedattributable
gross floor areaupon redevelopment
(sq. ft.)Hong Kong 1. 4A-4P Seymour Road, Mid-Levels
(65% stake held by the Group) 52,466 306,920
2. 73-73E Caine Road, Mid-Levels 6,781 60,6593. 13-15 Wood Road, Wanchai 3,993 33,9414. 2 Tai Cheong Street, Sai Wan Ho 13,713 123,4175. 85-95 Shek Pai Wan Road, Aberdeen 4,950 42,0756. 4-6 Tin Wan Street, Aberdeen 1,740 14,7907. 9-13 Sun Chun Street, Tai Hang 2,019 18,1718. 9-17 Chung Ching Street, Sheung Wan 3,902 33,1679. 40-46 Pan Hoi Street, Quarry Bay
(50% stake held by the Group) 3,734 15,870
10. 72-94 Pan Hoi Street, Quarry Bay (50% stake held by the Group)
11,488 54,568
11. 983-987A King’s Road and 16-22 Pan Hoi Street, Quarry Bay (50% stake held by the Group)
6,696 31,806
Sub-total: 111,482 735,384Kowloon 12. 57-69 Ma Tau Wai Road, 2-20 Bailey Street and
18A-30 Sung Chi Street, To Kwa Wan 23,031 207,277
13. 2A-2F Tak Shing Street, Jordan 10,614 84,91214. 464-466 Sai Yeung Choi Street North and
50-56 Wong Chuk Street, Sham Shui Po 10,667 96,003
15. 35-47 Li Tak Street, 2-16 Kok Cheung Street and 32-44 Fuk Chak Street, Tai Kok Tsui
20,114 180,973
16. 1 Ka Shin Street, 39-53 Tai Kok Tsui Road and 2 Pok Man Street, Tai Kok Tsui
9,642 86,775
17. 74-74C Waterloo Road and 15-25 Yau Moon Street, Ho Man Tin (49% stake held by the Group)
10,677 39,240
18. 21-27 Berwick Street, Shek Kip Mei 5,288 42,30419. 210-212 Nam Cheong Street, Shek Kip Mei 2,100 16,800
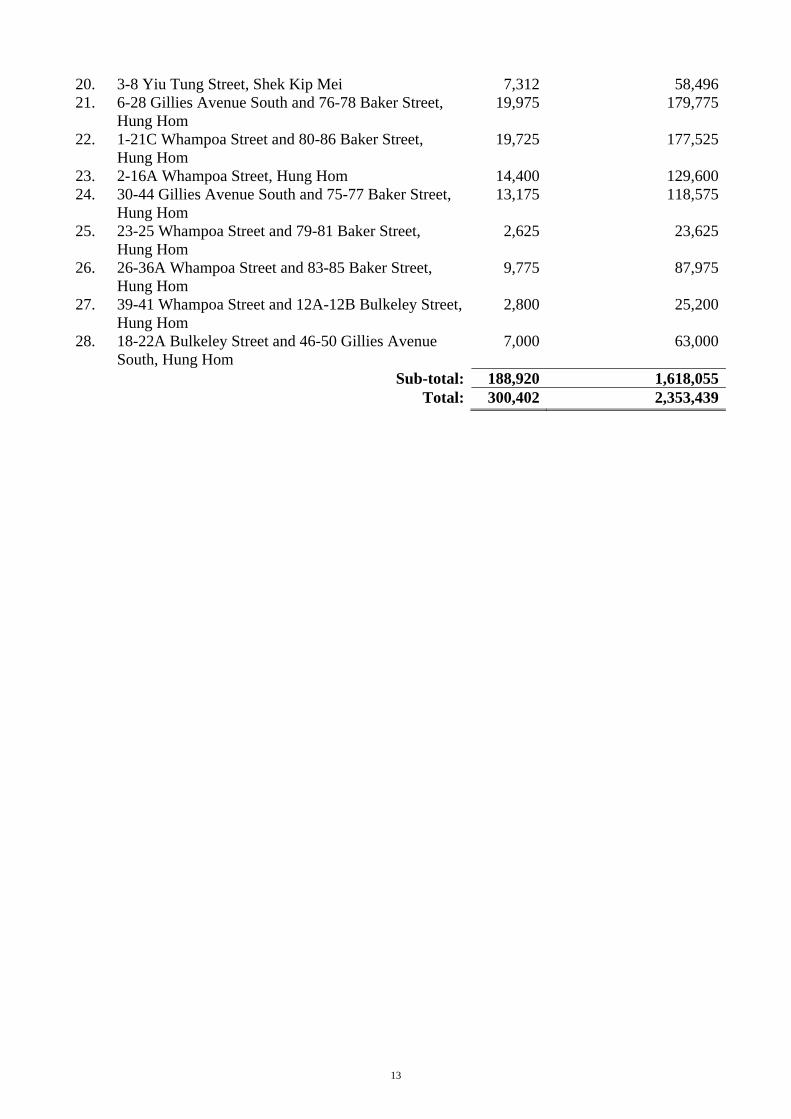
13
20. 3-8 Yiu Tung Street, Shek Kip Mei 7,312 58,49621. 6-28 Gillies Avenue South and 76-78 Baker Street,
Hung Hom 19,975 179,775
22. 1-21C Whampoa Street and 80-86 Baker Street, Hung Hom
19,725 177,525
23. 2-16A Whampoa Street, Hung Hom 14,400 129,60024. 30-44 Gillies Avenue South and 75-77 Baker Street,
Hung Hom 13,175 118,575
25. 23-25 Whampoa Street and 79-81 Baker Street, Hung Hom
2,625 23,625
26. 26-36A Whampoa Street and 83-85 Baker Street, Hung Hom
9,775 87,975
27. 39-41 Whampoa Street and 12A-12B Bulkeley Street,Hung Hom
2,800 25,200
28. 18-22A Bulkeley Street and 46-50 Gillies Avenue South, Hung Hom
7,000 63,000
Sub-total: 188,920 1,618,055 Total: 300,402 2,353,439
14
(Table 6) Newly-acquired Urban Redevelopment Projects – with over 20% but less than 80% ownership secured
The Group has other acquisitions in progress, involving 34 projects located in prime urban areas in Hong Kong and Kowloon. Currently, ownership of each project ranging from more than 20% to less than 80% has been achieved. The attributable land areas of these projects total about 230,000 square feet. If and when their ownerships are successfully consolidated, based on the Government’s latest town planning, the total estimated attributable gross floor area would be about 2.1 million square feet upon completion of redevelopment. Based on the respective ownership currently secured by the Group for each project, the total pro-rata attributable gross floor area is about 900,000 square feet. Successful acquisitions of the above projects bear uncertainty. The Group may not be able to consolidate ownerships of all projects. Redevelopments can only be implemented upon acquisition of the full ownership of the relevant projects.
15
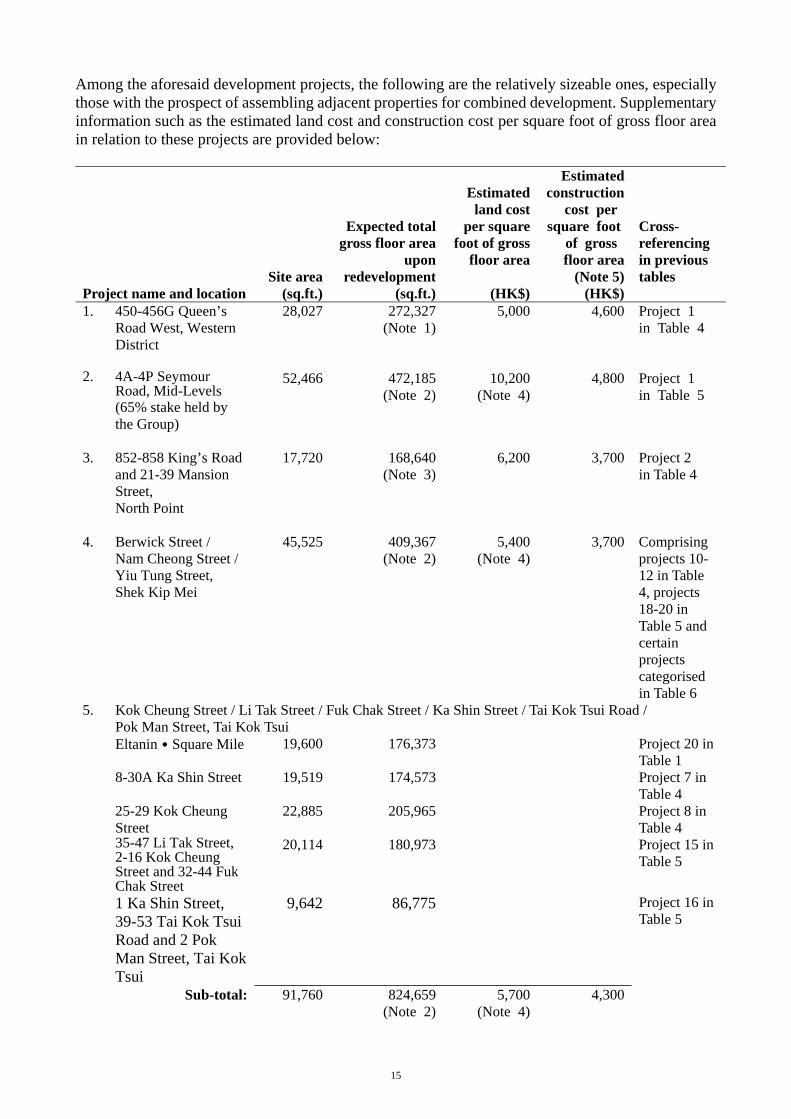
Among the aforesaid development projects, the following are the relatively sizeable ones, especially those with the prospect of assembling adjacent properties for combined development. Supplementary information such as the estimated land cost and construction cost per square foot of gross floor area in relation to these projects are provided below:
Site area
Expected total gross floor area
upon redevelopment
Estimated land cost
per square foot of gross
floor area
Estimated construction
cost per square foot
of gross floor area
(Note 5)
Cross-referencing in previous tables
Project name and location (sq.ft.) (sq.ft.) (HK$) (HK$) 1. 450-456G Queen’s
Road West, Western District
28,027 272,327(Note 1)
5,000 4,600 Project 1 in Table 4
2. 4A-4P Seymour Road, Mid-Levels (65% stake held by the Group)
52,466 472,185(Note 2)
10,200(Note 4)
4,800 Project 1 in Table 5
3. 852-858 King’s Road and 21-39 Mansion Street, North Point
17,720 168,640(Note 3)
6,200 3,700 Project 2 in Table 4
4. Berwick Street / Nam Cheong Street / Yiu Tung Street, Shek Kip Mei
45,525 409,367(Note 2)
5,400(Note 4)
3,700 Comprising projects 10-12 in Table 4, projects 18-20 in Table 5 and certain projects categorised in Table 6
5. Kok Cheung Street / Li Tak Street / Fuk Chak Street / Ka Shin Street / Tai Kok Tsui Road / Pok Man Street, Tai Kok Tsui
Eltanin˙Square Mile 19,600 176,373 Project 20 in Table 1
8-30A Ka Shin Street 19,519 174,573 Project 7 in Table 4
25-29 Kok Cheung Street
22,885 205,965 Project 8 in Table 4
35-47 Li Tak Street, 2-16 Kok Cheung Street and 32-44 Fuk Chak Street
20,114 180,973 Project 15 in Table 5
1 Ka Shin Street, 39-53 Tai Kok Tsui Road and 2 Pok Man Street, Tai Kok Tsui
9,642 86,775 Project 16 in Table 5
Sub-total:
91,760 824,659(Note 2)
5,700(Note 4)
4,300
16
6. Gillies Avenue South / Baker Street / Whampoa Street / Bulkeley Street, Hung Hom 31-33 Whampoa
Street 3,000 25,500 Project 17 in
Table 4 6-28 Gillies Avenue
South and 76-78 Baker Street
19,975 179,775 Project 21 in Table 5
1-21C Whampoa Street and 80-86 Baker Street
19,725 177,525 Project 22 in Table 5
2-16A Whampoa Street
14,400 129,600 Project 23 in Table 5
30-44 Gillies Avenue South and 75-77 Baker Street
13,175 118,575 Project 24 in Table 5
23-25 Whampoa Street and 79-81 Baker Street
2,625 23,625 Project 25 in Table 5
26-36A Whampoa Street and 83-85 Baker Street
9,775 87,975 Project 26 in Table 5
39-41 Whampoa Street and 12A-12B Bulkeley Street
2,800 25,200 Project 27 in Table 5
18-22A Bulkeley Street and 46-50 Gillies Avenue South
7,000 63,000 Project 28 in Table 5
Other sites with ownership ranging from more than 20% to less than 80%
22,975 208,275 Table 6
Sub-total:
115,450 1,039,050(Note 2)
6,500(Note 4)
4,000
7. 18 King Wah Road North Point
52,689 329,755(Note 1)
(Note 6) 3,300 Project 3 in Table 3
8. Lot No. 2640 in DD No.92 Castle Peak Road-Kwu Tung, Sheung Shui
154,280 555,398(Note 1)
5,200 4,320
9. 15 Middle Road Tsim Sha Tsui
28,309 339,646(Note 1)
13,800 3,500
10. Kwun Chui Road Area 56, Tuen Mun Town Lot No. 500
261,953 785,341(Note 3)
4,620 4,000
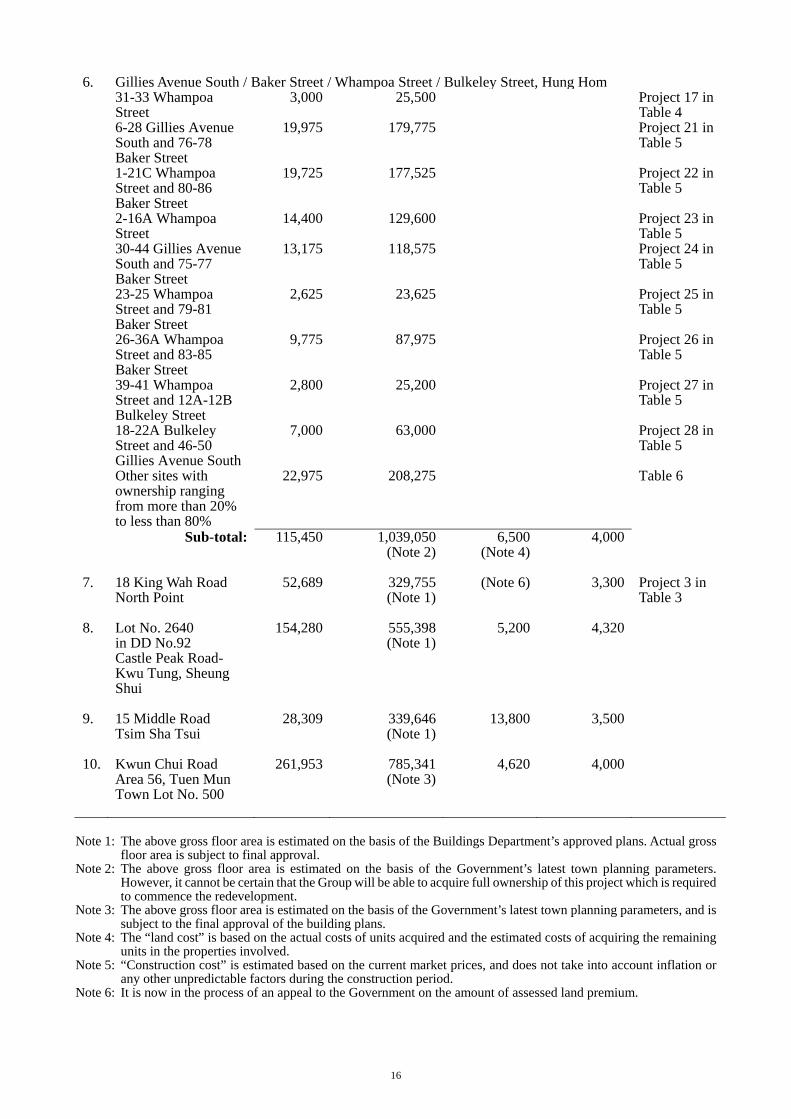
Note 1: The above gross floor area is estimated on the basis of the Buildings Department’s approved plans. Actual gross
floor area is subject to final approval. Note 2: The above gross floor area is estimated on the basis of the Government’s latest town planning parameters.
However, it cannot be certain that the Group will be able to acquire full ownership of this project which is required to commence the redevelopment.
Note 3: The above gross floor area is estimated on the basis of the Government’s latest town planning parameters, and is subject to the final approval of the building plans.
Note 4: The “land cost” is based on the actual costs of units acquired and the estimated costs of acquiring the remaining units in the properties involved.
Note 5: “Construction cost” is estimated based on the current market prices, and does not take into account inflation or any other unpredictable factors during the construction period.
Note 6: It is now in the process of an appeal to the Government on the amount of assessed land premium.
17
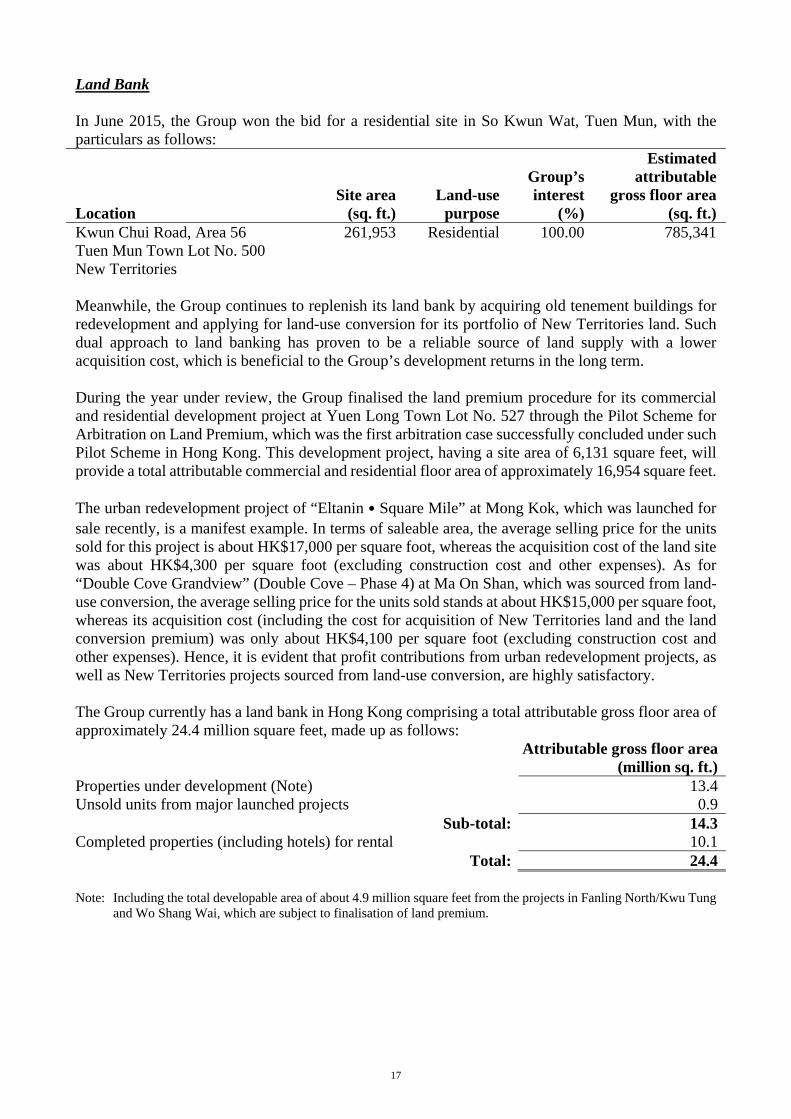
Land Bank In June 2015, the Group won the bid for a residential site in So Kwun Wat, Tuen Mun, with the particulars as follows:
Location Site area
(sq. ft.)Land-use
purpose
Group’s interest
(%)
Estimated attributable
gross floor area(sq. ft.)
Kwun Chui Road, Area 56 Tuen Mun Town Lot No. 500 New Territories
261,953 Residential 100.00 785,341
Meanwhile, the Group continues to replenish its land bank by acquiring old tenement buildings for redevelopment and applying for land-use conversion for its portfolio of New Territories land. Such dual approach to land banking has proven to be a reliable source of land supply with a lower acquisition cost, which is beneficial to the Group’s development returns in the long term. During the year under review, the Group finalised the land premium procedure for its commercial and residential development project at Yuen Long Town Lot No. 527 through the Pilot Scheme for Arbitration on Land Premium, which was the first arbitration case successfully concluded under such Pilot Scheme in Hong Kong. This development project, having a site area of 6,131 square feet, will provide a total attributable commercial and residential floor area of approximately 16,954 square feet. The urban redevelopment project of “Eltanin˙Square Mile” at Mong Kok, which was launched for sale recently, is a manifest example. In terms of saleable area, the average selling price for the units sold for this project is about HK$17,000 per square foot, whereas the acquisition cost of the land site was about HK$4,300 per square foot (excluding construction cost and other expenses). As for “Double Cove Grandview” (Double Cove – Phase 4) at Ma On Shan, which was sourced from land-use conversion, the average selling price for the units sold stands at about HK$15,000 per square foot, whereas its acquisition cost (including the cost for acquisition of New Territories land and the land conversion premium) was only about HK$4,100 per square foot (excluding construction cost and other expenses). Hence, it is evident that profit contributions from urban redevelopment projects, as well as New Territories projects sourced from land-use conversion, are highly satisfactory. The Group currently has a land bank in Hong Kong comprising a total attributable gross floor area of approximately 24.4 million square feet, made up as follows:
Attributable gross floor area
(million sq. ft.)Properties under development (Note) 13.4Unsold units from major launched projects 0.9
Sub-total: 14.3Completed properties (including hotels) for rental 10.1
Total: 24.4 Note: Including the total developable area of about 4.9 million square feet from the projects in Fanling North/Kwu Tung
and Wo Shang Wai, which are subject to finalisation of land premium.
18
Land in Urban Areas As aforesaid, there are currently 45 urban redevelopment projects of old tenement buildings with entire or over 80% ownership acquired, representing a total attributable gross floor area of about 3.8 million square feet, which are expected to be ready for sale or leasing in 2017 or beyond. The total land cost of such projects is estimated to be about HK$24,300 million (in spite of the inclusion of pricey street shops and the project at the prestigious Seymour Road in Mid-Levels), translating into a land cost of approximately HK$6,400 per square foot of gross floor area. During the year under review, the Group completed the acquisition of the entire interests in the projects at 69-83 Fuk Lo Tsun Road, Kowloon City, 1-3 Chung Ching Street, Sheung Wan and 31-33 Whampoa Street, Hung Hom. The sites for the project at 206-212 Johnston Road, Wanchai, as well as two projects at 6-28 Gillies Avenue South/76-78 Baker Street and 18-22A Bulkeley Street/46-50 Gillies Avenue South in Hung Hom, were all enlarged following the completion of the acquisition of the adjacent buildings. For the industrial site at 18 King Wah Road, North Point, it is planned to be redeveloped into an office building pending an appeal to the Government on the amount of assessed land premium. Meanwhile, the residential-cum-commercial project at Yau Tong Bay is also in the process of application for land exchange.
19
New Territories land At the end of December 2015, the Group held New Territories land reserves amounting to approximately 45 million square feet in land area, which was the largest holding among all property developers in Hong Kong. In July 2013, the Government announced the result of the “North East New Territories New Development Areas Planning and Engineering Study”, of which Kwu Tung North and Fanling North would be treated as the extension of Fanling/Sheung Shui New Town. The Government has also decided to adopt an enhanced Conventional New Town Approach and, subject to specified criteria, private land owners are allowed to apply for in-situ land exchange for private developments. Outline Zoning Plans for both Kwu Tung North and Fanling North were already approved by the Chief Executive-in-Council during the year under review. Of the Group’s land holding of 2.4 million square feet in the Fanling North New Development Area, a total land area of roughly over 800,000 square feet is assessed to be eligible for in-situ land exchange and the Government may resume the other parts of its lands for public use by payment of cash compensation. The Group has previously applied for in-situ land exchange for two land lots in Fanling North and Kwu Tung, which have just been accepted by the Government for further review. The two sites are expected to provide total developable gross floor areas of approximately 600,000 square feet and 340,000 square feet respectively, against their respective site areas of 174,000 square feet and 45,000 square feet. Three other land lots in Fanling North, with the respective site areas of 228,000 square feet, 241,000 square feet and 240,000 square feet, were also submitted for in-situ land change. Four land lots in Fanling North are expected to provide in aggregate commercial gross floor area of 440,000 square feet and residential gross floor area of 3.64 million square feet approximately. Developable areas for these sites are subject to finalisation of land premium and the construction cost is estimated to be about HK$4,000 per square foot of gross floor area. According to the aforementioned “North East New Territories New Development Areas Planning and Engineering Study”, the region at Ping Che/Ta Kwu Ling will be re-planned, in response to the “2013 Policy Address” which proposed an initiative to review the development potential of New Territories North, including new opportunities brought about by the new railway infrastructure. In January 2014, the Government commenced its “Preliminary Feasibility Study on Developing the New Territories North” on a study area of about 5,300 hectares. In September 2014, the Government announced the “Railway Development Strategy”, including its long-term extension plan to further extend the railway line to Kwu Tung and Ping Che. The Group has a land holding of about 1.34 million square feet in Ping Che/Ta Kwu Ling which are embodied in the Master Layout Plan of the original “North East New Territories New Development Areas Planning and Engineering Study”. In addition, the Group has about 1.09 million square feet of land in the adjacent areas, making a total of about 2.43 million square feet in the region. In order to increase the land supply for housing, during the period the Government formulated the Preliminary Outline Development Plan for “Planning and Engineering Study for Housing Sites in Yuen Long South – Investigation” and launched its Stage 2 Community Engagement. It also released the “Land Use Review for Kam Tin South and Pat Heung”. The Group holds certain pieces of land in these Study Areas. As for “Hung Shui Kiu New Development Area Planning and Engineering Study”, the Group holds a total land area of approximately 6.31 million square feet in this location, which covers an area of about 714 hectares. Under the Preliminary Outline Development Plan, it was proposed to accommodate a new town of a population comprising about 215,000 and about 60,000 additional flats, of which about 50% are private developments. The effects of these proposals on the Group are to be assessed. The Group will continue to work in line with the Government’s development policies and follow up closely on its development plans. Besides, the development of houses cum wetland restoration project in Wo Shang Wai, Yuen Long has been approved by the Town Planning Board. With a site area of approximately 2.23 million square feet, this project will comprise about 400 houses, providing a total residential floor area of approximately 890,000 square feet. Negotiation of the land premium is now under way and project implementation is subject to the finalisation of the land premium amount with the Government and the construction cost is estimated to be about HK$7,500 per square foot of gross floor area.
20
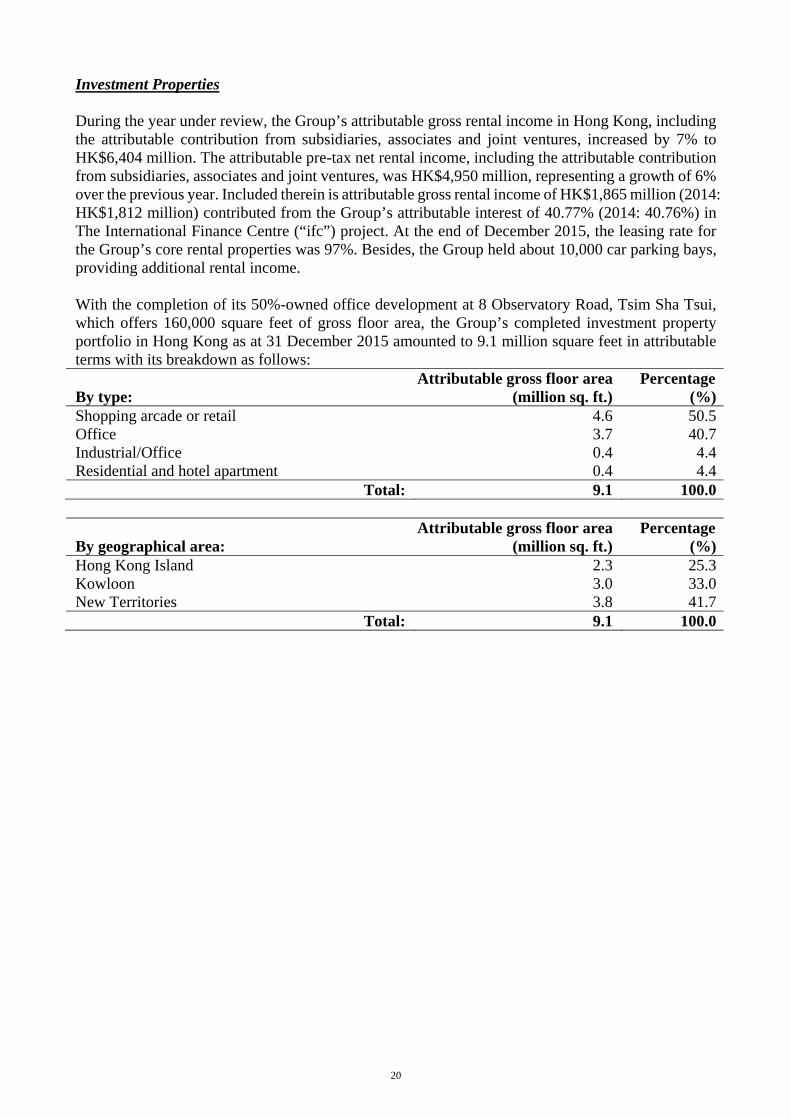
Investment Properties During the year under review, the Group’s attributable gross rental income in Hong Kong, including the attributable contribution from subsidiaries, associates and joint ventures, increased by 7% to HK$6,404 million. The attributable pre-tax net rental income, including the attributable contribution from subsidiaries, associates and joint ventures, was HK$4,950 million, representing a growth of 6% over the previous year. Included therein is attributable gross rental income of HK$1,865 million (2014: HK$1,812 million) contributed from the Group’s attributable interest of 40.77% (2014: 40.76%) in The International Finance Centre (“ifc”) project. At the end of December 2015, the leasing rate for the Group’s core rental properties was 97%. Besides, the Group held about 10,000 car parking bays, providing additional rental income. With the completion of its 50%-owned office development at 8 Observatory Road, Tsim Sha Tsui, which offers 160,000 square feet of gross floor area, the Group’s completed investment property portfolio in Hong Kong as at 31 December 2015 amounted to 9.1 million square feet in attributable terms with its breakdown as follows:
By type: Attributable gross floor area
(million sq. ft.) Percentage
(%)Shopping arcade or retail 4.6 50.5Office 3.7 40.7Industrial/Office 0.4 4.4Residential and hotel apartment 0.4 4.4
Total: 9.1 100.0
By geographical area: Attributable gross floor area
(million sq. ft.) Percentage
(%)Hong Kong Island 2.3 25.3Kowloon 3.0 33.0New Territories 3.8 41.7
Total: 9.1 100.0
21
In 2015, the continued slowdown in inbound tourism and the uncertain economic outlook amid the US interest rate normalisation dented local consumption sentiment, leading to a 3.7% drop in the value of total retail sales in Hong Kong. However, the Group’s retail portfolio, which comprises many large-scale shopping malls in the populous new towns catering to local consumption, recorded satisfactory rental income growth with nearly full occupancy (except those under renovation or realignment of tenant mix) at the end of December 2015. Such satisfactory results were mainly due to the Group’s various initiatives to enhance the appeal of its malls so as to maintain their competitiveness. For instance, “KOLOUR” has been established as a new brand comprising a series of cosy and chic shopping malls under the Group’s retail portfolio. During the year under review, “Citimall” in Yuen Long and “City Landmark I and II” in Tsuen Wan were re-branded as “KOLOUR˙Yuen Long” and “KOLOUR˙Tsuen Wan I and II” respectively. “KOLOUR˙Yuen Long”, after refining its tenant mix and upgrading its position, recorded considerable growth in rents and shopper traffic. “KOLOUR˙Tsuen Wan I” is also undergoing a series of renovation works which are set to give customers a fresh shopping experience after the revamp. Meanwhile, a customer loyalty programme and iBeacon technology were introduced in “Metro City Phase 2” in Tseung Kwan O so as to enhance the interaction between shoppers and tenants. Supported by the influx of mainland companies and limited new supply, the office leasing market in Hong Kong was buoyant during the year under review. The Group’s quality office developments in the core areas, such as “ifc” in Central, “AIA Tower” in North Point, as well as “Golden Centre” and “FWD Financial Centre” in Sheung Wan, all performed well. Meanwhile, the Group’s portfolio of office and industrial/office premises in Kowloon East, including “Manulife Financial Centre”, “AIA Financial Centre”, “78 Hung To Road” and “Bamboos Centre”, also recorded satisfactory rental reversions on renewals and new leases. In order to further improve rental values and appeal to discerning tenants, phased renovations for “AIA Tower”, “FWD Financial Centre” and “Golden Centre” are now underway.
22
Hotel Operations Overnight visitor arrivals to Hong Kong declined by 3.9% in 2015. The Group’s Newton Hotel Hong Kong ceased operating in August 2015 so as to make way for its redevelopment into an office building. As a result, the Group’s pre-tax profit from hotel operations, including the attributable contribution from its subsidiaries, associates and joint ventures, decreased by 23% to HK$251 million during the year under review. Four Seasons Hotel Hong Kong, which received a quadruple 5-star award from Forbes Travel Guide 2015, continued to record high occupancy and room rate. Its Lung King Heen restaurant also won the top 3-star honour from the Michelin Guide to Hong Kong and Macau 2016. The remaining two Newton hotels owned by the Group (namely, the 317-room Newton Inn North Point and the 598-room Newton Place Hotel) recorded a dip in room rate and occupancy amid intensifying competition in their market segment. Construction The International Property Awards, which are highly regarded in the industry around the globe, announced the Group’s high-rise apartments of “Double Cove”, the urban renewal mixed-use project in Tai Kok Tsui, as well as the office development at King Wah Road as winners of the “Top Five-star” in the Asia Pacific region for 2015. These awards are a testimony to the Group’s commitment to building excellence in all its property developments. Besides, “Double Cove” achieved the “Best International Residential High-Rise Development” among all the regions. It is also the first Hong Kong project to receive a Pre-Certification in the Leadership in Energy and Environmental Design for Neighbourhood Development (LEED-ND) awarded by the U.S. Green Building Council. Such accreditation elevated Double Cove’s achievement from the level of “green building” to “green neighbourhood”, meaning it has successfully promoted social and environmental harmony which benefitted the surrounding community. Teamwork, as well as meticulous planning throughout the construction process, contribute to the Group’s success. For instance, advanced eco-friendly features recommended by the LEED and Building Environmental Assessment Method (BEAM) Plus rating systems are adopted in the Group’s projects. In addition to the use of self-developed pre-fabricated building components, the Group also self-contracted for the foundation piling works of its development projects so as to expedite the construction process and minimise disruption to neighbourhoods. Against the prevailing backdrop of soaring material costs and a shortage of construction workers, all the above measures help improve quality and cost efficiency by reducing construction waste and manpower. Furthermore, with a large number of projects under development, the Group has implemented a series of measures, such as bulk purchases of building materials and outsourcing to more well-qualified sub-contractors, to further reduce construction costs by economies of scale.
23
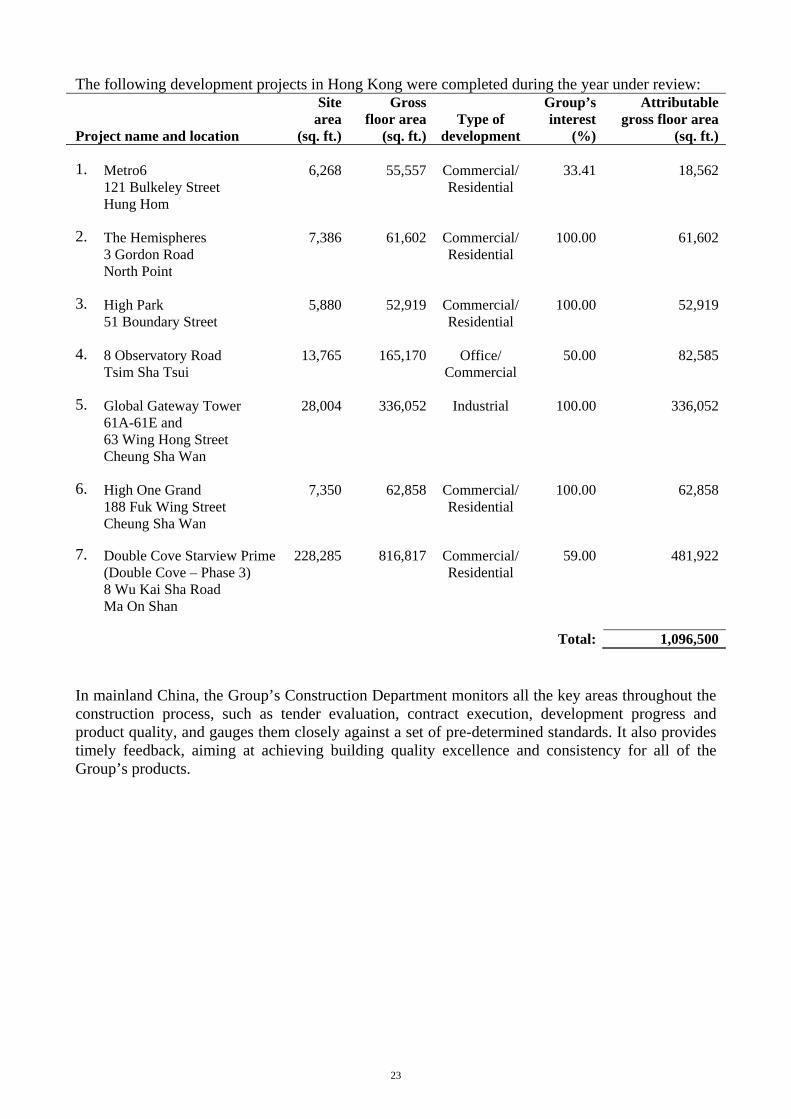
The following development projects in Hong Kong were completed during the year under review:
Project name and location
Site area
(sq. ft.)
Grossfloor area
(sq. ft.)Type of
development
Group’s interest
(%)
Attributablegross floor area
(sq. ft.) 1. Metro6
121 Bulkeley Street Hung Hom
6,268 55,557 Commercial/Residential
33.41 18,562
2. The Hemispheres 3 Gordon Road North Point
7,386 61,602 Commercial/Residential
100.00 61,602
3. High Park 51 Boundary Street
5,880 52,919 Commercial/Residential
100.00 52,919
4. 8 Observatory Road Tsim Sha Tsui
13,765 165,170 Office/ Commercial
50.00 82,585
5. Global Gateway Tower 61A-61E and 63 Wing Hong Street Cheung Sha Wan
28,004 336,052 Industrial 100.00 336,052
6. High One Grand 188 Fuk Wing Street Cheung Sha Wan
7,350 62,858 Commercial/Residential
100.00 62,858
7. Double Cove Starview Prime (Double Cove – Phase 3) 8 Wu Kai Sha Road Ma On Shan
228,285 816,817 Commercial/Residential
59.00 481,922
Total: 1,096,500 In mainland China, the Group’s Construction Department monitors all the key areas throughout the construction process, such as tender evaluation, contract execution, development progress and product quality, and gauges them closely against a set of pre-determined standards. It also provides timely feedback, aiming at achieving building quality excellence and consistency for all of the Group’s products.
24
Property Management The Group’s property management companies, namely, Hang Yick Properties Management Limited, Well Born Real Estate Management Limited and Goodwill Management Limited, manage in total over 80,000 apartments and industrial/commercial units, 8 million square feet of shopping and office space, as well as 20,000 car parking spaces in Hong Kong and mainland China. The Group’s Property Management team believes that excellent building quality, when supplemented by a comprehensive and meticulous after-sales property management service, generates certain synergies. During the year under review, “Double Cove” in Ma On Shan, which is already an award-winning development for its building quality, won “Excellence in Facility Management Award 2015” from The Hong Kong Institute of Facility Management, reaffirming the team’s leading service quality in the sector. For those urban boutique residences that make up “The H Collection”, these property management subsidiaries offer unparalleled one-stop home services enabling discerning residents to enjoy hassle-free urban living. Meanwhile, their commitment to service excellence has also been extended to the Group’s property developments in mainland China. “Hengbao Huating” in Guangzhou and “The Arch of Triumph” in Changsha received the designations as “Guangdong Province Enterprise of Observing Contract and Valuing Credit 2014” and “The 2013 1st runner-up in the Property Services Excellence for Housing Community” respectively. The Group’s property management subsidiaries are on the front-line to serve the community and to fulfil Henderson Land’s commitment to corporate social responsibility. Following the success of the preceding “Year of Senior”, the Property Management Team launched “The Year of Youth” so as to raise public awareness of the all-round development of young people. In addition to receiving the Gold Award in “The 4th Hong Kong Outstanding Corporate Awards - Category of Volunteer Team”, their volunteer team also won the “Highest Service Hour Award” championship, setting a new record by achieving such a top honour for the tenth year.
25
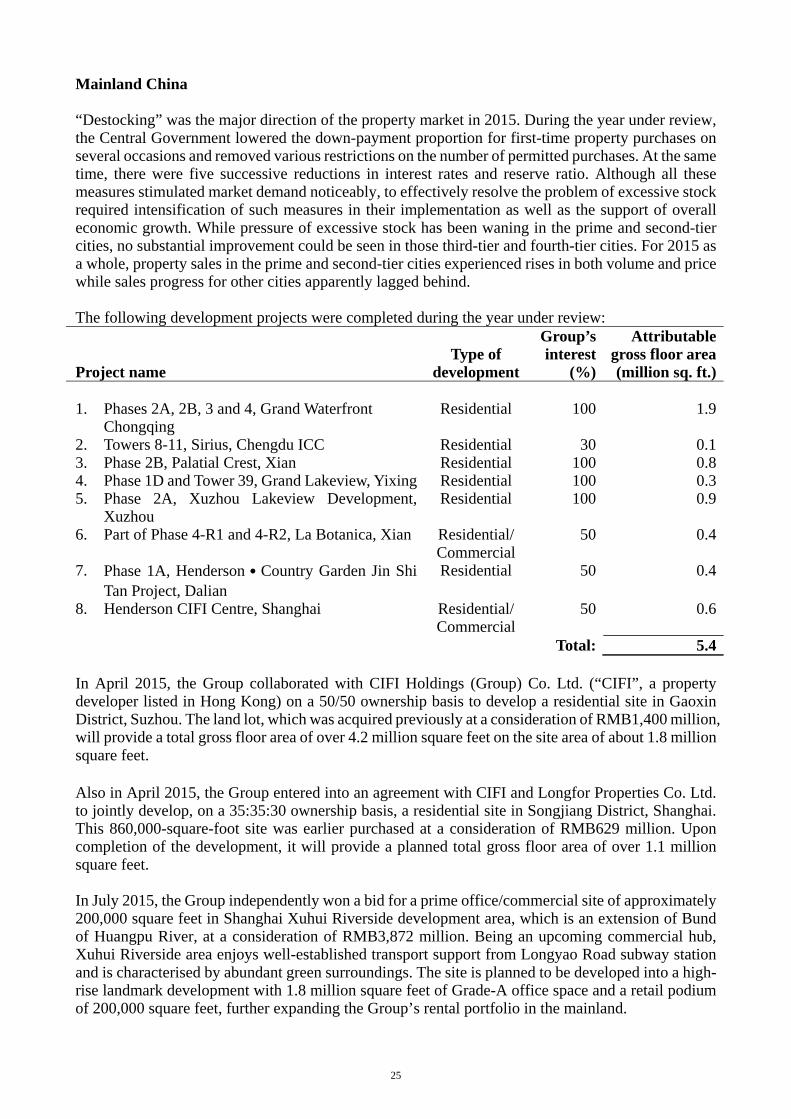
Mainland China “Destocking” was the major direction of the property market in 2015. During the year under review, the Central Government lowered the down-payment proportion for first-time property purchases on several occasions and removed various restrictions on the number of permitted purchases. At the same time, there were five successive reductions in interest rates and reserve ratio. Although all these measures stimulated market demand noticeably, to effectively resolve the problem of excessive stock required intensification of such measures in their implementation as well as the support of overall economic growth. While pressure of excessive stock has been waning in the prime and second-tier cities, no substantial improvement could be seen in those third-tier and fourth-tier cities. For 2015 as a whole, property sales in the prime and second-tier cities experienced rises in both volume and price while sales progress for other cities apparently lagged behind. The following development projects were completed during the year under review:
Project name Type of
development
Group’s interest
(%)
Attributablegross floor area(million sq. ft.)
1. Phases 2A, 2B, 3 and 4, Grand Waterfront
Chongqing Residential 100 1.9
2. Towers 8-11, Sirius, Chengdu ICC Residential 30 0.13. Phase 2B, Palatial Crest, Xian Residential 100 0.84. Phase 1D and Tower 39, Grand Lakeview, Yixing Residential 100 0.35. Phase 2A, Xuzhou Lakeview Development,
Xuzhou Residential 100 0.9
6. Part of Phase 4-R1 and 4-R2, La Botanica, Xian Residential/ Commercial
50 0.4
7. Phase 1A, Henderson˙Country Garden Jin Shi Tan Project, Dalian
Residential 50 0.4
8. Henderson CIFI Centre, Shanghai Residential/ Commercial
50 0.6
Total: 5.4 In April 2015, the Group collaborated with CIFI Holdings (Group) Co. Ltd. (“CIFI”, a property developer listed in Hong Kong) on a 50/50 ownership basis to develop a residential site in Gaoxin District, Suzhou. The land lot, which was acquired previously at a consideration of RMB1,400 million, will provide a total gross floor area of over 4.2 million square feet on the site area of about 1.8 million square feet. Also in April 2015, the Group entered into an agreement with CIFI and Longfor Properties Co. Ltd. to jointly develop, on a 35:35:30 ownership basis, a residential site in Songjiang District, Shanghai. This 860,000-square-foot site was earlier purchased at a consideration of RMB629 million. Upon completion of the development, it will provide a planned total gross floor area of over 1.1 million square feet. In July 2015, the Group independently won a bid for a prime office/commercial site of approximately 200,000 square feet in Shanghai Xuhui Riverside development area, which is an extension of Bund of Huangpu River, at a consideration of RMB3,872 million. Being an upcoming commercial hub, Xuhui Riverside area enjoys well-established transport support from Longyao Road subway station and is characterised by abundant green surroundings. The site is planned to be developed into a high-rise landmark development with 1.8 million square feet of Grade-A office space and a retail podium of 200,000 square feet, further expanding the Group’s rental portfolio in the mainland.
26
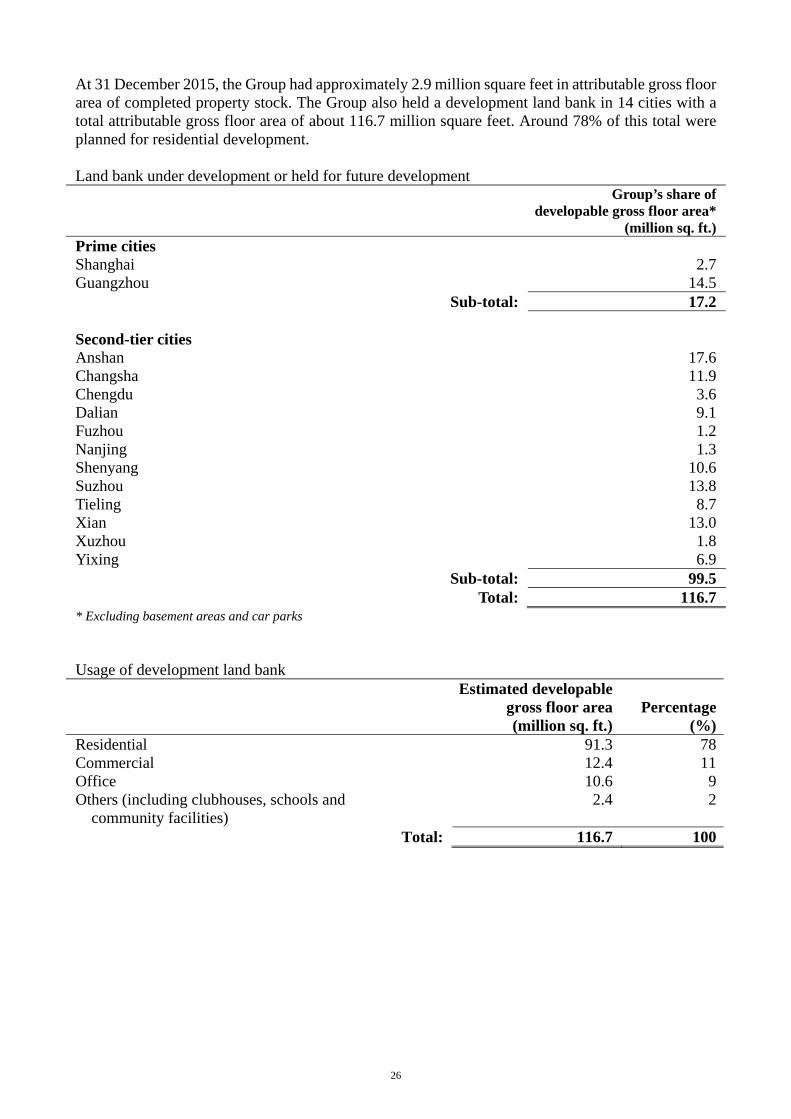
At 31 December 2015, the Group had approximately 2.9 million square feet in attributable gross floor area of completed property stock. The Group also held a development land bank in 14 cities with a total attributable gross floor area of about 116.7 million square feet. Around 78% of this total were planned for residential development. Land bank under development or held for future development
Group’s share ofdevelopable gross floor area*
(million sq. ft.)Prime cities Shanghai 2.7Guangzhou 14.5
Sub-total: 17.2 Second-tier cities Anshan 17.6Changsha 11.9Chengdu 3.6Dalian 9.1Fuzhou 1.2Nanjing 1.3Shenyang 10.6Suzhou 13.8Tieling 8.7Xian 13.0Xuzhou 1.8Yixing 6.9
Sub-total: 99.5Total: 116.7
* Excluding basement areas and car parks Usage of development land bank
Estimated developable gross floor area (million sq. ft.)
Percentage(%)
Residential 91.3 78Commercial 12.4 11Office 10.6 9Others (including clubhouses, schools and
community facilities) 2.4 2
Total: 116.7 100
27
Property Sales During the year under review, the Group achieved attributable contracted sales of approximately HK$7,290 million in value and 7.3 million square feet in attributable gross floor area, representing year-on-year increases of 40% and 26% respectively. Most of the attributable contracted sales were contributed by major projects including “Riverside Park” in Suzhou, “Henderson CIFI Centre” in Shanghai, “Emerald Valley” in Nanjing, “Grand Lakeview” in Yixing, as well as “Palatial Crest” and “La Bontanica” in Xian. Meanwhile, in July 2015, the Group sold its 51% stake in “Henderson CIFI Palace” in Hangzhou at a consideration of USD66.3 million to a group company of CIFI. Such disposal was due to the fact that the Group had no other project in Hangzhou to form any synergy. Investment Properties At 31 December 2015, the Group had 7.3 million square feet of completed investment properties in mainland China, comprising mainly offices and shopping malls in the centres of major cities such as Beijing, Shanghai and Guangzhou. Driven by higher market rent and greater contributions from the newly completed “Henderson 688’’ in Shanghai, the Group’s attributable gross rental income increased by 18% to HK$1,748 million, whilst its attributable pre-tax net rental income also increased by 23% to HK$1,353 million during the year under review. In Shanghai, “Henderson Metropolitan” atop the Nanjing Road East subway station was virtually fully let with a significant rise in rental contribution during the year under review. Following the grand opening of PUMA flagship store, an innovative game zone will be opened in this mall in 2016. The Group will continue to adjust the tenant mix for this mall so as to enhance customer experience and boost turnover for its tenants. The 710,000-square-foot “Henderson 688” at Nanjing Road West was fully let by the end of 2015, filled with numerous quality multi-national corporations such as New Balance and Publicis Groupe. “Grand Gateway II’’ atop the Xujiahui subway station is famous for its high operational efficiency and has been generating stable and sizeable rental contributions for the Group. “Greentech Tower” and “Centro”, which are both located in the Zhabei district, recorded steady rental growth and high occupancy rates during the year under review. Both projects stand to benefit from the continual development in their neighbouring Suzhou Creek area. In Beijing, “World Financial Centre’’ in the Chaoyang central business district has been tenanted by many world-renowned financial institutions and multinational corporations since its completion in 2009. This international Grade-A office complex was almost fully let and gross rental income increased by 17% over the previous year. Located next to the Beijing Railway Station, the “Henderson Centre’’ shopping mall provides unrivalled shopping convenience to both travelers and local customers. Its leasing rate was over 94% at 31 December 2015 with an asset enhancement plan to be kick-started in 2016. In Guangzhou, “Hengbao Plaza” atop the Changshou Road subway station was over 91% let at the end of December 2015. The renowned fashion brand Uniqlo is expected to open for business in the third quarter of 2016, reinforcing the position of this mall as the leading fashion hotspot in town.
28
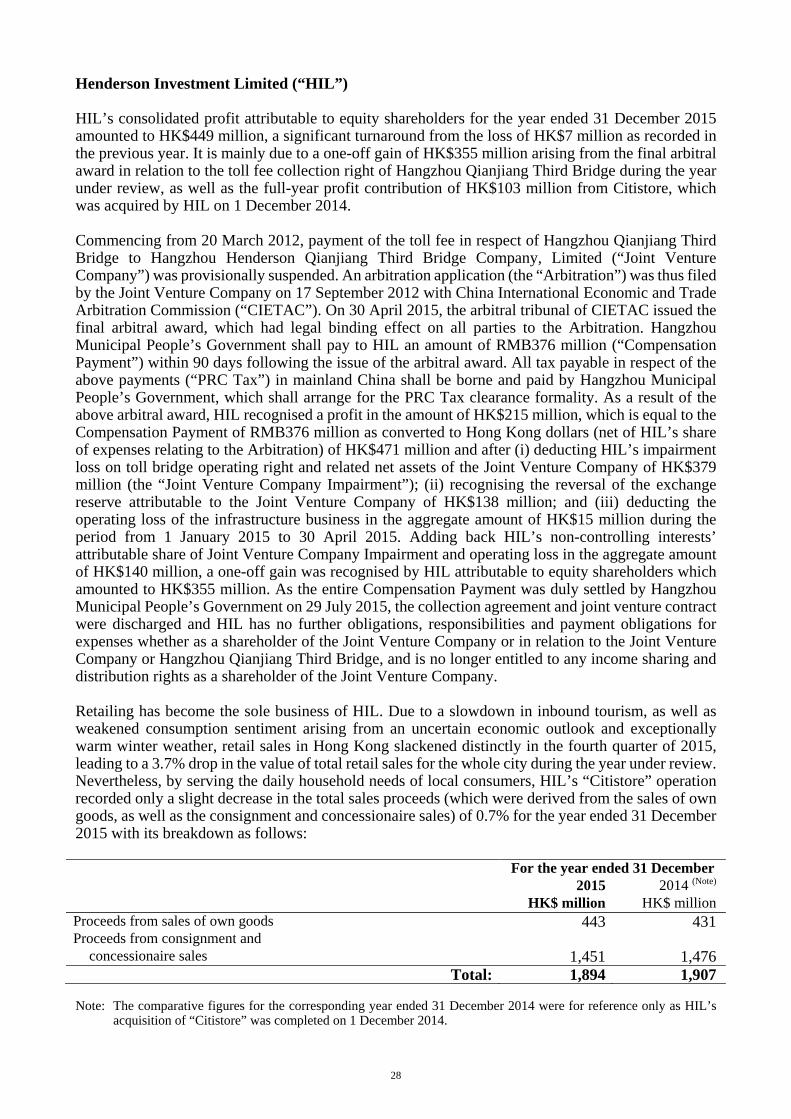
Henderson Investment Limited (“HIL”) HIL’s consolidated profit attributable to equity shareholders for the year ended 31 December 2015 amounted to HK$449 million, a significant turnaround from the loss of HK$7 million as recorded in the previous year. It is mainly due to a one-off gain of HK$355 million arising from the final arbitral award in relation to the toll fee collection right of Hangzhou Qianjiang Third Bridge during the year under review, as well as the full-year profit contribution of HK$103 million from Citistore, which was acquired by HIL on 1 December 2014. Commencing from 20 March 2012, payment of the toll fee in respect of Hangzhou Qianjiang Third Bridge to Hangzhou Henderson Qianjiang Third Bridge Company, Limited (“Joint Venture Company”) was provisionally suspended. An arbitration application (the “Arbitration”) was thus filed by the Joint Venture Company on 17 September 2012 with China International Economic and Trade Arbitration Commission (“CIETAC”). On 30 April 2015, the arbitral tribunal of CIETAC issued the final arbitral award, which had legal binding effect on all parties to the Arbitration. Hangzhou Municipal People’s Government shall pay to HIL an amount of RMB376 million (“Compensation Payment”) within 90 days following the issue of the arbitral award. All tax payable in respect of the above payments (“PRC Tax”) in mainland China shall be borne and paid by Hangzhou Municipal People’s Government, which shall arrange for the PRC Tax clearance formality. As a result of the above arbitral award, HIL recognised a profit in the amount of HK$215 million, which is equal to the Compensation Payment of RMB376 million as converted to Hong Kong dollars (net of HIL’s share of expenses relating to the Arbitration) of HK$471 million and after (i) deducting HIL’s impairment loss on toll bridge operating right and related net assets of the Joint Venture Company of HK$379 million (the “Joint Venture Company Impairment”); (ii) recognising the reversal of the exchange reserve attributable to the Joint Venture Company of HK$138 million; and (iii) deducting the operating loss of the infrastructure business in the aggregate amount of HK$15 million during the period from 1 January 2015 to 30 April 2015. Adding back HIL’s non-controlling interests’ attributable share of Joint Venture Company Impairment and operating loss in the aggregate amount of HK$140 million, a one-off gain was recognised by HIL attributable to equity shareholders which amounted to HK$355 million. As the entire Compensation Payment was duly settled by Hangzhou Municipal People’s Government on 29 July 2015, the collection agreement and joint venture contract were discharged and HIL has no further obligations, responsibilities and payment obligations for expenses whether as a shareholder of the Joint Venture Company or in relation to the Joint Venture Company or Hangzhou Qianjiang Third Bridge, and is no longer entitled to any income sharing and distribution rights as a shareholder of the Joint Venture Company. Retailing has become the sole business of HIL. Due to a slowdown in inbound tourism, as well as weakened consumption sentiment arising from an uncertain economic outlook and exceptionally warm winter weather, retail sales in Hong Kong slackened distinctly in the fourth quarter of 2015, leading to a 3.7% drop in the value of total retail sales for the whole city during the year under review. Nevertheless, by serving the daily household needs of local consumers, HIL’s “Citistore” operation recorded only a slight decrease in the total sales proceeds (which were derived from the sales of own goods, as well as the consignment and concessionaire sales) of 0.7% for the year ended 31 December 2015 with its breakdown as follows: For the year ended 31 December 2015 2014 (Note)
HK$ million HK$ millionProceeds from sales of own goods 443 431Proceeds from consignment and
concessionaire sales 1,451 1,476Total: 1,894 1,907
Note: The comparative figures for the corresponding year ended 31 December 2014 were for reference only as HIL’s
acquisition of “Citistore” was completed on 1 December 2014.
29
Citistore’s sales of own goods retreated in the fourth quarter of 2015 due to the exceptionally warm weather in Hong Kong. However, its total sales of own goods for the year under review amounted to HK$443 million, representing an increase of 3% over HK$431 million for the previous year. The Household & Toys category made up approximately 53% of the annual revenue from sales of goods, the Apparel & Accessories category contributed approximately 34% and the balance of approximately 13% came from the categories of Cosmetics and Food. Citistore regularly reviews its merchandise mix. Having regard to market trends and consumer preferences, a wide range of highly sought-after products with better profit margins were introduced during the year under review. Through keen promotional efforts and improved customer services, a stable gross margin of 36% was achieved along with increased sales.
Citistore’s concessionaire sales are conducted by licensing portions of shop spaces to its concessionaires for setting up their own concession counters to sell their products, whilst consignment sales comprise the sale of a consignor’s own products on or in designated shelves, areas or spaces. These consignment and concessionaire counters are charged on the basis of revenue sharing or basic rent (if any), whichever is higher, which are recognised as Citistore’s rental income. During the year under review, the total rental income derived from these consignment and concessionaire counters was flat at HK$429 million compared with the previous year, despite the slight year-on-year drop in the total sales proceeds from these counters. In summary, due to (i) the decrease in profit contribution in the fourth quarter of 2015 as a result of the exceptionally warm weather in Hong Kong; (ii) rental charges in the accounts being higher than the actual rental expenses in the early part of the tenure as a result of amortised rental expenses during the year based on the new 9-year tenancy lease agreements, which became effective in October 2014, with rent escalation for each 3-year period, and (iii) a one-off net gain of HK$17 million in the previous year from the reversal of rent-free amortisation upon early termination of the preceding lease agreements, Citistore’s profit after taxation for the year ended 31 December 2015 amounted to HK$103 million, representing a decrease of 27% or HK$39 million as compared with the previous year. As the overall economy is expected to soften in the financial year ahead, HIL will keep sourcing new merchandise, and improving the interior decoration and display of Citistore so as to offer a fresh shopping experience to customers. HIL will also continue to launch an array of innovative promotions and exercise stringent cost controls, thereby further enhancing the overall results of Citistore.
30
Associated Companies The Hong Kong and China Gas Company Limited (“Hong Kong and China Gas”) Profit after taxation attributable to shareholders of Hong Kong and China Gas for 2015 increased by approximately 3% to HK$7,302 million, an increase of HK$193 million compared to 2014. During the year under review, this group invested HK$6,356 million in production facilities, pipelines, plants and other fixed assets for the sustainable development of its various existing and new businesses in Hong Kong and mainland China. TOWN GAS BUSINESS IN HONG KONG Total volume of gas sales in Hong Kong for 2015 was 28,404 million MJ, a decrease of 1.5%, in contrast to appliance sales revenue which increased by 6.4% with a total of 255,730 sets sold, both compared to 2014. As at the end of 2015, the number of customers was 1,839,261, an increase of 19,326 compared to 2014, slightly up by 1.1%. An increase in its standard gas tariff on 1 August 2015 has helped offset some of this pressure on its own rising operating costs. BUSINESS DEVELOPMENT IN MAINLAND CHINA As at the end of 2015, Hong Kong and China Gas held approximately 62.53% of the total issued shares of Towngas China Company Limited (“Towngas China”; stock code: 1083). Exclusive of unrealised exchange losses on the renminbi and the provision for the disposal of the coke plant of Changchun Gas Company Limited (“Changchun Gas”), this subsidiary’s profit after taxation attributable to its shareholders for 2015 amounted to HK$1,202 million, an increase of approximately 1% compared to 2014. Due to the depreciation of the renminbi during the year, inclusive of the unrealised exchange losses and Changchun Gas’ provision for the disposal, Towngas China’s profit after taxation attributable to its shareholders for 2015 was HK$807 million, a decrease of approximately 23% compared to 2014. Project development is progressing with Towngas China acquiring three new piped-gas projects in 2015, namely in Wulian county, Rizhao city, Shandong province; in Anxin county, Baoding city, Hebei province; and in Jiangbei New District, Wuhu city, Anhui province. In 2015, Towngas China also acquired two midstream pipeline projects and one vehicular refilling station project, namely Xuancheng-Huangshan natural gas sub-stream and downstream city-gas project in Anhui province, Taigang Gas midstream long-haul pipeline project in Taian city, Shandong province, and Xingqixiang vehicular refilling station project in Qiqihar city, Heilongjiang province. In June 2015, Standard & Poor’s Ratings Services raised its long-term corporate credit rating on Towngas China to “BBB+” from “BBB”, and maintained its “cnA+” long-term Greater China regional scale credit rating with a “stable” outlook. In July 2015, Moody’s Investors Service also raised its issuer credit rating on Towngas China to “Baa1” from “Baa2” with a “stable” outlook. This group’s city-gas businesses are progressing well with a total of four new projects added to its portfolio in 2015. As at the end of 2015, inclusive of Towngas China, this group had a total of 131 city-gas projects in mainland cities spread across 23 provinces, autonomous regions and municipalities. The total volume of gas sales for these projects in 2015 was approximately 15.5 billion cubic metres, a slight increase of 2% over 2014. As at the end of 2015, this group’s mainland gas customers stood at approximately 20.9 million, an increase of 10% over 2014. This group’s midstream natural gas projects are operating smoothly. These include natural gas pipeline projects in Anhui and Hebei provinces; natural gas extension projects in Jilin and Henan provinces; and the Guangdong LNG Receiving Terminal project. In addition, Towngas China added two midstream natural gas projects to its portfolio in 2015 − the Xuancheng-Huangshan natural gas sub-stream and downstream city-gas project in Anhui province, and the Taigang Gas midstream long-haul pipeline project in Taian city, Shandong province. Construction of this group’s gas storage
31
facility in underground salt caverns in Jintan district, Changzhou city, Jiangsu province is in progress. Upon completion, this facility will be the first of its kind developed by any city-gas enterprise on the mainland. The total storage capacity of this facility will be approximately 400 million standard cubic metres. Construction of phase one of this project, with a storage capacity of 130 million standard cubic metres, is expected to be completed during the third quarter of 2016. The upstream natural gas supply market is also facing reform. The Shanghai Petroleum and Natural Gas Exchange (the “Exchange”) launched a pilot operation on 1 July 2015 to further promote a market-oriented pricing mechanism for natural gas. The Exchange comprises ten shareholder companies, including this group. 2015 was the 10th anniversary of this group’s entering into the mainland water market under the brand name “Hua Yan Water”. It has so far invested in, and operates, six water projects, including water supply joint venture projects in Wujiang district, Suzhou city, Jiangsu province and in Wuhu city, Anhui province; wholly-owned water supply projects in Zhengpugang Xin Qu, Maanshan city and in Jiangbei Xin Qu, Wuhu city, both in Anhui province; and an integrated water supply and wastewater treatment joint venture project, together with an integrated wastewater treatment joint venture project for a special industry, both in Suzhou Industrial Park, Suzhou city, Jiangsu province. In 2015, this group also initiated an interest in the drinking water market on the mainland by launching “AquaJoy”, a high-end bottled purified water product, through its project in Wujiang district, Suzhou city, Jiangsu province. Overall, inclusive of projects of Towngas China, this group had 222 projects on the mainland, as at the end of 2015, 20 more than at the end of 2014, spread across 25 provinces, autonomous regions and municipalities. These projects encompass upstream, midstream and downstream natural gas sectors, water sectors, environmentally-friendly energy applications, energy resources’ exploration and utilisation, as well as telecommunications. EMERGING ENVIRONMENTALLY-FRIENDLY ENERGY BUSINESSES This group’s development of emerging environmentally-friendly energy businesses and related research and development of new technologies, through its wholly-owned subsidiary ECO Environmental Investments Limited and the latter’s subsidiaries (collectively known as “ECO”), are progressing steadily forward. ECO’s major businesses in Hong Kong – an aviation fuel facility, dedicated liquefied petroleum gas (“LPG”) vehicular refilling stations and landfill gas utilisation projects – are all operating smoothly. Total turnover for ECO’s aviation fuel facility for 2015 was 6.07 million tonnes. The LPG refilling station business is progressing steadily, providing a quality and reliable fuel supply to the local taxi and minibus sectors. ECO’s landfill gas project in the North East New Territories, after operating for several years, is generating noticeable environmental benefits. On this basis, ECO commenced the development of a South East New Territories landfill gas utilisation project in 2015, with commissioning expected to start in mid-2016, which will further increase the proportion of landfill gas used by this group. ECO’s oilfield project in Thailand, despite the adverse impact of the continuous fall in international oil prices and a slowdown in the mainland economy, is operating smoothly. With several high-yield wells drilled in 2015, this project recorded an output of 1.86 million barrels of oil during the year, an increase of 36% compared to 2014. ECO’s coalbed methane liquefaction facility, located in Jincheng city, Shanxi province, is operating smoothly. Construction of a project in Xuzhou city, Jiangsu province to produce LNG by methanation of coke oven gas has been largely completed; trial operation is expected in the second quarter of 2016. By then, ECO’s capability to produce LNG will be enhanced. In addition, ECO is planning to develop a natural gas liquefaction project in Hohhot city, Inner Mongolia Autonomous Region, to supply LNG for local heavy-duty trucks; commissioning is expected by the end of 2017.
32
A network of ECO natural gas refilling stations is gradually taking shape in, amongst others, Shaanxi, Shandong, Shanxi, Henan and Liaoning provinces. All in all, ECO currently has 60 refilling stations in operation, under construction or at the planning stage, and expansion into more provinces progresses. ECO is constructing a plant to upgrade low-quality inedible bio-oil. Located in Zhangjiagang city, Jiangsu province, the facility will handle approximately 220,000 tonnes of palm acid oil annually for conversion into high-quality chemical products and low-sulphur fuels; construction is expected to be completed early next year for trial production. ECO has successfully developed new technologies to convert agricultural and forestry waste into natural gas through thermal gasification and methanation, and also to produce levulinic acid, through hydrolysis, which can be used as a raw material for producing clean fuel additives. ECO is planning to start a pilot project in Hebei province using these technologies expecting to produce natural gas early next year. ECO’s coal-based methanol production plant in Inner Mongolia Autonomous Region operated smoothly in 2015. Following the completion of the construction work in mid-2015 to enhance methanol production capacity to over 1,100 tonnes per day, the yield for the whole year rose to over 300,000 tonnes, an increase of 26 per cent compared to 2014. An additional facility to upgrade methanol into natural gasoline (a gasoline substitute chemical product) using self-developed technology is now at the pilot production stage. ECO is also developing innovative resource conversion technologies for the production of high value-added environmentally-friendly energy. Related research and development has achieved a breakthrough in results, with noticeable economic and environmental benefits, especially in the areas of conversion of coal tar oil into carbon materials, upgrading and utilisation of oil-rich powder coal and conversion of agricultural waste into natural gas and fuel additives. FINANCING PROGRAMMES This group established a medium term note programme in 2009. Medium term notes totalling HK$1,457 million, with maturity ranging from 10 to 15 years, were issued during 2015. As at 31 December 2015, this group had issued medium term notes of an aggregate amount equivalent to HK$11,800 million with tenors ranging from 5 to 40 years, with an average interest rate at fixed rate of 3.47% and an average tenor of 15 years, under this programme.
33
Hong Kong Ferry (Holdings) Company Limited (“Hong Kong Ferry”) Hong Kong Ferry’s consolidated profit after taxation for the year ended 31 December 2015 amounted to approximately HK$193 million, a decrease of 81% as compared with the profit after taxation of HK$1,031 million last year.
During the year under review, profit for Hong Kong Ferry was mainly derived from the sale of the residential units of Metro6 and Green Code. The decrease in profit is mainly due to the profit derived from the sale of Metro6, a small scale development project completed during the year under review, is far less than that derived from the sale of Green Code, a large scale development project completed last year.
During 2015, Hong Kong Ferry sold a total of 83 residential units of Metro6 and 19 residential units of Green Code contributing to a total profit of approximately HK$158 million. The unsold residential units of Metro6 and Green Code were 12 and 10 respectively at the year end.
In January 2016, Hong Kong Ferry launched the sale of the residential units of Harbour Park in phases and the response is satisfactory. The project will provide a total gross floor area of approximately 55,000 square feet and is expected to be completed in 2017.
The gross rental and other income from its commercial arcades amounted to approximately HK$78 million. The two floors of the commercial podium of Green Code have a gross floor area of approximately 136,000 square feet. The leasing status of the commercial podium of Green Code was satisfactory with the committed occupancy rate stood at 79% at the year end. The shops at the commercial podium of Metro6 were delivered to the tenants in the third quarter of 2015 and the committed tenancy was 97% at the year end. The commercial podium has a gross floor area of approximately 10,000 square feet. The commercial arcades of Shining Heights and The Spectacle were fully let whereas the occupancy rate of the commercial arcades of Metro Harbour Plaza was about 98% at the year end.
During the year under review, the ferry, shipyard and related operations recorded a profit of HK$14 million, an increase of 69% as compared with last year.
Due to the prolonged weakening of the local tourist and consumption market, the operating results of the travel operation recorded a deficit of HK$9.5 million during the year under review, representing an increase of 17% as compared with last year.
During the year, a loss of HK$1.6 million in securities investment was recorded mainly due to the impairment loss on securities investment in excess of the income from and disposal gain of securities.
The sale of the remaining residential units in Green Code and Metro6 will be the main source of income of Hong Kong Ferry in 2016. Harbour Park, scheduled to be completed in 2017, will be its major project for sale in 2016.
34
Miramar Hotel and Investment Company, Limited (“Miramar”) Miramar’s revenue posted steady growth, rising 4% to approximately HK$3,251 million for the financial year ended 31 December 2015 compared to the last corresponding period (2014: HK$3,127 million). Profit attributable to shareholders increased by 4% to approximately HK$1,355 million (2014: HK$1,301 million). Excluding the net increase in the fair value of its investment properties, underlying profit attributable to shareholders grew by 29% to approximately HK$729 million (2014: HK$567 million). The financial results for 2015 marked the fifth consecutive year of growth in its financial results. For hotels and serviced apartments business, its EBITDA (earnings before interest, tax, depreciation and amortization) amounted to approximately HK$239 million, representing a decline of 2% year-on-year. The Mira Hotel Collection won numerous awards during the year, including The Mira Hong Kong’s recognition as the Best Luxury Hotel Spa in the 2015 World Luxury Spa Awards. Mira Moon was honored with several accolades – Best Boutique Hotel Asia Pacific, TTG Awards 2015 and Asia’s Best City Boutique Hotel – World Boutique Hotel Awards 2015.
Property rental business experienced healthy stable growth in 2015. Rental income grew 5% to HK$834 million, and EBITDA climbed 7% to HK$724 million. Its portfolio consists of over 1 million square feet of shopping malls and an office tower strategically located in the heart of Tsim Sha Tsui. The year saw the completion of a number of aspects of the multi-year asset enhancement program. The main atrium area at the Miramar Shopping Centre was completed during the first quarter of the year. This was followed by a newly created street corner shop at the intersection of Nathan and Kimberley Roads, together with a totally new Kimberley Road facade. FoodLoft was launched in the Miramar Shopping Centre in January 2015. They currently host seven Michelin starred and recommended restaurants, including one two-star, one one-star and three recommended restaurants in FoodLoft and two recommended restaurants in Mira Mall. Food and Beverage businesses posted healthy growth. Revenue grew 20% to HK$467 million compared to 2014 and EBITDA soared 183% to HK$45 million. A new Tsui Hang Plus loyalty program was launched in August 2015, designed to build and strengthen customer loyalty and engagement with diners patronizing its Tsui Hang Village Cantonese and Yun Yan Sichuan restaurants. Yun Yan was again honored by Michelin Guide, as a Michelin Recommended Bib Gourmand Restaurant for the third time in 2015. As a result, its banqueting segment saw an increase in revenue in 2015. Meanwhile, the School Food chain continued to expand with the addition of four new outlets in Mong Kok, Whampoa, Tai Koo and Tuen Mun. During the reporting period, outbound traffic continued to increase, particularly in the long haul sector. Overall revenue increased 4% to HK$1,275 million, while EBITDA enjoyed a 39% growth to HK$74 million. Miramar Travel sponsored the popular “Empress of China” television drama series in April 2015 that increased the brand awareness of Miramar Travel, and subsequently the number of people signing up for tours. Its travel business will continue to invest and develop its online booking capabilities to expand and deepen customer reach.
35
CORPORATE FINANCE The Group has always adhered to prudent financial management principles. At 31 December 2015, net debt (including the shareholder’s loan totalling HK$1,185 million (2014: HK$5,021 million)) amounted to HK$40,317 million (2014: HK$37,420 million) giving rise to a financial gearing ratio of 16% (2014: 15.7%). In March 2015, the Group concluded a HK$18,000 million 5-year term loan/revolving credit facility with a consortium of 22 leading international banks and local financial institutions. It is the largest syndicated credit facility that has ever been concluded by the Group, reflecting the continuing support and trust of the banking community in the Group. In light of the low interest rate levels resulting from quantitative easing measures adopted by major economies around the world over the past years, the Group has concluded Hong Kong dollar interest rate swap contracts for certain medium and long-term periods. Such contracts were entered into for the purpose of converting part of the Group’s Hong Kong dollar borrowings from floating interest rates into fixed interest rates. It is considered that such a treasury management strategy will be of benefit to the Group in the long run.
36
PROSPECTS The recent volatility in the global financial markets and concerns over the slowdown in the mainland economy have posed a drag on the economic growth in Hong Kong. The local property market has shown signs of correction. However, the prevailing low mortgage rate still gives considerable support to home buyers. During the year under review, the Group has made use of multiple channels to replenish its development land bank in Hong Kong and encouraging progress was achieved: (i) In June 2015, the Group won the tender for a residential site in So Kwun Wat, Tuen Mun, at HK$3,628.9 million; (ii) The number of urban redevelopment projects with 80% to 100% of their ownerships acquired increased to 45, representing about 3.8 million square feet in total attributable gross floor area, which is expected to be available for sale or leasing in 2017 or beyond. The Group’s efforts in urban redevelopment have begun to bear fruit and significant returns are expected for the years to come; and (iii) The Group has also increased its land reserves in the New Territories to 45 million square feet, the largest holding among its peers in Hong Kong. As regards “property sales”, following the recent successful marketing of "Harbour Park", "Wellesley" and "Double Cove Summit”, the Group plans to embark on sales launches of two urban redevelopment boutique residences and two commercial/office projects in this financial year. Together with the unsold stocks, a total of over 2,100 residential units and 430,000 square feet of quality office/commercial space in Hong Kong will be available for sale in 2016. It is through the above-mentioned diversified means of land replenishment that the Group manages to secure a stable supply of land for property development in the long run, enabling the sustainable growth of its property sales business. Turning to mainland China, it is anticipated that “destocking” remains the main focus among all the policies for the property industry in 2016. Measures such as intensifying differentiated policies, stimulation of demand and supply control will be put forward gradually. It is also anticipated that easing money supply will persist, whilst the downpayment requirement for first home purchase and interest rates will be further reduced, thus boosting housing demand. The Group will actively look for quality residential and office projects in prime cities, as well as those second-tier cities exhibiting great potential. Also, the Group will continue to step up its co-operation with mainland property developers. As regards “rental business”, the Group currently holds a total attributable gross floor area of approximately 9.1 million square feet in completed investment properties in Hong Kong with most of them being quality offices and large-scale shopping malls, plus approximately 7.3 million square feet of completed investment properties in various prime cities in mainland China. Such a sizeable portfolio of quality investment properties provided an aggregate gross rental income (including the attributable contribution from subsidiaries, associates and joint ventures) of HK$8,152 million during the year under review. In July 2015, a prime office/commercial site of approximately 200,000 square feet in Shanghai Xuhui Riverside development area was acquired at RMB3,872 million. In Hong Kong, an array of rental properties is now under development or under planning, including the office development in King Wah Road, North Point, the redevelopment project at Johnston Road, Wanchai, as well as the project at Middle Road, Tsim Sha Tsui which was acquired through public tender. The Group’s rental income is set to grow further against a continually expanding rental portfolio.
37
The “associates”, namely, Hong Kong and China Gas, Miramar and Hong Kong Ferry, serve as another steady recurrent income stream to the Group. Hong Kong and China Gas, in particular, is Hong Kong’s first public utility company. It has 222 projects spread across 25 provinces, autonomous regions and municipalities on the mainland, with businesses encompassing city-gas, city-water, wastewater treatment, natural gas pipelines, new energy, telecommunications and the production of gas-related materials and devices. With a total of over 22.7 million gas customers in Hong Kong and mainland China, as well as extensive coverage in other businesses, its contributions to the Group are promising. Founded in 1976, the Group’s businesses have grown rapidly over the past 40 years. The three major income pillars (namely, “property sales”, “rental business” and “associates”), while providing substantial stable income to shareholders, also form a solid base to support the Group’s continued asset expansion. With its sizeable assets, ample financial resources, as well as a shrewd and seasoned management team, the Group is well placed not only to face the challenges ahead but also to seize emerging opportunities to grow from strength to strength. Appreciation I would like to take this opportunity to express my gratitude to my fellow directors for their wise counsel, and to thank all our staff for their dedication and hard work. Lee Shau Kee Chairman Hong Kong, 21 March 2016
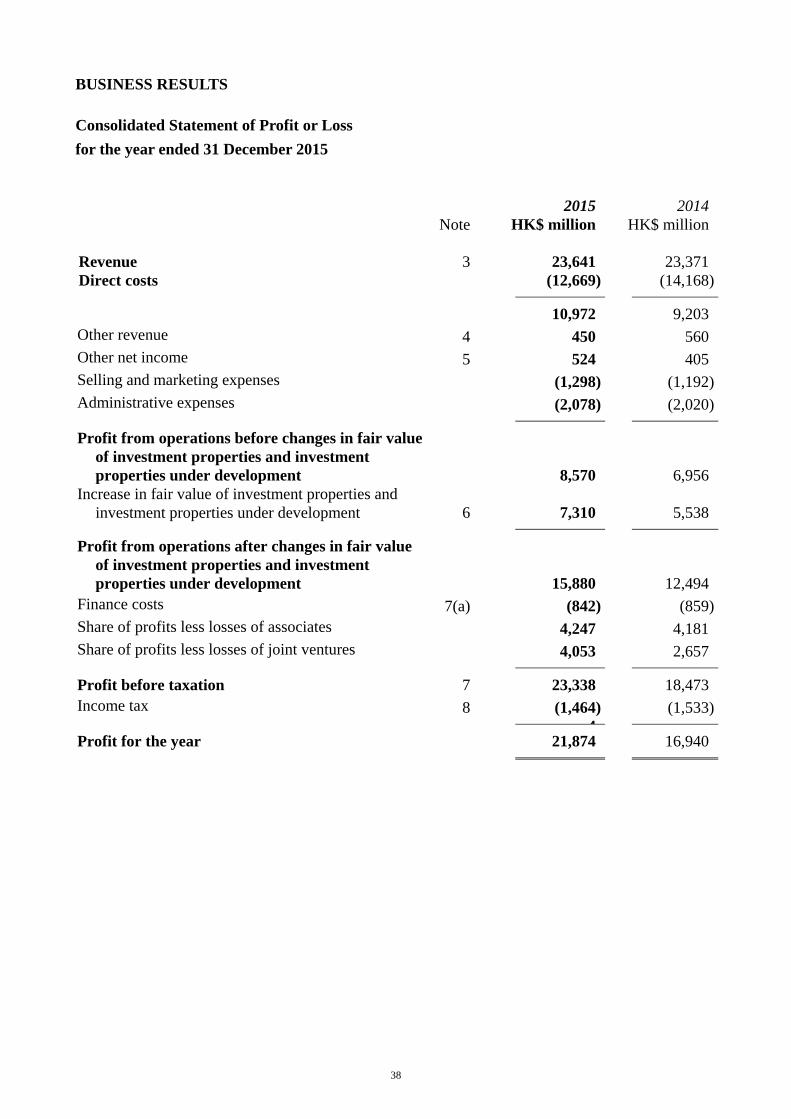
38
BUSINESS RESULTS Consolidated Statement of Profit or Loss for the year ended 31 December 2015 2015 2014 Note HK$ million HK$ million Revenue 3 23,641 23,371Direct costs (12,669) (14,168)
10,972 9,203Other revenue 4 450 560Other net income 5 524 405Selling and marketing expenses (1,298) (1,192)Administrative expenses (2,078) (2,020)
Profit from operations before changes in fair value of investment properties and investment properties under development 8,570 6,956
Increase in fair value of investment properties and investment properties under development 6 7,310 5,538
Profit from operations after changes in fair value of investment properties and investment properties under development 15,880 12,494
Finance costs 7(a) (842) (859)Share of profits less losses of associates 4,247 4,181Share of profits less losses of joint ventures 4,053 2,657
Profit before taxation 7 23,338 18,473Income tax 8 (1,464) (1,533)
4Profit for the year 21,874 16,940
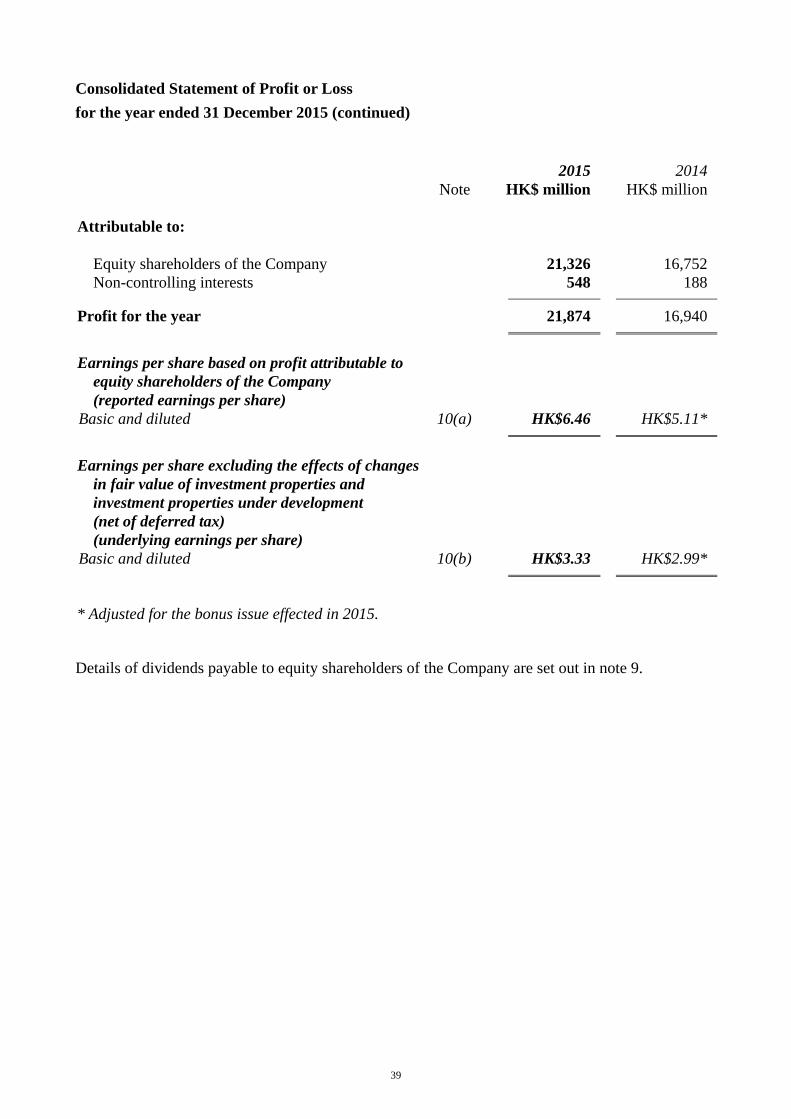
39
Consolidated Statement of Profit or Loss for the year ended 31 December 2015 (continued) 2015 2014 Note HK$ million HK$ million Attributable to:
Equity shareholders of the Company 21,326 16,752Non-controlling interests 548 188
Profit for the year 21,874 16,940
Earnings per share based on profit attributable to equity shareholders of the Company (reported earnings per share)
Basic and diluted
10(a) HK$6.46 HK$5.11*
Earnings per share excluding the effects of changes in fair value of investment properties and investment properties under development (net of deferred tax) (underlying earnings per share)
Basic and diluted
10(b) HK$3.33 HK$2.99*
* Adjusted for the bonus issue effected in 2015. Details of dividends payable to equity shareholders of the Company are set out in note 9.
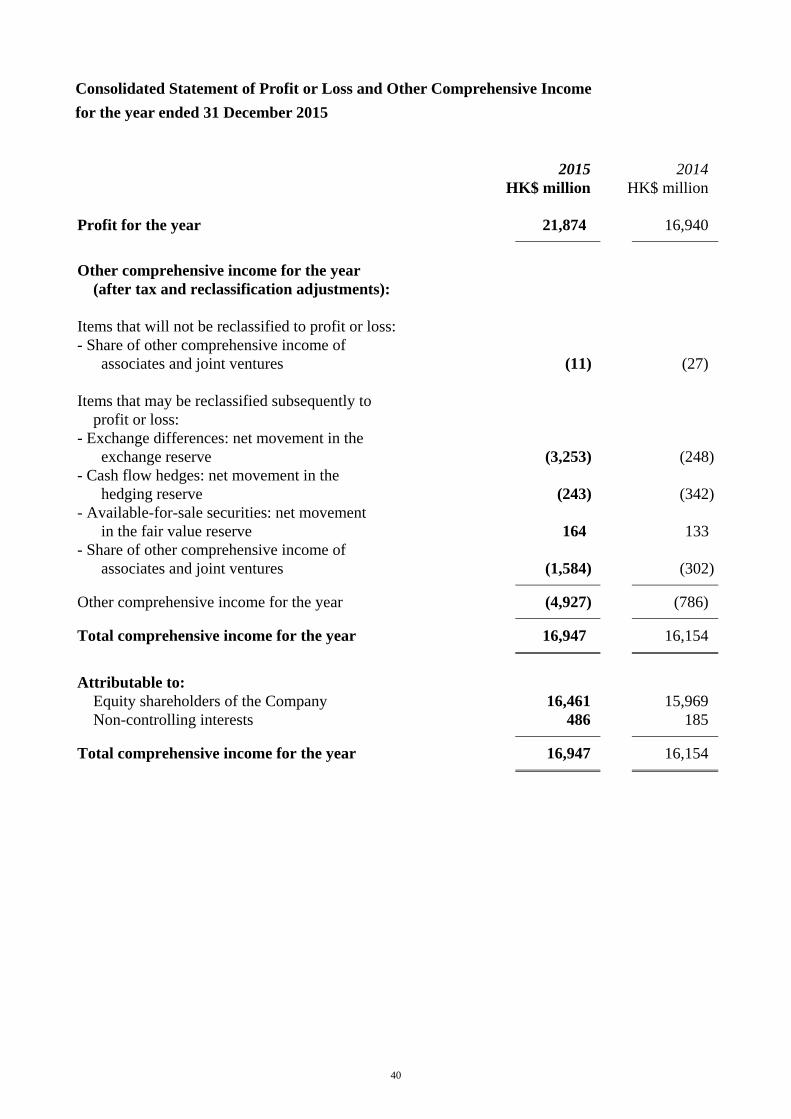
40
Consolidated Statement of Profit or Loss and Other Comprehensive Income for the year ended 31 December 2015 2015 2014 HK$ million HK$ million Profit for the year 21,874 16,940
Other comprehensive income for the year (after tax and reclassification adjustments): Items that will not be reclassified to profit or loss: - Share of other comprehensive income of associates and joint ventures (11) (27) Items that may be reclassified subsequently to profit or loss:
- Exchange differences: net movement in the exchange reserve (3,253)
(248)
- Cash flow hedges: net movement in the hedging reserve (243)
(342)
- Available-for-sale securities: net movement in the fair value reserve 164 133- Share of other comprehensive income of associates and joint ventures (1,584) (302)
Other comprehensive income for the year (4,927) (786)
Total comprehensive income for the year 16,947 16,154
Attributable to:
Equity shareholders of the Company 16,461 15,969Non-controlling interests 486 185
Total comprehensive income for the year 16,947 16,154
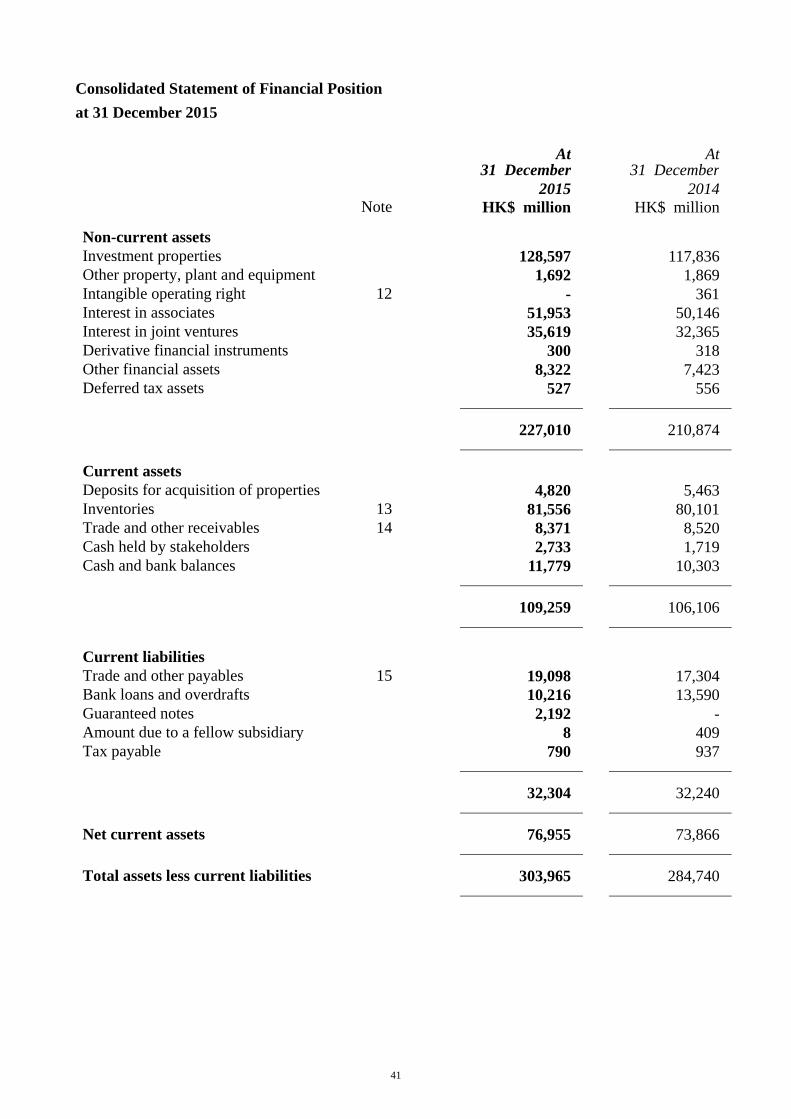
41
Consolidated Statement of Financial Position at 31 December 2015 At
31 December At
31 December 2015 2014 Note HK$ million HK$ million
Non-current assets Investment properties 128,597 117,836Other property, plant and equipment 1,692 1,869Intangible operating right 12 - 361Interest in associates 51,953 50,146Interest in joint ventures 35,619 32,365Derivative financial instruments 300 318Other financial assets 8,322 7,423Deferred tax assets 527 556
227,010 210,874
Current assets Deposits for acquisition of properties 4,820 5,463Inventories 13 81,556 80,101Trade and other receivables 14 8,371 8,520Cash held by stakeholders 2,733 1,719Cash and bank balances 11,779 10,303
109,259 106,106
Current liabilities Trade and other payables 15 19,098 17,304Bank loans and overdrafts 10,216 13,590Guaranteed notes 2,192 -Amount due to a fellow subsidiary 8 409Tax payable 790 937
32,304 32,240
Net current assets 76,955 73,866
Total assets less current liabilities 303,965 284,740
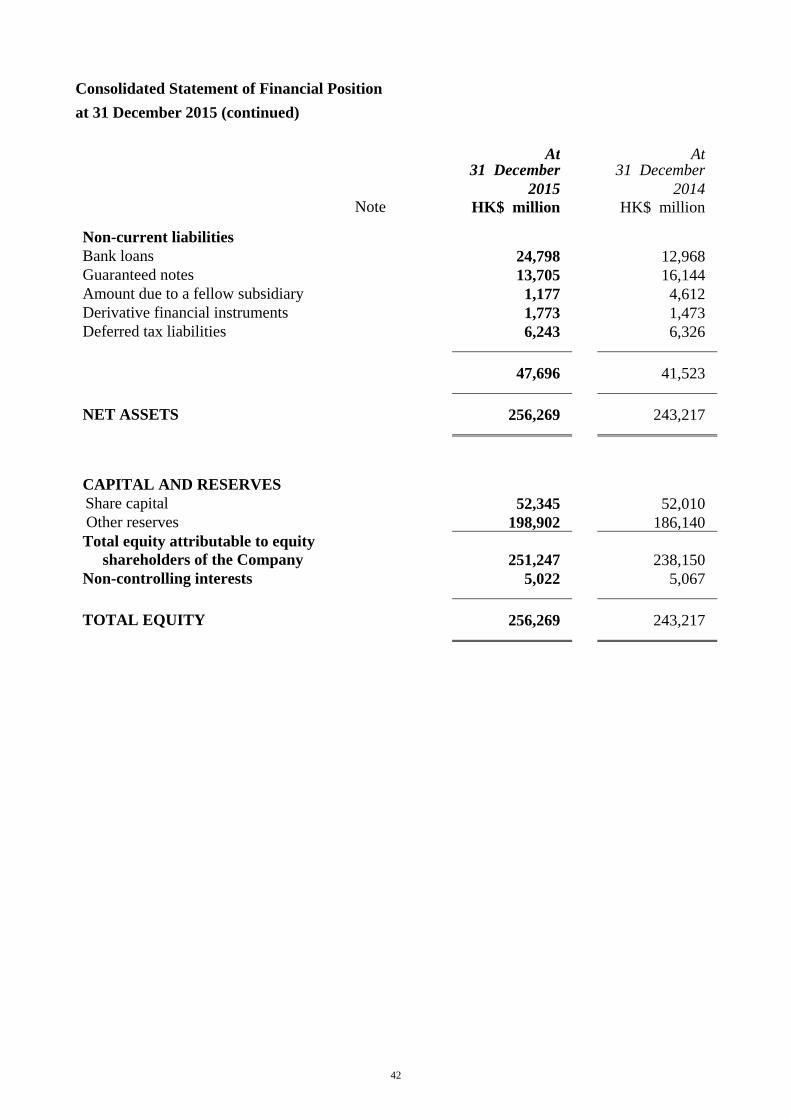
42
Consolidated Statement of Financial Position at 31 December 2015 (continued) At
31 December At
31 December 2015 2014 Note HK$ million HK$ million
Non-current liabilities Bank loans 24,798 12,968Guaranteed notes 13,705 16,144Amount due to a fellow subsidiary 1,177 4,612Derivative financial instruments 1,773 1,473Deferred tax liabilities 6,243 6,326
47,696 41,523
NET ASSETS 256,269 243,217
CAPITAL AND RESERVES Share capital 52,345 52,010Other reserves 198,902 186,140Total equity attributable to equity
shareholders of the Company 251,247 238,150Non-controlling interests 5,022 5,067
TOTAL EQUITY 256,269
243,217
43
Notes:
1 Basis of preparation The financial information relating to the years ended 31 December 2015 and 2014 included in this preliminary announcement of annual results 2015 do not constitute the Company's statutory annual consolidated financial statements for those years but is derived from those financial statements. Further information relating to those statutory financial statements required to be disclosed in accordance with section 436 of the Hong Kong Companies Ordinance (Cap.622) is as follows: The Company has delivered the financial statements for the year ended 31 December 2014 to the Registrar of Companies as required by section 662(3) of, and Part 3 of Schedule 6 to, the Hong Kong Companies Ordinance (Cap.622) and will deliver the financial statements for the year ended 31 December 2015 in due course. The Company's auditor has reported on the financial statements of the Group for both years. The auditor's reports were unqualified; did not include a reference to any matters to which the auditor drew attention by way of emphasis without qualifying its reports; and did not contain a statement under sections 406(2), 407(2) or (3) of the Hong Kong Companies Ordinance (Cap.622). The statutory financial statements have been prepared in accordance with all applicable Hong Kong Financial Reporting Standards (“HKFRSs”), which collective term includes all applicable individual HKFRSs, Hong Kong Accounting Standards (“HKASs”) and Interpretations issued by the Hong Kong Institute of Certified Public Accountants (“HKICPA”), and accounting principles generally accepted in Hong Kong. The statutory financial statements also comply with the applicable requirements of the Hong Kong Companies Ordinance. The statutory financial statements also comply with the applicable disclosure provisions of the Rules Governing the Listing of Securities on The Stock Exchange of Hong Kong Limited. The measurement basis used in the preparation of the statutory financial statements is the historical cost basis except that the following assets and liabilities are stated at their fair value: - financial instruments classified as available-for-sale securities; - derivative financial instruments; and - investment properties and investment properties under development.
44
2 Changes in accounting policies The HKICPA has issued the following amendments to HKFRSs that are first effective for the current accounting period of the Group and the Company:
Amendments to HKAS 19, Defined benefit plans: Employee contributions The amendments introduce a relief to reduce the complexity of accounting for certain contributions from employees or third parties under defined benefit plans. When the contributions are eligible for the practical expedient provided by the amendments, a company is allowed to recognise the contributions as a reduction of the service cost in the period in which the related service is rendered, instead of including them in calculating the defined benefit obligation. The amendments do not have an impact on the statutory financial statements as the defined benefit plans operated by the Company’s associates are wholly funded by contributions from the Group to which they belong and do not involve contributions from employees or third parties.
Annual improvements to HKFRSs 2010-2012 Cycle and 2011-2013 Cycle These two cycles of annual improvements contain amendments to nine standards with consequential amendments to other standards. Among them, HKAS 24, Related party disclosures has been amended to expand the definition of a “related party” to include a management entity that provides key management personnel services to the reporting entity, and to require the disclosure of the amounts incurred for obtaining the key management personnel services provided by the management entity. These amendments do not have an impact on the Group’s related party disclosures as the Group does not obtain key management personnel services from management entities.
The Group has not applied any new standard or interpretation that is not yet effective for the current accounting period. Up to the date of issue of the statutory financial statements, the HKICPA has issued a few amendments and new standards which are not yet effective for the year ended 31 December 2015 and which have not been adopted in the statutory financial statements. The Group is in the process of making an assessment of what the impact of these amendments and new standards is expected to be in the period of initial application. So far it has concluded that, except for HKFRS 9, Financial instruments and HKFRS 15, Revenue from contracts with customers in relation to which it is not practicable to provide a reasonable estimate about the impact on the Group’s financial statements until the Group performs a detailed review, the adoption of them is unlikely to have a significant impact on the consolidated financial statements.
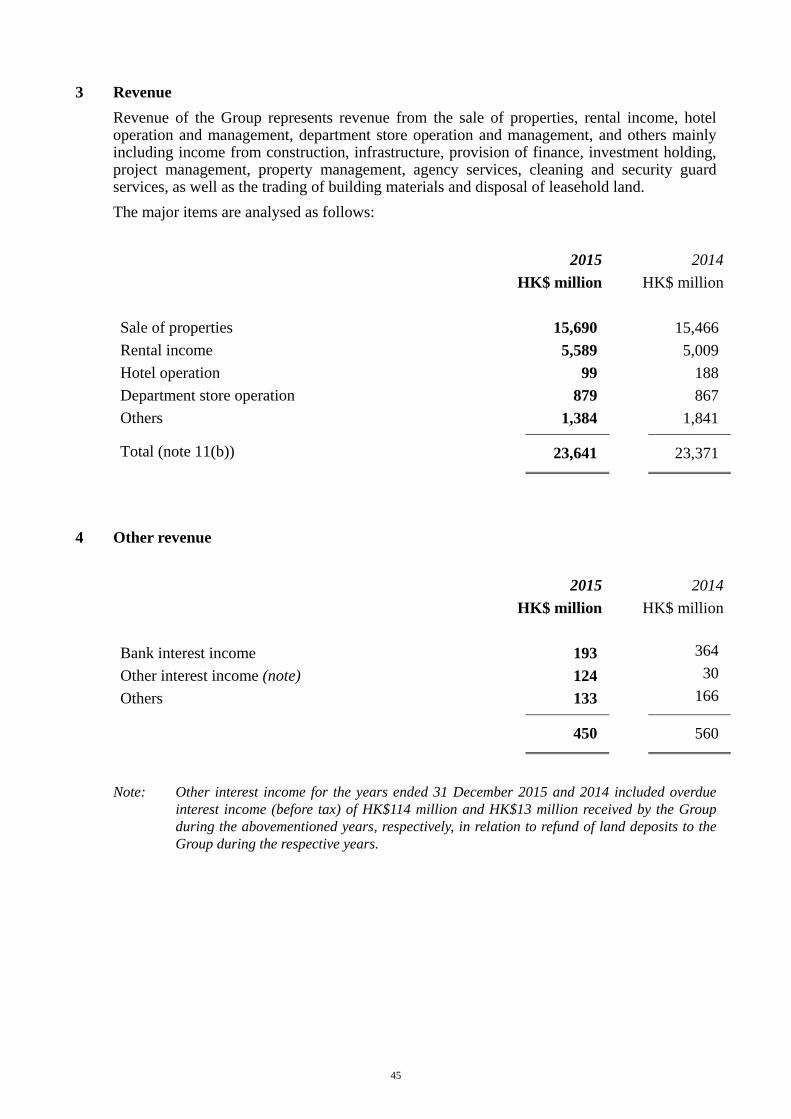
45
3 Revenue Revenue of the Group represents revenue from the sale of properties, rental income, hotel operation and management, department store operation and management, and others mainly including income from construction, infrastructure, provision of finance, investment holding, project management, property management, agency services, cleaning and security guard services, as well as the trading of building materials and disposal of leasehold land. The major items are analysed as follows:
2015 2014 HK$ million HK$ million Sale of properties 15,690 15,466Rental income 5,589 5,009Hotel operation 99 188Department store operation 879 867Others 1,384 1,841
Total (note 11(b)) 23,641 23,371
4 Other revenue
2015 2014 HK$ million HK$ million Bank interest income 193 364 Other interest income (note) 124 30 Others 133 166
450 560
Note: Other interest income for the years ended 31 December 2015 and 2014 included overdue interest income (before tax) of HK$114 million and HK$13 million received by the Group during the abovementioned years, respectively, in relation to refund of land deposits to the Group during the respective years.
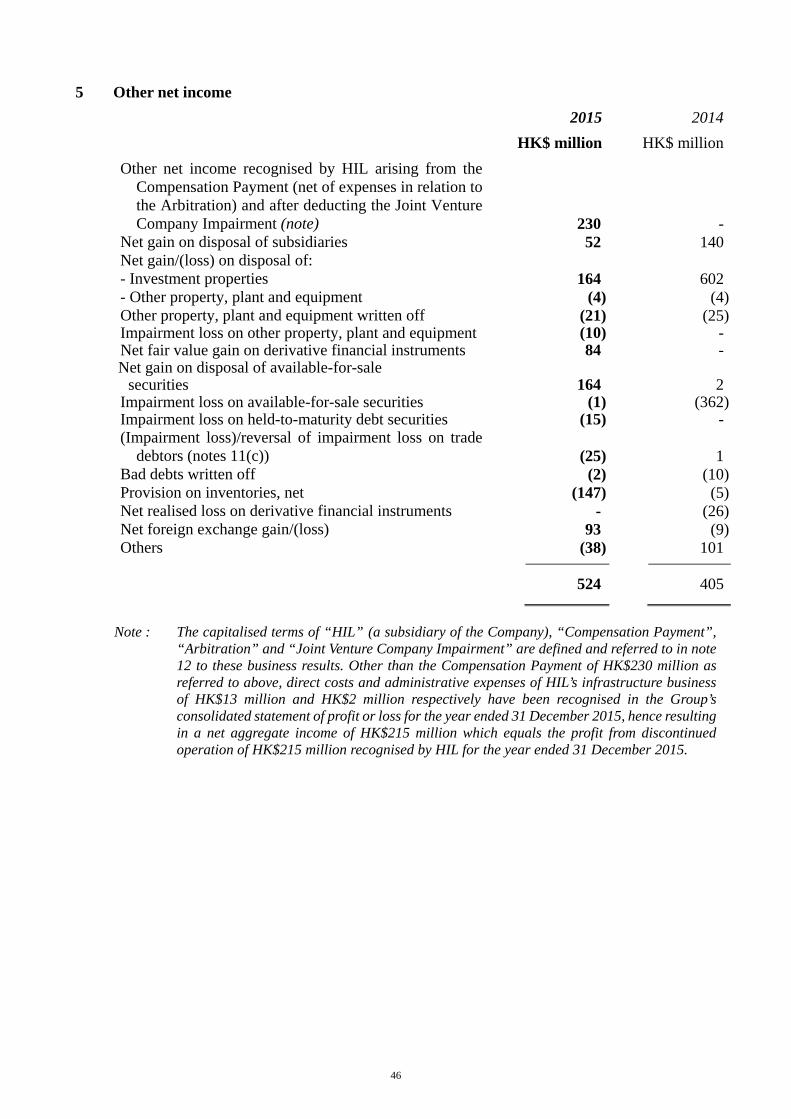
46
5 Other net income 2015 2014 HK$ million HK$ millionOther net income recognised by HIL arising from the
Compensation Payment (net of expenses in relation to the Arbitration) and after deducting the Joint Venture Company Impairment (note) 230 -
Net gain on disposal of subsidiaries 52 140Net gain/(loss) on disposal of: - Investment properties 164 602- Other property, plant and equipment (4) (4)Other property, plant and equipment written off (21) (25)Impairment loss on other property, plant and equipment (10) -Net fair value gain on derivative financial instruments 84 -Net gain on disposal of available-for-sale securities 164 2Impairment loss on available-for-sale securities (1) (362)Impairment loss on held-to-maturity debt securities (15) -(Impairment loss)/reversal of impairment loss on trade
debtors (notes 11(c)) (25) 1Bad debts written off (2) (10)Provision on inventories, net (147) (5)Net realised loss on derivative financial instruments - (26)Net foreign exchange gain/(loss) 93 (9)Others (38) 101
524 405
Note : The capitalised terms of “HIL” (a subsidiary of the Company), “Compensation Payment”,
“Arbitration” and “Joint Venture Company Impairment” are defined and referred to in note 12 to these business results. Other than the Compensation Payment of HK$230 million as referred to above, direct costs and administrative expenses of HIL’s infrastructure business of HK$13 million and HK$2 million respectively have been recognised in the Group’s consolidated statement of profit or loss for the year ended 31 December 2015, hence resulting in a net aggregate income of HK$215 million which equals the profit from discontinued operation of HK$215 million recognised by HIL for the year ended 31 December 2015.
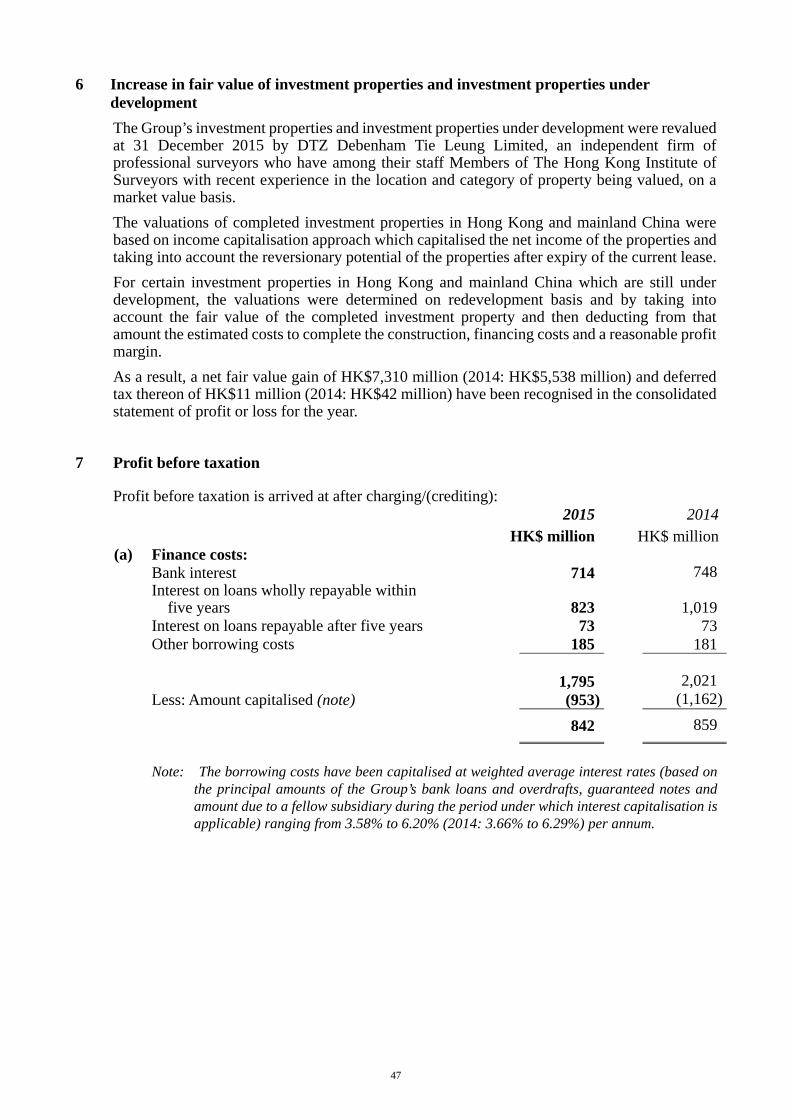
47
6 Increase in fair value of investment properties and investment properties under development The Group’s investment properties and investment properties under development were revalued at 31 December 2015 by DTZ Debenham Tie Leung Limited, an independent firm of professional surveyors who have among their staff Members of The Hong Kong Institute of Surveyors with recent experience in the location and category of property being valued, on a market value basis. The valuations of completed investment properties in Hong Kong and mainland China were based on income capitalisation approach which capitalised the net income of the properties and taking into account the reversionary potential of the properties after expiry of the current lease. For certain investment properties in Hong Kong and mainland China which are still under development, the valuations were determined on redevelopment basis and by taking into account the fair value of the completed investment property and then deducting from that amount the estimated costs to complete the construction, financing costs and a reasonable profit margin. As a result, a net fair value gain of HK$7,310 million (2014: HK$5,538 million) and deferred tax thereon of HK$11 million (2014: HK$42 million) have been recognised in the consolidated statement of profit or loss for the year.
7 Profit before taxation
Profit before taxation is arrived at after charging/(crediting):
2015 2014 HK$ million HK$ million(a) Finance costs: Bank interest 714 748
Interest on loans wholly repayable within five years 823 1,019
Interest on loans repayable after five years 73 73 Other borrowing costs 185 181 1,795 2,021 Less: Amount capitalised (note) (953) (1,162)
842 859
Note: The borrowing costs have been capitalised at weighted average interest rates (based on
the principal amounts of the Group’s bank loans and overdrafts, guaranteed notes and amount due to a fellow subsidiary during the period under which interest capitalisation is applicable) ranging from 3.58% to 6.20% (2014: 3.66% to 6.29%) per annum.
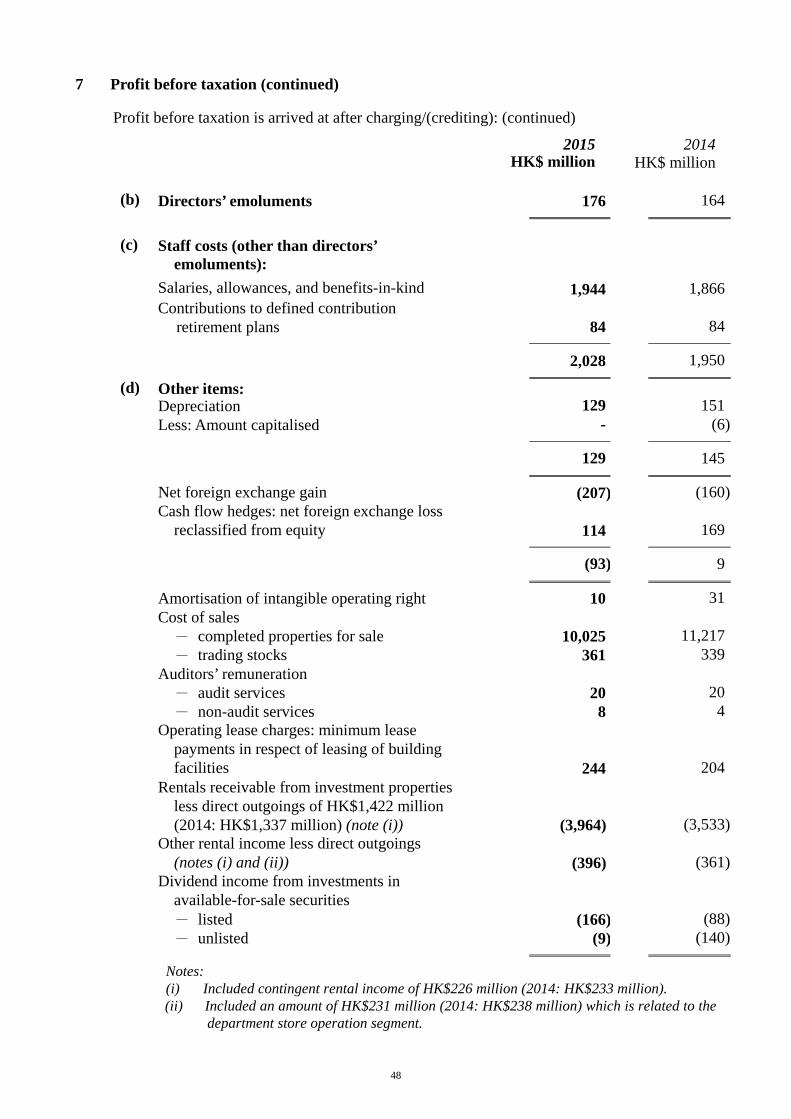
48
7 Profit before taxation (continued)
Profit before taxation is arrived at after charging/(crediting): (continued)
2015 2014 HK$ million HK$ million
(b) Directors’ emoluments 176 164
(c) Staff costs (other than directors’
emoluments):
Salaries, allowances, and benefits-in-kind 1,944 1,866Contributions to defined contribution
retirement plans 84 84
2,028 1,950
(d) Other items: Depreciation 129 151Less: Amount capitalised - (6)
129 145
Net foreign exchange gain (207) (160)Cash flow hedges: net foreign exchange loss
reclassified from equity 114 169
(93) 9
Amortisation of intangible operating right 10 31Cost of sales - completed properties for sale 10,025 11,217- trading stocks 361 339
Auditors’ remuneration - audit services 20 20- non-audit services 8 4
Operating lease charges: minimum lease payments in respect of leasing of building facilities 244 204
Rentals receivable from investment properties less direct outgoings of HK$1,422 million (2014: HK$1,337 million) (note (i)) (3,964) (3,533)
Other rental income less direct outgoings (notes (i) and (ii)) (396) (361)Dividend income from investments in
available-for-sale securities - listed (166) (88)- unlisted (9) (140)
Notes: (i) Included contingent rental income of HK$226 million (2014: HK$233 million). (ii) Included an amount of HK$231 million (2014: HK$238 million) which is related to the
department store operation segment.
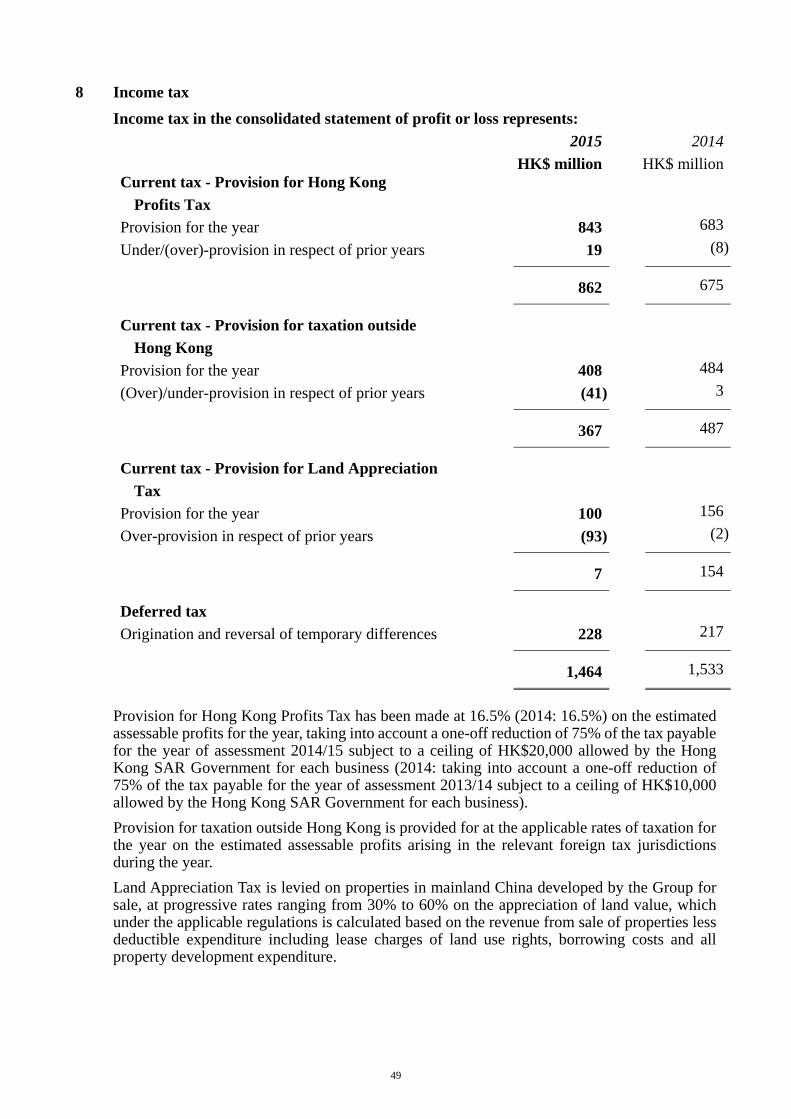
49
8 Income tax
Income tax in the consolidated statement of profit or loss represents: 2015 2014 HK$ million HK$ millionCurrent tax - Provision for Hong Kong
Profits Tax Provision for the year 843 683Under/(over)-provision in respect of prior years 19 (8)
862 675
Current tax - Provision for taxation outside Hong Kong
Provision for the year 408 484(Over)/under-provision in respect of prior years (41) 3
367 487
Current tax - Provision for Land Appreciation Tax
Provision for the year 100 156Over-provision in respect of prior years (93) (2)
7 154
Deferred tax Origination and reversal of temporary differences 228 217
1,464 1,533
Provision for Hong Kong Profits Tax has been made at 16.5% (2014: 16.5%) on the estimated assessable profits for the year, taking into account a one-off reduction of 75% of the tax payable for the year of assessment 2014/15 subject to a ceiling of HK$20,000 allowed by the Hong Kong SAR Government for each business (2014: taking into account a one-off reduction of 75% of the tax payable for the year of assessment 2013/14 subject to a ceiling of HK$10,000 allowed by the Hong Kong SAR Government for each business). Provision for taxation outside Hong Kong is provided for at the applicable rates of taxation for the year on the estimated assessable profits arising in the relevant foreign tax jurisdictions during the year. Land Appreciation Tax is levied on properties in mainland China developed by the Group for sale, at progressive rates ranging from 30% to 60% on the appreciation of land value, which under the applicable regulations is calculated based on the revenue from sale of properties less deductible expenditure including lease charges of land use rights, borrowing costs and all property development expenditure.
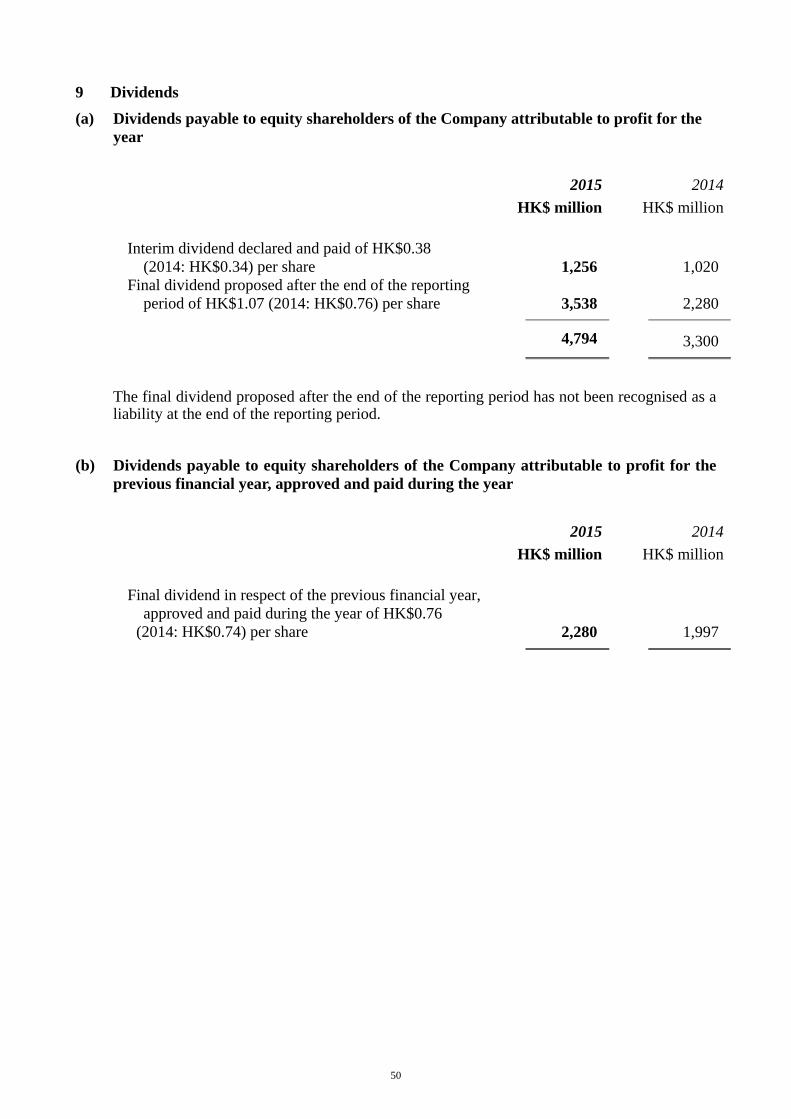
50
9 Dividends
(a) Dividends payable to equity shareholders of the Company attributable to profit for the year
2015 2014 HK$ million HK$ million Interim dividend declared and paid of HK$0.38 (2014: HK$0.34) per share 1,256 1,020
Final dividend proposed after the end of the reporting period of HK$1.07 (2014: HK$0.76) per share 3,538 2,280
4,794 3,300
The final dividend proposed after the end of the reporting period has not been recognised as a liability at the end of the reporting period.
(b) Dividends payable to equity shareholders of the Company attributable to profit for the previous financial year, approved and paid during the year
2015 2014 HK$ million HK$ million Final dividend in respect of the previous financial year,
approved and paid during the year of HK$0.76 (2014: HK$0.74) per share 2,280
1,997
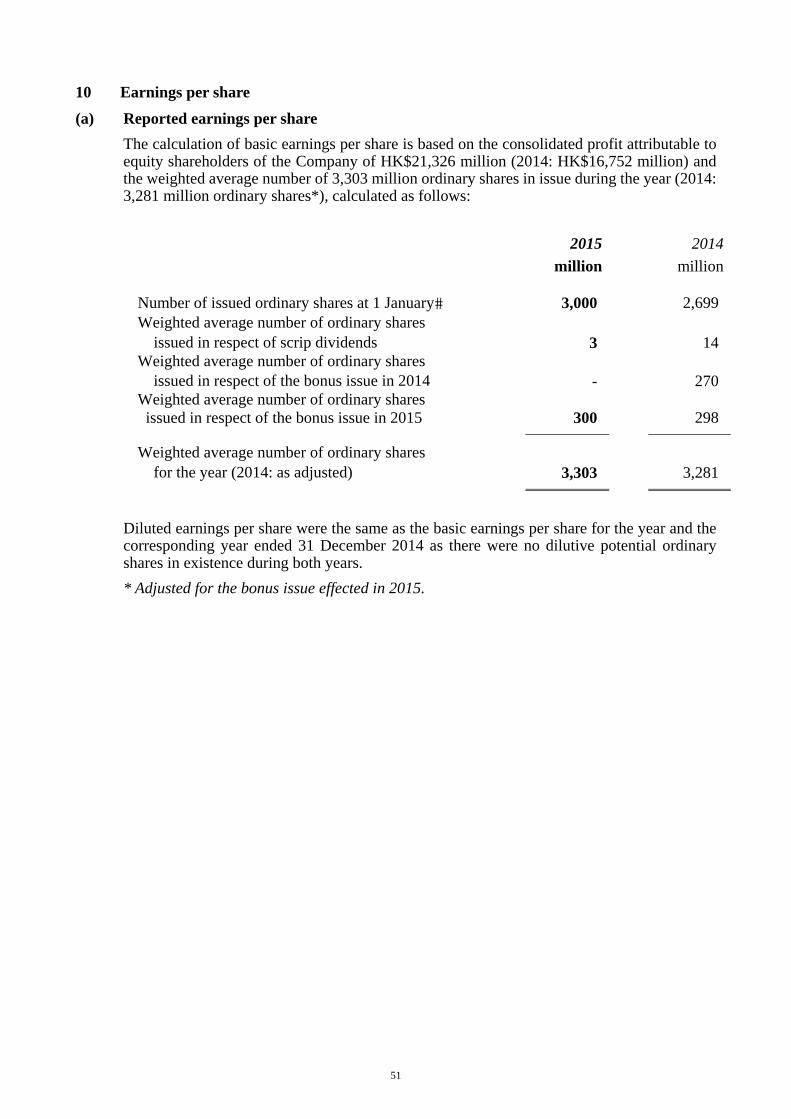
51
10 Earnings per share
(a) Reported earnings per share The calculation of basic earnings per share is based on the consolidated profit attributable to equity shareholders of the Company of HK$21,326 million (2014: HK$16,752 million) and the weighted average number of 3,303 million ordinary shares in issue during the year (2014: 3,281 million ordinary shares*), calculated as follows:
2015 2014 million million Number of issued ordinary shares at 1 January� 3,000 2,699 Weighted average number of ordinary shares
issued in respect of scrip dividends 3 14 Weighted average number of ordinary shares
issued in respect of the bonus issue in 2014 - 270 Weighted average number of ordinary shares issued in respect of the bonus issue in 2015 300 298
Weighted average number of ordinary shares for the year (2014: as adjusted) 3,303 3,281
Diluted earnings per share were the same as the basic earnings per share for the year and the corresponding year ended 31 December 2014 as there were no dilutive potential ordinary shares in existence during both years. * Adjusted for the bonus issue effected in 2015.
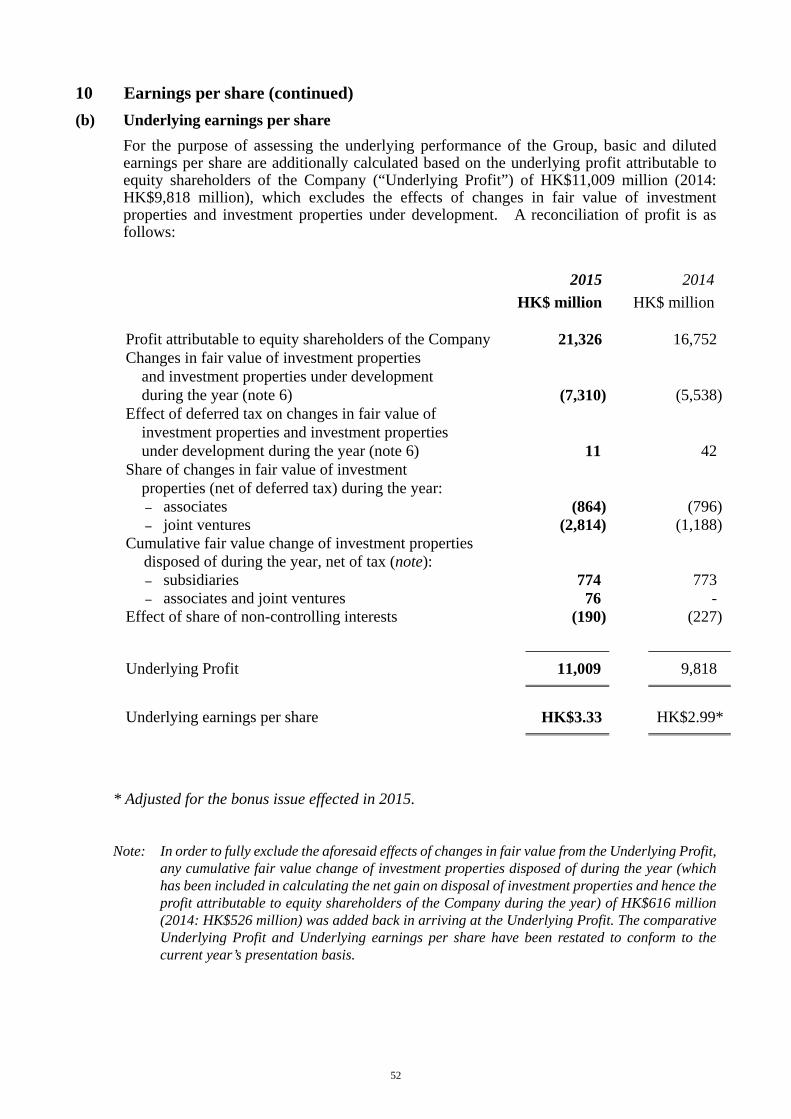
52
10 Earnings per share (continued) (b) Underlying earnings per share
For the purpose of assessing the underlying performance of the Group, basic and diluted earnings per share are additionally calculated based on the underlying profit attributable to equity shareholders of the Company (“Underlying Profit”) of HK$11,009 million (2014: HK$9,818 million), which excludes the effects of changes in fair value of investment properties and investment properties under development. A reconciliation of profit is as follows: 2015 2014 HK$ million HK$ million Profit attributable to equity shareholders of the Company 21,326 16,752 Changes in fair value of investment properties and investment properties under development during the year (note 6) (7,310) (5,538)
Effect of deferred tax on changes in fair value of investment properties and investment properties under development during the year (note 6) 11 42
Share of changes in fair value of investment properties (net of deferred tax) during the year: − associates (864) (796)− joint ventures (2,814) (1,188)
Cumulative fair value change of investment properties disposed of during the year, net of tax (note):
− subsidiaries 774 773 − associates and joint ventures 76 -
Effect of share of non-controlling interests (190) (227)
Underlying Profit 11,009 9,818
Underlying earnings per share HK$3.33 HK$2.99*
* Adjusted for the bonus issue effected in 2015.
Note: In order to fully exclude the aforesaid effects of changes in fair value from the Underlying Profit,
any cumulative fair value change of investment properties disposed of during the year (which has been included in calculating the net gain on disposal of investment properties and hence the profit attributable to equity shareholders of the Company during the year) of HK$616 million (2014: HK$526 million) was added back in arriving at the Underlying Profit. The comparative Underlying Profit and Underlying earnings per share have been restated to conform to the current year’s presentation basis.
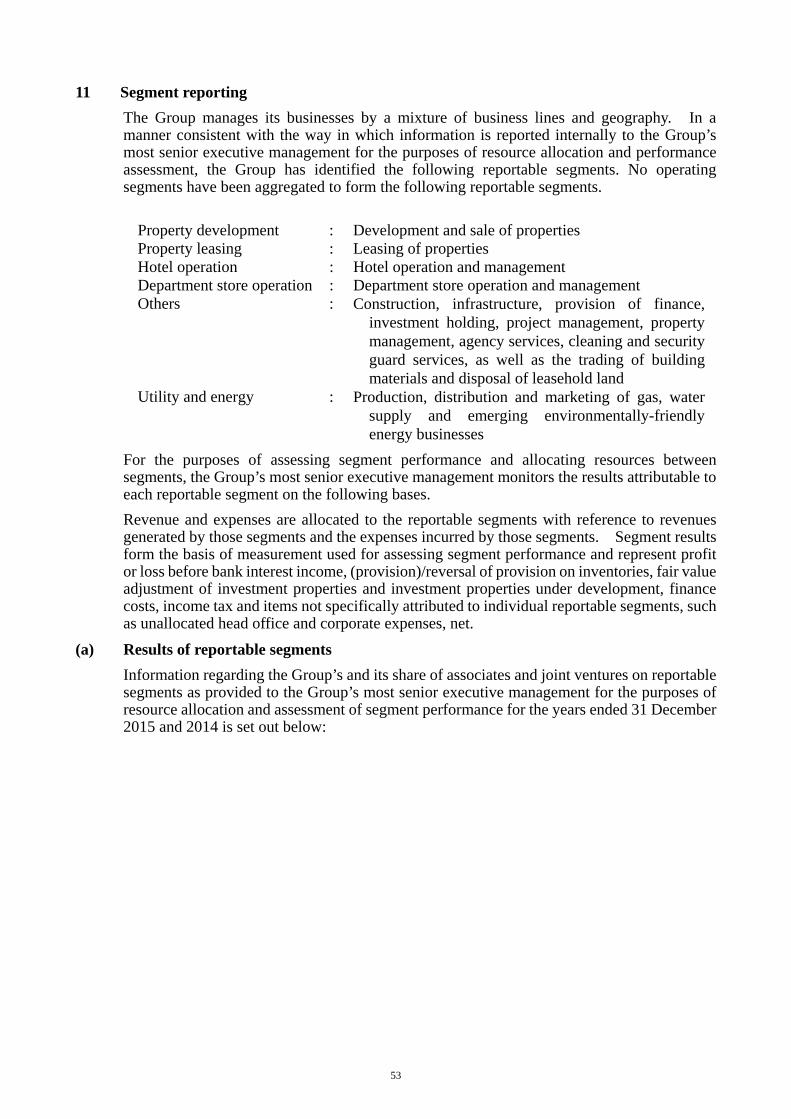
53
11 Segment reporting The Group manages its businesses by a mixture of business lines and geography. In a manner consistent with the way in which information is reported internally to the Group’s most senior executive management for the purposes of resource allocation and performance assessment, the Group has identified the following reportable segments. No operating segments have been aggregated to form the following reportable segments.
Property development : Development and sale of properties Property leasing : Leasing of properties Hotel operation : Hotel operation and management Department store operation : Department store operation and management Others : Construction, infrastructure, provision of finance,
investment holding, project management, property management, agency services, cleaning and security guard services, as well as the trading of building materials and disposal of leasehold land
Utility and energy : Production, distribution and marketing of gas, water supply and emerging environmentally-friendly energy businesses
For the purposes of assessing segment performance and allocating resources between segments, the Group’s most senior executive management monitors the results attributable to each reportable segment on the following bases. Revenue and expenses are allocated to the reportable segments with reference to revenues generated by those segments and the expenses incurred by those segments. Segment results form the basis of measurement used for assessing segment performance and represent profit or loss before bank interest income, (provision)/reversal of provision on inventories, fair value adjustment of investment properties and investment properties under development, finance costs, income tax and items not specifically attributed to individual reportable segments, such as unallocated head office and corporate expenses, net.
(a) Results of reportable segments Information regarding the Group’s and its share of associates and joint ventures on reportable segments as provided to the Group’s most senior executive management for the purposes of resource allocation and assessment of segment performance for the years ended 31 December 2015 and 2014 is set out below:
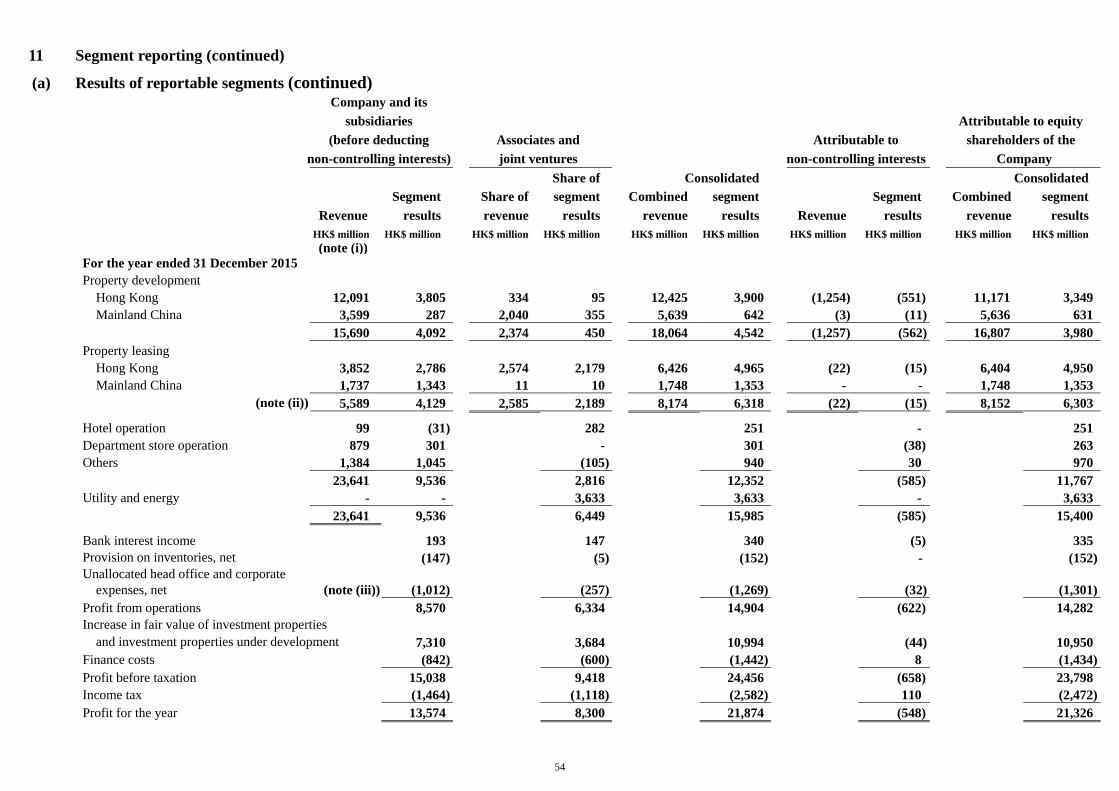
54
11 Segment reporting (continued)
(a) Results of reportable segments (continued) Company and its subsidiaries Attributable to equity (before deducting Associates and Attributable to shareholders of the non-controlling interests) joint ventures non-controlling interests Company Share of Consolidated Consolidated Segment Share of segment Combined segment Segment Combined segment Revenue results revenue results revenue results Revenue results revenue results
HK$ million HK$ million HK$ million HK$ million HK$ million HK$ million HK$ million HK$ million HK$ million HK$ million (note (i)) For the year ended 31 December 2015 Property development Hong Kong 12,091 3,805 334 95 12,425 3,900 (1,254) (551) 11,171 3,349 Mainland China 3,599 287 2,040 355 5,639 642 (3) (11) 5,636 631 15,690 4,092 2,374 450 18,064 4,542 (1,257) (562) 16,807 3,980 Property leasing Hong Kong 3,852 2,786 2,574 2,179 6,426 4,965 (22) (15) 6,404 4,950 Mainland China 1,737 1,343 11 10 1,748 1,353 - - 1,748 1,353
(note (ii)) 5,589 4,129 2,585 2,189 8,174 6,318 (22) (15) 8,152 6,303
Hotel operation 99 (31) 282 251 - 251 Department store operation 879 301 - 301 (38) 263 Others 1,384 1,045 (105) 940 30 970 23,641 9,536 2,816 12,352 (585) 11,767 Utility and energy - - 3,633 3,633 - 3,633 23,641 9,536 6,449 15,985 (585) 15,400
Bank interest income 193 147 340 (5) 335 Provision on inventories, net (147) (5) (152) - (152) Unallocated head office and corporate
expenses, net (note (iii)) (1,012) (257) (1,269) (32) (1,301) Profit from operations 8,570 6,334 14,904 (622) 14,282 Increase in fair value of investment properties
and investment properties under development 7,310 3,684 10,994 (44) 10,950 Finance costs (842) (600) (1,442) 8 (1,434) Profit before taxation 15,038 9,418 24,456 (658) 23,798 Income tax (1,464) (1,118) (2,582) 110 (2,472) Profit for the year 13,574 8,300 21,874 (548) 21,326
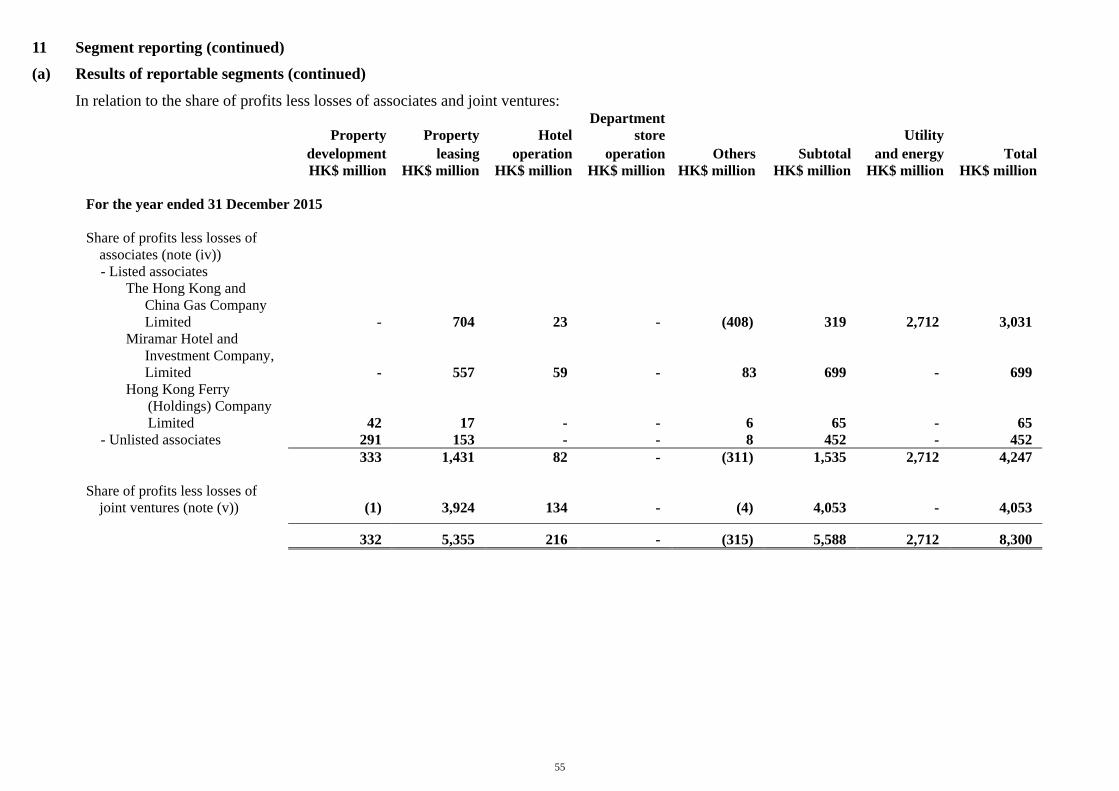
55
11 Segment reporting (continued)
(a) Results of reportable segments (continued)
In relation to the share of profits less losses of associates and joint ventures: Department
Property Property Hotel store Utility development leasing operation operation Others Subtotal and energy Total
HK$ million HK$ million HK$ million HK$ million HK$ million HK$ million HK$ million HK$ million For the year ended 31 December 2015 Share of profits less losses of
associates (note (iv))
- Listed associates The Hong Kong and
China Gas Company Limited - 704 23 - (408) 319 2,712 3,031
Miramar Hotel and Investment Company, Limited - 557 59 - 83 699 - 699
Hong Kong Ferry (Holdings) Company Limited 42 17 - - 6 65 - 65
- Unlisted associates 291 153 - - 8 452 - 452 333 1,431 82 - (311) 1,535 2,712 4,247 Share of profits less losses of joint ventures (note (v)) (1) 3,924 134 - (4) 4,053 - 4,053
332 5,355 216 - (315) 5,588 2,712 8,300
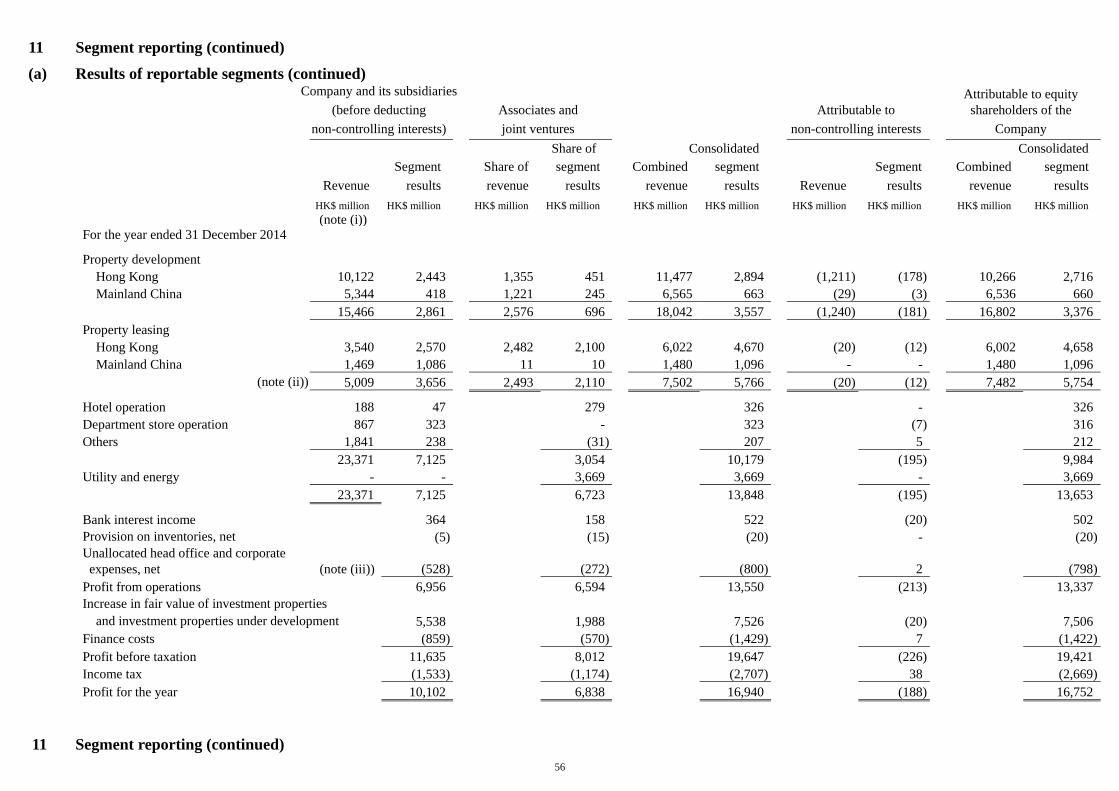
56
11 Segment reporting (continued)
(a) Results of reportable segments (continued) Company and its subsidiaries Attributable to equity
(before deducting Associates and Attributable to shareholders of the non-controlling interests) joint ventures non-controlling interests Company Share of Consolidated Consolidated Segment Share of segment Combined segment Segment Combined segment Revenue results revenue results revenue results Revenue results revenue results
HK$ million HK$ million HK$ million HK$ million HK$ million HK$ million HK$ million HK$ million HK$ million HK$ million (note (i)) For the year ended 31 December 2014
Property development Hong Kong 10,122 2,443 1,355 451 11,477 2,894 (1,211) (178) 10,266 2,716 Mainland China 5,344 418 1,221 245 6,565 663 (29) (3) 6,536 660 15,466 2,861 2,576 696 18,042 3,557 (1,240) (181) 16,802 3,376 Property leasing Hong Kong 3,540 2,570 2,482 2,100 6,022 4,670 (20) (12) 6,002 4,658 Mainland China 1,469 1,086 11 10 1,480 1,096 - - 1,480 1,096
(note (ii)) 5,009 3,656 2,493 2,110 7,502 5,766 (20) (12) 7,482 5,754
Hotel operation 188 47 279 326 - 326 Department store operation 867 323 - 323 (7) 316 Others 1,841 238 (31) 207 5 212 23,371 7,125 3,054 10,179 (195) 9,984 Utility and energy - - 3,669 3,669 - 3,669 23,371 7,125 6,723 13,848 (195) 13,653
Bank interest income 364 158 522 (20) 502 Provision on inventories, net (5) (15) (20) - (20) Unallocated head office and corporate expenses, net (note (iii)) (528) (272) (800) 2 (798) Profit from operations 6,956 6,594 13,550 (213) 13,337 Increase in fair value of investment properties
and investment properties under development 5,538 1,988 7,526 (20) 7,506 Finance costs (859) (570) (1,429) 7 (1,422) Profit before taxation 11,635 8,012 19,647 (226) 19,421 Income tax (1,533) (1,174) (2,707) 38 (2,669) Profit for the year 10,102 6,838 16,940 (188) 16,752
11 Segment reporting (continued)
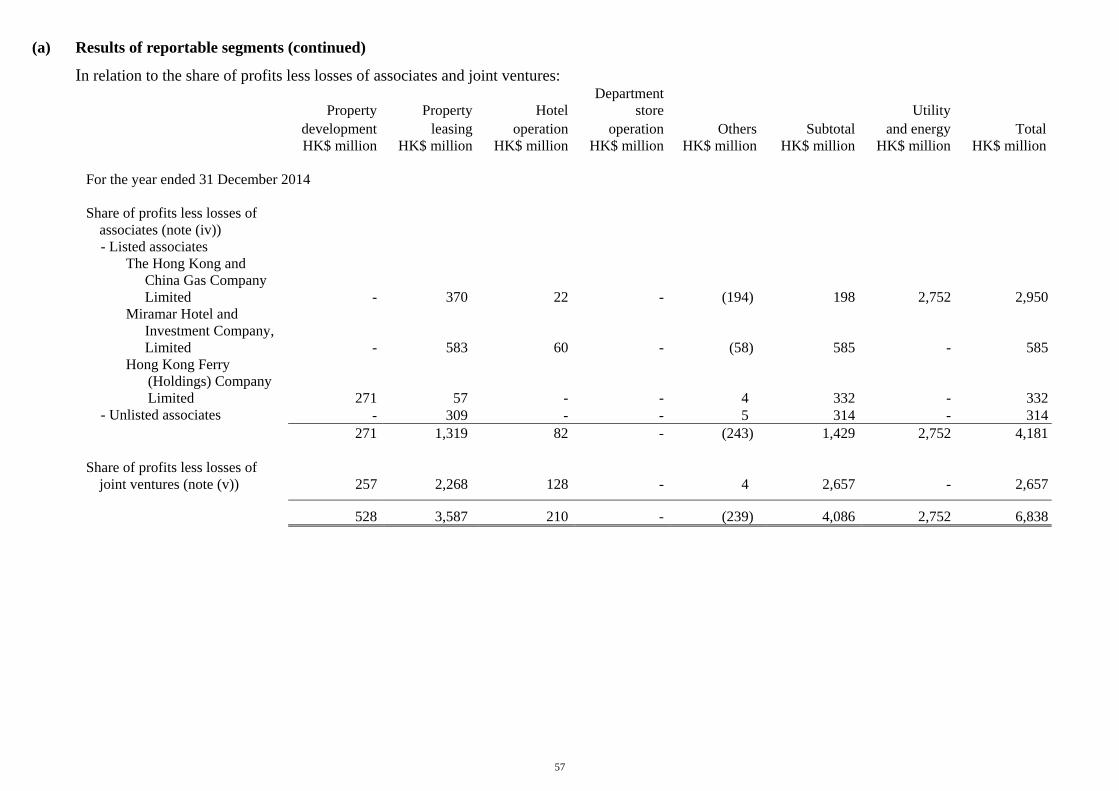
57
(a) Results of reportable segments (continued)
In relation to the share of profits less losses of associates and joint ventures: Department
Property Property Hotel store Utility development leasing operation operation Others Subtotal and energy Total
HK$ million HK$ million HK$ million HK$ million HK$ million HK$ million HK$ million HK$ million For the year ended 31 December 2014 Share of profits less losses of
associates (note (iv))
- Listed associates The Hong Kong and
China Gas Company Limited - 370 22 - (194) 198 2,752 2,950
Miramar Hotel and Investment Company, Limited - 583 60 - (58) 585 - 585
Hong Kong Ferry (Holdings) Company Limited 271 57 - - 4 332 - 332
- Unlisted associates - 309 - - 5 314 - 314 271 1,319 82 - (243) 1,429 2,752 4,181 Share of profits less losses of joint ventures (note (v)) 257 2,268 128 - 4 2,657 - 2,657
528 3,587 210 - (239) 4,086 2,752 6,838
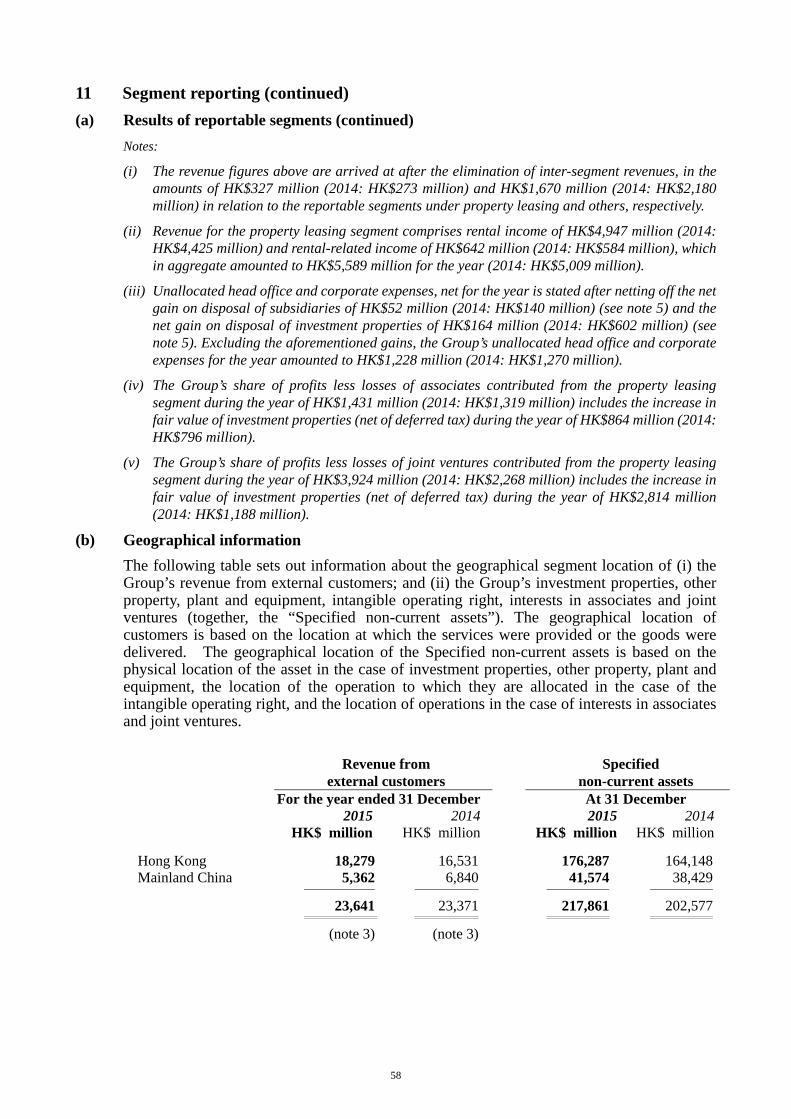
58
11 Segment reporting (continued) (a) Results of reportable segments (continued)
Notes:
(i) The revenue figures above are arrived at after the elimination of inter-segment revenues, in the amounts of HK$327 million (2014: HK$273 million) and HK$1,670 million (2014: HK$2,180 million) in relation to the reportable segments under property leasing and others, respectively.
(ii) Revenue for the property leasing segment comprises rental income of HK$4,947 million (2014: HK$4,425 million) and rental-related income of HK$642 million (2014: HK$584 million), which in aggregate amounted to HK$5,589 million for the year (2014: HK$5,009 million).
(iii) Unallocated head office and corporate expenses, net for the year is stated after netting off the net gain on disposal of subsidiaries of HK$52 million (2014: HK$140 million) (see note 5) and the net gain on disposal of investment properties of HK$164 million (2014: HK$602 million) (see note 5). Excluding the aforementioned gains, the Group’s unallocated head office and corporate expenses for the year amounted to HK$1,228 million (2014: HK$1,270 million).
(iv) The Group’s share of profits less losses of associates contributed from the property leasing segment during the year of HK$1,431 million (2014: HK$1,319 million) includes the increase in fair value of investment properties (net of deferred tax) during the year of HK$864 million (2014: HK$796 million).
(v) The Group’s share of profits less losses of joint ventures contributed from the property leasing segment during the year of HK$3,924 million (2014: HK$2,268 million) includes the increase in fair value of investment properties (net of deferred tax) during the year of HK$2,814 million (2014: HK$1,188 million).
(b) Geographical information The following table sets out information about the geographical segment location of (i) the Group’s revenue from external customers; and (ii) the Group’s investment properties, other property, plant and equipment, intangible operating right, interests in associates and joint ventures (together, the “Specified non-current assets”). The geographical location of customers is based on the location at which the services were provided or the goods were delivered. The geographical location of the Specified non-current assets is based on the physical location of the asset in the case of investment properties, other property, plant and equipment, the location of the operation to which they are allocated in the case of the intangible operating right, and the location of operations in the case of interests in associates and joint ventures.
Revenue from
external customers
Specified
non-current assets For the year ended 31 December At 31 December 2015 2014 2015 2014
HK$ million HK$ million HK$ million HK$ million
Hong Kong 18,279 16,531 176,287 164,148 Mainland China 5,362 6,840 41,574 38,429
23,641 23,371 217,861 202,577
(note 3) (note 3)
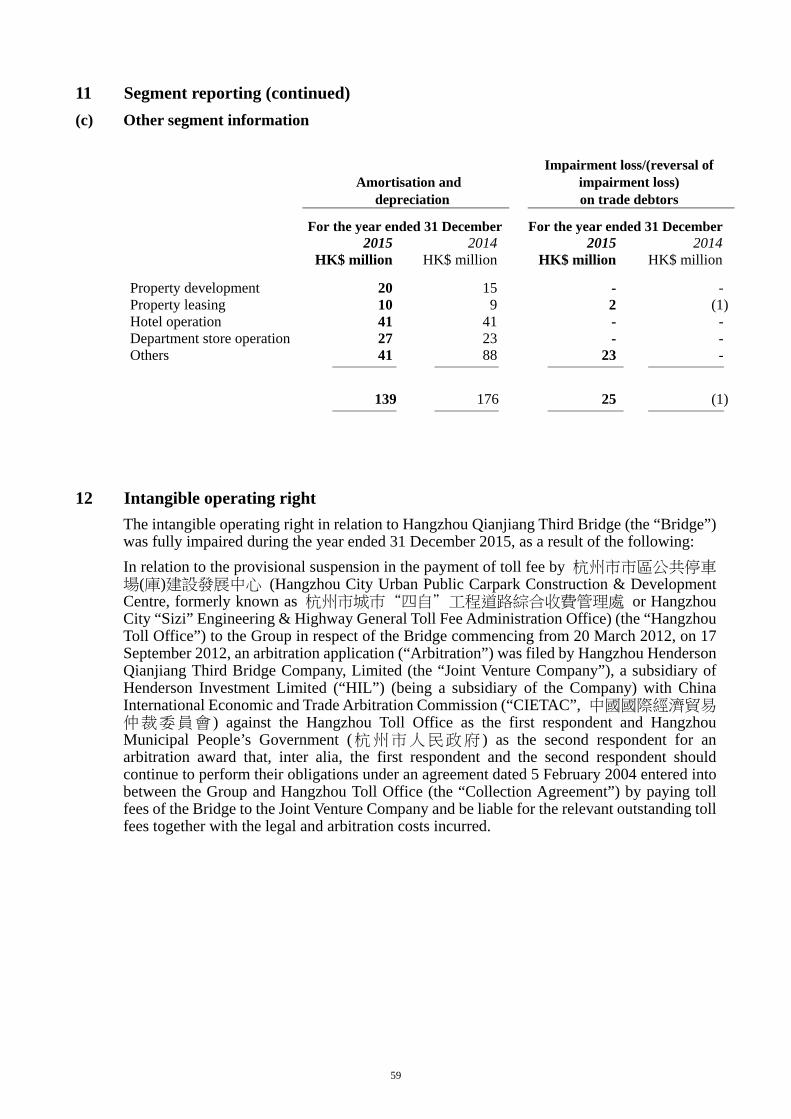
59
11 Segment reporting (continued) (c) Other segment information
Amortisation and
depreciation
Impairment loss/(reversal of impairment loss) on trade debtors
For the year ended 31 December For the year ended 31 December 2015 2014 2015 2014 HK$ million HK$ million HK$ million HK$ million
Property development 20 15 - -Property leasing 10 9 2 (1)Hotel operation 41 41 - -Department store operation 27 23 - -Others 41 88 23 -
139 176 25 (1)
12 Intangible operating right
The intangible operating right in relation to Hangzhou Qianjiang Third Bridge (the “Bridge”) was fully impaired during the year ended 31 December 2015, as a result of the following: In relation to the provisional suspension in the payment of toll fee by 杭州市市區公共停車場(庫)建設發展中心 (Hangzhou City Urban Public Carpark Construction & Development Centre, formerly known as 杭州市城巿“四自”工程道路綜合收費管理處 or Hangzhou City “Sizi” Engineering & Highway General Toll Fee Administration Office) (the “Hangzhou Toll Office”) to the Group in respect of the Bridge commencing from 20 March 2012, on 17 September 2012, an arbitration application (“Arbitration”) was filed by Hangzhou Henderson Qianjiang Third Bridge Company, Limited (the “Joint Venture Company”), a subsidiary of Henderson Investment Limited (“HIL”) (being a subsidiary of the Company) with China International Economic and Trade Arbitration Commission (“CIETAC”, 中國國際經濟貿易仲裁委員會 ) against the Hangzhou Toll Office as the first respondent and Hangzhou Municipal People’s Government (杭州市人民政府 ) as the second respondent for an arbitration award that, inter alia, the first respondent and the second respondent should continue to perform their obligations under an agreement dated 5 February 2004 entered into between the Group and Hangzhou Toll Office (the “Collection Agreement”) by paying toll fees of the Bridge to the Joint Venture Company and be liable for the relevant outstanding toll fees together with the legal and arbitration costs incurred.
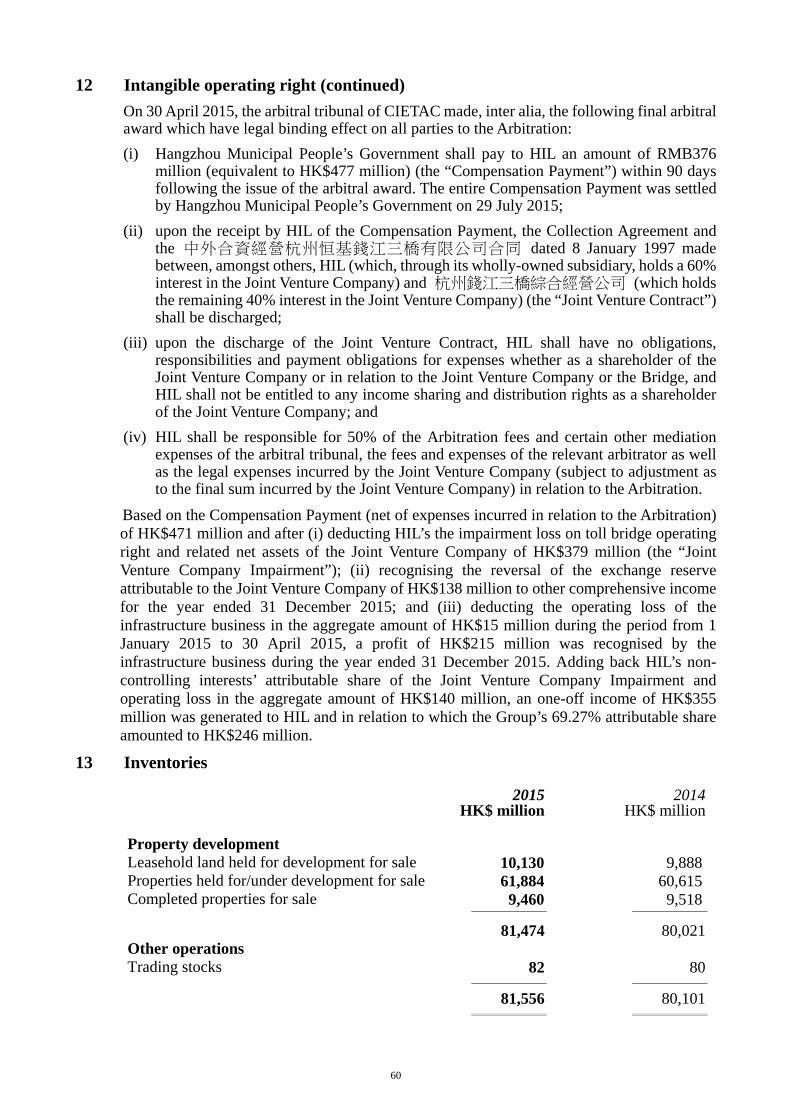
60
12 Intangible operating right (continued) On 30 April 2015, the arbitral tribunal of CIETAC made, inter alia, the following final arbitral award which have legal binding effect on all parties to the Arbitration: (i) Hangzhou Municipal People’s Government shall pay to HIL an amount of RMB376
million (equivalent to HK$477 million) (the “Compensation Payment”) within 90 days following the issue of the arbitral award. The entire Compensation Payment was settled by Hangzhou Municipal People’s Government on 29 July 2015;
(ii) upon the receipt by HIL of the Compensation Payment, the Collection Agreement and the 中外合資經營杭州恒基錢江三橋有限公司合同 dated 8 January 1997 made between, amongst others, HIL (which, through its wholly-owned subsidiary, holds a 60% interest in the Joint Venture Company) and 杭州錢江三橋綜合經營公司 (which holds the remaining 40% interest in the Joint Venture Company) (the “Joint Venture Contract”) shall be discharged;
(iii) upon the discharge of the Joint Venture Contract, HIL shall have no obligations, responsibilities and payment obligations for expenses whether as a shareholder of the Joint Venture Company or in relation to the Joint Venture Company or the Bridge, and HIL shall not be entitled to any income sharing and distribution rights as a shareholder of the Joint Venture Company; and
(iv) HIL shall be responsible for 50% of the Arbitration fees and certain other mediation expenses of the arbitral tribunal, the fees and expenses of the relevant arbitrator as well as the legal expenses incurred by the Joint Venture Company (subject to adjustment as to the final sum incurred by the Joint Venture Company) in relation to the Arbitration.
Based on the Compensation Payment (net of expenses incurred in relation to the Arbitration) of HK$471 million and after (i) deducting HIL’s the impairment loss on toll bridge operating right and related net assets of the Joint Venture Company of HK$379 million (the “Joint Venture Company Impairment”); (ii) recognising the reversal of the exchange reserve attributable to the Joint Venture Company of HK$138 million to other comprehensive income for the year ended 31 December 2015; and (iii) deducting the operating loss of the infrastructure business in the aggregate amount of HK$15 million during the period from 1 January 2015 to 30 April 2015, a profit of HK$215 million was recognised by the infrastructure business during the year ended 31 December 2015. Adding back HIL’s non-controlling interests’ attributable share of the Joint Venture Company Impairment and operating loss in the aggregate amount of HK$140 million, an one-off income of HK$355 million was generated to HIL and in relation to which the Group’s 69.27% attributable share amounted to HK$246 million.
13 Inventories 2015 2014 HK$ million HK$ million Property development Leasehold land held for development for sale 10,130 9,888Properties held for/under development for sale 61,884 60,615Completed properties for sale 9,460 9,518
81,474 80,021Other operations Trading stocks 82 80
81,556 80,101
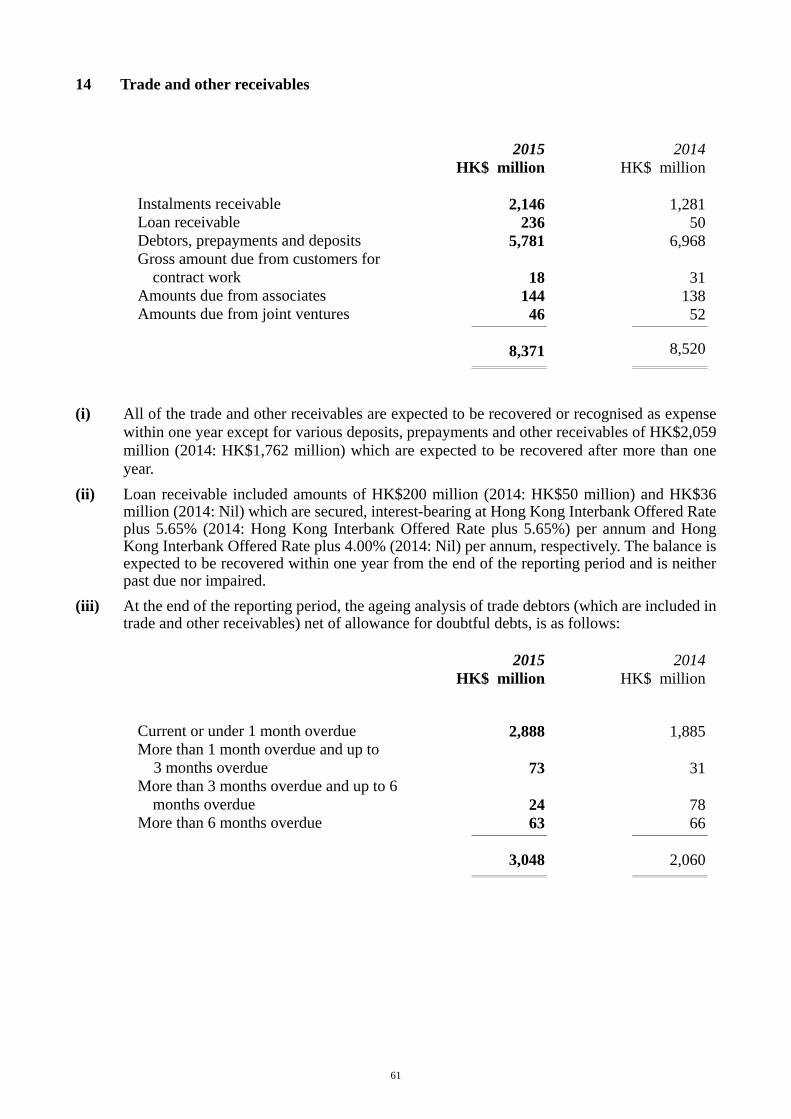
61
14 Trade and other receivables
2015 2014 HK$ million HK$ million Instalments receivable 2,146 1,281Loan receivable 236 50Debtors, prepayments and deposits 5,781 6,968Gross amount due from customers for
contract work 18 31Amounts due from associates 144 138Amounts due from joint ventures 46 52
8,371 8,520
(i) All of the trade and other receivables are expected to be recovered or recognised as expense within one year except for various deposits, prepayments and other receivables of HK$2,059 million (2014: HK$1,762 million) which are expected to be recovered after more than one year.
(ii) Loan receivable included amounts of HK$200 million (2014: HK$50 million) and HK$36 million (2014: Nil) which are secured, interest-bearing at Hong Kong Interbank Offered Rate plus 5.65% (2014: Hong Kong Interbank Offered Rate plus 5.65%) per annum and Hong Kong Interbank Offered Rate plus 4.00% (2014: Nil) per annum, respectively. The balance is expected to be recovered within one year from the end of the reporting period and is neither past due nor impaired.
(iii) At the end of the reporting period, the ageing analysis of trade debtors (which are included in trade and other receivables) net of allowance for doubtful debts, is as follows:
2015 2014 HK$ million HK$ million
Current or under 1 month overdue 2,888
1,885More than 1 month overdue and up to
3 months overdue 73
31More than 3 months overdue and up to 6
months overdue 24
78More than 6 months overdue 63 66
3,048 2,060
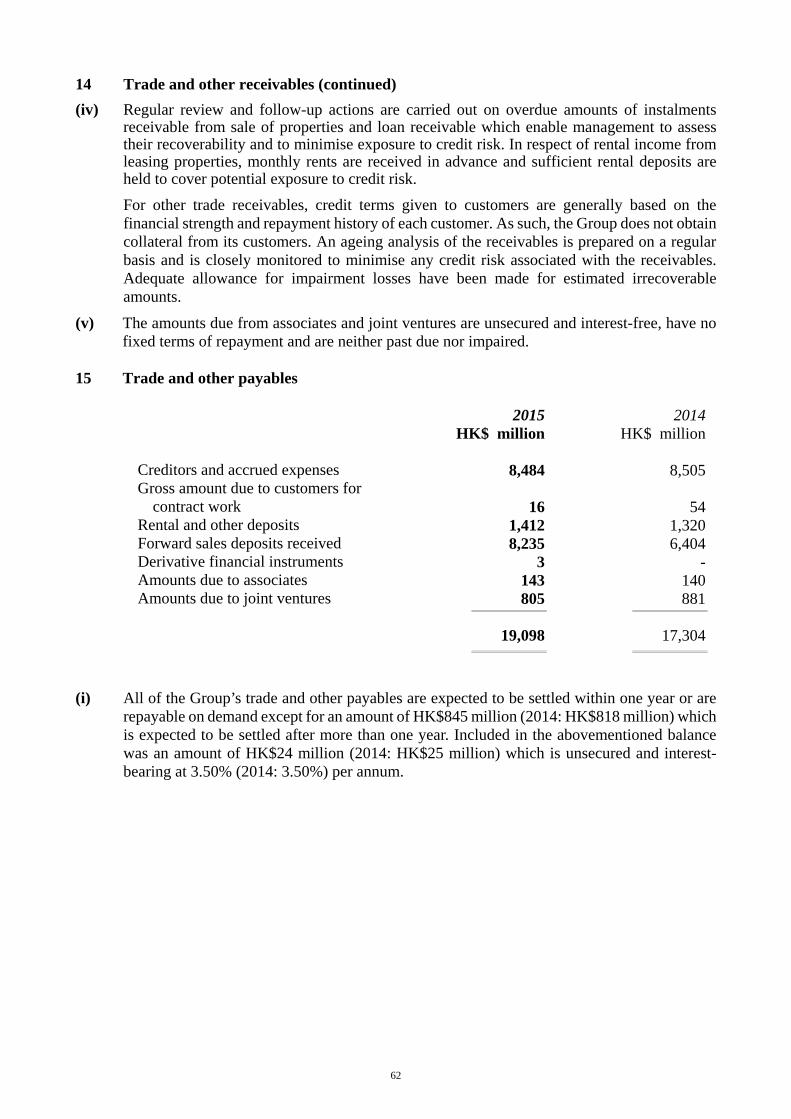
62
14 Trade and other receivables (continued) (iv) Regular review and follow-up actions are carried out on overdue amounts of instalments
receivable from sale of properties and loan receivable which enable management to assess their recoverability and to minimise exposure to credit risk. In respect of rental income from leasing properties, monthly rents are received in advance and sufficient rental deposits are held to cover potential exposure to credit risk. For other trade receivables, credit terms given to customers are generally based on the financial strength and repayment history of each customer. As such, the Group does not obtain collateral from its customers. An ageing analysis of the receivables is prepared on a regular basis and is closely monitored to minimise any credit risk associated with the receivables. Adequate allowance for impairment losses have been made for estimated irrecoverable amounts.
(v) The amounts due from associates and joint ventures are unsecured and interest-free, have no fixed terms of repayment and are neither past due nor impaired.
15 Trade and other payables
2015 2014 HK$ million HK$ million Creditors and accrued expenses 8,484 8,505Gross amount due to customers for
contract work 16
54Rental and other deposits 1,412 1,320Forward sales deposits received 8,235 6,404Derivative financial instruments 3 -Amounts due to associates 143 140Amounts due to joint ventures 805 881
19,098 17,304
(i) All of the Group’s trade and other payables are expected to be settled within one year or are repayable on demand except for an amount of HK$845 million (2014: HK$818 million) which is expected to be settled after more than one year. Included in the abovementioned balance was an amount of HK$24 million (2014: HK$25 million) which is unsecured and interest-bearing at 3.50% (2014: 3.50%) per annum.

63
15 Trade and other payables (continued) (ii) At the end of the reporting period, the ageing analysis of trade creditors (which are included
in trade and other payables) is as follows: 2015 2014 HK$ million HK$ million Due within 1 month or on demand 1,686 1,298Due after 1 month but within 3 months 1,120 1,635Due after 3 months but within 6
months 1,183 1,273Due after 6 months 2,599 2,486
6,588 6,692
(iii) The amounts due to associates and joint ventures are unsecured, interest-free and have no fixed terms of repayment.
16 Review of results The financial results for the year ended 31 December 2015 have been reviewed with no disagreement by the Audit Committee of the Company.
The figures in respect of the preliminary announcement of the Group’s results for the year ended 31 December 2015 have been compared by the Company’s auditor, KPMG, Certified Public Accountants, to the amounts set out in the Group’s consolidated financial statements for the year and the amounts were found to be in agreement. The work performed by KPMG in this respect was limited and did not constitute an audit, review or other assurance engagement and consequently no assurance has been expressed by KPMG on this announcement.
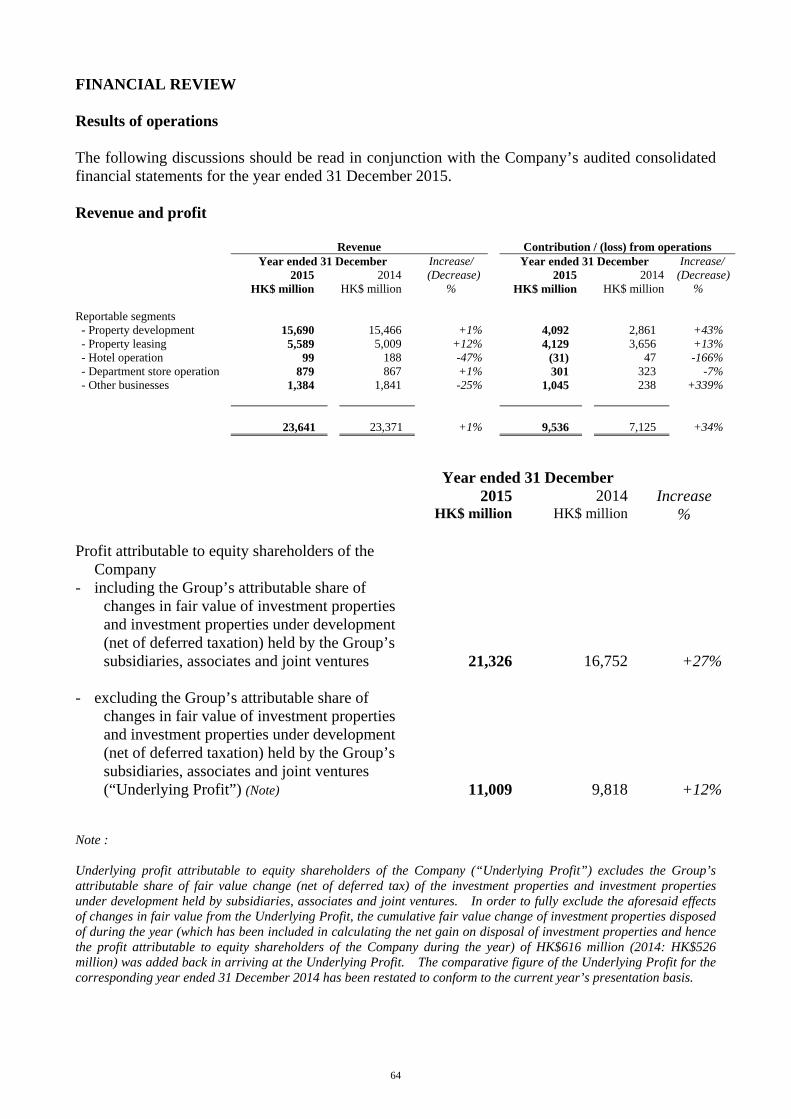
64
FINANCIAL REVIEW Results of operations The following discussions should be read in conjunction with the Company’s audited consolidated financial statements for the year ended 31 December 2015. Revenue and profit Revenue Contribution / (loss) from operations Year ended 31 December Increase/ Year ended 31 December Increase/ 2015 2014 (Decrease) 2015 2014 (Decrease) HK$ million HK$ million % HK$ million HK$ million % Reportable segments - Property development 15,690 15,466 +1% 4,092 2,861 +43% - Property leasing 5,589 5,009 +12% 4,129 3,656 +13% - Hotel operation 99 188 -47% (31) 47 -166% - Department store operation 879 867 +1% 301 323 -7% - Other businesses 1,384 1,841 -25% 1,045 238 +339% 23,641 23,371 +1% 9,536 7,125 +34% Year ended 31 December 2015 2014 Increase HK$ million HK$ million % Profit attributable to equity shareholders of the Company
- including the Group’s attributable share of changes in fair value of investment properties and investment properties under development (net of deferred taxation) held by the Group’s subsidiaries, associates and joint ventures 21,326 16,752 +27%
- excluding the Group’s attributable share of
changes in fair value of investment properties and investment properties under development (net of deferred taxation) held by the Group’s subsidiaries, associates and joint ventures (“Underlying Profit”) (Note)
11,009
9,818
+12% Note : Underlying profit attributable to equity shareholders of the Company (“Underlying Profit”) excludes the Group’s attributable share of fair value change (net of deferred tax) of the investment properties and investment properties under development held by subsidiaries, associates and joint ventures. In order to fully exclude the aforesaid effects of changes in fair value from the Underlying Profit, the cumulative fair value change of investment properties disposed of during the year (which has been included in calculating the net gain on disposal of investment properties and hence the profit attributable to equity shareholders of the Company during the year) of HK$616 million (2014: HK$526 million) was added back in arriving at the Underlying Profit. The comparative figure of the Underlying Profit for the corresponding year ended 31 December 2014 has been restated to conform to the current year’s presentation basis.
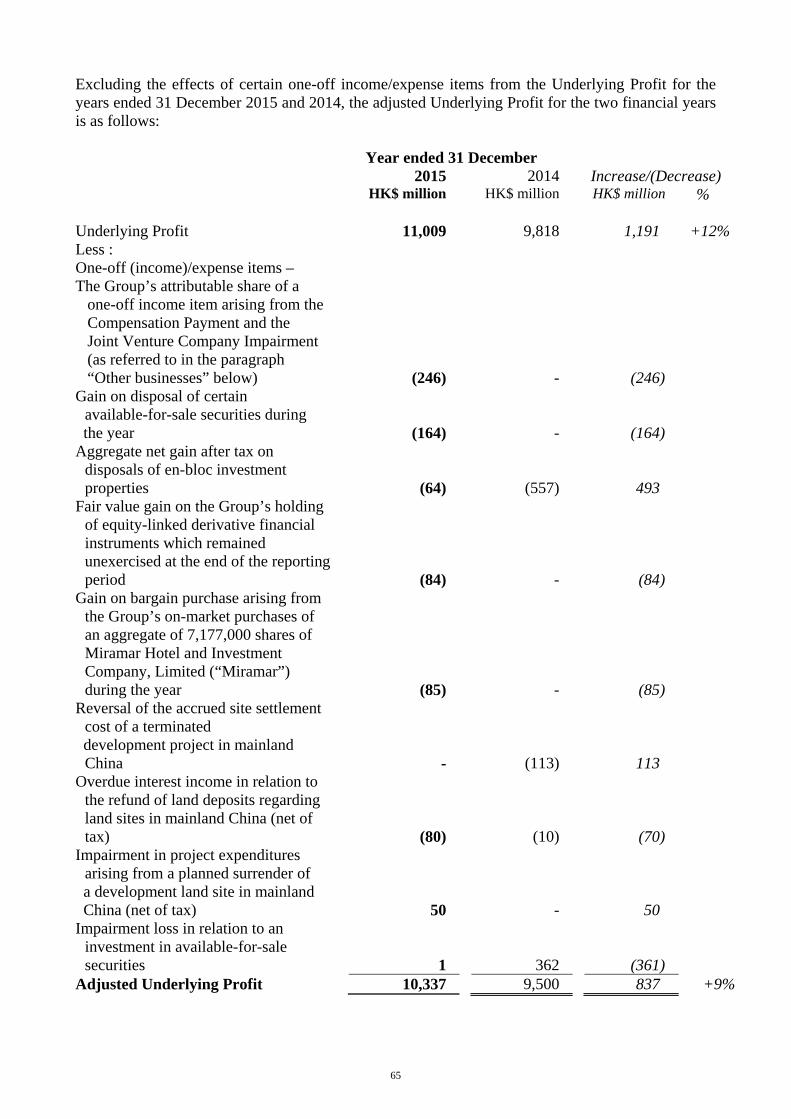
65
Excluding the effects of certain one-off income/expense items from the Underlying Profit for the years ended 31 December 2015 and 2014, the adjusted Underlying Profit for the two financial years is as follows: Year ended 31 December 2015 2014 Increase/(Decrease) HK$ million HK$ million HK$ million % Underlying Profit 11,009 9,818 1,191 +12%Less : One-off (income)/expense items – The Group’s attributable share of a
one-off income item arising from the Compensation Payment and the Joint Venture Company Impairment (as referred to in the paragraph “Other businesses” below)
(246)
-
(246)
Gain on disposal of certain available-for-sale securities during the year
Aggregate net gain after tax on disposals of en-bloc investment properties
Fair value gain on the Group’s holding of equity-linked derivative financial instruments which remained unexercised at the end of the reportingperiod
Gain on bargain purchase arising from the Group’s on-market purchases of an aggregate of 7,177,000 shares of Miramar Hotel and Investment Company, Limited (“Miramar”) during the year
Reversal of the accrued site settlement cost of a terminated
development project in mainland China
Overdue interest income in relation to the refund of land deposits regarding land sites in mainland China (net of tax)
Impairment in project expenditures arising from a planned surrender of
a development land site in mainland China (net of tax) Impairment loss in relation to an
investment in available-for-sale securities
(164)
(64)
(84)
(85)
-
(80)
50
1
-
(557)
-
-
(113)
(10)
-
362
(164)
493
(84)
(85)
113
(70)
50
(361)
Adjusted Underlying Profit 10,337 9,500 837 +9%
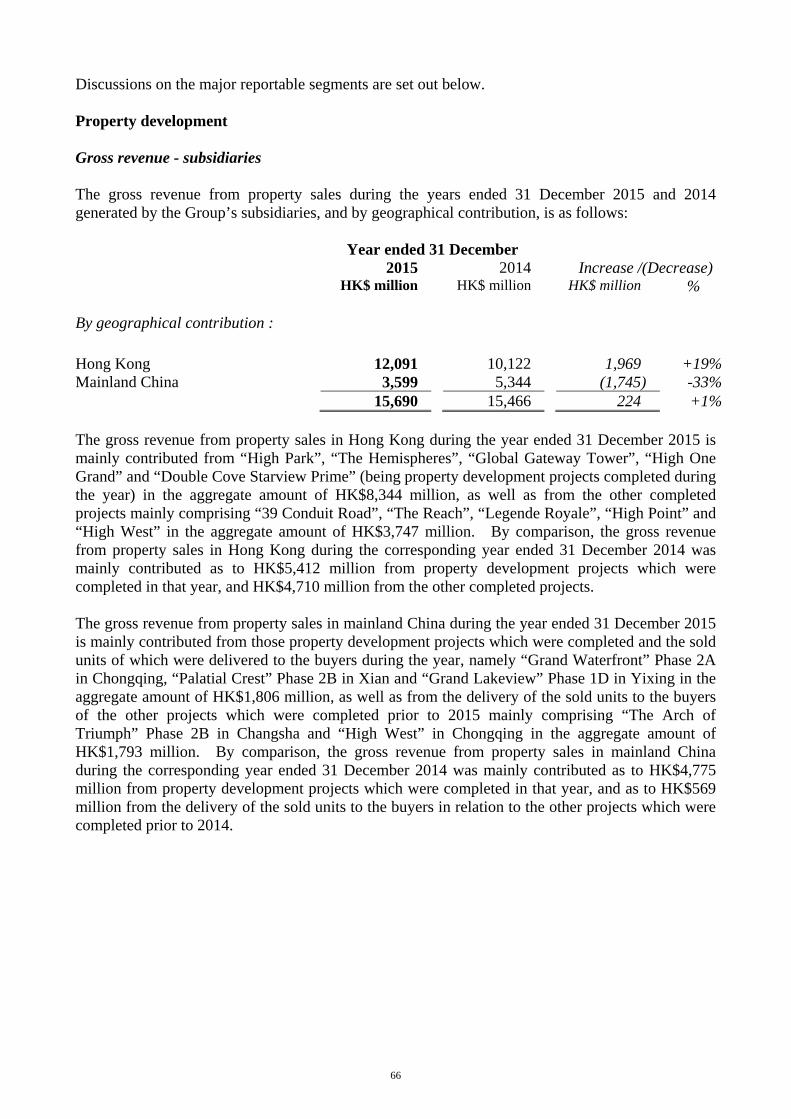
66
Discussions on the major reportable segments are set out below. Property development Gross revenue - subsidiaries The gross revenue from property sales during the years ended 31 December 2015 and 2014 generated by the Group’s subsidiaries, and by geographical contribution, is as follows: Year ended 31 December 2015 2014 Increase /(Decrease) HK$ million HK$ million HK$ million % By geographical contribution : Hong Kong 12,091 10,122 1,969 +19% Mainland China 3,599 5,344 (1,745) -33% 15,690 15,466 224 +1% The gross revenue from property sales in Hong Kong during the year ended 31 December 2015 is mainly contributed from “High Park”, “The Hemispheres”, “Global Gateway Tower”, “High One Grand” and “Double Cove Starview Prime” (being property development projects completed during the year) in the aggregate amount of HK$8,344 million, as well as from the other completed projects mainly comprising “39 Conduit Road”, “The Reach”, “Legende Royale”, “High Point” and “High West” in the aggregate amount of HK$3,747 million. By comparison, the gross revenue from property sales in Hong Kong during the corresponding year ended 31 December 2014 was mainly contributed as to HK$5,412 million from property development projects which were completed in that year, and HK$4,710 million from the other completed projects. The gross revenue from property sales in mainland China during the year ended 31 December 2015 is mainly contributed from those property development projects which were completed and the sold units of which were delivered to the buyers during the year, namely “Grand Waterfront” Phase 2A in Chongqing, “Palatial Crest” Phase 2B in Xian and “Grand Lakeview” Phase 1D in Yixing in the aggregate amount of HK$1,806 million, as well as from the delivery of the sold units to the buyers of the other projects which were completed prior to 2015 mainly comprising “The Arch of Triumph” Phase 2B in Changsha and “High West” in Chongqing in the aggregate amount of HK$1,793 million. By comparison, the gross revenue from property sales in mainland China during the corresponding year ended 31 December 2014 was mainly contributed as to HK$4,775 million from property development projects which were completed in that year, and as to HK$569 million from the delivery of the sold units to the buyers in relation to the other projects which were completed prior to 2014.
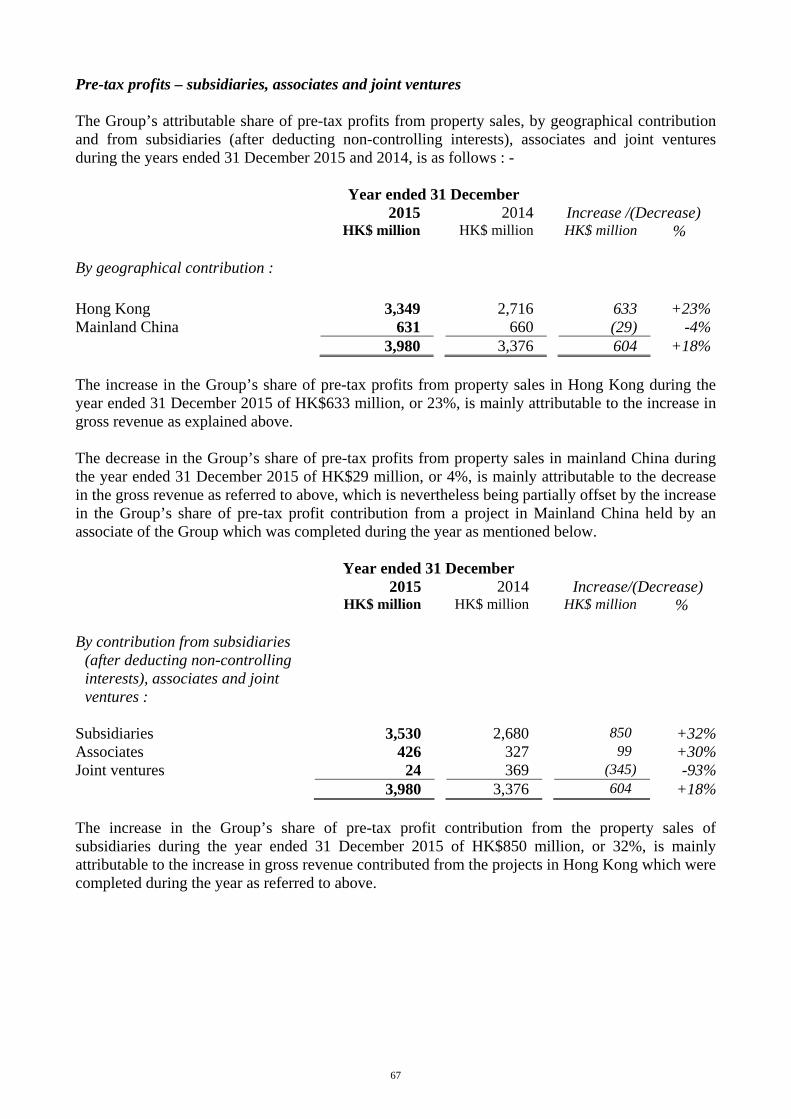
67
Pre-tax profits – subsidiaries, associates and joint ventures The Group’s attributable share of pre-tax profits from property sales, by geographical contribution and from subsidiaries (after deducting non-controlling interests), associates and joint ventures during the years ended 31 December 2015 and 2014, is as follows : - Year ended 31 December 2015 2014 Increase /(Decrease) HK$ million HK$ million HK$ million % By geographical contribution : Hong Kong 3,349 2,716 633 +23%Mainland China 631 660 (29) -4% 3,980 3,376 604 +18% The increase in the Group’s share of pre-tax profits from property sales in Hong Kong during the year ended 31 December 2015 of HK$633 million, or 23%, is mainly attributable to the increase in gross revenue as explained above. The decrease in the Group’s share of pre-tax profits from property sales in mainland China during the year ended 31 December 2015 of HK$29 million, or 4%, is mainly attributable to the decrease in the gross revenue as referred to above, which is nevertheless being partially offset by the increase in the Group’s share of pre-tax profit contribution from a project in Mainland China held by an associate of the Group which was completed during the year as mentioned below. Year ended 31 December 2015 2014 Increase/(Decrease) HK$ million HK$ million HK$ million % By contribution from subsidiaries
(after deducting non-controlling interests), associates and joint ventures :
Subsidiaries 3,530 2,680 850 +32%Associates 426 327 99 +30%Joint ventures 24 369 (345) -93% 3,980 3,376 604 +18% The increase in the Group’s share of pre-tax profit contribution from the property sales of subsidiaries during the year ended 31 December 2015 of HK$850 million, or 32%, is mainly attributable to the increase in gross revenue contributed from the projects in Hong Kong which were completed during the year as referred to above.
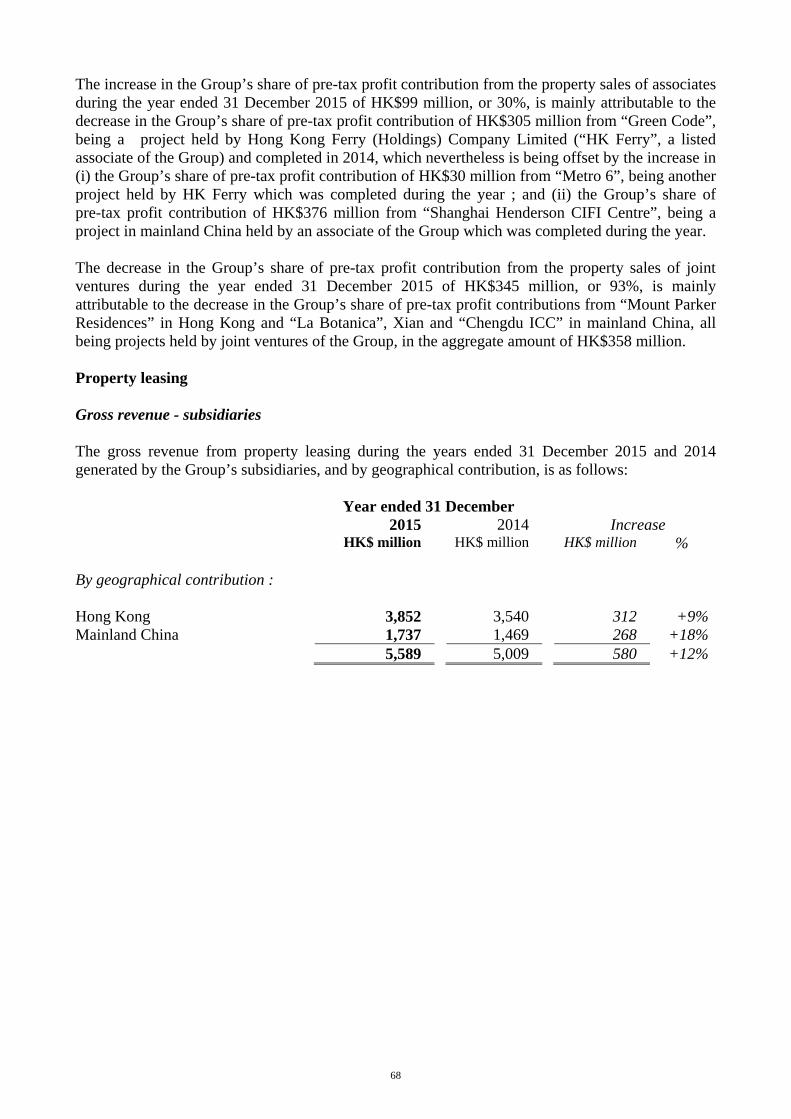
68
The increase in the Group’s share of pre-tax profit contribution from the property sales of associates during the year ended 31 December 2015 of HK$99 million, or 30%, is mainly attributable to the decrease in the Group’s share of pre-tax profit contribution of HK$305 million from “Green Code”, being a project held by Hong Kong Ferry (Holdings) Company Limited (“HK Ferry”, a listed associate of the Group) and completed in 2014, which nevertheless is being offset by the increase in (i) the Group’s share of pre-tax profit contribution of HK$30 million from “Metro 6”, being another project held by HK Ferry which was completed during the year ; and (ii) the Group’s share of pre-tax profit contribution of HK$376 million from “Shanghai Henderson CIFI Centre”, being a project in mainland China held by an associate of the Group which was completed during the year. The decrease in the Group’s share of pre-tax profit contribution from the property sales of joint ventures during the year ended 31 December 2015 of HK$345 million, or 93%, is mainly attributable to the decrease in the Group’s share of pre-tax profit contributions from “Mount Parker Residences” in Hong Kong and “La Botanica”, Xian and “Chengdu ICC” in mainland China, all being projects held by joint ventures of the Group, in the aggregate amount of HK$358 million. Property leasing Gross revenue - subsidiaries The gross revenue from property leasing during the years ended 31 December 2015 and 2014 generated by the Group’s subsidiaries, and by geographical contribution, is as follows: Year ended 31 December 2015 2014 Increase HK$ million HK$ million HK$ million % By geographical contribution : Hong Kong 3,852 3,540 312 +9% Mainland China 1,737 1,469 268 +18% 5,589 5,009 580 +12%
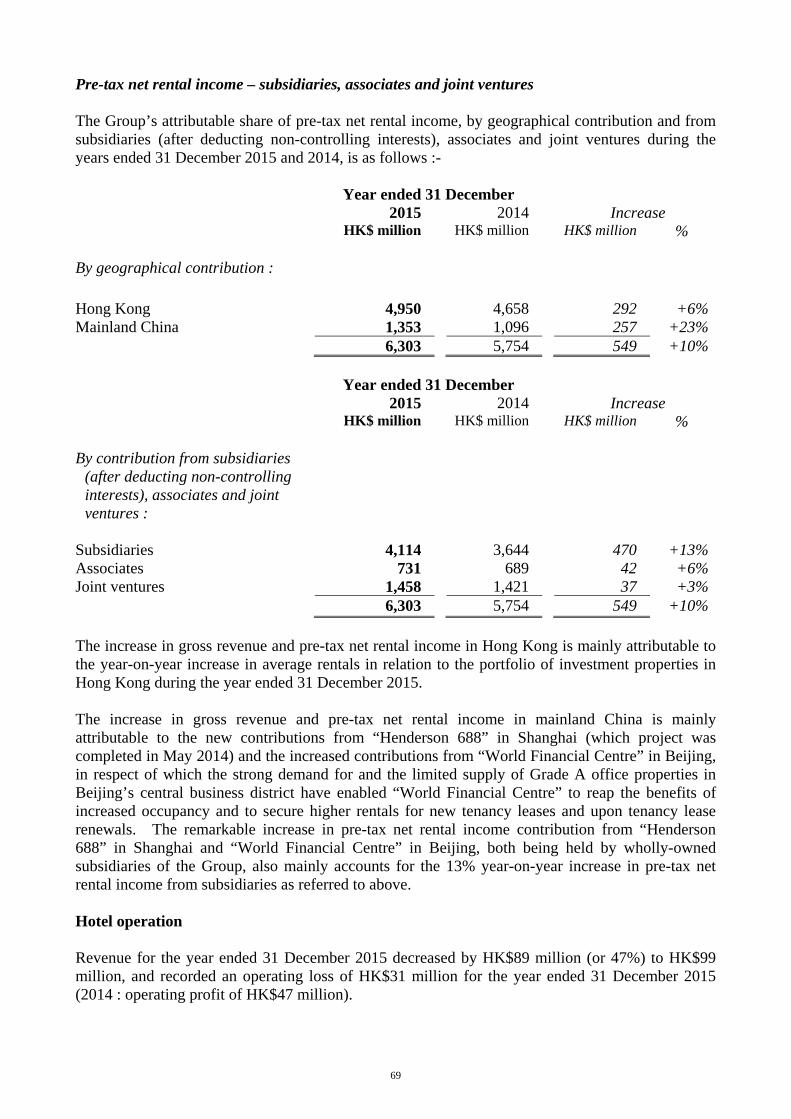
69
Pre-tax net rental income – subsidiaries, associates and joint ventures The Group’s attributable share of pre-tax net rental income, by geographical contribution and from subsidiaries (after deducting non-controlling interests), associates and joint ventures during the years ended 31 December 2015 and 2014, is as follows :- Year ended 31 December 2015 2014 Increase HK$ million HK$ million HK$ million % By geographical contribution : Hong Kong 4,950 4,658 292 +6% Mainland China 1,353 1,096 257 +23% 6,303 5,754 549 +10% Year ended 31 December 2015 2014 Increase HK$ million HK$ million HK$ million % By contribution from subsidiaries
(after deducting non-controlling interests), associates and joint ventures :
Subsidiaries 4,114 3,644 470 +13% Associates 731 689 42 +6% Joint ventures 1,458 1,421 37 +3% 6,303 5,754 549 +10% The increase in gross revenue and pre-tax net rental income in Hong Kong is mainly attributable to the year-on-year increase in average rentals in relation to the portfolio of investment properties in Hong Kong during the year ended 31 December 2015. The increase in gross revenue and pre-tax net rental income in mainland China is mainly attributable to the new contributions from “Henderson 688” in Shanghai (which project was completed in May 2014) and the increased contributions from “World Financial Centre” in Beijing, in respect of which the strong demand for and the limited supply of Grade A office properties in Beijing’s central business district have enabled “World Financial Centre” to reap the benefits of increased occupancy and to secure higher rentals for new tenancy leases and upon tenancy lease renewals. The remarkable increase in pre-tax net rental income contribution from “Henderson 688” in Shanghai and “World Financial Centre” in Beijing, both being held by wholly-owned subsidiaries of the Group, also mainly accounts for the 13% year-on-year increase in pre-tax net rental income from subsidiaries as referred to above. Hotel operation Revenue for the year ended 31 December 2015 decreased by HK$89 million (or 47%) to HK$99 million, and recorded an operating loss of HK$31 million for the year ended 31 December 2015 (2014 : operating profit of HK$47 million).
70
During the year ended 31 December 2015, the Group’s operation of Newton hotels recorded (i) an average occupancy rate of 53.4%, which represents a remarkable year-on-year decrease when compared with 73.5% for the corresponding year ended 31 December 2014; and (ii) a year-on-year decrease of 14% in the average daily room rate when compared with that for the corresponding year ended 31 December 2014. Such decreases are mainly due to (i) the difficult market conditions for the hotel industry in Hong Kong during the year ended 31 December 2015 as a result of the decrease in tourist arrivals from mainland China to Hong Kong when compared with the corresponding year ended 31 December 2014; (ii) the unfavourable development of the market sentiment and economic environment in Hong Kong during the second half of 2015; and (iii) the cessation of business operation of Newton Hong Kong Hotel on 25 August 2015 to make way for its redevelopment into an office building. Department store operation Department store operation is carried out by Citistore (Hong Kong) Limited (“Citistore HK”) which became a wholly-owned subsidiary of Henderson Investment Limited (“HIL”, a subsidiary of the Company) following the completion of HIL’s acquisition of Citistore HK from the Group on 1 December 2014. For the year ended 31 December 2015, revenue increased by HK$12 million (or 1%) to HK$879 million. However, profit contribution decreased by HK$22 million (or 7%) to HK$301 million, which is mainly attributable to (i) the reduced profit contribution of HK$5 million from certain merchandise sections located on the ground floor of the Tsuen Wan Store which underwent renovation in July and August 2015 ; and (ii) the downturn of Hong Kong’s retail market sentiment during the months of November and December 2015 which resulted in reduced profit contribution of HK$12 million when compared with that for the corresponding two months of November and December 2014. Other businesses Other businesses mainly comprise construction, infrastructure, provision of finance, investment holding, project management, property management, agency services, cleaning and security guard services, as well as the trading of building materials and disposal of leasehold land. In relation to the infrastructure business, reference is made to the paragraph headed “Henderson Investment Limited (“HIL”)” under the section “Business Review” of the Chairman’s Statement of the Company’s announcement of results for the year ended 31 December 2015 and of which this Financial Review forms a part. On 30 April 2015 (being the date on which the arbitral tribunal of CIETAC issued the final arbitral award in relation to the Arbitration), the intangible operating right in relation to Hangzhou Qianjiang Third Bridge was fully impaired by HIL. The entire Compensation Payment was settled by Hangzhou Municipal People’s Government with HIL on 29 July 2015. Based on the Compensation Payment (net of expenses incurred in relation to the Arbitration) of HK$471 million and after (i) deducting HIL’s impairment loss on the toll bridge operating right and the related net assets of the Joint Venture Company of HK$379 million at 30 April 2015 (the “Joint Venture Company Impairment”); (ii) recognising the reversal of the exchange reserve attributable to the Joint Venture Company of HK$138 million at 30 April 2015; and (iii) deducting the operating loss of the Joint Venture Company in the aggregate amount of HK$15 million during the period from 1 January 2015 to 30 April 2015, a profit of HK$215 million was recognised by the infrastructure business during the year ended 31 December 2015, representing a year-on-year increase in profit contribution of HK$269 million compared with the operating loss of HK$54 million for the corresponding year ended 31 December 2014. Adding back HIL’s non-controlling interests’ attributable share of the Joint Venture Company Impairment and the Joint Venture Company’s operating loss in the aggregate amount of HK$140 million, a one-off income of HK$355 million was generated to HIL and in relation to which the Group’s 69.27% attributable share amounted to HK$246 million.
71
Revenue of other businesses for the year ended 31 December 2015 decreased by HK$457 million, or 25%, from that for the corresponding year ended 31 December 2014. This is mainly due to the decrease in construction revenue of HK$514 million which is mainly attributable to the non-recurrence of the revenue contribution from the construction contract of “Green Code” project following its project completion in 2014. Such decrease is mitigated by (i) the increase in interest income from the provision of financing services of HK$26 million; and (ii) the increase in revenue contribution from the trading of building materials of HK$27 million. The profit contribution of other businesses for the year ended 31 December 2015 increased by HK$807 million, or 339%, over that for the corresponding year ended 31 December 2014. This is mainly attributable to (i) the increase in profit contribution from the infrastructure business of HK$269 million as referred to above; (ii) a gain on disposal of certain available-for-sale securities in the amount of HK$164 million during the year ended 31 December 2015; (iii) the fair value gain of HK$84 million recognised by the Group from its holding of equity-linked derivative financial instruments which remained unexercised at the end of the reporting period; and (iv) the non-recurrence of an impairment loss in relation to an investment in available-for-sale securities in the amount of HK$362 million for the corresponding year ended 31 December 2014, which in aggregate are being partially offset by (v) the increase in operating loss from construction activities of HK$9 million for the reason as referred to above; and (vi) the non-recurrence of a one-off income item of HK$113 million arising from the reversal during the corresponding year ended 31 December 2014 of the accrued site settlement cost of a terminated development project in mainland China. Associates The Group’s attributable share of post-tax profits less losses of associates during the year ended 31 December 2015 amounted to HK$4,247 million (2014: HK$4,181 million), representing an increase of HK$66 million, or 2%, over that for the corresponding year ended 31 December 2014. Excluding the Group’s attributable share of changes in fair value of investment properties held by the associates (net of deferred taxation) of HK$864 million during the year ended 31 December 2015 (2014 : HK$796 million), the Group’s attributable share of the underlying post-tax profits less losses of associates for the year ended 31 December 2015 (as adjusted for by adding back the Group’s attributable share of the cumulative fair value change of investment properties disposed of during the year of HK$76 million (2014: Nil), which is consistent with the basis as referred to in “Note” to the paragraph headed “Revenue and profit” above) amounted to HK$3,459 million (2014: HK$3,385 million), representing an increase of HK$74 million, or 2%, over that for the corresponding year ended 31 December 2014. Such year-on-year increase in the underlying post-tax profits was mainly due to the following: (i) the Group’s attributable share of increase in the underlying post-tax profit contribution from
Miramar of HK$237 million, mainly due to the share of gain on disposal of an investment property of HK$132 million during the year (as adjusted for by adding back the Group’s attributable share of the cumulative fair value change of investment properties disposed of during the year of HK$76 million (2014 : Nil), which is consistent with the basis as referred to in “Note” to the paragraph headed “Revenue and profit” above) and the gain on bargain purchase to the Group of HK$85 million (2014 : Nil) arising from the Group’s on-market purchases of an aggregate of 7,177,000 shares of Miramar during the year ;
(ii) the Group’s attributable share of post-tax underlying profit contribution of HK$291 million
(2014 : Nil) from “Shanghai Henderson CIFI Centre”, being a project in mainland China held by an associate of the Group which was completed during the year ;
72
(iii) the Group’s attributable share of decrease in the underlying post-tax profit contribution from The Hong Kong and China Gas Company Limited (“HKCG”) of HK$241 million, mainly due to the adverse impact resulted from low international oil prices, declining growth in industrial production in mainland China and the depreciation of Renminbi during the year ; and
(iv) the Group’s attributable share of decrease in the underlying post-tax profit contribution from
HK Ferry of HK$225 million, mainly due to the non-recurrence of the sizeable share of post-tax profit contribution of HK$253 million from the property sales of “Green Code” which was a project completed in 2014.
Joint ventures The Group’s attributable share of post-tax profits less losses of joint ventures during the year ended 31 December 2015 amounted to HK$4,053 million (2014: HK$2,657 million), representing an increase of HK$1,396 million, or 53%, over that for the corresponding year ended 31 December 2014. Excluding the Group’s attributable share of changes in fair value of investment properties held by the joint ventures (net of deferred taxation) of HK$2,814 million during the year ended 31 December 2015 (2014: HK$1,188 million), the Group’s attributable share of the underlying post-tax profits less losses of joint ventures for the year ended 31 December 2015 amounted to HK$1,239 million (2014: HK$1,469 million), representing a decrease of HK$230 million, or 16%, from that for the corresponding year ended 31 December 2014. Such year-on-year decrease in the underlying post-tax profits was mainly attributable to the decrease in the Group’s attributable share of post-tax profit contribution from property sales of the joint venture property development projects of “Mount Parker Residences” in Hong Kong as well as “La Botanica”, Xian and “Chengdu ICC” in mainland China, in the aggregate amount of HK$270 million. Finance costs Finance costs (comprising interest expense and other borrowing costs) recognised as expenses for the year ended 31 December 2015 were HK$842 million (2014: HK$859 million). Finance costs before interest capitalisation for the year ended 31 December 2015 were HK$1,795 million (2014: HK$2,021 million). During the year ended 31 December 2015, the Group’s effective borrowing rate was approximately 3.69% per annum (2014: approximately 4.0% per annum). Revaluation of investment properties and investment properties under development The Group recognised an increase in fair value on its investment properties and investment properties under development (before deferred taxation and non-controlling interests) of HK$7,310 million in the consolidated statement of profit or loss for the year ended 31 December 2015 (2014: HK$5,538 million).
73
Financial resources and liquidity Medium Term Note Programme At 31 December 2015, the aggregate carrying amount of notes guaranteed by the Company and issued under the Group’s Medium Term Note Programme established on 30 August 2011 and which remained outstanding was HK$10,202 million (2014: HK$10,420 million), with tenures of between four years and twenty years (2014: between four years and twenty years). These notes are included in the Group’s bank and other borrowings at 31 December 2015 as referred to in the paragraph “Maturity profile and interest cover” below. Maturity profile and interest cover The maturity profile of the total debt, the cash and bank balances and the gearing ratio of the Group were as follows: At 31 December At 31 December 2015 2014 HK$ million HK$ million Bank and other borrowings repayable: - Within 1 year 12,408 13,590 - After 1 year but within 2 years 8,454 6,940 - After 2 years but within 5 years 28,389 20,512 - After 5 years 1,660 1,660 Amount due to a fellow subsidiary 1,185 5,021 Total debt 52,096 47,723 Less: Cash and bank balances
(11,779)
(10,303)
Net debt 40,317 37,420 Shareholders’ funds 251,247 238,150 Gearing ratio (%) 16.0% 15.7% At 31 December 2015, after taking into account the effect of swap contracts designated as cash flow hedging instruments, 54% (2014: 60%) of the Group’s total debt carried fixed interest rates. Gearing ratio is calculated based on the net debt and shareholders’ funds of the Group at the end of the reporting period.
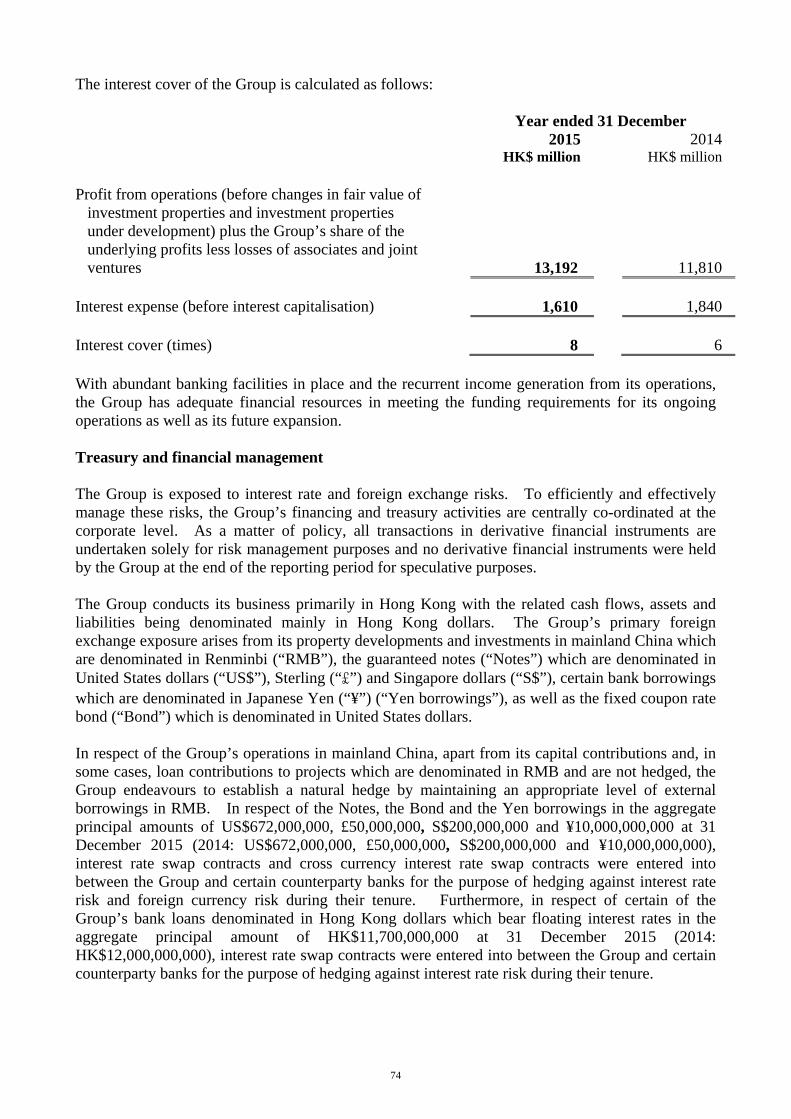
74
The interest cover of the Group is calculated as follows: Year ended 31 December 2015 2014 HK$ million HK$ million Profit from operations (before changes in fair value of
investment properties and investment properties under development) plus the Group’s share of the underlying profits less losses of associates and joint ventures
13,192
11,810 Interest expense (before interest capitalisation) 1,610 1,840 Interest cover (times) 8 6 With abundant banking facilities in place and the recurrent income generation from its operations, the Group has adequate financial resources in meeting the funding requirements for its ongoing operations as well as its future expansion. Treasury and financial management The Group is exposed to interest rate and foreign exchange risks. To efficiently and effectively manage these risks, the Group’s financing and treasury activities are centrally co-ordinated at the corporate level. As a matter of policy, all transactions in derivative financial instruments are undertaken solely for risk management purposes and no derivative financial instruments were held by the Group at the end of the reporting period for speculative purposes. The Group conducts its business primarily in Hong Kong with the related cash flows, assets and liabilities being denominated mainly in Hong Kong dollars. The Group’s primary foreign exchange exposure arises from its property developments and investments in mainland China which are denominated in Renminbi (“RMB”), the guaranteed notes (“Notes”) which are denominated in United States dollars (“US$”), Sterling (“£”) and Singapore dollars (“S$”), certain bank borrowings which are denominated in Japanese Yen (“¥”) (“Yen borrowings”), as well as the fixed coupon rate bond (“Bond”) which is denominated in United States dollars. In respect of the Group’s operations in mainland China, apart from its capital contributions and, in some cases, loan contributions to projects which are denominated in RMB and are not hedged, the Group endeavours to establish a natural hedge by maintaining an appropriate level of external borrowings in RMB. In respect of the Notes, the Bond and the Yen borrowings in the aggregate principal amounts of US$672,000,000, £50,000,000, S$200,000,000 and ¥10,000,000,000 at 31 December 2015 (2014: US$672,000,000, £50,000,000, S$200,000,000 and ¥10,000,000,000), interest rate swap contracts and cross currency interest rate swap contracts were entered into between the Group and certain counterparty banks for the purpose of hedging against interest rate risk and foreign currency risk during their tenure. Furthermore, in respect of certain of the Group’s bank loans denominated in Hong Kong dollars which bear floating interest rates in the aggregate principal amount of HK$11,700,000,000 at 31 December 2015 (2014: HK$12,000,000,000), interest rate swap contracts were entered into between the Group and certain counterparty banks for the purpose of hedging against interest rate risk during their tenure.
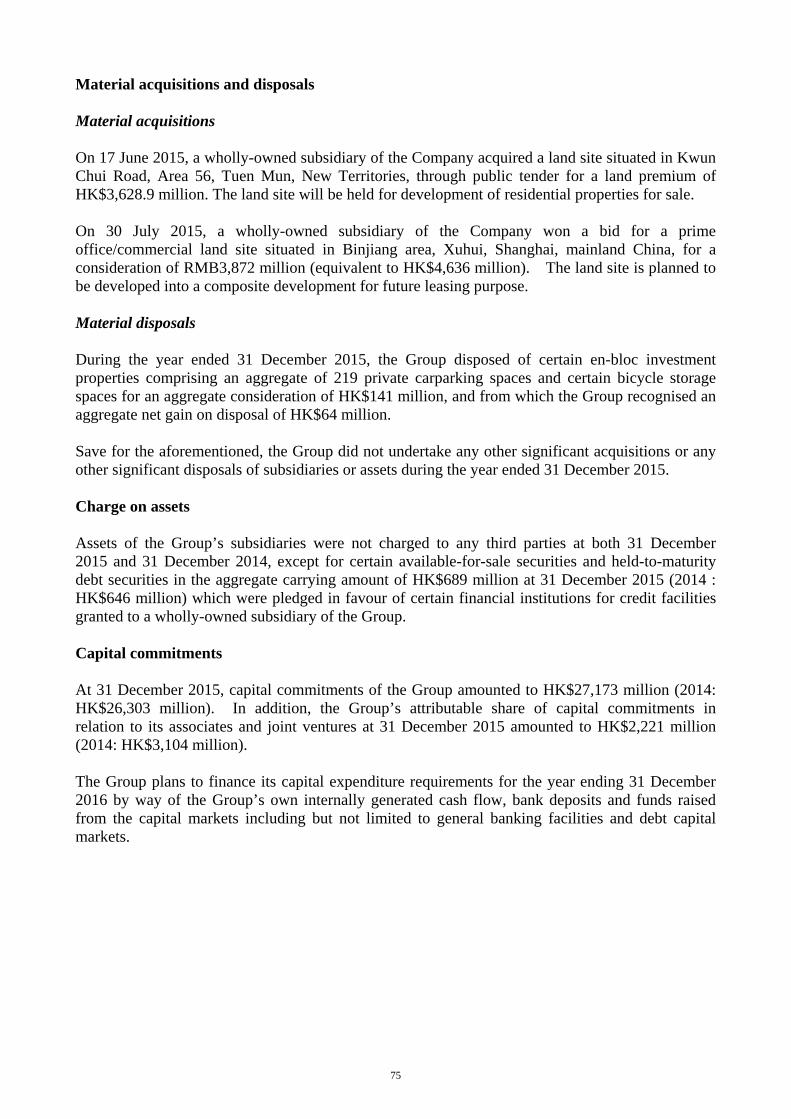
75
Material acquisitions and disposals Material acquisitions On 17 June 2015, a wholly-owned subsidiary of the Company acquired a land site situated in Kwun Chui Road, Area 56, Tuen Mun, New Territories, through public tender for a land premium of HK$3,628.9 million. The land site will be held for development of residential properties for sale. On 30 July 2015, a wholly-owned subsidiary of the Company won a bid for a prime office/commercial land site situated in Binjiang area, Xuhui, Shanghai, mainland China, for a consideration of RMB3,872 million (equivalent to HK$4,636 million). The land site is planned to be developed into a composite development for future leasing purpose. Material disposals During the year ended 31 December 2015, the Group disposed of certain en-bloc investment properties comprising an aggregate of 219 private carparking spaces and certain bicycle storage spaces for an aggregate consideration of HK$141 million, and from which the Group recognised an aggregate net gain on disposal of HK$64 million. Save for the aforementioned, the Group did not undertake any other significant acquisitions or any other significant disposals of subsidiaries or assets during the year ended 31 December 2015. Charge on assets Assets of the Group’s subsidiaries were not charged to any third parties at both 31 December 2015 and 31 December 2014, except for certain available-for-sale securities and held-to-maturity debt securities in the aggregate carrying amount of HK$689 million at 31 December 2015 (2014 : HK$646 million) which were pledged in favour of certain financial institutions for credit facilities granted to a wholly-owned subsidiary of the Group. Capital commitments At 31 December 2015, capital commitments of the Group amounted to HK$27,173 million (2014: HK$26,303 million). In addition, the Group’s attributable share of capital commitments in relation to its associates and joint ventures at 31 December 2015 amounted to HK$2,221 million (2014: HK$3,104 million). The Group plans to finance its capital expenditure requirements for the year ending 31 December 2016 by way of the Group’s own internally generated cash flow, bank deposits and funds raised from the capital markets including but not limited to general banking facilities and debt capital markets.
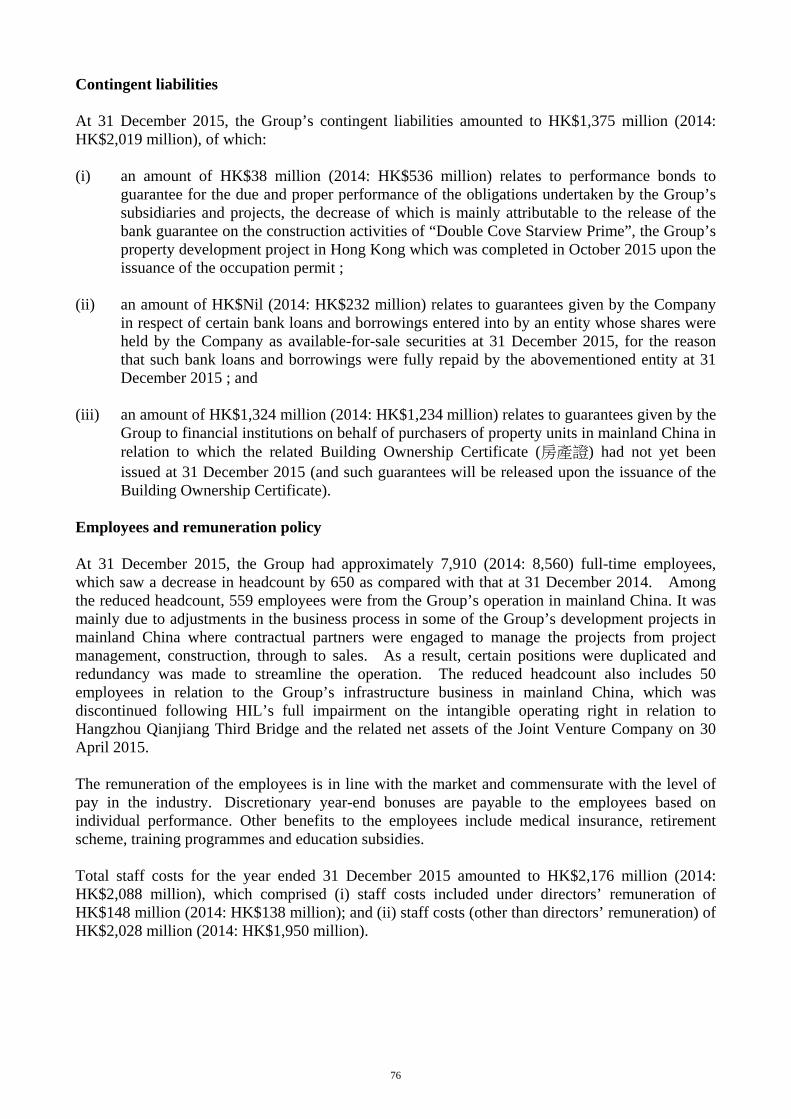
76
Contingent liabilities At 31 December 2015, the Group’s contingent liabilities amounted to HK$1,375 million (2014: HK$2,019 million), of which: (i) an amount of HK$38 million (2014: HK$536 million) relates to performance bonds to
guarantee for the due and proper performance of the obligations undertaken by the Group’s subsidiaries and projects, the decrease of which is mainly attributable to the release of the bank guarantee on the construction activities of “Double Cove Starview Prime”, the Group’s property development project in Hong Kong which was completed in October 2015 upon the issuance of the occupation permit ;
(ii) an amount of HK$Nil (2014: HK$232 million) relates to guarantees given by the Company
in respect of certain bank loans and borrowings entered into by an entity whose shares were held by the Company as available-for-sale securities at 31 December 2015, for the reason that such bank loans and borrowings were fully repaid by the abovementioned entity at 31 December 2015 ; and
(iii) an amount of HK$1,324 million (2014: HK$1,234 million) relates to guarantees given by the
Group to financial institutions on behalf of purchasers of property units in mainland China in relation to which the related Building Ownership Certificate (房產證) had not yet been issued at 31 December 2015 (and such guarantees will be released upon the issuance of the Building Ownership Certificate).
Employees and remuneration policy At 31 December 2015, the Group had approximately 7,910 (2014: 8,560) full-time employees, which saw a decrease in headcount by 650 as compared with that at 31 December 2014. Among the reduced headcount, 559 employees were from the Group’s operation in mainland China. It was mainly due to adjustments in the business process in some of the Group’s development projects in mainland China where contractual partners were engaged to manage the projects from project management, construction, through to sales. As a result, certain positions were duplicated and redundancy was made to streamline the operation. The reduced headcount also includes 50 employees in relation to the Group’s infrastructure business in mainland China, which was discontinued following HIL’s full impairment on the intangible operating right in relation to Hangzhou Qianjiang Third Bridge and the related net assets of the Joint Venture Company on 30 April 2015. The remuneration of the employees is in line with the market and commensurate with the level of pay in the industry. Discretionary year-end bonuses are payable to the employees based on individual performance. Other benefits to the employees include medical insurance, retirement scheme, training programmes and education subsidies. Total staff costs for the year ended 31 December 2015 amounted to HK$2,176 million (2014: HK$2,088 million), which comprised (i) staff costs included under directors’ remuneration of HK$148 million (2014: HK$138 million); and (ii) staff costs (other than directors’ remuneration) of HK$2,028 million (2014: HK$1,950 million).
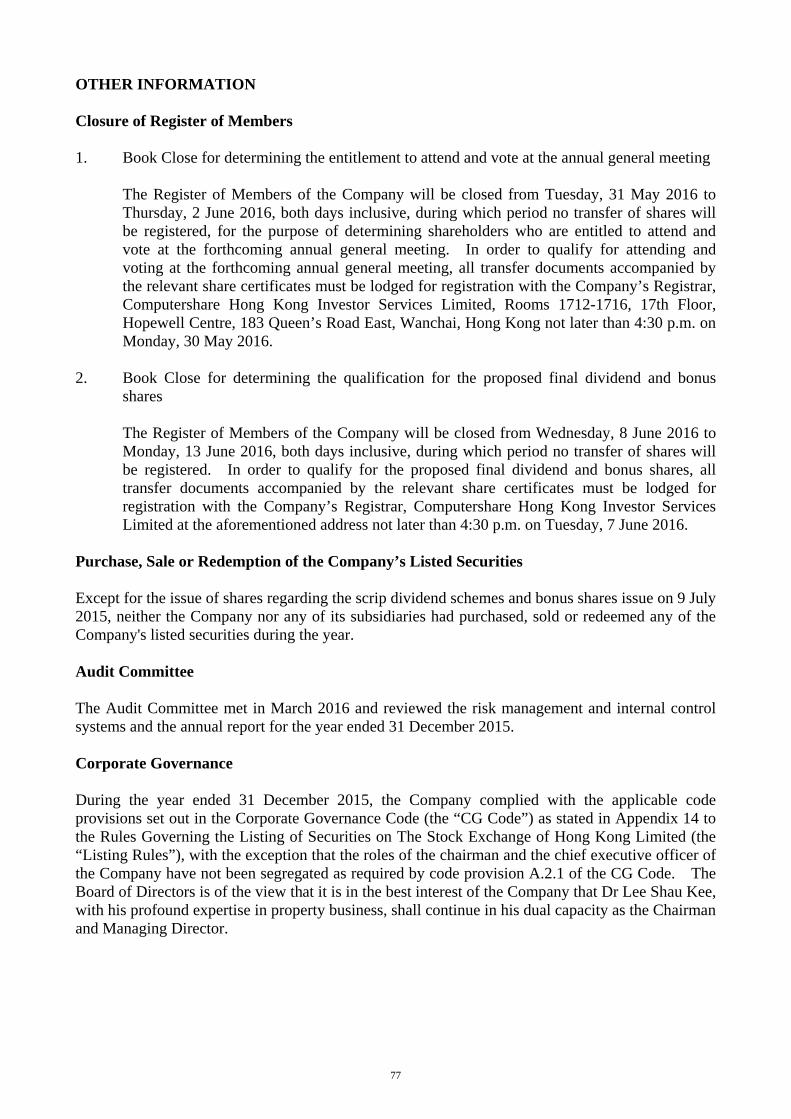
77
OTHER INFORMATION Closure of Register of Members 1. Book Close for determining the entitlement to attend and vote at the annual general meeting The Register of Members of the Company will be closed from Tuesday, 31 May 2016 to
Thursday, 2 June 2016, both days inclusive, during which period no transfer of shares will be registered, for the purpose of determining shareholders who are entitled to attend and vote at the forthcoming annual general meeting. In order to qualify for attending and voting at the forthcoming annual general meeting, all transfer documents accompanied by the relevant share certificates must be lodged for registration with the Company’s Registrar, Computershare Hong Kong Investor Services Limited, Rooms 1712-1716, 17th Floor, Hopewell Centre, 183 Queen’s Road East, Wanchai, Hong Kong not later than 4:30 p.m. on Monday, 30 May 2016.
2. Book Close for determining the qualification for the proposed final dividend and bonus
shares The Register of Members of the Company will be closed from Wednesday, 8 June 2016 to
Monday, 13 June 2016, both days inclusive, during which period no transfer of shares will be registered. In order to qualify for the proposed final dividend and bonus shares, all transfer documents accompanied by the relevant share certificates must be lodged for registration with the Company’s Registrar, Computershare Hong Kong Investor Services Limited at the aforementioned address not later than 4:30 p.m. on Tuesday, 7 June 2016.
Purchase, Sale or Redemption of the Company’s Listed Securities Except for the issue of shares regarding the scrip dividend schemes and bonus shares issue on 9 July 2015, neither the Company nor any of its subsidiaries had purchased, sold or redeemed any of the Company's listed securities during the year. Audit Committee The Audit Committee met in March 2016 and reviewed the risk management and internal control systems and the annual report for the year ended 31 December 2015. Corporate Governance During the year ended 31 December 2015, the Company complied with the applicable code provisions set out in the Corporate Governance Code (the “CG Code”) as stated in Appendix 14 to the Rules Governing the Listing of Securities on The Stock Exchange of Hong Kong Limited (the “Listing Rules”), with the exception that the roles of the chairman and the chief executive officer of the Company have not been segregated as required by code provision A.2.1 of the CG Code. The Board of Directors is of the view that it is in the best interest of the Company that Dr Lee Shau Kee, with his profound expertise in property business, shall continue in his dual capacity as the Chairman and Managing Director.
78
Model Code for Securities Transactions by Directors The Company has adopted the Model Code of the Listing Rules as the code for dealing in securities of the Company by the Directors (the “Model Code”). Having made specific enquiry, the Company confirmed that all Directors have complied with the required standard as set out in the Model Code. Forward-Looking Statements This announcement contains certain statements that are forward-looking or which use certain forward-looking terminologies. These forward-looking statements are based on the current beliefs, assumptions and expectations of the Board of Directors of the Company regarding the industry and markets in which it operates. These forward-looking statements are subject to risks, uncertainties and other factors beyond the Company’s control which may cause actual results or performance to differ materially from those expressed or implied in such forward-looking statements. By Order of the Board Timon LIU Cheung Yuen Company Secretary Hong Kong, 21 March 2016 As at the date of this announcement, the Board comprises: (1) executive directors: Lee Shau Kee (Chairman), Lee Ka Kit, Lam Ko Yin, Colin, Lee Ka Shing, Yip Ying Chee, John, Suen Kwok Lam, Lee King Yue, Fung Lee Woon King, Lau Yum Chuen, Eddie, Kwok Ping Ho and Wong Ho Ming, Augustine; (2) non-executive directors: Lee Pui Ling, Angelina and Lee Tat Man; and (3) independent non-executive directors: Kwong Che Keung, Gordon, Ko Ping Keung, Wu King Cheong, Woo Ka Biu, Jackson, Leung Hay Man, Poon Chung Kwong and Chung Shui Ming, Timpson.