79. profile on the production of inner tubes...
TRANSCRIPT

79. PROFILE ON THE PRODUCTION OF INNER
TUBES AND TIRE
79-1
TABLE OF CONTENTS
PAGE
I. SUMMARY 79-2
II. PRODUCT DESCRIPTION & APPLICATION 79-3
III. MARKET STUDY AND PLANT CAPACITY 79-3
A. MARKET STUDY 79-3
B. PLANT CAPACITY & PRODUCTION PROGRAM 79-6
IV. MATERIALS AND INPUTS 79-7
A. RAW & AUXILIARY MATERIALS 79-7
B. UTILITIES 79-8
V. TECHNOLOGY & ENGINEERING 79-8
A. TECHNOLOGY 79-8
B. ENGINEERING 79-10
VI. HUMAN RESOURCE & TRAINING REQUIREMENT 79-14
A. HUMAN RESOURCE REQUIREMENT 79-14
B. TRAINING REQUIREMENT 79-15
VII. FINANCIAL ANLYSIS 79-15
A. TOTAL INITIAL INVESTMENT COST 79-15
B. PRODUCTION COST 79-17
C. FINANCIAL EVALUATION 79-18
D. ECONOMIC & SOCIAL BENEFITS 79-20

79-2
I. SUMMARY
This profile envisages the establishment of a plant for the production of inner tubes and tire with
a capacity of 220,000 pieces (equivalent of 30,000 tons) of tires and 220,000 pieces (equivalent
of 1,000 tons) of inner tubes per annum. A tire is a ring-shaped covering that fits around a wheel
rim to protect it and enable better vehicle performance by providing a flexible cushion that
absorbs shock while keeping the wheel in close contact with the ground and inner tubes are
flexible, airtight hollow rings, usually made of rubber, which is inserted into the casing of a
pneumatic tire for holding compressed air.
The demand for inner tubes and tires in Ethiopia is met through both domestic production and
import. The present (2012) demand for tire and inner tubes is estimated at 803,682 pieces and
570,791 pieces respectively. The demand for tire and inner tubes is projected to reach 1,180,872
pieces and 838,679 pieces by the year 2017 and 1,735,088 pieces and 1,232,295 pieces by the
year 2022, respectively.
The principal raw materials required are synthetic rubber, carbon black, cord and accelerator
which have to be imported.
The total investment cost of the project including working capital is estimated at Birr 480.49
million. From the total investment cost, the highest share (Birr 341.74 million or 71.12%) is
accounted by fixed investment cost followed by initial working capital (Birr 97.66 million or
20.33%) and pre operation cost (Birr 41.07 million or 8.55%). From the total investment cost
Birr 258.02 million or 53.70% is required in foreign currency.
The project is financially viable with an internal rate of return (IRR) of 18.14% and a net present
value (NPV) of Birr 195.39 million discounted at 10%.
The project can create employment for 226 persons. The establishment of such factory will have
a foreign exchange saving effect to the country by substituting the current imports. The project
will also generate income for the Government in terms of tax revenue and payroll tax.

79-3
II. PRODUCT DESCRIPTION AND APPLICATION
A tire is a ring-shaped covering that fits around a wheel rim to protect it and enable better
vehicle performance by providing a flexible cushion that absorbs shock while keeping the wheel
in close contact with the ground. The fundamental materials of modern tires are synthetic rubber,
natural rubber, fabric and wire, along with other compound chemicals. They consist of a tread
and a body. The tread provides traction while the body ensures support. Before rubber was
invented, the first versions of tires were simply bands of metal that fitted around wooden wheels
to prevent wear and tear. Today, the vast majority of tires is pneumatic inflatable structures,
comprising a doughnut-shaped body of cords and wires encased in rubber and generally filled
with compressed air to form an inflatable cushion. Pneumatic tires are used on many types of
vehicles, such as cars, bicycles, motorcycles, trucks, earthmovers, and aircraft.
Inner tubes are flexible, airtight hollow rings, usually made of rubber, which is inserted into the
casing of a pneumatic tire for holding compressed air.
III. MARKET STUDY AND PLANT CAPACITY
A. MARKET STUDY
1. Past Supply and Present Demand
The demand for vehicle tires and tubes in Ethiopia is met through both domestic production and
imports. The only tire manufacturing plant in the country is Matador-Addis, which used to be
known as Addis Tire S.C before the joint venture arrangement with Slovak Matador in April
2004. On the other hand the country also imports a substantial amount of different types of
vehicle tires from various countries. Accordingly, data on local production and imports of rubber
tires and tubes is shown in Table 3.1.
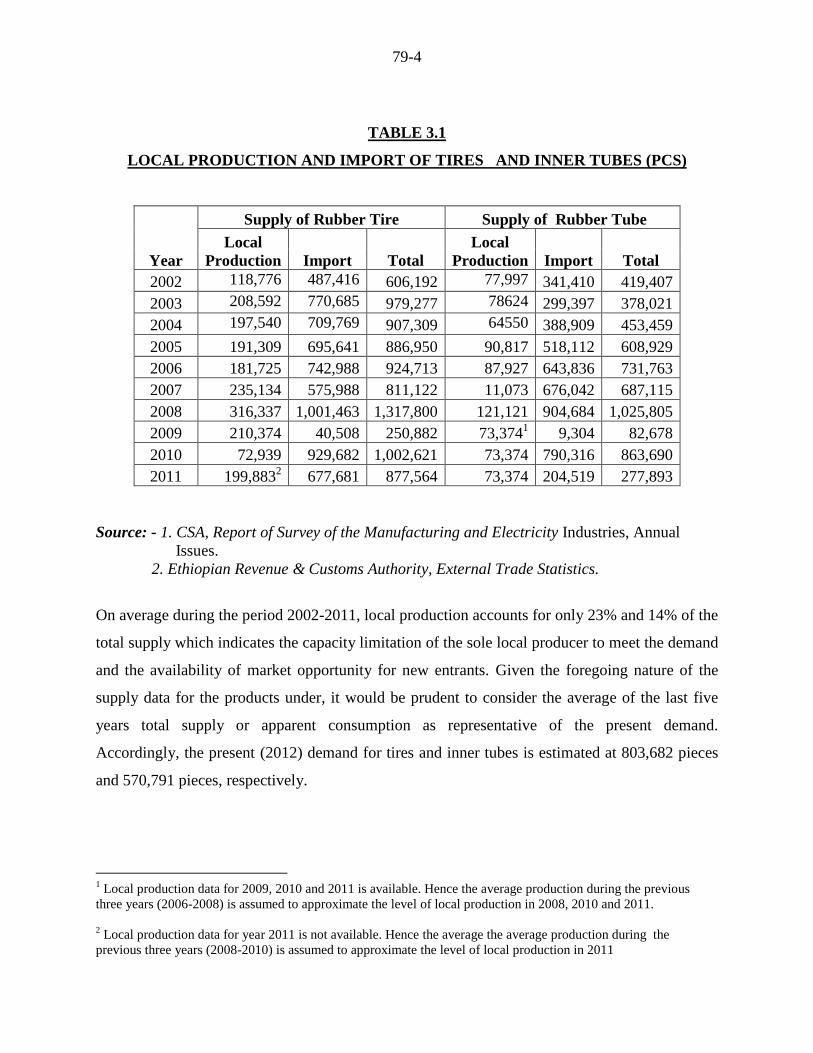
As can be seen from Table 3.1, the total supply for both tire and inner tubes fluctuates from
year to year with out a visible trend. The total supply of tire during the period under
consideration ranges from 1.31 million pieces in 2008 to 250,882 pieces in 2009. Similarly, the
total supply of inner tubes ranges from 1.02 million pieces in 2008 to 82,678 pieces in 2009.
79-4
TABLE 3.1
LOCAL PRODUCTION AND IMPORT OF TIRES AND INNER TUBES (PCS)
Year
Supply of Rubber Tire Supply of Rubber Tube
Local
Production Import Total
Local
Production Import Total
2002 118,776 487,416 606,192 77,997 341,410 419,407
2003 208,592 770,685 979,277 78624 299,397 378,021
2004 197,540 709,769 907,309 64550 388,909 453,459
2005 191,309 695,641 886,950 90,817 518,112 608,929
2006 181,725 742,988 924,713 87,927 643,836 731,763
2007 235,134 575,988 811,122 11,073 676,042 687,115
2008 316,337 1,001,463 1,317,800 121,121 904,684 1,025,805
2009 210,374 40,508 250,882 73,3741 9,304 82,678
2010 72,939 929,682 1,002,621 73,374 790,316 863,690
2011 199,8832 677,681 877,564 73,374 204,519 277,893
Source: - 1. CSA, Report of Survey of the Manufacturing and Electricity Industries, Annual
Issues.
2. Ethiopian Revenue & Customs Authority, External Trade Statistics.
On average during the period 2002-2011, local production accounts for only 23% and 14% of the
total supply which indicates the capacity limitation of the sole local producer to meet the demand
and the availability of market opportunity for new entrants. Given the foregoing nature of the
supply data for the products under, it would be prudent to consider the average of the last five
years total supply or apparent consumption as representative of the present demand.
Accordingly, the present (2012) demand for tires and inner tubes is estimated at 803,682 pieces
and 570,791 pieces, respectively.
1 Local production data for 2009, 2010 and 2011 is available. Hence the average production during the previous
three years (2006-2008) is assumed to approximate the level of local production in 2008, 2010 and 2011.
2 Local production data for year 2011 is not available. Hence the average the average production during the
previous three years (2008-2010) is assumed to approximate the level of local production in 2011

79-5
2. Demand Projection
The future demand for tuber tires and tubes depends on the growth of the fleet size of vehicles in
the country. Moreover, the rapid growth of the middle class in the country, the development and
expansion of road network coverage, the increase of freight and passenger transport companies,
and the growth of mechanized agriculture and industrialization of the country will create a
growing market for all kinds of tires: passenger car tires, off-the- road tires, industrial tires,
agricultural tires, truck, bus and trailer tires as well as motorcycle and bicycle tires.
The total number of inspected and registered vehicles in the country in 2000 was only 96,504.
This number has grown to 199,414 in 2010. During the period 2000--2010 the number of
operational vehicles has registered an average annual growth rate of 8.04%, accordingly, the
future demand for tires and inner tubes is assumed to annually increase at the rate of 8% (see
Table 3.2).
Table 3.2
FORECASTED DEMAND (PIECES)
Year
Projected Demand Existing Capacity Demand Supply Gap
Tire Inner
tubes Tire
Inner
tubes Tire
Inner
tubes
2013 867,976 616,454 500,000 150,000 367,976 466,454
2014 937,414 665,771 500,000 150,000 437,414 515,771
2015 1,012,407 719,032 500,000 150,000 512,407 569,032
2016 1,093,400 776,555 500,000 150,000 593,400 626,555
2017 1,180,872 838,679 500,000 150,000 680,872 688,679
2018 1,275,342 905,774 500,000 150,000 775,342 755,774
2019 1,377,369 978,236 500,000 150,000 877,369 828,236
2020 1,487,558 1,056,495 500,000 150,000 987,558 906,495
2021 1,606,563 1,141,014 500,000 150,000 1,106,563 991,014
2022 1,735,088 1,232,295 500,000 150,000 1,235,088 1,082,295
2023 1,873,895 1,330,879 500,000 150,000 1,373,895 1,180,879
2024 2,023,807 1,437,349 500,000 150,000 1,523,807 1,287,349
2025 2,185,711 1,552,337 500,000 150,000 1,685,711 1,402,337

79-6
3. Pricing and Distribution
The price of tires and inner tubes varies according to size and origin. For the purpose of
financial analyses based on current market price for the products an average factory -get price of
Birr 2,000 for a tire including inner tubes is adopted.
B. PLANT CAPACITY & PRODUCTION PROGRAM
1. Plant Capacity
The production capacity of the envisaged plant is estimated to be 220,000 pieces( equivalent of
30,000 tons) of tiers and 220,000 pieces (equivalent of 1000 tons) of inner tubes based on 300
working days per annum and three shifts per day.
2. Production Program
Table 4.1 indicates the production program of the project. At the initial stage of production, the
project may require some years to penetrate the market. Therefore, in the first and second year
of production the capacity utilization rate will be 65% and 85%, respectively. In the third year
and onwards, full capacity production shall be attained.
Table 4.1
PRODUCTION PROGRAM
Product
Production Year
1 2 3rd
and above
Tire s (pcs) 143,000 187,000 220,000
Inner Tubes (pcs) 143,000 187,000 220,000
Capacity Utilization Rate (%) 65 85 100
79-7
IV. MATERIALS AND INPUTS
A. RAW & AUXILIARY MATERIALS
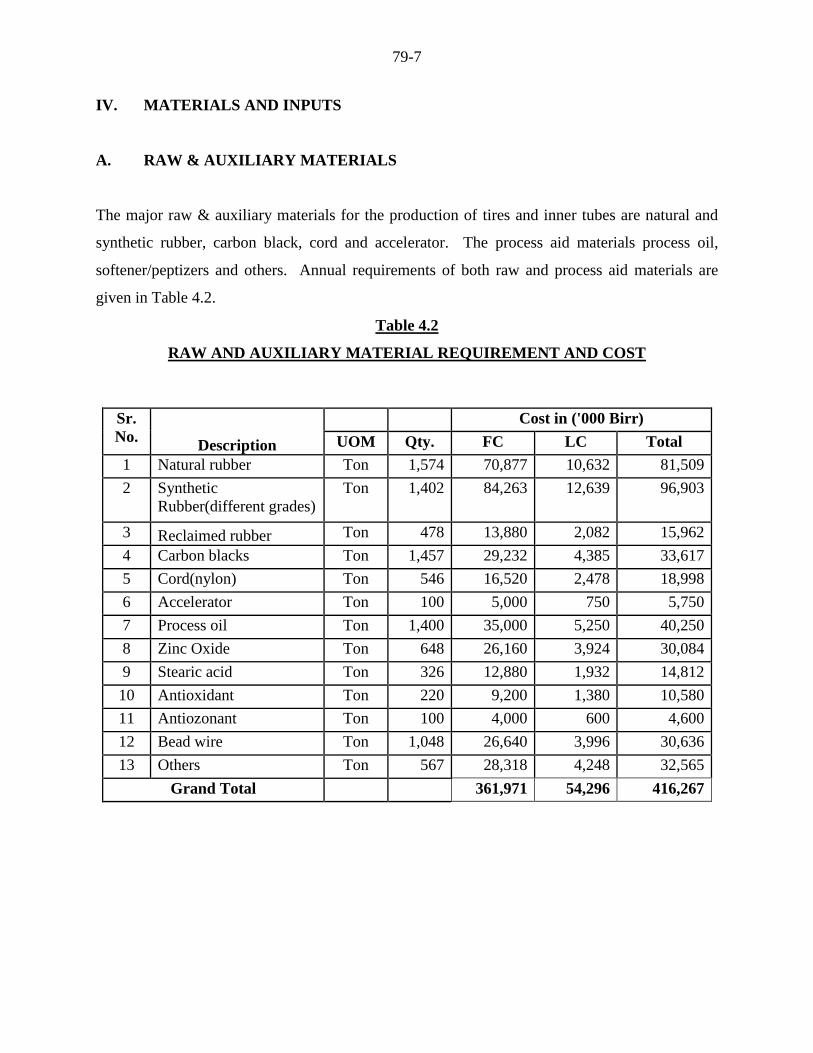
The major raw & auxiliary materials for the production of tires and inner tubes are natural and
synthetic rubber, carbon black, cord and accelerator. The process aid materials process oil,
softener/peptizers and others. Annual requirements of both raw and process aid materials are
given in Table 4.2.
Table 4.2
RAW AND AUXILIARY MATERIAL REQUIREMENT AND COST
Sr.
No. Description
Cost in ('000 Birr)
UOM Qty. FC LC Total
1 Natural rubber Ton 1,574 70,877 10,632 81,509
2 Synthetic
Rubber(different grades)
Ton 1,402 84,263 12,639 96,903
3 Reclaimed rubber Ton 478 13,880 2,082 15,962
4 Carbon blacks Ton 1,457 29,232 4,385 33,617
5 Cord(nylon) Ton 546 16,520 2,478 18,998
6 Accelerator Ton 100 5,000 750 5,750
7 Process oil Ton 1,400 35,000 5,250 40,250
8 Zinc Oxide Ton 648 26,160 3,924 30,084
9 Stearic acid Ton 326 12,880 1,932 14,812
10 Antioxidant Ton 220 9,200 1,380 10,580
11 Antiozonant Ton 100 4,000 600 4,600
12 Bead wire Ton 1,048 26,640 3,996 30,636
13 Others Ton 567 28,318 4,248 32,565
Grand Total 361,971 54,296 416,267

79-8
B. UTILITIES
Major utilities of the project are electricity and water. Annual cost of utilities is Birr 4.6 million.
Annual consumption of utilities and cost at full capacity operation is as indicated in Table 4.2.
Table 4.2
ANNUAL UTILITIES REQUIRMENT AND COST
Utilities UOM Qty. Cost
(`000 Birr)
Electrical Energy kWh 5,010,000 3,006
Water m3 160,000 1,600
Total 4,606
V. TECHNOLOGY AND ENGINEERING
A. TECHNOLOGY
1. Production Process
The envisaged plant assumes the production of conventional/or diagonal tires with the
production size range of the following: passenger cars (PC), light truck (LT) and Tire and Bus
(TB) tires.
The manufacturing process of tire can be broadly be classified into three stages, mixing
(compound preparation), building (assembling) and vulcanizing (curing) process
In mixing process the crude and synthetic rubber are weighed and masticated. Mixing takes
place in Ban bury mixer followed by an open mill dump roll for cooling and further dispersing
ingredients which may not fully homogenized during the mixing process in the mixer. The
mixing is taking place either in temperature or time base, the moment the mixed compound reach
the set time or temperature, the mixer discharge door opens automatically and dup the material to
the open mill.

79-9
The compounds prepared in this way, after insuring the required physical and mechanical
property parallel with the process test, are met as quality criteria, the materials released for
further process like for tread extruding, cord rubberizing, bead making, etc to prepare the semi
finished materials/or components of the tire for assembly.
The green tire is built-up as a cylinder on a collapsible, round rotating drum. Layers of cords
embedded in a proper compound are applied, one layer tying the heads together in one direction
and another layer in another direction. The heads – wire cables embedded in a tough, hard
rubber – are “stitched” to the tire by folding the end of the cord fabric over. The tire building
drum is collapsed, and the cylindrical tire removed and placed in a press.
Butyl made curing bladder, that resists high temperature and frequent fatigue is used as a media
holder for the curing of the inside part of the tire through which hot water or steam is circulating.
For the outside part of the tire the media is circulating between the curing press dome and the tire
mold through conduction heat transfer. The bladder is also help the green tire to get blown up
inside the tire and shape it to the cavity of the curing mold; the press mould is simultaneously
closed, and the tire becomes a doughnut. Heat is applied through the mould and by steam
inside the bag. After a timed cure at pre selected temperature, the tire is formed. The green tire
is inserted into Auto form curing press for an automatic vulcanization.
The tube operation more or less uses the same operation in which the compound come from
mixer will be extruded as hollow tube which is dusted both inside and outside and after cooling,
the tube cut to the length, extra dust will be de-dusted, valve is applied in specified location, the
green tube then spliced. After having adequate rest time the tube then pre-shaped to 85% of the
final tube through air in the forming ring and then inserted to the curing mold and then after
curing the tube will be inspected for any defect and released for warehouse for sale.

79-10
2. Environmental Impact Assessment
The envisaged plant will consider the incineration and disposing practice for packing materials
through which raw materials are imported. The cost of incineration unit is indicated with yhe list
of machinery and equipment in Table 5.1.
B. ENGINEERING
1. Machinery & Equipment
The list of machinery and equipment is indicated in Table 5.1. The total cost of machinery is
estimated at Birr 213,973 million, out of which Birr 178.311 is in foreign currency.
Table 5.1
MACHINERY AND EQUIPMENT REQUIREMENT&COST
Sr.
No. Description Qty.
Cost (‘000 Birr)
FC LC Total
1 Tire curing presses 12 31,030.0 31,030.0
2 Tire building machines 6 4,374.0 4,374.0
3 Bias Cutting Equipment(set) 1 486.0 486.0
4 Cord coating(three roll/four roll) calendar 1 24,300.0 24,300.0
5 Duplex Extruding Equipment with cooling
and racking system(set)
1
48,600.0
48,600.0
6 Beading making line Equipment(set) 1 3,645.0 3,645.0
7 Ban bury mixers of capacity 290(set) 3 84,300.0 84,300.0
8 Universal testing machine for endurance 1 8,505.0 8,505.0
9 Plunger testing machine 1 607.5 607.5
10 Laboratory equipments and testing m/c(set) 7,290.0 7,290.0
11 Boiler house with its treatment units 2 8,100.0 8,100.0
12 Inner tube processing line(set) 1 36,450.0 36,450.0
13 Incineration equipment set 340.0 340.0
Total FOB
258,027.5
258,028.0
Port handling, insurance, inland transport etc
(20% of FOB)
51,605.5 51,605.5
Grand Total
258,027.5 51,605.5 309,633.0
79-11
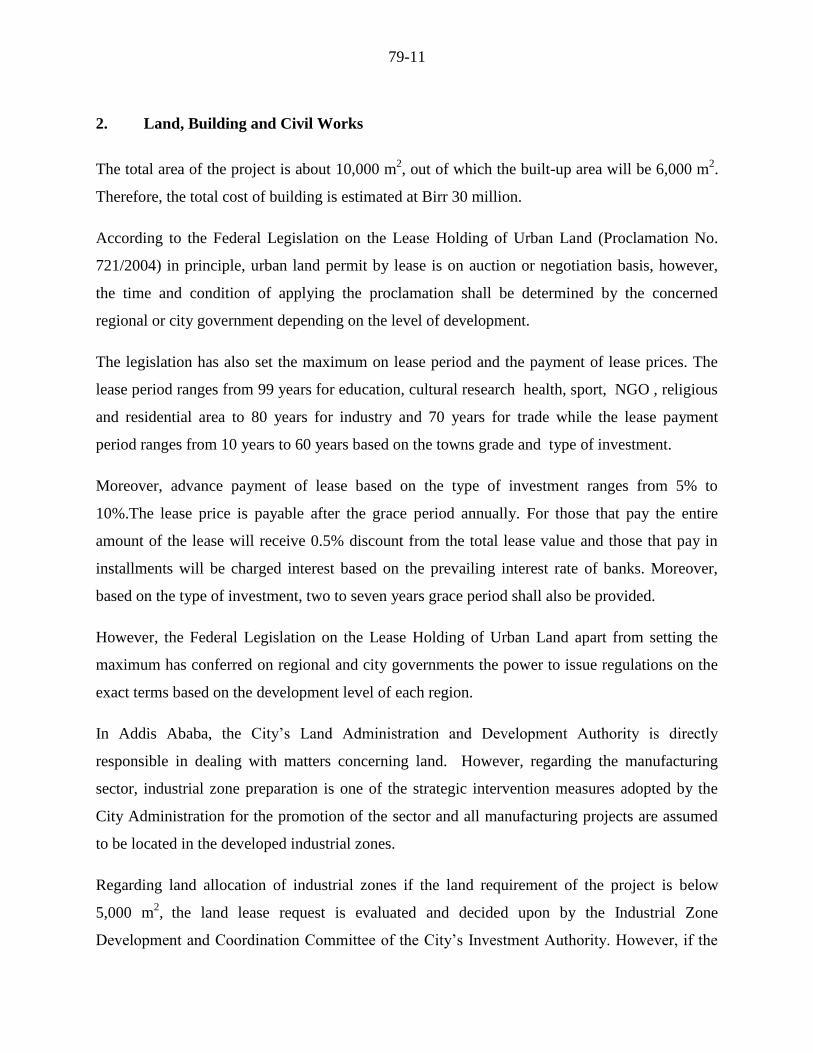
2. Land, Building and Civil Works
The total area of the project is about 10,000 m2, out of which the built-up area will be 6,000 m
2.
Therefore, the total cost of building is estimated at Birr 30 million.
According to the Federal Legislation on the Lease Holding of Urban Land (Proclamation No.
721/2004) in principle, urban land permit by lease is on auction or negotiation basis, however,
the time and condition of applying the proclamation shall be determined by the concerned
regional or city government depending on the level of development.
The legislation has also set the maximum on lease period and the payment of lease prices. The
lease period ranges from 99 years for education, cultural research health, sport, NGO , religious
and residential area to 80 years for industry and 70 years for trade while the lease payment
period ranges from 10 years to 60 years based on the towns grade and type of investment.
Moreover, advance payment of lease based on the type of investment ranges from 5% to
10%.The lease price is payable after the grace period annually. For those that pay the entire
amount of the lease will receive 0.5% discount from the total lease value and those that pay in
installments will be charged interest based on the prevailing interest rate of banks. Moreover,
based on the type of investment, two to seven years grace period shall also be provided.
However, the Federal Legislation on the Lease Holding of Urban Land apart from setting the
maximum has conferred on regional and city governments the power to issue regulations on the
exact terms based on the development level of each region.
In Addis Ababa, the City’s Land Administration and Development Authority is directly
responsible in dealing with matters concerning land. However, regarding the manufacturing
sector, industrial zone preparation is one of the strategic intervention measures adopted by the
City Administration for the promotion of the sector and all manufacturing projects are assumed
to be located in the developed industrial zones.
Regarding land allocation of industrial zones if the land requirement of the project is below
5,000 m2,
the land lease request is evaluated and decided upon by the Industrial Zone
Development and Coordination Committee of the City’s Investment Authority. However, if the

79-12
land request is above 5,000 m2, the request is evaluated by the City’s Investment Authority and
passed with recommendation to the Land Development and Administration Authority for
decision, while the lease price is the same for both cases.
Moreover, the Addis Ababa City Administration has recently adopted a new land lease floor
price for plots in the city. The new prices will be used as a benchmark for plots that are going to
be auctioned by the city government or transferred under the new “Urban Lands Lease Holding
Proclamation.”
The new regulation classified the city into three zones. The first Zone is Central Market District
Zone, which is classified in five levels and the floor land lease price ranges from Birr 1,686 to
Birr 894 per m2. The rate for Central Market District Zone will be applicable in most areas of the
city that are considered to be main business areas that entertain high level of business activities.
The second zone, Transitional Zone, will also have five levels and the floor land lease price
ranges from Birr 1,035 to Birr 555 per m2 .This zone includes places that are surrounding the city
and are occupied by mainly residential units and industries.
The last and the third zone, Expansion Zone, is classified into four levels and covers areas that
are considered to be in the outskirts of the city, where the city is expected to expand in the future.
The floor land lease price in the Expansion Zone ranges from Birr 355 to Birr 191 per m2
(see
Table 5.2).
Table 5.2
NEW LAND LEASE FLOOR PRICE FOR PLOTS IN ADDIS ABABA
Zone Level
Floor
Price/m2
Central Market
District
1st 1686
2nd
1535
3rd
1323
4th
1085
5th
894
Transitional zone
1st 1035
2nd
935
3rd
809
4th
685
5th
555

79-13
Zone Level
Floor
Price/m2
Expansion zone
1st 355
2nd
299
3rd
217
4th
191
Accordingly, in order to estimate the land lease cost of the project profiles it is assumed that all
new manufacturing projects will be located in industrial zones located in expansion zones.
Therefore, for the profile a land lease rate of Birr 266 per m2
which is equivalent to the average
floor price of plots located in expansion zone is adopted.
On the other hand, some of the investment incentives arranged by the Addis Ababa City
Administration on lease payment for industrial projects are granting longer grace period and
extending the lease payment period. The criterions are creation of job opportunity, foreign
exchange saving, investment capital and land utilization tendency etc. Accordingly, Table 5.3
shows incentives for lease payment.
Table 5.3
INCENTIVES FOR LEASE PAYMENT OF INDUSTRIAL PROJECTS
Scored Point
Grace
Period
Payment
Completion
Period
Down
Payment
Above 75% 5 Years 30 Years 10%
From 50 - 75% 5 Years 28 Years 10%
From 25 - 49% 4 Years 25 Years 10%
For the purpose of this project profile, the average i.e. five years grace period, 28 years payment
completion period and 10% down payment is used. The land lease period for industry is 60
years. Accordingly, the total land lease cost at a rate of Birr 266 per m2 is estimated at Birr
2,660,000 of which 10% or Birr 266,000 will be paid in advance. The remaining Birr 2,394,000
will be paid in equal installments with in 28 years i.e. Birr 85,500 annually.

79-14
VI. HUMANRESOURCE AND TRAINING REQUIREMENT
A. HUMANRESOURCE REQUIREMENT
Foe effective operation, the plant will require a total of 226 persons. The yearly cost of labor,
including employees benefit, is estimated at birr 6.33million. The detail human resource
requirement with the corresponding cost estimation is indicated in the Table 6.1.
Table 6.1
HUMANRESOURCE REQUIRMENT AND LABROR COST
Sr.
No. Description
Req. Salary
Monthly
(Birr)
Annual
Salary
No. (Birr)
1 General Manager 1 12,000 144,000
2 Secretary 5 1,800 108,000
3 Commercial Manager 1 8,000 96,000
4 Finance and Admin. Manager 1 8,000 96,000
5 Production & Technical Manager 1 9,000 108,000
6 Quality Assurance manager 1 8,000 96,000
7 Accountant 2 3,000 72,000
8 Clerks 3 1,200 43,200
9 Forman 11 2,500 330,000
10 Operators-skilled 128 1,800 2,764,800
11 Assistant Operators 30 1,200 432,000
12 Laborers 10 600 720,000
13 Technical crew 16 2,000 384,000
14 laboratory staffs 6 2,400 172,800
15 supporting staffs 10 3,000 360,000
Sub-total 226 64,500 5,278,800
Benefit (20%) 12900.00 1,055,760
Total 77,400.00 6,334,560

79-15
B. TRAINING REQUIRMENT
The tire technology is very sensitive and complicated engineering process that needs individuals
specialized in the field of the technology, mainly rubber formulation and compounding and tire
construction. This technology and knowhow transfer requires a minimum of one year for an
engineer or chemist having basic grounds of the preliminary technology. Such trainings are
carried out both abroad and local during the period of commissioning. An overall cost estimation
for such training per person reaches about Birr 250,000 and a total of Birr one million.
VII. FINANCIAL ANALYSIS
The financial analysis of the inner tubes and tire project is based on the data presented in the
previous chapters and the following assumptions:-
Construction period 1 year
Source of finance 30 % equity and 70% loan
Tax holidays 3 years
Bank interest 10%
Discount cash flow 10%
Accounts receivable 30 days
Raw material local 30 days
Raw material imported 120 days
Work in progress 1 day
Finished products 30 days
Cash in hand 5 days
Accounts payable 30 days
Repair and maintenance 5% of machinery cost
A. TOTAL INITIAL INVESTMENT COST
The total investment cost of the project including working capital is estimated at Birr 480.49
million (see Table 7.1). From the total investment cost ,the highest share (Birr 341.74 million or

79-16
71.12%) is accounted by fixed investment cost followed by initial working capital (Birr 97.66
million or 20.33%) and pre operation cost (Birr 41.07 million or 8.55%). From the total
investment cost Birr 258.02 million or 53.70% is required in foreign currency.
Table 7.1
INITIAL INVESTMENT COST ( ‘000 Birr)
Sr. No. Cost Items
Local
Cost
Foreign
Cost
Total
Cost
%
Share
1 Fixed investment
1.1 Land Lease 266.00 266.00 0.06
1.2 Building and civil work 30,000.00 30,000.00 6.24
1.3 Machinery and equipment 51,605.50 258,027.50 309,633.00 64.44
1.4 Vehicles 1,500.00 1,500.00 0.31
1.5 Office furniture and equipment 350.00 350.00 0.07
Sub- total 83,721.50 258,027.50 341,749.00 71.12
2 Pre operating cost *
2.1 Pre operating cost 9,638.99 9,638.99 2.01
2.2 Interest during construction 31,434.05 31,434.05 6.54
Sub -total 41,073.04 41,073.04 8.55
3 Working capital** 97,669.83 97,669.83 20.33
Grand Total 222,464.37 258,027.50 480,491.87 100
* N.B Pre operating cost include project implementation cost such as installation, startup,
commissioning, project engineering, project management etc and capitalized interest during
construction.
** The total working capital required at full capacity operation is Birr 139.51 million. However,
only the initial working capital of Birr 97.66 million during the first year of production is
assumed to be funded through external sources. During the remaining years the working
capital requirement will be financed by funds to be generated internally (for detail working
capital requirement see Appendix 7.A.1).

79-17
B. PRODUCTION COST
The annual production cost at full operation capacity is estimated at Birr 532.89 million (see
Table 7.2). The cost of raw material account for 78.11% of the production cost. The other major
components of the production cost are depreciation, financial cost and repair and maintenance
which account for 12.27%, 5.68% and 1.74%, respectively. The remaining 2.19% is the share of
utility, cost of marketing and distribution, labor overhead and administration cost. For detail
production cost see Appendix 7.A.2.
Table 7.2
ANNUAL PRODUCTION COST AT FULL CAPACITY (YEAR THREE)
Items Cost
(in 000 Birr) %
Raw Material and Inputs 416,267.00 78.11
Utilities 4,606.00 0.86
Maintenance and repair 9,289.00 1.74
Labor direct 5,279.00 0.99
Labor overheads 1,056.00 0.20
Administration Costs 250.00 0.05
Land lease cost - -
Cost of marketing and distribution 500.00 0.09
Total Operating Costs 437,247.00 82.05
Depreciation 65,389.40 12.27
Cost of Finance 30,255.27 5.68
Total Production Cost 532,891.67 100

79-18
C. FINANCIAL EVALUATION
1. Profitability
Based on the projected profit and loss statement, the project will generate a profit through out its
operation life. Annual net profit after tax will grow from Birr 13.38 million to Birr 78 million
during the life of the project. Moreover, at the end of the project life the accumulated net cash
flow amounts to Birr 603.07 million. For profit and loss statement and cash flow projection see
Appendix 7.A.3 and 7.A.4, respectively.
2. Ratios
In financial analysis, financial ratios and efficiency ratios are used as an index or yardstick for
evaluating the financial position of a firm. It is also an indicator for the strength and weakness of
the firm or a project. Using the year-end balance sheet figures and other relevant data, the most
important ratios such as return on sales which is computed by dividing net income by revenue,
return on assets (operating income divided by assets), return on equity (net profit divided by
equity) and return on total investment (net profit plus interest divided by total investment) has
been carried out over the period of the project life and all the results are found to be satisfactory.
3. Break-even Analysis
The break-even analysis establishes a relationship between operation costs and revenues. It
indicates the level at which costs and revenue are in equilibrium. To this end, the break-even
point for capacity utilization and sales value estimated by using income statement projection are
computed as followed.
Break -Even Sales Value = Fixed Cost + Financial Cost = Birr 319,984,185
Variable Margin ratio (%)
Break -Even Capacity utilization = Break -even Sales Value X 100 = 58%
Sales revenue

79-19
4. Pay-back Period
The pay- back period, also called pay – off period is defined as the period required for recovering
the original investment outlay through the accumulated net cash flows earned by the project.
Accordingly, based on the projected cash flow it is estimated that the project’s initial investment
will be fully recovered within 6 years.
5. Internal Rate of Return
The internal rate of return (IRR) is the annualized effective compounded return rate that can be
earned on the invested capital, i.e., the yield on the investment. Put another way, the internal rate
of return for an investment is the discount rate that makes the net present value of the
investment's income stream total to zero. It is an indicator of the efficiency or quality of an
investment. A project is a good investment proposition if its IRR is greater than the rate of return
that could be earned by alternate investments or putting the money in a bank account.
Accordingly, the IRR of this project is computed to be 18.14% indicating the viability of the
project.
6. Net Present Value
Net present value (NPV) is defined as the total present (discounted) value of a time series of cash
flows. NPV aggregates cash flows that occur during different periods of time during the life of a
project in to a common measuring unit i.e. present value. It is a standard method for using the
time value of money to appraise long-term projects. NPV is an indicator of how much value an
investment or project adds to the capital invested. In principle, a project is accepted if the NPV is
non-negative.
Accordingly, the net present value of the project at 10% discount rate is found to be Birr 195.39
million which is acceptable. For detail discounted cash flow see Appendix 7.A.5.

79-20
D. ECONOMIC AND SOCIAL BENEFITS
The project can create employment for 226 persons. The project will generate Birr 168.38
million in terms of tax revenue. The establishment of such factory will have a foreign exchange
saving effect to the country by substituting the current imports. The project will also generate
other income for the Government.

79-21
Appendix 7.A
FINANCIAL ANALYSES SUPPORTING TABLES

79-22
Appendix 7.A.1
NET WORKING CAPITAL ( in 000 Birr)
Items Year 2 Year 3 Year 4 Year 5 Year 6 Year 7 Year 8 Year 9 Year 10 Year 11
Total inventory 72,847 83,253 104,067 104,067 104,067 104,067 104,067 104,067 104,067 104,067
Accounts receivable 25,519 29,158 36,437 36,437 36,444 36,444 36,444 36,444 36,444 36,444
Cash-in-hand 154 176 220 220 222 222 222 222 222 222
CURRENT
ASSETS 98,520 112,588 140,724 140,724 140,733 140,733 140,733 140,733 140,733 140,733
Accounts payable 850 971 1,214 1,214 1,214 1,214 1,214 1,214 1,214 1,214
CURRENT
LIABILITIES 850 971 1,214 1,214 1,214 1,214 1,214 1,214 1,214 1,214
TOTAL
WORKING
CAPITAL 97,670 111,617 139,510 139,510 139,519 139,519 139,519 139,519 139,519 139,519

79-23
Appendix 7.A.2
PRODUCTION COST ( in 000 Birr)
Item Year 2 Year 3 Year 4 Year 5 Year 6 Year 7 Year 8 Year 9 Year 10 Year 11
Raw Material and Inputs 291,387 333,014 416,267 416,267 416,267 416,267 416,267 416,267 416,267 416,267
Utilities 3,224 3,685 4,606 4,606 4,606 4,606 4,606 4,606 4,606 4,606
Maintenance and repair 6,502 7,431 9,289 9,289 9,289 9,289 9,289 9,289 9,289 9,289
Labour direct 3,695 4,223 5,279 5,279 5,279 5,279 5,279 5,279 5,279 5,279
Labour overheads 739 845 1,056 1,056 1,056 1,056 1,056 1,056 1,056 1,056
Administration Costs 175 200 250 250 250 250 250 250 250 250
Land lease cost 0 0 0 0 86 86 86 86 86 86
Cost of marketing
and distribution 500 500 500 500 500 500 500 500 500 500
Total Operating Costs 306,223 349,898 437,247 437,247 437,333 437,333 437,333 437,333 437,333 437,333
Depreciation 65,389 65,389 65,389 65,389 65,389 1,235 1,235 1,235 1,235 1,235
Cost of Finance 0 34,577 30,255 25,933 21,611 17,289 12,967 8,644 4,322 0
Total Production Cost 371,612 449,864 532,892 528,569 524,333 455,856 451,534 447,212 442,890 438,568

79-24
Appendix 7.A.3
INCOME STATEMENT ( in 000 Birr)
Item Year 2 Year 3 Year 4 Year 5 Year 6 Year 7 Year 8 Year 9
Year
10
Year
11
Sales revenue 385,000 495,000 550,000 550,000 550,000 550,000 550,000 550,000 550,000 550,000
Less variable costs 305,723 349,398 436,747 436,747 436,747 436,747 436,747 436,747 436,747 436,747
VARIABLE MARGIN 79,277 145,602 113,253 113,253 113,253 113,253 113,253 113,253 113,253 113,253
in % of sales revenue 20.59 29.41 20.59 20.59 20.59 20.59 20.59 20.59 20.59 20.59
Less fixed costs 65,889 65,889 65,889 65,889 65,975 1,821 1,821 1,821 1,821 1,821
OPERATIONAL MARGIN 13,388 79,713 47,364 47,364 47,278 111,433 111,433 111,433 111,433 111,433
in % of sales revenue 3.48 16.10 8.61 8.61 8.60 20.26 20.26 20.26 20.26 20.26
Financial costs 34,577 30,255 25,933 21,611 17,289 12,967 8,644 4,322 0
GROSS PROFIT 13,388 45,136 17,108 21,431 25,667 94,144 98,466 102,788 107,110 111,433
in % of sales revenue 3.48 9.12 3.11 3.90 4.67 17.12 17.90 18.69 19.47 20.26
Income (corporate) tax 0 0 0 6,429 7,700 28,243 29,540 30,836 32,133 33,430
NET PROFIT 13,388 45,136 17,108 15,001 17,967 65,901 68,926 71,952 74,977 78,003
in % of sales revenue 3.48 9.12 3.11 2.73 3.27 11.98 12.53 13.08 13.63 14.18

79-25
Appendix 7.A.4
CASH FLOW FOR FINANCIAL MANAGEMENT ( in 000 Birr)
Item Year 1 Year 2 Year 3 Year 4 Year 5 Year 6 Year 7 Year 8 Year 9 Year 10 Year 11 Scrap
TOTAL CASH INFLOW 351,388 514,954 495,121 550,243 550,000 550,000 550,000 550,000 550,000 550,000 550,000 189,219
Inflow funds 351,388 129,954 121 243 0 0 0 0 0 0 0 0
Inflow operation 0 385,000 495,000 550,000 550,000 550,000 550,000 550,000 550,000 550,000 550,000 0
Other income 0 0 0 0 0 0 0 0 0 0 0 189,219
TOTAL CASH
OUTFLOW 351,388 436,177 441,765 538,861 512,831 509,874 526,086 523,061 520,035 517,010 470,762 0
Increase in fixed assets 351,388 0 0 0 0 0 0 0 0 0 0 0
Increase in current assets 0 98,520 14,068 28,137 0 8 0 0 0 0 0 0
Operating costs 0 305,723 349,398 436,747 436,747 436,833 436,833 436,833 436,833 436,833 436,833 0
Marketing and
Distribution cost 0 500 500 500 500 500 500 500 500 500 500 0
Income tax 0 0 0 0 6,429 7,700 28,243 29,540 30,836 32,133 33,430 0
Financial costs 0 31,434 34,577 30,255 25,933 21,611 17,289 12,967 8,644 4,322 0 0
Loan repayment 0 0 43,222 43,222 43,222 43,222 43,222 43,222 43,222 43,222 0 0
SURPLUS (DEFICIT) 0 78,777 53,356 11,382 37,169 40,126 23,914 26,939 29,965 32,990 79,238 189,219
CUMULATIVE CASH
BALANCE 0 78,777 132,133 143,516 180,684 220,811 244,725 271,664 301,629 334,619 413,857 603,076

79-26
Appendix 7.A.5
DISCOUNTED CASH FLOW ( in 000 Birr)
Item Year 1 Year 2 Year 3 Year 4 Year 5 Year 6 Year 7 Year 8 Year 9 Year 10 Year 11 Scrap
TOTAL CASH INFLOW 0 385,000 495,000 550,000 550,000 550,000 550,000 550,000 550,000 550,000 550,000 189,219
Inflow operation 0 385,000 495,000 550,000 550,000 550,000 550,000 550,000 550,000 550,000 550,000 0
Other income 0 0 0 0 0 0 0 0 0 0 0 189,219
TOTAL CASH OUTFLOW 449,058 320,170 377,791 437,247 443,684 445,033 465,576 466,872 468,169 469,466 470,762 0
Increase in fixed assets 351,388 0 0 0 0 0 0 0 0 0 0 0
Increase in net working
capital 97,670 13,947 27,894 0 8 0 0 0 0 0 0 0
Operating costs 0 305,723 349,398 436,747 436,747 436,833 436,833 436,833 436,833 436,833 436,833 0
Marketing and Distribution
cost 0 500 500 500 500 500 500 500 500 500 500 0
Income (corporate) tax 0 0 0 6,429 7,700 28,243 29,540 30,836 32,133 33,430 0
NET CASH FLOW -449,058 64,830 117,209 112,753 106,316 104,967 84,424 83,128 81,831 80,534 79,238 189,219
CUMULATIVE NET
CASH FLOW -449,058 -384,228 -267,019 -154,266 -47,950 57,017 141,441 224,569 306,400 386,934 466,172 655,391
Net present value -449,058 58,937 96,867 84,713 72,615 65,176 47,655 42,658 38,175 34,154 30,550 72,952
Cumulative net present value -449,058 -390,121 -293,255 -208,542 -135,927 -70,750 -23,095 19,563 57,737 91,892 122,442 195,394
NET PRESENT VALUE 195,394
INTERNAL RATE OF
RETURN 18.14%
NORMAL PAYBACK 6 years