darenmath1.weebly.comdarenmath1.weebly.com/.../1/5/3/9/15394680/f.if.4_(72).docx · web viewinstead...
TRANSCRIPT

F.IF.4 [578922]StudentClassDate
Read the following and answer the questions below:
Wendy's Novel
Wendy's NovelWendy wrote her first novel. Patrick, a publisher, helped her edit and publish the book through online retailers.
Patrick developed equations designed to model the revenue that he would receive from the sales of the novel and the costs that he would incur. The publisher’s share of the revenue, R dollars, is modeled by the equation
where n is the number of novels sold. The cost for Patrick to print the novel and release it to the market, C dollars, is modeled by the equation
Patrick gave Wendy two payment options for her novel. If she chose Option 1, she would receive a $1,000 payment immediately, and then she would earn $0.65 for each book sold. If she chose Option 2, she would receive no initial payment, but she would earn $1.05 for each book sold.
When Wendy’s book was released, the sales of the novel started off moderate, increased at a steady rate for the first week, and then decreased at a steady rate. The daily sales of Wendy’s novel, s, are modeled by the equation where x is the number of days since the book was released. For the first 21 days after the novel was released, Patrick’s model was accurate to within 3% of the book’s actual sales.
1. Read "Wendy's Novel" and answer the question.The table below shows the cost for Patrick to print the novel and release it to the market, based on different numbers of books printed at one time. Patrick's costs consist of one-time start-up expenses and materials
F.IF.4 Page 1/65

expenses per copy.Number of Books Printed Patrick's Cost
100 $2800200 $3000500 $3600
Based on the table, what are Patrick's start-up expenses?
A. $2
B. $15
C. $2600
D. $2602
2. Read "Wendy's Novel" and answer the questions.Rather than using an equation based on absolute value to model the daily sales of Wendy's novel, Patrick could have chosen to use a quadratic equation in the form of
Part AFind a quadratic equation that has a vertex at the same point as the maximum of Patrick's absolute value function, and the same y-intercept as the y-intercept of the absolute value function. Identify the coordinates for the vertex and y-intercept. Express the quadratic equation in standard form.Part BIdentify and approximate the roots of the quadratic equation to the nearest hundredth. Which root predicts the day after which Wendy's novel will no longer generate sales? Show your work, and explain your reasoning.
F.IF.4 Page 2/65

Read the following and answer the questions below:
The Mathematics of Beanbag Toss
The Mathematics of Beanbag TossWhat Is Beanbag Toss?In the past few years, a lawn game commonly called beanbag toss has seen a growth in popularity and recognition across the United States. In beanbag toss, players throw beanbags at an inclined platform in an attempt to get the beanbags to land on the platform or go through a hole in the platform. The game is typically played by four players at a time, with two teams of two players each, and continues until one of the teams reaches a certain score.The rules of the game are easy to learn, but tossing a beanbag so that it lands in the right spot can be challenging. The beanbag often slides off the slanted platform, so players practice tossing the beanbag into a high parabola. If the beanbag is thrown with too much velocity, it can land on the platform but then continue moving and slide off the top.
Beanbag Toss SetupTo play beanbag toss, two platforms and two different-colored sets of beanbags are needed. Many companies sell pre-made game sets that include all necessary materials. Instead of buying a set, a lot of people make their own platforms out of wood and paint them in their favorite colors or add logos
F.IF.4 Page 3/65

representing their college or favorite sports team.Beanbag toss platforms are 2 feet (ft) wide by 4 feet long and are angled so that the top is higher than the base. Each platform has a hole that is 6 inches (in.) in diameter. The center of the hole is 9 inches from the top of the platform and 12 inches from each edge. The platforms are typically 2 inches thick and have legs that fold out to make the top of the platform 12 inches tall.There are four beanbags in each set, and two sets are needed for each game. The beanbags are filled with beans, corn kernels, or other similar materials. Each is a square that is 5 to 6 inches wide and weighs between 12 and 16 ounces.
A typical beanbag toss court is set up so that the bases of the platforms are 27 feet apart and the holes are 33 feet apart at their closest point. The pitcher’s boxes are the areas next to each platform; the players stand in their pitcher’s box area when it is their turn to toss a beanbag, or pitch, onto the opposite platform. When pitching, players must stay behind the foul line formed by the base of the platform.
F.IF.4 Page 4/65

Rules and ScoringEach team has two players who stand across from each other instead of next to each other. Members of opposing teams stand next to the same platform. In each round, the first player tosses a beanbag at the opposite platform; the opposing team’s member then tosses a beanbag at that same platform. These two players alternate until they have each tossed all four of their beanbags. The score for the round is totaled; the next round begins when the other two players pick up the beanbags and toss them in the same alternating fashion.Depending on where it lands, each beanbag can earn 3, 1, or 0 points. Every beanbag that goes through the hole by the end of the round is worth 3 points. These points are awarded no matter how the beanbag falls into the hole; it can be tossed directly into the hole, land on the platform and slide into the hole, or land on the platform and be pushed into the hole by another beanbag that lands on the platform. If a beanbag lands on the platform but does not fall through the hole or slide off the platform by the end of the round, it is worth 1 point. No points are awarded for any beanbag that touches the ground before reaching the platform, that never reaches the platform, or that is thrown from closer than the foul line.To play a faster game, the point values can be added together until one team reaches 21 points. A longer and more common version of the game involves using cancellation scoring until one team reaches 21 points. In this version of
F.IF.4 Page 5/65

the game, only one team can earn points in each round, and the team with the higher score is awarded the difference in the scores for that round. For example, if Team 1 had two beanbags on the platform and one in the hole and Team 2 had one beanbag on the platform and none in the hole, Team 1 would earn 4 points. In that same round in the faster version of the game, Team 1 would earn 5 points and Team 2 would earn 1 point.There are many other scoring variations that can be used, such as playing to 25 points, requiring that a team wins by at least 2 points, or requiring a winning score of exactly 21 points and being penalized for going over 21 points.Beanbag toss can be played anywhere and by people of all ages. The combination of outdoor fun, competition with friends, and versatility is what attracts people to the game. Start a game of beanbag toss with your friends or family this weekend and find out which variation of the game you prefer.
3. Read "The Mathematics of Beanbag Toss" and answer the question.Matt was playing a game of beanbag toss. With his arm over the center of the platform, Matt pitched a beanbag and let it go as his hand first crossed the foul line. His beanbag followed the path modeled by the function
where x represents the horizontal distance (in feet) from the foul line and represents the beanbag’s height (in feet) off the ground. What does the x-intercept of this function represent in the context of the problem?
A. Matt let go of the beanbag when it was 4 feet off the ground.
B. Matt let go of the beanbag when it was between 1 and 2 feet off the ground.
C. The beanbag hit the ground 4 feet short of the platform for which Matt was aiming.
D. The beanbag hit the ground between 1 and 2 feet short of the platform for which Matt was aiming.
F.IF.4 Page 6/65

Read the following and answer the questions below:
Pollution Research
Pollution ResearchIn her environmental science class, Kaylie has been learning about air pollution. The teacher told the class that pollution occurs when chemicals and particles are released into the air we breathe. These pollutants can be very harmful to people and other living organisms in the environment.Several natural processes release pollutants. Most pollution is caused by human activities that release hazardous chemicals into the air through their exhaust: when cars run and burn gasoline, when factories use coal for fuel, or even when gas stoves are used to cook food. These chemicals, when exposed to sunlight, can react with other substances to form smog, which is the haze that is often seen surrounding large cities. Air pollution and smog are harmful to people’s health and to the environment. They have been known to aggravate asthma and respiratory disease as well as to cause acid rain.Kaylie is interested in learning more about what causes air pollution and what she can do to minimize it. She has noticed that the city she lives in has areas with more smog than others. She would like to know what chemicals are present in the air in this city. She goes to the local climate research center to get more information.At the research center, scientists inform Kaylie that the main source of pollution in the area is car exhaust from commuters traveling in and out of the city every day. Car exhaust produces a chemical known as nitrogen dioxide that can absorb light and eventually create pollutants. The scientists tell Kaylie that when nitrogen dioxide breaks down, it forms particles of oxygen that are different from the oxygen we breathe. These oxygen particles combine with other substances in the air to form pollutants. Kaylie realizes that when the nitrogen dioxide from car exhaust breaks down and decreases in amount, this means that oxygen particles, and therefore pollutants, are being formed and are increasing in amount.The scientists at the research center have been doing pollution experiments in their laboratories. They have been comparing the amount of nitrogen
F.IF.4 Page 7/65

dioxide that breaks down with the amount of oxygen particles formed. They do this by measuring the concentrations of these substances over short periods to see how they change. Concentrations are determined by finding the amount of a substance per unit volume. In this case, the scientists measured concentration in micrograms per cubic meter They let Kaylie look at the results from a recent investigation.
These results show how the concentration of nitrogen dioxide and oxygen particles changed in relation to one another over a period of 20 minutes. After looking at the results, Kaylie is convinced that nitrogen dioxide is harmful to the environment. She will remember her trip to the research center the next time she needs to go somewhere. Maybe she will try walking or riding her bike more often!
* Micrograms are very small units that are a fraction of a gram, so
4. Read "Pollution Research" and answer the questions.The formulas for exponential growth and decay are shown below.
F.IF.4 Page 8/65

In these formulas, represents the amount of a substance after a particular period of time, represents the initial amount of the substance, represents the growth or decay constant that is particular to the type of substance, and represents the time.
Part A. Using the information from the passage, write a function, that represents the growth or decay of nitrogen dioxide over time. The value of the constant, for nitrogen dioxide is 0.40. Time will be in minutes, and
the amount will be the concentration in Part B. Using the information from the passage, sketch a graph of the function, that represents the growth or decay of oxygen particles over
time. Plot time, in minutes, on the x-axis and concentration, in on the y-axis.
Part C. How are the graphs of and similar? Explain using descriptions of the graphs as increases.
5. Which of these statements best describes the function below?
F.IF.4 Page 9/65

A. is the axis of symmetry.
B. is the axis of symmetry.
C. The maximum value of is 0.
D. The minimum value of is 3.
6. A stream of water coming from a fountain creates a parabolic shape. The path of the water, after it leaves the spout of the fountain until it hits the ground, can be modeled using a quadratic function, h(x). The function h(x) is the vertical height of the water in feet when it is x feet horizontally away from the fountain. In the graph of the function h(x), where both axes are in feet, the maximum will occur at and the graph will intersect the x-axis at 4.
Sketch the graph of the function using the grid given. Use the appropriate scales on the x- and y-axes and be sure to label the graph.
Describe the maximum, in terms of the path of the water after it leaves
F.IF.4 Page 10/65

the spout of the fountain?
Use words, numbers, and/or pictures to show your work.
7. The total profit of a manufacturing company in thousands of dollars is modeled by the function where x represents the selling price of each product in dollars. Which graph best represents the total profit the company earns on different selling prices of its product?
A.
F.IF.4 Page 11/65

B.
C.
F.IF.4 Page 12/65

D.
8. A store on a college campus sells an average of 120 college sweatshirts per week. The cost of each sweatshirt is $32. It is observed that for each increase of $0.50 in the price of the sweatshirt, the average sales per week decreases by 4 shirts. Which graph represents the given situation if the x-axis represents the number of times the price increases by $0.50 and the y-axis represents the weekly revenue, in dollars, from the sweatshirts?
A.
F.IF.4 Page 13/65

B.
C.
F.IF.4 Page 14/65

D.
9. The height of a rocket, in feet, t seconds after it is launched is modeled by the function h(t) = –16t2 + 125t + 24. Which interval has the largest change in height?
A. 0–1 second
B. 3–4 seconds
C. 5–6 seconds
D. 7–8 seconds
10.During which interval is the graph of positive?
A. 1 < x < 5
B. 1 ≤ x ≤ 5
F.IF.4 Page 15/65

C. x < 1 and x > 5
D. x ≤ 1 and x ≥ 5
11. Henry examined the table that represents values satisfying the function shown below.
Based on the information in the table, which one of these key features is incorrect?
A. The y-intercept of the graph of the function is at
B. The maximum value of the function is 4.
C. A local minimum is located within the interval
D. A local maximum is located within the interval
F.IF.4 Page 16/65

12. The height of a rocket is modeled by h(t) = –(4t – 12)(4t – 36). How long after reaching its maximum height does it take for the rocket to hit the ground?
A. 3 seconds
B. 4.5 seconds
C. 7.5 seconds
D. 12 seconds
13. For what values of x is the function g(x) = –x2 + 7x – 10 negative?
A. 2 ≤ x ≤ 5
B. 2 < x < 5
C. x < 2 or x > 5
D. x ≤ 2 or x ≥ 5
14. A tank is being filled with water. The function represents the height of the water in the tank, in feet, based on x, the amount of time in hours.
Graph the function over a period of 5 hours on the coordinate plane below. Use appropriate scales on the x- and y-axes and be sure to
F.IF.4 Page 17/65
label the graph.
Is the function increasing or decreasing? What is the rate of change?
Use words, numbers, and/or pictures to show your work.
15. Use the function graphed on the coordinate plane below.
F.IF.4 Page 18/65

What are the intervals where the function is decreasing and increasing?
A. The function decreases from and increases from
B. The function decreases from and increases from
C. The function decreases from and increases from
D. The function decreases from and increases from
16. The water in a swimming pool is being drained. The function shown in the graph below represents the amount of water in gallons that remains in the pool after x minutes.
At what rate does the water drain?
A. 9 gallons per minute
B. 500 gallons per minute
F.IF.4 Page 19/65

C. 540 gallons per minute
D. 4,500 gallons per minute
17. The amount of profit a company makes from selling video games for x dollars is modeled by the function P(x) = –
x2 + 100x + 350,000. To the nearest dollar, what price gives the maximum profit?
A. $40.00
B. $45.00
C. $50.00
D. $55.00
18. Corinne has a cell phone plan that includes 200 minutes for phone calls and unlimited texting. An additional fee is charged for using more than 200 minutes for phone calls. The figure below is the graph of , where C is the monthly cost after m minutes used.
F.IF.4 Page 20/65

Part A: What is the minimum monthly cost for Corinne’s cell phone plan? Show or explain your work.
Part B: What is the value of Explain its meaning in terms of the cell phone plan.
Part C: For what m is Explain its meaning in terms of the cell phone plan.Part D: What is the cost per minute after Corinne uses her monthly allowance of 200 minutes? Show or explain your work.
19. Amil and Colton had two toy rockets they planned to launch from different buildings at different times. The height, h, of Amil’s rocket launched from the top of a building after t seconds is modeled by the equation where 100 represents the initial velocity in feet per second. Colton launched his rocket from a building with a height that was double the height from where Amil’s rocket was launched. The initial velocity of Colton’s rocket was half the initial velocity of Amil’s rocket. What is the approximate difference in the maximum heights of the two rockets after they were launched?
F.IF.4 Page 21/65

A. 1.6 feet
B. 40.0 feet
C. 50.0 feet
D. 77.2 feet
20. A baseball is thrown upward from the top of a building. The height of the ball t seconds after it was thrown into the air is modeled by the function h(t) = –16t2 + 50t + 75. During which approximate interval is the ball falling towards the ground?
A. 0 to 1.6 seconds
B. 0.9 to 2.6 seconds
C. 1.6 to 4.2 seconds
D. 4.2 to 6.0 seconds
21. The height of a ball, in feet, t seconds after it is thrown into the air is modeled by the function h(t) = –16t2 + 45t + 4. Approximately what is the maximum height of the ball?
A. 4 feet
B. 33 feet
F.IF.4 Page 22/65

C. 36 feet
D. 45 feet
22. A ball is thrown straight up with a speed of 32 feet per second, reaching a height of h feet after t seconds. The height of the ball is modeled by the function h = 32t – 16t2. After how many seconds does the ball fall back to the same height it attained a half-second after it was thrown?
A. 1 second
B. 1.25 seconds
C. 1.5 seconds
D. 1.75 seconds
23. A model rocket is launched from the roof of a building. Its flight path can be modeled by the function where represents the height of the rocket above the ground in feet and t represents the time in seconds after the rocket was launched.
Part A. Graph the flight path on the grid below. Interpret the y-intercept in terms of the context.
F.IF.4 Page 23/65

Part B. Use the graph to estimate how long it takes the rocket to reach the ground after it reaches its maximum height.
Use words, numbers, and/or pictures to show your work.
24. What is the maximum value of the function that fits the values shown in the table below?
x y–2 –130 32 114 116 38 –13
A. 11
B. 12
C. 13
F.IF.4 Page 24/65

D. 19
25. Which function has a graph that has an x-intercept at (–1, 0) and a y-intercept at (0, 3)?
A.
B.
C.
D.
26. Jimmy threw a baseball in the air from the roof of his house. The path followed by the baseball can be modeled by the function
where t represents the time in seconds after the ball was thrown and represents its height, in feet, from the ground.
Part A. How high is the roof from the ground? How many seconds did it take for the ball to hit the ground after it was thrown off the roof?
Part B. Jimmy wanted to throw the ball at a maximum height of 120 feet. Did Jimmy's baseball reach this height after it was thrown? Explain your answer.
Use words, numbers, and/or pictures to show your work.
27. Grover Elementary School is getting ready for the annual Penny Drive. The table below shows the target goals for the drive at the end of
F.IF.4 Page 25/65

different weeks.Time Total money
Week 1 $ 3,000Week 3 $ 3,400Week 5 $ 3,800Week 7 $ 4,200If the students express the total as a function of the number of weeks that the Penny Drive has been open, what is the slope of that function?
A. 200
B. 400
C. 1,200
D. 2,800
28. The table below shows the value of the function f(x) for various values of x.
Which statement describes f(x) over the interval of
A. The function is positive.
F.IF.4 Page 26/65

B. The function is negative.
C. The function is increasing.
D. The function is decreasing.
29. The graph below shows the relationship between the height of a ball (in meters), y, thrown into the air and the time (in seconds), x.
Which statement best describes the height of the ball?
A. The maximum height is 2 meters.
B. The maximum height is 4 meters.
C. The height is increasing for 2 seconds.
F.IF.4 Page 27/65

D. The height is increasing for 4 seconds.
30. A ball is thrown into the air with a speed of 32 feet per second. The function h = 32t – 16t2 models the height of the ball after t seconds. How many seconds does it take for the ball to reach its maximum height?
A. 0.75 second
B. 1 second
C. 2 seconds
D. 4 seconds
31. During which interval is the function shown on the graph below decreasing?
F.IF.4 Page 28/65

A.
B.
C.
D.
32. The table below shows the distance Chris is located from his school at different times.
Time (minutes)
Distance (miles)
0 20 3 18 6 16 9 14
12 12 15 10
Assuming a linear relationship, how long will it take Chris to get
F.IF.4 Page 29/65

to school?
A. 20 minutes
B. 24 minutes
C. 27 minutes
D. 30 minutes
33. The height above the ground attained by a football (in feet) after it is kicked is given by the equation where t is the time in seconds. Which statement is true?
A. The ball returns to the ground 2 seconds after it was kicked.
B. The ball reaches a maximum height of 1 foot above the ground.
C. The height of the ball above the ground is decreasing from time to seconds.
D. The height of the ball above the ground is increasing from time to seconds.
34. Starting at low tide, the wave height above sea level was recorded at a beach during an 18-hour cycle. At low tide, the height of a wave was 2 meters (m) above sea level. After 6 hours, at high tide, the height of a wave was 6 m above sea level. Which graph best models the height of these waves with respect to time?
F.IF.4 Page 30/65

A.
B.
C.
F.IF.4 Page 31/65

D.
35. Jenny is sitting in the bleachers watching football practice. She throws a football to her friend Adam, who is on the field. The height of the ball, in feet, can be modeled by the function where h(x) shows the height of the ball x seconds after Jenny threw it.
Part A. Graph the function from to the time the ball would hit the ground if it is not caught. Label the graph and use an appropriate scale. Describe the height of the ball in the first 0.5 second it is in the air.
Part B. Suppose Adam caught the ball when it was half the number of feet above the ground as it was when Jenny threw it. For how many seconds was the ball in the air?
F.IF.4 Page 32/65

Use words, numbers, and/or pictures to show your work.
36. What is the minimum value of the function f(x) = x2 – 6x + 7?
A. –3
B. –2
C. 3
D. 7
37. What is the minimum value of the function f(x) = (2x + 6)(x – 7)?
A. –120
B. –50
C. –25.5
D. –1.5
38. A rock is thrown up from the ground at a velocity of 84 feet per second. The formula h = –16t2 + 84t gives the rock’s height in feet after t seconds. What is the maximum height of the rock?
A. 68 feet
F.IF.4 Page 33/65

B. 84 feet
C. 110 feet
D. 179 feet
39. Lee uses the graph of the function to express his projected earnings at his new job.
Which best describes what
means in this problem?
A. the hours Lee will work per week
B. the hourly rate Lee will be paid at his new job
C. the amount of money in dollars Lee will earn for working 5 hours
F.IF.4 Page 34/65

D. the amount of money in dollars Lee will earn for working 8 hours
40. Which graph represents a function with an x-intercept at and a y-intercept at 5?
A.
B.
F.IF.4 Page 35/65

C.
D.
41. A rocket is launched with an initial upward velocity of 320 feet per second from an initial height of 15 feet. The function h(t) = –
16t2 + 320t + 15 models the height of the rocket, in feet, t seconds after it was launched. For how many seconds is the the height of the rocket greater than or equal to 1,039 feet?
A. 4 seconds
B. 12
F.IF.4 Page 36/65

seconds
C. 16 seconds
D. 20 seconds
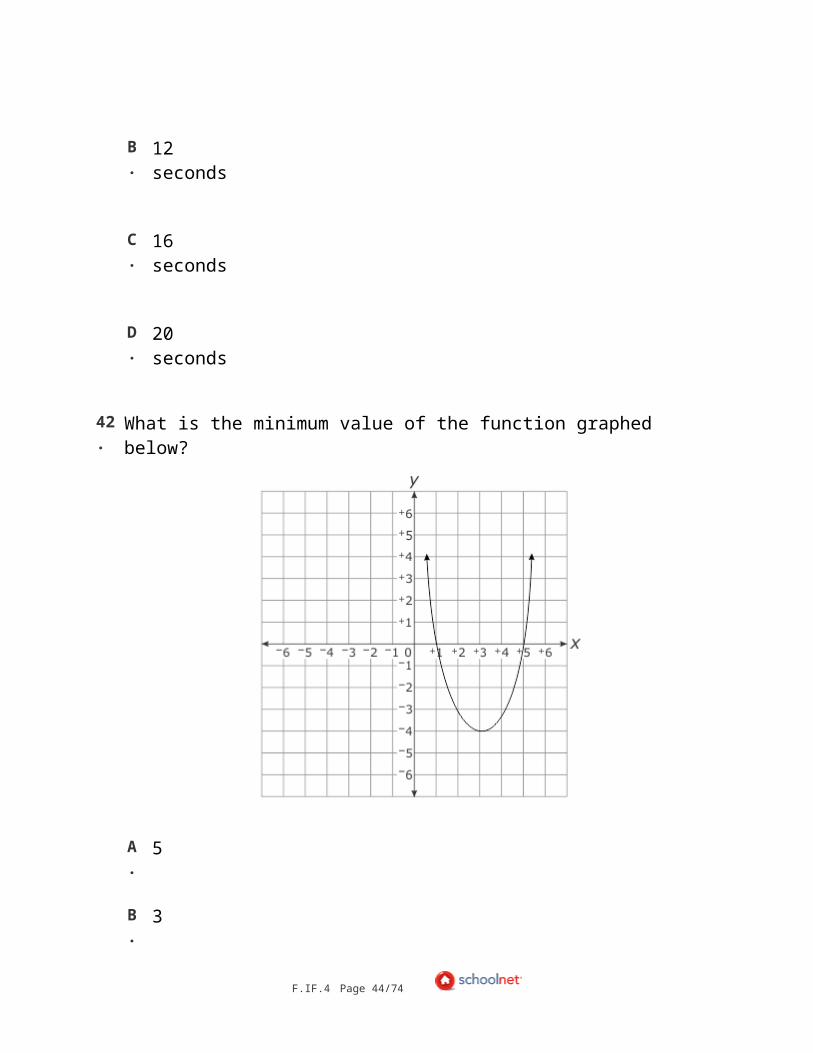
42. What is the minimum value of the function graphed below?
A. 5
B. 3
C. 1
D. –4
F.IF.4 Page 37/65

43. Last year, a computer store sold 200 laptops at the price of $1,000 per laptop. The store manager is planning for the upcoming year. She creates the graph shown below of the projected revenue from the sales of laptop computers for next year depending on the price increase per laptop.
What does the vertex of the parabola represent in terms of the context?
A. The minimum revenue from laptops will be $1,000 when the price per laptop is not increased.
B. The minimum revenue from laptops will be $200,000 when the price per laptop is not increased.
C. The maximum revenue of $225,000 occurs when the laptops are priced at $250.
D. The maximum revenue of $225,000 occurs when the laptops are priced at $1,250.
F.IF.4 Page 38/65

44. The height, in feet, of an arrow shot from a bow in an upwards direction, is modeled by the function where represents the time in minutes. During which interval is the arrow going up?
A.
B.
C.
D.
45. Which function has the following features?
symmetry over the y-axis increasing for all y-intercept of 0
A.
B.
C.
D.
46. A ball is dropped from the top of a 1,250-foot-tall building. The function f(x) = –16x2 + 1,250 models the height, in feet, of the ball x seconds after it was dropped. During which interval is the height of the ball between 500 and 550 feet from where it was
F.IF.4 Page 39/65

dropped?
A. 5.59–5.85 seconds
B. 5.86–6.61 seconds
C. 6.62–6.85 seconds
D. 6.86–8.84 seconds
47. Internet Launch!Two internet media companies, Jinga and Zipbow, offer media services to their subscribers in different ways. Jinga subscribers pay a monthly fee for unlimited media with no advertising. Zipbow is funded by advertisers, and subscribers use the service for free. The companies launch their services on the same day.A business class is studying how the different strategies affect the number of subscribers each company has in the first few months the services are offered.Part A. The business class determines that the approximate number of Jinga subscribers can be modeled by a quadratic function that passes through the points They also determine that the approximate number of Zipbow subscribers can be determined by the function If x represents the number of days since the company launch and y represents the approximate number of subscribers, graph both of these equations on the coordinate plane below. Be sure to label the axes with appropriate scales and indicate which graph is which.
F.IF.4 Page 40/65

Part B. How many subscribers does each company have on the day that the services are launched? Explain.Part C. What do points A, B, and C represent in terms of the context?Part D. Approximately how many days after the companies are launched will they have the same number of subscribers? Explain how the graph can be used to determine this information.Part E. On what intervals are the number of subscribers to each company increasing? On what intervals are they decreasing? In general, what do the shapes of the graphs indicate about what the subscribers prefer? Explain.
48. Which rational function is decreasing in the interval and is symmetric over the line
F.IF.4 Page 41/65

A.
B.
C.
F.IF.4 Page 42/65

D.
49. Which graph represents a function that has x-intercepts at –2 and 4 along with a maximum point on the axis of symmetry
A.
F.IF.4 Page 43/65
B.
C.
F.IF.4 Page 44/65

D.
50. What is the axis of symmetry for the function y = 2x2 + 4x – 1?
A. x = –4
B. x = –1
C. x = 1
D. x = 4
51. Shane is filling a barrel with water. The table below shows the amount of water in the barrel after different amounts of time.
Time (seconds)
Amount of Water (cubic inches)
1 25 2 32 3 39 4 46
Assuming Shane filled the barrel at a constant rate, how much
F.IF.4 Page 45/65

water was initially in the barrel?
A. 18 cubic inches
B. 16 cubic inches
C. 14 cubic inches
D. 12 cubic inches
52. A ball is thrown in the air from a platform at time seconds. The height, h(t), of the ball can be modeled as a function of time, t, by the equation Approximately how many seconds after being thrown will the ball hit the ground?
A. 0.13 second
B. 1.25 seconds
C. 2.37 seconds
D. 2.93 seconds
53. Car ValuesKelly bought a new car 5 years ago. She paid $15,000 for the car. Each year, the car depreciated in value as shown in the table below.
F.IF.4 Page 46/65

Part A. What function could Kelly use to model the value of her car after 10 years? Explain how you built your function.
Part B. Graph your function. How do the key features of the graph relate to Kelly’s situation?
Part C. Kelly hopes to use the car for 10 years before selling it. What will the value of her car be in 10 years?
Part D. Kelly would prefer to sell her car for at least $4,000 so that she can have a down payment for her next car. How long can Kelly keep her car before she sells it, if she hopes to sell it for $4,000 or more?
Part E. Consider the data below on two other models of cars. Graph the functions that represent the values of these two models on the same coordinate grid as the function that represents the value of Kelly’s car. How do they compare to Kelly’s car? How will the values of the three cars compare over time? Explain your answer using evidence from the values listed below and your graph.
Model A. New price: $20,000. Annual depreciation: 2.3%
Model B. New price: $10,000. Annual depreciation: 1.7%
54. On a winter day, it started snowing lightly at 4 a.m. and then heavier at 8 a.m. By 10 a.m. it stopped, and the total snowfall recorded was 3 inches. It didn’t snow for the rest of the day. Which of these is a possible graph for the number of inches of snow as a function of time, from midnight to midday?
F.IF.4 Page 47/65

A.
B.
C.
F.IF.4 Page 48/65

D.
55. The height of a football, in feet, t seconds after it is kicked into the air off of a tee, is modeled by the function h(t) = –
16t2 + 35t + 0.25. What is the approximate maximum height of the football?
A. 1.1 feet
B. 2.2 feet
C. 19.4 feet
D. 35.0 feet
56. The graph of a function is shown.
F.IF.4 Page 49/65

What is the x-intercept?
A.
B.
C. 3
D. 9
57. Jim borrowed $850 to purchase a stereo system for his car. He has been making payments each week for the last four weeks. The chart below shows the history of his loan balance.
In the linear function that models these data, x represents the week and y represents the balance of the loan. What is the slope of the function?
F.IF.4 Page 50/65

A.
B.
C.
D.
58. An object is launched from 180 feet above the ground. The function that models the height, in feet, of the object after seconds is given by
Which statement is true?
A. The object will obtain a maximum height of 180 feet.
B. The object will obtain a maximum height of 324 feet.
C. The object will obtain a maximum height after 6 seconds.
D. The object will obtain a maximum height after 7.5 seconds.
59. A polynomial function has the following features:
x-intercepts at and Relative maximum at Relative minimum at No other relative maximum or relative minimum exists for the
function.
Part A. Using the graph below, draw the function described above.
F.IF.4 Page 51/65

Part B. On which interval(s) is the function increasing? On which interval(s) is the function decreasing?
Part C. Describe the end behaviors of the function as and as
Use words, numbers, and/or pictures to show your work.
60. During which interval is the function f(x) = x2 – 9 decreasing?
A. x < 0
B. x > 0
C. x < 3
D. x > 3
61. A soccer ball is kicked upward from the ground. The path of the soccer ball can be represented by a parabola. One second after the ball is kicked, it reaches its maximum height, 16 feet.
F.IF.4 Page 52/65

Part A. How many seconds after the ball has been kicked does it return to the ground? Explain.
Part B. Draw a graph representing the height, h, of the ball t seconds after it has been kicked. Label the axes and use an appropriate scale.
Use words, numbers, and/or pictures to show your work.
62. The amount of profit a company makes if they spend x dollars on advertising is modeled by the function P(x) = –
4x2 + 800x + 2,000. How much should the company spend on advertising to maximize profit?
A. $100
B. $2,000
C. $10,000
D. $42,000
63. A scientist conducts an experiment to observe the half-life period of the
F.IF.4 Page 53/65

radioactive element barium. He starts the experiment with 200 grams of barium and records the mass at the end of every thirteenth day.
After how many days is the mass of barium closest to 1.5 grams?
A. 13 days
B. 65 days
C. 91 days
D. 104 days
64. A function f(x) is graphed below.
F.IF.4 Page 54/65

When is f(x) < 0?
A. x < 0
B. x < 0 or x > 2
C. x < –2 or x > 2
D. –2 < x < 2
65. Which statement must be true about polynomial functions?
F.IF.4 Page 55/65

A. Functions that have different degrees have different end behavior as x approaches infinity.
B. Functions that have the same degree have the same end behavior as x approaches negative infinity.
C. Functions that have leading coefficients of different signs have different end behavior as x approaches infinity.
D. Functions that have leading coefficients with the same sign have the same end behavior as x approaches negative infinity.
66. Given the rational function below, answer the following parts.
Part AFind the x-intercepts (if any exist).
Part BFind the y-intercept (if it exists).
Part CDescribe the end behavior of the function.
Part DUse the key features to sketch the graph of the function.
67. The table below shows the cost for a toy company to produce different amounts of toys.
Toys Produced Cost
F.IF.4 Page 56/65

1,000 $122,000 3,000 $26,000 5,000 $10,000 7,000 $74,000
Assuming a quadratic relationship, about how many toys should the company produce to minimize costs?
A. 1,000
B. 4,000
C. 5,000
D. 6,000
68. The graph below shows the amount of Michael’s paycheck based on a 40 hour work week, plus his commission from sales. Michael earns 50% of the total amount of sales that he makes.
F.IF.4 Page 57/65

Which is the best explanation of the y-intercept of the graph?
A. Michael’s paycheck will be $100.00 when he makes no sales.
B. Michael’s paycheck will be $0 when he makes $100 in sales.
C. Michael’s paycheck will be $125.00 when he makes $50 in sales.
D. Michael’s paycheck will be $150.00 when he makes $100.00 in sales.
69. A skydiver jumps from a height of 3,600 feet above the ground. The table below shows his height at different intervals of time.
F.IF.4 Page 58/65

If the skydiver's height with respect to time can be shown using a quadratic equation, how many seconds does it take the skydiver to reach the ground?
A. 15 seconds
B. 16 seconds
C. 20 seconds
D. 32 seconds
70. The graph of a function has its maximum point on the line Which of these is the possible graph of
F.IF.4 Page 59/65

A.
B.
F.IF.4 Page 60/65

C.
D.
71. Design a RoomThe following equation represents the total area of a room including a closet, where f(x) is the total area and x represents a measurement of length in feet. The area of the closet is
Part 1. Make a sketch that could represent the room and closet. Label the dimensions in your drawing. Label the area inside each space.
F.IF.4 Page 61/65

Part 2. Fill in the table with values for f(x).
Part 3. Sketch a graph of the function when
F.IF.4 Page 62/65

Part 4. Consider the values of this function for
Find the zeros of the function. Would these values be considered as a length for the room? Explain your answer.
Part 5. Graph the function when
F.IF.4 Page 63/65

Part 6. Suppose that the room will have two identical twin beds with each measuring 6 feet long and 3 feet wide. If the area of the room must be less than 8 times the area of the closet, what is a reasonable range of values for x? Justify your answer.
Use words, numbers, and/or pictures to show your work.
72. Which function below has a vertex at (–3, 2) and a zero at x = –2?
F.IF.4 Page 64/65

A. f(x) = x2 + 6x + 11
B. f(x) = x2 – 6x + 11
C. f(x) = –2x2 – 12x – 16
D. f(x) = –2x2 + 12x – 16
F.IF.4 Page 65/65