604 ieee transactions on engineering management,...
TRANSCRIPT

604 IEEE TRANSACTIONS ON ENGINEERING MANAGEMENT, VOL. 62, NO. 4, NOVEMBER 2015
Information Flow Through Stages of ComplexEngineering Design Projects: A Dynamic
Network Analysis ApproachPedro Parraguez, Steven D. Eppinger, and Anja M. Maier
Abstract—The pattern of information flow through the networkof interdependent design activities is thought to be an importantdeterminant of engineering design process results. A previouslyunexplored aspect of such patterns relates to the temporal dynam-ics of information transfer between activities as those activities areimplemented through the network of people executing the project.To address this gap, we develop a dynamic modeling method thatintegrates both the network of people and the network of activitiesin the project. We then employ a large dataset collected from anindustrial setting, consisting of project-related e-mails and activityrecords from the design and development of a renewable energyplant over the course of more than three years. Using networkmetrics for centrality and clustering, we make three importantcontributions: 1) We demonstrate a novel method for analyzing in-formation flows between activities in complex engineering designprojects; 2) we show how the network of information flows in alarge-scale engineering project evolved over time and how networkanalysis yields several managerial insights; and 3) we provide a use-ful new representation of the engineering design process and thussupport theory-building toward the evolution of information flowsthrough systems engineering stages. Implications include guidanceon how to analyze and predict information flows as well as bet-ter planning of information flows in engineering design projectsaccording to their individual stage and activity characteristics.
Index Terms—Complex system development, design activities,design process, engineering communication, information flow,network analysis, project management, R&D management.
I. INTRODUCTION
COMPLEX engineering design projects comprise interde-pendent activities implemented by interconnected people.
Such projects can be described as an intertwined network of peo-ple exchanging and transforming information, the organizationarchitecture, and as a network of information interdependent ac-tivities, the process architecture. The connection between thesetwo architectures is created when design engineers and other
Manuscript received September 30, 2014; revised April 26, 2015 and July14, 2015; accepted July 30, 2015. Date of publication October 16, 2015; date ofcurrent version October 16, 2015. Review of this manuscript was arranged byDepartment Editor N. A. Gil.
P. Parraguez and A. M. Maier are with the Department of Manage-ment Engineering, Engineering Systems Group, Technical University ofDenmark (DTU), Kongens Lyngby 2800, Denmark (e-mail: [email protected];[email protected]).
S. D. Eppinger is with the MIT Sloan School of Management, MassachusettsInstitute of Technology, Cambridge, MA 02139 USA (e-mail: [email protected]).
This paper has supplementary downloadable multimedia material availableat http://ieeexplore.ieee.org provided by the authors. This material consists ofAppendix A and Appendix B.
Color versions of one or more of the figures in this paper are available onlineat http://ieeexplore.ieee.org.
Digital Object Identifier 10.1109/TEM.2015.2469680
project participants interact to exchange and transform informa-tion between activities [1]–[4]. As a result of these interactions,information can flow between interdependent design activitiesin the form of design inputs and outputs [5].
From a research and managerial perspective, quantifying, an-alyzing, and understanding the evolving information flows be-tween activities in the design process is an essential tool toprovide support to complex engineering design projects [2],[6]. The intended or expected evolution of information flowsbetween activities (given activities’ information dependencies)has been modeled and analyzed through activity network pro-cess models [7]. In turn, the overall evolution of the designprocess has been framed and guided through stage-based mod-els of the design process [8], [9]. The combination of thesetwo approaches is particularly relevant in the context of processplanning, supporting key decisions related to process structure,resource allocation, and budgeting [7]. However, in order toquantify and analyze how information actually flows betweenactivities and support process execution and control, we requirea model that simultaneously integrates the dynamic architec-ture of the process as well as the dynamic architecture of theorganization that implements the process. This integration al-lows connecting the actual sequence of activities in the processwith those who, through their work, exchange and transforminformation within and between activities [4].
Nonetheless, previous studies of the design process have sofar neither provided nor empirically tested a model to analyzethe evolution of information flow between activities in a waythat clearly distinguishes actual flows from intended informationflows. Moreover, previous studies have not yet analyzed evolv-ing information flows at each systems engineering stage. As aconsequence, it has not been possible to compare actual infor-mation flows against expected information flows at each stage.This is not only a shortcoming in our design process knowledgebut also has hindered possibilities for monitoring overall projectprogress and improving process execution and control.
Against this background, this paper poses two main researchquestions.
1) How can we model and analyze actual information flowsbetween activities through stages of complex engineeringdesign projects?
2) What are the implications, for theory and practice, of amodel to analyze actual information flows between activ-ities?
To answer these research questions the rest of the paper isstructured as follows. Section II reviews and identifies gaps inkey literature on information flow models. Section III develops
0018-9391 © 2015 IEEE. Personal use is permitted, but republication/redistribution requires IEEE permission.See http://www.ieee.org/publications standards/publications/rights/index.html for more information.

PARRAGUEZ et al.: INFORMATION FLOW THROUGH STAGES OF COMPLEX ENGINEERING DESIGN PROJECTS: A DYNAMIC NETWORK 605
a dynamic model to quantify and analyze actual informationflows between activities. Section IV develops a baseline fromwhich to compare and interpret empirical results derived fromthe application of our model. Section V introduces our casestudy. Section VI provides empirical results of the applicationof our model. Section VII discusses the results, limitations, andanswers the aforementioned research questions. Finally, sectionVIII concludes with a synthesis of this paper’s contribution.
II. LITERATURE BACKGROUND
In the context of the design process of complex systems,information flows can be studied from three main perspectives:
1) organizational, with design as a social process of infor-mation transformation and a focus on communication be-tween people;
2) process oriented, analyzing design in terms of informationdependent activities and a set of project stages;
3) at the intersection of organization and process, explicitlyconsidering the information flow between activities as afunction of information exchanges between people.
In this section, we cover each of these three perspectives,identify current literature gaps, and elicit the requirements for adynamic model of actual information flows between activities.
A. Organizational Perspectives on Information Flow inEngineering Design
The design of complex products and systems has been consid-ered a social process of information transformation [10]–[12].As such, a systemic understanding of communication that con-siders information, interactions, and the specific situation duringthe development process becomes essential for design processimprovements [6], [13].
Information exchanges and information flows are used tomodel communication patterns between participants of engi-neering design projects. An information exchange can be un-derstood as a simplified communication episode, where infor-mation is generated and transmitted between parties of the de-sign process as a discrete event in time. An information flowis the combination of information exchanges over a period oftime and involves a sequence of information exchanges aboutusually interdependent design activities [14, ch. 1], [15].
Although information flows are inherently dynamic in nature,for simplicity, most studies analyze them at an aggregate level[16]–[19]. Only more recently, with the advent of richer datasources and powerful network analysis techniques, have detaileddynamics been studied [20]–[23].
This organizational perspective of information flows providesvaluable insights for the analysis of organizational issues, suchas communication patterns between individuals or departments[16], [24]. However, this perspective of the design process ofcomplex engineering projects is incomplete, as it does not ex-plicitly integrate activities and project progress.
B. Process-Driven Perspectives on Information Flow inEngineering Design
In the process domain, we find engineering design ac-tivities connected by their information dependencies and/or
administrative controls. Following Sim & Duffy’s ontology ofgeneric design activities [25], we use the term activity to referto the actual realization of a particular design task. Activitiesthen involve actions executed by a person or group to transforma set of information inputs into a set of information outputs.In the context of a design activity, information has the purposeof defining the design object, evaluating design options, and/orcoordinating the design process [25].
Models describing the architecture of the process domain thathave been used to study issues related to information flows be-tween activities include, to name a few, the process-type designstructure matrix (DSM), workflow diagrams, IDEF, CPM/PERT,and Petri nets (for a review of activity network-based processmodels, see [7]). All these models consider a network of activ-ities frequently connected by information-based relationshipsbetween them.
Even though process models are often used to describe andanalyze actual information flows between activities, the relation-ship they use to connect activities is not an actual informationflow. Instead, the relationship between activities tends to fallinto two types: 1) relationships based on known technical andmanagerial needs that are used to define a dependency; and2) relationships based on planned information flows, typicallyin the form of top-down plans or perceptions acquired from afew company experts. These two types of relationships restrictthe kind of questions that can be posed to elicit the processarchitecture to questions such as “What is the information de-pendency (if any) between activities A and B?” and “What isexpected/should be the information flow between activities Aand B?” However, what is really required to model actual in-formation flows between activities is to complement plans andknown technical dependencies with the architecture of the mul-tiple information exchanges between project participants in thecontext of the activities in which they participate.
This distinction between a process model that is built uponplanned or expected information flows, in contrast to a model ofactual information flows, is important when interpreting empiri-cal results. For example, the stated aim of Collins et al. [26] andBraha and Bar-Yam [27] is to describe and analyze the dynam-ics of information flows between activities; nevertheless, theinformation they acquire and model only describes an evolv-ing network of information dependencies. As a consequence,their results describe planned or expected information flows,not actual information flows.
1) Activity Categories: In terms of the functions that activ-ities perform and building on the approach by Sosa et al. [28]to identify and name modular and integrative subsystems, wecan identify two broad activity categories: The first categoryincludes activities related to the engineering design of specificcomponents, modules, or subsystems under development; thesewe call modular subsystem activities. The second category cor-responds to activities with the objective of integrating two ormore components, modules, or subsystems; these we call inte-grative subsystem activities. A third category, not included inthe original work of Sosa et al. [28] but considered importantby Sim and Duffy [25], corresponds to activities that support,manage, and coordinate design work; for consistency, we callthese integrative work activities. These three categories allow

606 IEEE TRANSACTIONS ON ENGINEERING MANAGEMENT, VOL. 62, NO. 4, NOVEMBER 2015
Fig. 1. Stages of the engineering design process used in the context of this study. Adapted from PD [5] and SE-V [31] process models.
classifying activities based on their overall function and withthis the means for aggregated analysis of information flows ofeach design stage.
2) Design Process Stages: Staged-based models of the de-sign process reflect the transformation over time of a set ofrequirements into a detailed set of instructions to implement thedesign object [5], [12]. As the design process unfolds through-out its stages, information flows between activities also evolve.This evolution through different stages can be traced to tem-poral and codependent aspects such as the progression of thedesign object [5], the maturity of the design process [29], and thechanging interaction patterns between the people participatingin the activities [4].
Systematic models of the engineering design process implic-itly or explicitly consider a logical sequence of stages and a setof activities within each stage [30, p. 35]. To guide this paper’sdiscussion, we focus on the generic product development (PD)stages described by Ulrich and Eppinger [5] in conjunction withthe system development perspective found in INCOSE’s sys-tems engineering V model (SE-V) [31]. This combination hasbeen selected because these models provide widely acceptedgeneric stage descriptions for new PD and systems engineeringprocesses. In addition, there are multiple commonalities be-tween the stages of these models and the ones found in otherpopular engineering design process models [32], which enablegeneralizations beyond these particular models.
Fig. 1 offers an overview that serves as a reference point forthe characterization of each stage. Our emphasis is on the stagesspanning conceptual design to system integration, as these arethe limits of what is usually considered the predominant focus ofengineering design [14, p. 5]. Consequently, strategic planningand implementation are not explicitly covered in our analysisand discussion.
Combining the descriptions for the PD stages [5] and the SE-V model [31] each stage can be summarized from the literaturein terms of its level of decomposition or integration, the levelof abstraction or maturity of the design, process modularity,and the key activity categories that are expected to dominate
the stage: the conceptual design stage is characterized by a lowlevel of hierarchical decomposition and high level of abstractionand is dominated by integrative work activities. Low processmodularity and a relatively low number of activities are alsoexpected.
The system-level design stage is characterized by low tomedium level of hierarchical decomposition, medium level ofabstraction, dominated by a combination of integrative work ac-tivities and modular subsystem design activities. Process mod-ularity slowly increases and the number of activities are alsoexpected to increase.
The detailed design stage is characterized by the highest levelof hierarchical decomposition and the lowest level of abstrac-tion and is dominated by modular subsystem design activitiesand integrative subsystem design activities. Process modularitypeaks, given the higher specialization of the stage, and activitiesreach the maximum number.
The system integration stage is characterized by the highestlevel of integration and highest level of design maturity and isdominated by integrative work design activities and integrativesubsystem design activities. The overall process modularity andthe number of activities are expected to decrease as the focusshifts from subsystems to the overall system under development.
C. Intersection Between Process and OrganizationPerspectives on Information Flows
In order to study information flows between activities and rec-ognizing the need to take the organization architecture into ac-count, previous studies have developed static or dynamic modelsof the design process combining elements from the process andthe organization domains. In combining these domains, variousapproaches have been followed according to the temporality ofthe analysis.
Static models have provided a temporally aggregated viewof the information flows between activities through one or afew snapshots. These models have used either single-domain,matrix-based approaches, where each activity is associated with

PARRAGUEZ et al.: INFORMATION FLOW THROUGH STAGES OF COMPLEX ENGINEERING DESIGN PROJECTS: A DYNAMIC NETWORK 607
TABLE ICOMPARISON OF ELICITED REQUIREMENTS AGAINST REVIEWED MODELS
Model Examples People and Activities Dynamics Comparison Base
Organization domain—static [16]–[19] Only people No Can be compared against formal org.architecture or in terms ofcross-domain mirroring
Organization domain—dynamic [20]–[22] Only people Yes Does not provide a direct comparisonbase or benchmark
Process domain [26], [27], [37] Only activities Yes. In the form of asequence of activities
Can be compared in terms ofcross-domain mirroring
Intersection process andorganization—static
[4], [33]–[36] People and activities withdifferent degrees of flexibility inthe mapping
No Can be compared against informationdependencies in the process domain
Intersection process andorganization—dynamic
The focus of this paper People and activities Yes Can be compared against stages,information dependencies and plannedinformation flows
one organizational unit, for example, two-dimensional (2-D)DSMs [33], [34], multidomain matrix-based approaches [35],[36], or bimodal network-based approaches [4]. Unfortunately,the static nature of these models does not allow calculatinginformation flow metrics for each period of time nor does it al-low contrasting those measures with expected information flowpatterns at each design process stage. Dynamic models that si-multaneously consider the evolution of process and organizationarchitectures and, therefore, allow describing the actual evolu-tion of information flow between activities were not found.
1) Requirements and Current Gaps for a Dynamic Model ofActual Information Flows Between Activities: Based on the ear-lier literature background, we can identify a set of key require-ments to dynamically model actual information flows betweenactivities through the design process stages.
1) People and activities: The organization and process ar-chitecture, as well as their intersection, need to be si-multaneously considered so that all paths for informationexchanges between activities are included.
2) Dynamics: To capture the dynamic evolution of informa-tion flows through stages of the design process, both theorganization and process architecture need to be modeledas a dynamic network and quantitatively measured.
3) Comparison base: To interpret the results of the model acomparison base is required. The comparison can be basedon generic systems engineering stages, stated informationdependencies, and/or planned information flows (as longas they can be mapped dynamically).
Table I compares these requirements against current ap-proaches to examine the suitability of each approach for mod-eling and analyzing the evolution of actual information flows.
Given the three previously mentioned requirements and theliterature gap shown in Table I, in this paper, we focus on actualand evolving information flows at the intersection of processand organization architectures.
III. DYNAMIC AND CROSS-DOMAIN NETWORK APPROACH FOR
QUANTIFYING INFORMATION FLOWS IN ENGINEERING DESIGN
Building on the characteristics of information flows in en-gineering design, the elicited requirements, and the literaturebackground, in this section we introduce our dynamic networkmodel of information flow between activities. In addition, here
we also provide a brief introduction to key network analysisconcepts, in particular centrality and clustering, which will beused as tools to quantify the evolution of information flows.
A. Network Metrics
A common thread of the organizational and process modelsintroduced in Section II is the explicit or implicit use of networkanalysis. The most common approaches consider matrix-basedor graph-based network analysis to model information flow orinformation dependencies in the form of an information net-work. In order to understand these information networks, it ishelpful to frame them in the wider context of network analysisstudies of complex engineering design projects.
An information network is taken to be a system representationof the information transformation process, where the elements(nodes) are connected by information exchanges (edges). Suchelements can be combined into a multimodal network (wheredifferent types of elements coexist) or as a one-mode network(where only one type of element is represented). Each node canbe described using network measures that quantify their directand/or indirect connections. Likewise, the network as a wholecan also be described based on the structure of its connections (inour case information exchanges). Table II offers a description ofselected network measures that allow quantifying two importantaspects of information networks: 1) centrality; and 2) clustering.
As described in Table II, when metrics of centrality andclustering are applied to an information network, they revealfundamental information flow patterns and network properties.Although at the node and network-level there are a number ofother network metrics available to quantify centrality and clus-tering, not all measures are equally suitable to quantify weightedinformation networks. For a review, see [38] and [43].
Node-level and network-level centrality measures applied toinformation networks quantify the influence that a given nodecan have on information flows in a network and the degreeto which those flows are centralized in a few nodes. Borgatti[43] shows that given the properties of inherent divisibility, par-allel duplication, and influence, transitivity found in networksconstituted of information flows “the eigenvector centrality mea-sure is ideally suited for influence type processes” [43, p. 62],in particular those related to information-based influence.

608 IEEE TRANSACTIONS ON ENGINEERING MANAGEMENT, VOL. 62, NO. 4, NOVEMBER 2015
TABLE IIDETAILS OF SELECTED NETWORK MEASURES AND THEIR RELEVANCE FOR INFORMATION NETWORKS
Node-level and network-level clustering metrics applied toinformation networks determine the extent of triadic closure ofa given node or the entire network and, therefore, reveal theextent to which information flows are associated to tight net-work clusters [41]. As a result, clustering provides an indicationabout the modularity of the information network. Unlike cen-trality measures, for which there are less consensus and moreoptions, the clustering coefficient of Watts and Strogatz [41]and its weighted version [40] (at the node and network-level)are widely used and, while generic, are well-suited for the anal-ysis of information networks [4].
If either centrality or clustering metrics are utilized in iso-lation, it is hard to evaluate the overall network topology interms of aspects such as modularity, which at least requiresa combination of inputs on centrality and clustering [44]. Forexample, graph iv in Table II has a maximum clustering coeffi-cient; however, that network is only formed by one big cohesivecluster; therefore, it is not possible to speak about modular-ity, as that would require the underlying system to be at leastsemidecomposable into two or more modular subsystems [44].As a result, the combination of network-level measures for cen-trality and clustering provide a more balanced view.
PARRAGUEZ et al.: INFORMATION FLOW THROUGH STAGES OF COMPLEX ENGINEERING DESIGN PROJECTS: A DYNAMIC NETWORK 609
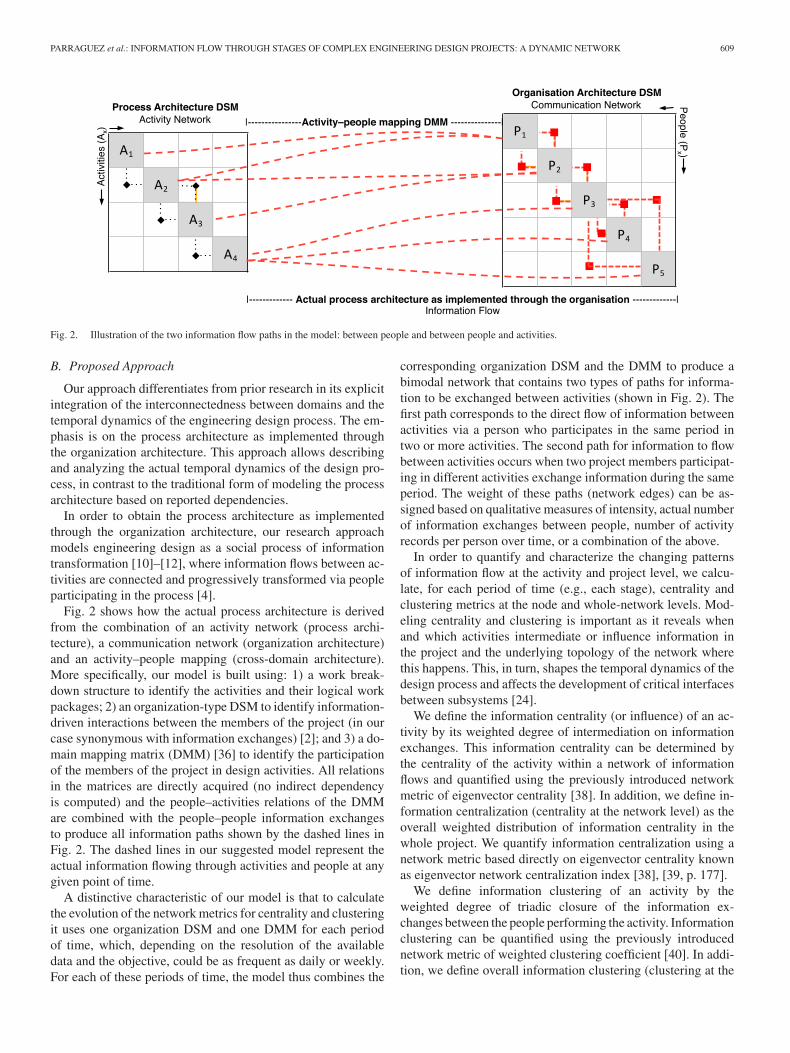
Fig. 2. Illustration of the two information flow paths in the model: between people and between people and activities.
B. Proposed Approach
Our approach differentiates from prior research in its explicitintegration of the interconnectedness between domains and thetemporal dynamics of the engineering design process. The em-phasis is on the process architecture as implemented throughthe organization architecture. This approach allows describingand analyzing the actual temporal dynamics of the design pro-cess, in contrast to the traditional form of modeling the processarchitecture based on reported dependencies.
In order to obtain the process architecture as implementedthrough the organization architecture, our research approachmodels engineering design as a social process of informationtransformation [10]–[12], where information flows between ac-tivities are connected and progressively transformed via peopleparticipating in the process [4].
Fig. 2 shows how the actual process architecture is derivedfrom the combination of an activity network (process archi-tecture), a communication network (organization architecture)and an activity–people mapping (cross-domain architecture).More specifically, our model is built using: 1) a work break-down structure to identify the activities and their logical workpackages; 2) an organization-type DSM to identify information-driven interactions between the members of the project (in ourcase synonymous with information exchanges) [2]; and 3) a do-main mapping matrix (DMM) [36] to identify the participationof the members of the project in design activities. All relationsin the matrices are directly acquired (no indirect dependencyis computed) and the people–activities relations of the DMMare combined with the people–people information exchangesto produce all information paths shown by the dashed lines inFig. 2. The dashed lines in our suggested model represent theactual information flowing through activities and people at anygiven point of time.
A distinctive characteristic of our model is that to calculatethe evolution of the network metrics for centrality and clusteringit uses one organization DSM and one DMM for each periodof time, which, depending on the resolution of the availabledata and the objective, could be as frequent as daily or weekly.For each of these periods of time, the model thus combines the
corresponding organization DSM and the DMM to produce abimodal network that contains two types of paths for informa-tion to be exchanged between activities (shown in Fig. 2). Thefirst path corresponds to the direct flow of information betweenactivities via a person who participates in the same period intwo or more activities. The second path for information to flowbetween activities occurs when two project members participat-ing in different activities exchange information during the sameperiod. The weight of these paths (network edges) can be as-signed based on qualitative measures of intensity, actual numberof information exchanges between people, number of activityrecords per person over time, or a combination of the above.
In order to quantify and characterize the changing patternsof information flow at the activity and project level, we calcu-late, for each period of time (e.g., each stage), centrality andclustering metrics at the node and whole-network levels. Mod-eling centrality and clustering is important as it reveals whenand which activities intermediate or influence information inthe project and the underlying topology of the network wherethis happens. This, in turn, shapes the temporal dynamics of thedesign process and affects the development of critical interfacesbetween subsystems [24].
We define the information centrality (or influence) of an ac-tivity by its weighted degree of intermediation on informationexchanges. This information centrality can be determined bythe centrality of the activity within a network of informationflows and quantified using the previously introduced networkmetric of eigenvector centrality [38]. In addition, we define in-formation centralization (centrality at the network level) as theoverall weighted distribution of information centrality in thewhole project. We quantify information centralization using anetwork metric based directly on eigenvector centrality knownas eigenvector network centralization index [38], [39, p. 177].
We define information clustering of an activity by theweighted degree of triadic closure of the information ex-changes between the people performing the activity. Informationclustering can be quantified using the previously introducednetwork metric of weighted clustering coefficient [40]. In addi-tion, we define overall information clustering (clustering at the

610 IEEE TRANSACTIONS ON ENGINEERING MANAGEMENT, VOL. 62, NO. 4, NOVEMBER 2015
TABLE IIISUMMARY AND COMPARISON OF EXPECTED INFORMATION PATTERNS FOR EACH STAGE
network level) as a measure of the tendency of the network toform well-connected subgroups of people around activities. Wequantify overall information clustering using a network metricbased on the clustering coefficient, known as the weighted over-all graph clustering coefficient [41]. The weighted version ofthis last metric “gives weight to the neighborhood densities pro-portional to their size; that is, actors with larger neighborhoodsget more weight in computing the average density” [42, ch. 8].The formulas for these four network metrics are available inAppendix A, found in the supplemental material.
Although to obtain the actual process architecture we couldhave taken a more traditional process DSM approach, askingdirectly how activities are implemented based on expert knowl-edge, as in [2] and [37], the intertemporal nature of our analysiswould have made this task overly difficult for the respondents.The problem originates in the multiple ways in which activitiescan be implemented and connected to other activities throughpeople. In contrast, instead of directly gathering this dynamicnetwork of task interactions from experts, our approach firstacquires the mapping of people to activities over time, thenidentifies the dynamic interactions between people, and, finally,composes a unified network structure utilizing this bottom-upperspective. Such data-gathering strategy also has the advan-tage that it can be automated via the extraction of digital tracesproduced throughout the design process.
To facilitate analysis and interpretation, the process architec-ture can be analyzed by aggregating low-level activities intolarger activity groups (work packages) and activity categories
based on the common work they perform toward developing aparticular subsystem or subprocess.
IV. RELATIONSHIP BETWEEN DESIGN PROCESS STAGES AND
THE DYNAMIC NETWORK STRUCTURE OF INFORMATION FLOWS
The model presented in Section III provides a way to empir-ically quantify the changing patterns of information centralityand clustering between activities, as well as of overall infor-mation centralization and overall information clustering in en-gineering design projects. However, to interpret the empiricalresults obtained through the application of the model, we needa base against which to compare the obtained information cen-trality and clustering patterns.
One option is to compare the empirical results against a pre-vious and closely related successful project to which the samequantification of information flows was applied. Although thisoption allows for a direct benchmark, it would not allow for atheoretical understanding of information flow patterns. In ad-dition, data of closely related and successful projects are oftenunavailable in practice. An alternative option is to build a com-parison based on an examination of qualitative descriptionsfound in generic models of systems engineering stages. Aslong as the engineering design project under study follows asequence of systems engineering stages, it is possible to bench-mark against information centrality and clustering patterns in-ferred from the descriptions of each generic engineering designstage.
PARRAGUEZ et al.: INFORMATION FLOW THROUGH STAGES OF COMPLEX ENGINEERING DESIGN PROJECTS: A DYNAMIC NETWORK 611
To enable the analysis and comparison of empirical resultsproduced by the application of the proposed model against sys-tems engineering stage models, we need to translate the qualita-tive systems engineering stage descriptions and characteristics(Section II) into expected information flow patterns by stage.That is to say, we need, a theory of how information is ex-pected to flow between activities in different engineering sys-tems stages. Given the description of the design process stagesintroduced in Section II, we postulate the following informationcentrality and clustering patterns per stage:
A. Conceptual Design and System-Level Design Stages
While the conceptual and system-level design stages have dif-ferent purposes, from the point of view of expected informationflow patterns, they share similar features. Both stages are char-acterized by a high level of abstraction and system-level focus,and we expect these stages to be dominated by integrative workactivities that possess a relatively high level of information cen-trality and low levels of clustering. Such a topology resemblesa star-like network structure, with integrative work activities atthe center of the network (see Table III). At the whole networklevel, this translates into a high network centralization index andlow overall graph clustering.
B. Detailed Design Stage
As at this stage the maximum level of decomposition isreached and the focus shifts toward individual subsystems, weexpect modular subsystem activities to dominate the networktopology of this stage. This means that modular subsystem activ-ities should exhibit, relative to the other two activity categories,the highest centrality. However, at the network level, this stageshould exhibit a relatively low centralization, consistent withthe distributed nature of work in parallel subsystems. Likewise,considering the high level of decomposition required, clusteringshould be high, reflecting the expected process modularity asso-ciated with the required system decomposition into subsystems.At this stage, given the increased level of technical specializa-tion, the coordination between subsystems is expected to shiftfrom integrative work activities to integrative subsystem activi-ties. Such a shift should increase the centrality of integrative sub-system activities and decrease the centrality of integrative workactivities. At the whole network level, this translates into a lownetwork centralization index and high overall graph clustering.
C. System Integration Stage
Considering the shift of focus in this stage from the detaileddesign of subsystems to their integration, we expect a reversalof some of the network patterns reached at the detailed de-sign stage. In particular, and consistent with the need for cross-subsystem coordination, integrative work activities should re-gain centrality and the overall information centralization of thenetwork should also increase. As the emphasis shifts from mod-ularity to integration, overall graph clustering should decreaseand centralization should increase. Given the higher degree oftechnical maturity and system complexity of the design reached
at this stage, while overall clustering is expected to decline, isnot expected to go below levels found during the conceptual andsystem-level design stages.
Table III summarizes the expected patterns for each of thepreviously covered stages in terms of information centralityand clustering, providing a base against which to compare theempirical results obtained from our case study (presented in thefollowing section).
V. CASE STUDY: THE DESIGN OF A BIOMASS POWER PLANT
In order to test our model, we used a large engineering designproject as a case study. The project consisted of the completeengineering design work of a biomass power plant for electricalenergy generation, developed in the period between Septem-ber 2009 and May 2013. Access to the project data was gainedthrough the company in charge of the engineering design of theplant. The same company coordinated work with the construc-tion contractor and the component manufacturers. Key contactpoints were the VP of Operations, the VP of Engineering, theproject manager, and the quality assurance team.
A. Organization Domain Data
Data to map the organization domain were acquired throughan analysis of 20127 internal e-mail information exchanges be-tween 162 members of the engineering design project span-ning 15 functional areas. This dataset represents the totality ofproject-related e-mail communication during the period understudy. E-mail metadata about sender and recipient as well as timeand date were used to model the actual organization architectureas a dynamic information exchange network. Due to archival re-quirements from clients and regulatory agencies, all e-mails inthis dataset are related exclusively to the design process of thebiomass power plant; therefore, they are a good representationof relevant project-related information exchanges.
We assessed how fully e-mail communication represents allpossible communication channels in the project through an elec-tronic questionnaire. The questionnaire was administered to aselection of 49 core project members who reported the frequency(daily, monthly, or weekly) of their information exchanges with77 project members (including the 49 surveyed members). Theresult of this cross validation was that for the 60 members forwhom there was complete overlap between survey and e-mailcommunication, 58% of their dyadic information exchangeshad a near complete correspondence between survey and e-mailcommunication, while 68% had a frequency weighted corre-spondence within 70% or more. Hence, we consider this e-mailcommunication database as a good proxy for the majority ofinformation exchanges in this project.
The person–person communication network was built withpeople as nodes and e-mail exchanges between them asedges. The weight of the edges between project participantswas calculated by counting the number of e-mails betweena particular dyad for each temporal snapshot under analysis(i.e., each stage). This is equivalent to weighting edges bycommunication frequency.

612 IEEE TRANSACTIONS ON ENGINEERING MANAGEMENT, VOL. 62, NO. 4, NOVEMBER 2015
TABLE IVCASE STUDY DATA SUMMARY
Data Description Relational Information Temporality Main Source
People 162 project participants from 15functional areas who exchangedproject related e-mails
20127 internal e-mail exchanges withmetadata about sender, recipient, time, anddate
Directly extracted from e-mailmetadata covering the full periodunder analysis
E-mail datasetcross-validated viaelectronic questionnaire
Activities 66 activities divided in 13 activitygroups, subsequently classifiedinto 3 activity categories
The work breakdown structure was used toidentify information dependencies and tocategorize activities
Each time an activity is performedby someone, it is registered with atimestamp and a number of hours(11742 activity entries)
Project records
Activity categories (A, B, and C) and activity groups (A1–A3, B1–B4, and C1–C6)
A: Integrative work activities B: Integrative subsystem activities C: Modular subsystem activitiesA1: Overall project management B1: Design of steel structures C1: Boiler and equipment design
A2: Procurement B2: Load plan and layout C2: External piping designA3: On-site coordination B3: Process flow diagram (PFD) + piping C3: Pressure parts design
and instrumentation diagram (P&ID) C4: Air and flue gas designB4: COMOS (database related work) C5: Combustion system design
C6: Electrical, control, and instrument design
B. Process Domain Data
Data about the process domain included a detailed list ofproject activities (used internally by the company for projectmanagement and reporting) as well as their informationdependencies. After eliminating nondesign activities andactivities for which there was no valid match between aperson in the e-mail dataset and the activity log, a total of 66activities were determined to be suitable to form part of thedynamic network analysis. This final list was validated throughinterviews with the VP of Operations, VP of Engineering, andthe project manager in addition to the company’s own technicaldocumentation, which included workflow diagrams and Ganttcharts.
With the help of company engineers, the activities werecategorized into the 13 activity groups listed in Table IV. Thisfirst level of categorization was based on the identificationof cohesive work packages related to the subsystems underdevelopment or other common characteristics shared by theactivities. A process-type DSM was then created to identifythe planned relationships across the 13 activity groups. ThisDSM was based on information dependencies revealed bythe project managers and existing workflow diagrams. Theobjective of this DSM analysis was to classify the activitygroups in one of the three categories identified in Section III (in-tegrative work, integrative subsystem, and modular subsystemactivities).
Based on company records and internal experts’ knowledge,an approximate chronological sequence of stages was estab-lished: Conceptual design occurred during the first four monthsof the project, starting in September 2009 and finishing by De-cember 2009. System-level design was performed during a pe-riod of ten months, between January and October 2011. Detaileddesign was performed during a period of about 14 months, be-tween November 2011 and December 2012. Finally, system in-tegration was mainly performed during a period of five months,between January and May 2013.
Following the model proposed in Section III, the networkrepresentation of actual information flows between activitiesis calculated as a function of information exchanges betweenpeople and the participation of people in activities.
C. Process–Organization Mapping Data
Data for the mapping between the process and organizationdomain were obtained through a project-level activity log thatregisters each time any of the 66 activities was performed by amember of the project. This information was reported directlyin a database at least weekly by the person performing theactivity, who also logged the date when he or she performedthe activity and the amount of hours invested. These reports areroutinely used by the company to manage and track resourcesand to update the project budget and schedule. The level ofdetail available in this dataset, that in total amounted to 11742records, combined with the information about the organizationdomain, allowed us to identify most of the possible pathways ofinformation flow over time.
The person–activity network was built with people and activ-ities as nodes and with the participation of people in activities asedges. The weight of the edge between a person and an activitywas calculated by counting the number of activity records wherethe person reported work on an activity for each temporal snap-shot under analysis. This is equivalent to weighting activities byfrequency.
D. Dynamic Network Analysis
We analyzed one information flow network per stage, that isto say, all the activities and people active are analyzed togetherat each engineering design stage. As a result, the overallper-stage network structure is preserved and there is no needto use averages or other forms of aggregation that could affectnetwork metrics. An alternative to this method is to analyzeweekly or monthly network snapshots. However, the cost of thisalternative is to be exposed to higher network variability,which also imposes additional difficulties to interpret thenetwork results at the stage level. For simplicity, the analysisis performed symmetrizing the network [39, p. 216]. Thisis consistent with the fact that communication networkstend to be reciprocal [33], and avoids the interpretationallimitations of applying network metrics such as eigenvectorcentrality [38] and clustering coefficient [40], [41] to directednetworks.

PARRAGUEZ et al.: INFORMATION FLOW THROUGH STAGES OF COMPLEX ENGINEERING DESIGN PROJECTS: A DYNAMIC NETWORK 613
Fig. 3. Results of the empirical analysis by process stage and activity category. (a) Count of activities. (b) and (c) Network-level measures and Tukey box plotsfor centrality and clustering. All box plots show individual activities.

614 IEEE TRANSACTIONS ON ENGINEERING MANAGEMENT, VOL. 62, NO. 4, NOVEMBER 2015
TABLE VCASE STUDY RESULTS SUMMARY
Information Network Pattern Conceptual Design andSystem-Level Design
Detailed Design System Integration
General description In combination, these two stagesare characterized by a relativelylow number of activities, withclose to half of them related tointegrative work and integrativesubsystem activities.
The number of activities in thisstage increases, more thandoubling from the previous twostages. Also, there are many moremodular subsystem activities thanintegrative work and integrativesubsystem activities.
The number of activities remainsrelatively unchanged from theprevious detailed design stage.
Centrality Activity-level centrality The most central activity of thisstage is one from the integrativework category (part of the overallproject management group). Thisactivity reaches an informationcentrality of almost double thecentrality of any other activity inthese two stages.
The centrality of activities in themodular subsystem category ismuch greater, as these activitiesnow dominate the work. However,unlike the previous two stages,this higher centrality is nowalmost equally distributed amongactivities from differentsubsystems, including designactivities from the pressure partsgroup, air and flue gas group andexternal piping group.
The centrality of activities in themodular subsystem group is stillhigh. However, the increase in thecentrality of the integrative workcategory makes their centralitiesnow more comparable. This, inconjunction with a return to amore heterogeneous distributionof activities with high centrality(similar to the first two stages),provides evidence of a return to amore centralized network.
Network-level centralization Due to the influence of the mostcentral activity, the overallnetwork centralizations of thesetwo stages are higher than anyother stage.
Due to the more homogeneousdistribution of activities with highcentrality, the overall networkcentralization of this stage reacheshere the lowest level.
Overall centralization increasesreaching levels only slightlybelow the conceptual designstage.
Clustering Activity-level clustering The information networks ofthese stages are primarilyclustered around integrative workactivities belonging to the overallproject management group.
All activity categories experiencea higher level of clustering withintegrative subsystem activitiesreaching here their maximumvalue in terms of clustering andcentrality.
Clustering is much higher thanwhat was found in conceptual andsystem-level design. Clustering isalso lower in all categories whencompared to the detailed designstage.
Network-level clustering The overall network clustering ofthese two stages is lower than anyother stage.
The overall clustering coefficienthere is the highest among allstages.
The overall clustering coefficientdecreases but remains higher thanthe levels found in the conceptualand system-level design stages.
VI. ANALYTICAL RESULTS FROM THE CASE STUDY
In this section, we present the results of applying our modelof information flow between activities to the organization andprocess data from our case study. To focus on the evolvinginformation flow patterns discussed in Section IV, we showhere all network metrics calculated by process stage only.Also, given the relatively small amount of conceptual designwork in this particular project and the similarity of its expectedinformation flow patterns with system-level design, thesetwo stages have been combined. Such combination facilitatesdiscussion of the results and keeps the focus on the mostrelevant patterns. Fig. 3 and Table V show the results by stageand activity category. A full list of activities and their respectiveeigenvector centrality and clustering coefficient at each stage isavailable in Appendix B, found in the supplemental material.
A. Correspondence Between Theorized Information FlowPatterns and Empirical Results
Considering the results of the empirical analysis summarizedin Fig. 3 and Table V, we find a high match between the expectedpatterns for each process stage and the actual information flowpatterns. This tendency is evident, not only in the matching ofcentralization and clustering at the overall network level, butalso in terms of expected patterns at the activity category level.
For example, consistent with the expected informationpatterns set for each stage in Section IV, conceptual and
system-level designs were dominated by activities in theintegrative work category (more specifically in the overallproject management group). These two stages also had a rathercentralized information network and exhibited relatively lowprocess modularity. Detailed design was dominated by activitiesin the modular subsystem category (including multiple activitygroups), had a high process modularity (where coordinationtended to be local rather than global), and coordination wassupported not only by integrative work activities but also byintegrative subsystem activities. Finally, in system integration,the trend of high process modularity found in the previousstage was replaced by an increase in overall centralization,which can be linked to the expected subsystem integrationneeds.
VII. DISCUSSION
In light of our research questions, here we examine and dis-cuss what has been presented in the previous sections.
Research question #1: How can we model and analyze actual infor-mation flows between activities through stages of complex engineer-ing design projects?
This paper proposes a new model that integrates elementsfrom previous network-based process models, takes advantageof dynamic network analysis tools, and of increasingly availablerich data trails from activity logging systems, electronic projectmanagement tools, and internal communication platforms such

PARRAGUEZ et al.: INFORMATION FLOW THROUGH STAGES OF COMPLEX ENGINEERING DESIGN PROJECTS: A DYNAMIC NETWORK 615
as e-mails. The model builds on previous research on organiza-tional information flow, such as [20] and [21]; dynamic processmodels, such as [26] and [27]; and models that combine aspectsof process and organization architecture, such as [4] and [33]–[36], providing altogether an improved analytical understandingof the dynamic information flow through activities by processstages. In order to quantify information flow changes at the ac-tivity and project level, this paper introduces the use of networkcentrality and clustering metrics that provides a consistent andreplicable platform for analysis.
Addressing the need for a comparison base against whichto interpret empirical results of the proposed model, we alsotranslate qualitative systems engineering stage descriptions intoa theory of how information is expected to flow between activi-ties in different engineering system stages.
Research question #2: What are the implications, for theory andpractice, of a model to analyze actual information flows betweenactivities?
The application of this model allowed us to identify distinctand measureable patterns in information centrality and clus-tering associated with different stages of the design process.Having means to identify such patterns is crucial to provideinsights into the actual process and to start uncovering causalexplanations [14, p. 16]. For example, design patterns can becompared against models that provide abstract descriptions ofgeneric design processes. This also allows for a theoreticallygrounded interpretation of the patterns in light of previous re-search and what is suggested as best practices by prescriptivemodels.
In our case, the emergence of meaningful and interpretablepatterns from the dynamic analysis of a period of over threeyears and thousands of valued dyads serves as a positive proofof concept for the approach proposed here. Moreover, and basedon our empirical results, we claim that the information flowpatterns revealed are related to the progression of the project,and as a consequence can be compared against idealized genericmodels in order to identify, and if necessary correct, unexpectedand potentially undesirable information flow patterns.
A. Research Implications
As a theoretical contribution, we provide evidence of relation-ships between the proposed measures for information central-ity and information clustering and standard design stages. Thisserves to quantify information network properties for differ-ent stages of the design process, enriches previous descriptionsand interpretations of the stages, and allows design researchersto develop process models that better fit observed project pat-terns. Furthermore, the existence of such patterns also servesas a quantitative indication of distinct information networks inthe different PD [5] and systems engineering stages [31]. Thisprovides new evidence about the existence of distinct processstages that goes beyond a qualitative description of observablechanges in the process.
The observed information flow patterns also allow a mean-ingful macrolevel categorization of activities into three classesbased on their distinctive information centrality and clustering
patterns and evolution. This validates, complements, and ex-pands the categories introduced originally by Sosa et al. [28].We found that modular subsystem design activities, integrativesubsystem design activities, and integrative work design activ-ities are distinguishable not only based on company insights,observations, and static network models but also based on theircharacteristic network dynamics. This allows researchers to per-form simplified analyses, which instead of following the dy-namics of each activity or activity group, only need to study thepatterns of three activity categories to visualize a meaningfuldistribution of the information centrality and clustering linkedto SE-V process stages [31].
B. Practical Implications
Managerial implications include the provision of support togenerate a quantitative overview of real designing patterns andcompare them against prescriptive models, giving opportunitiesfor reflections and changes when this is required. In particular,we argue that under normal conditions, projects that implic-itly or explicitly follow the SE-V model, have a predictablepattern in terms of the evolution of information centrality andclustering among key activity categories. Deviations from theexpected patterns could be an indication of a mismatch betweenthe required architecture of information flows and the actualinformation flows in the project. Depending on the assessment,such deviations may require company actions or at least an un-derstanding of the reasons for such a mismatch.
When our analysis is applied at a detailed activity level, andthe appropriate tools to structure and analyze existent informa-tion are in place, our model can also be used to highlight periodsin the process where multiple areas concurrently increase theirinformation centrality, potentially draining resources and gen-erating complex coordination scenarios. Knowing more aboutthese periods can help to defer activities that do not need tobe concurrently active, while prioritizing the ones with coupledsubsystems that do require concurrency or iterations.
Another practical implication is based on an improved un-derstanding of the nature of integration activities in complexengineering design projects. Existing prescriptive models ofcomplex system design have either emphasized the high degreeof coordination and integration required in PD [37] or suggestedthat modular design reduces the requirements for such coordi-nation and integration [28]. In this paper, we offer more specificprescriptive guidance based on actual information flow patternsover the duration of the project—one that points to the differ-ence between integrative and modular design activities and theircoordination efforts over the duration of the project.
C. Limitations
The benefits of the proposed approach are realized mainlyon large-scale, complex engineering design projects followingsystems engineering stages. Conclusions will largely dependon already having a good understanding of the process andorganization architectures of the project under study. Further-more, the approach is reliant on abundant and accurate dynamicdata traces captured during the design process.

616 IEEE TRANSACTIONS ON ENGINEERING MANAGEMENT, VOL. 62, NO. 4, NOVEMBER 2015
VIII. CONCLUSION
Through the model developed in this paper, we offer means todynamically quantify and analyze actual information flows be-tween activities of complex engineering design projects, fillinga literature gap between dynamic process and dynamic orga-nization approaches. This model allows connecting otherwiseunknown designing patterns with stage-based models of thedesign process. As a result, opportunities for design processimprovements are created based on active progress monitoringand analysis. With increasingly ubiquitous information systemsthat continually create logs of activities, communication plat-forms, and our simplified activity categorization, this approachcan be used to support project management in engineering de-sign projects without increasing reporting demands upon designengineers and project managers. The three key contributions ofthis paper are the development of a theory toward the evolu-tion of information flows through systems engineering stages,a methodological contribution consistent of a network model toquantify information flows between activities, and an empiricalapplication of the proposed approach that shows an empirical re-lationship between information flow patterns and process stageswhich is consistent with theoretical expectations.
Opportunities for further research include the examination ofthe same model and type of datasets when the unit of analysisis people instead of activities, enabling the study of questionsat the organizational level. Also interesting are comparisons ofinformation centrality measures across different projects and in-dustries, which would allow evaluating if the overall patterns areubiquitous or are project or industry specific. In addition, moreresearch is required to explore the evolution of other networkmeasures and their interplay with centrality measures. Finally,further studies could use dynamic network measures as indepen-dent variables and performance as a dependent variable in orderto establish concrete connections between network structure andresults.
REFERENCES
[1] M. Sosa, M. Gargiulo, and C. Rowles, “Inter-team technical communi-cation in complex new product development projects,” INSEAD WorkingPaper, 2014/42/TOM/OBH, 2014.
[2] S. D. Eppinger and T. R. Browning, Design Structure Matrix Methods andApplications. Cambridge, MA, USA: MIT Press, 2012.
[3] E. Crawley, O. de Weck, S. D. Eppinger, C. L. Magee, J. Moses, W.Seering, J. Schindall, D. Wallace, and D. E. Whitney, The Influence ofArchitecture in Engineering Systems. Cambridge, MA, USA: MIT Press,2004.
[4] C. Durugbo, W. Hutabarat, A. Tiwari, and J. R. Alcock, “Modelling col-laboration using complex networks,” Inf. Sci. (Ny)., vol. 181, no. 15, pp.3143–3161, Aug. 2011.
[5] K. T. Ulrich and S. D. Eppinger, Product Design and Development. NewYork, NY, USA: McGraw-Hill Irwin, 2012.
[6] C. M. Eckert, A. M. Maier, and C. McMahon, “Communication in design,”in Design Process Improvement: A review of current practice, J. Clarksonand C. Eckert, Eds. New York, NY, USA: Springer, 2005.
[7] T. R. Browning and R. V Ramasesh, “A survey of activity network-basedprocess models for managing product development projects,” Prod. Oper.Manage., vol. 16, no. 2, pp. 217–240, Jan. 2007.
[8] D. C. Wynn, “Model-based approaches to support process improvementin complex product development,” Ph.D. dissertation, Dept. Eng., Univ.Cambridge, Cambridge, U.K., 2007.
[9] K. Gericke and L. Blessing, “An analysis of design process models acrossdisciplines,” in Proc. 12th Int. Design Conf., 2012, pp. 171–180.
[10] V. Hubka, M. M. Andreasen, and W. E. Eder, Practical Studies in System-atic Design. London, U.K.: Butterworth-Heinemann, 1988.
[11] L. L. Bucciarelli, “An ethnographic perspective on engineering design,”Des. Stud., vol. 9, no. 3, pp. 159–168, Jul. 1988.
[12] H. A. Simon, The Sciences of the Artificial. Cambridge, U.K.: MIT Press,1996.
[13] A. M. Maier, C. M. Eckert, and P. J. Clarkson, “A meta-model for com-munication in engineering design,” CoDesign, vol. 1, no. 4, pp. 243–254,Dec. 2005.
[14] P. J. Clarkson and C. M. Eckert, Design Process Improvement: A Reviewof Current Practice. New York, NY, USA: Springer, 2005.
[15] T. Allen, “Organizational structure, information technology and R&Dproductivity,” IEEE Trans. Eng. Manage., vol. EM-33, no. 4, pp. 212–217, Nov. 1986.
[16] D. A. Batallas and A. A. Yassine, “Information leaders in product devel-opment organizational networks: Social network analysis of the designstructure matrix,” IEEE Trans. Eng. Manage., vol. 53, no. 4, pp. 570–582,Nov. 2006.
[17] D. H. Sonnenwald, “Communication roles that support collaboration dur-ing the design process,” Des. Stud., vol. 17, pp. 277–301, 1996.
[18] J. Kratzer, H. Gemuenden, and C. Lettl, “The organizational design oflarge R&D collaborations and its effect on time and budget efficiency:The contrast between blueprints and reality,” IEEE Trans. Eng. Manage.,vol. 58, no. 2, pp. 295–306, May 2011.
[19] L. Hossain, “Effect of organizational position and network centrality onproject coordination,” Int. J. Proj. Manage., vol. 27, no. 7, pp. 680–689,Oct. 2009.
[20] L. Hossain, S. T. Murshed, and S. Uddin, “Communication network dy-namics during organizational crisis,” J. Inform., vol. 7, no. 1, pp. 16–35,Jan. 2013.
[21] Y. H. Kidane and P. A. Gloor, “Correlating temporal communicationpatterns of the Eclipse open source community with performance andcreativity,” Comput. Math. Organ. Theory, vol. 13, no. 1, pp. 17–27,2007.
[22] J. A. Gopsill, S. Jones, C. Snider, L. Shi, C. McMahon, and B. J. Hicks,“Understanding the engineering design process through the evolution ofengineering digital objects,” in Proc. 13th Int. Design Conf., 2014, pp.1773–1784.
[23] P. Cash, T. Stankovic, and M. Storga, “Using visual information analysisto explore complex patterns in the activity of designers,” Des. Stud., vol.35, no. 1, pp. 1–28, Jan. 2014.
[24] D. Braha and Y. Bar-Yam, “Information flow structure in large-scale prod-uct development organizational networks,” J. Inf. Technol., vol. 19, no. 4,pp. 244–253, Nov. 2004.
[25] S. K. Sim and A. H. B. Duffy, “Towards an ontology of generic engineeringdesign activities,” Res. Eng. Des., vol. 14, no. 4, pp. 200–223, Nov. 2003.
[26] S. T. Collins, J. Bradley, and A. A. Yassine, “Analyzing product develop-ment task networks to examine organizational change,” IEEE Trans. Eng.Manage., vol. 57, no. 3, pp. 513–525, Aug. 2010.
[27] D. Braha and Y. Bar-Yam, “The statistical mechanics of complex productdevelopment: Empirical and analytical results,” Manage. Sci., vol. 53, no.7, pp. 1127–1145, Jul. 2007.
[28] M. E. Sosa, S. D. Eppinger, and C. M. Rowles, “Identifying modular andintegrative systems and their impact on design team interactions,” J. Mech.Des., vol. 125, no. 2, p. 240, 2003.
[29] A. M. Maier, M. Kreimeyer, C. Hepperle, C. M. Eckert, U. Lindemann, andP. J. Clarkson, “Exploration of correlations between factors influencingcommunication in complex product development,” Concurr. Eng., vol. 16,no. 1, pp. 37–59, Mar. 2008.
[30] D. Wynn and J. Clarkson, “Models of designing,” in Design ProcessImprovement: A Review of Current Practice, J. Clarkson and C. Eckert,Eds. New York, NY, USA: Springer, 2005.
[31] C. Haskins, K. Forsberg, M. Krueger, D. Walden, and R. D. Hamelin,Systems Engineering Handbook. San Diego, CA, USA: Int. Council Syst.Eng., Oct. 2011.
[32] T. J. Howard, S. J. Culley, and E. Dekoninck, “Describing the cre-ative design process by the integration of engineering design and cog-nitive psychology literature,” Des. Stud., vol. 29, no. 2, pp. 160–180,Mar. 2008.
[33] M. D. Morelli, S. D. Eppinger, and R. K. Gulati, “Predicting technicalcommunication in product development organizations,” IEEE Trans. Eng.Manage., vol. 42, no. 3, pp. 215–222, Aug. 1995.
[34] M. E. Sosa, S. D. Eppinger, and C. M. Rowles, “The misalignment ofproduct architecture and organizational structure in complex product de-velopment,” Manage. Sci., vol. 50, no. 12, pp. 1674–1689, Dec. 2004.

PARRAGUEZ et al.: INFORMATION FLOW THROUGH STAGES OF COMPLEX ENGINEERING DESIGN PROJECTS: A DYNAMIC NETWORK 617
[35] A. A. Yassine, D. E. Whitney, S. Daleiden, and J. Lavine, “Connectiv-ity maps: Modeling and analysing relationships in product developmentprocesses,” J. Eng. Des., vol. 14, no. 3, pp. 377–394, 2003.
[36] M. S. Maurer, “Structural awareness in complex product design,” Ph.D.dissertation, Dept. Mech. Eng., Tech. Univ. Munchen, Munich, Germany,2007.
[37] T. R. Browning, “Process integration using the design structure matrix,”Syst. Eng., vol. 5, no. 3, pp. 180–193, 2002.
[38] P. Bonacich, “Power and centrality: A family of measures,” Amer. J. So-ciol., vol. 92, no. 5, pp. 1170–1182, 1987.
[39] S. Wasserman and K. Faust, Social Network Analysis: Methods and Ap-plications. Cambridge, U.K.: Cambridge Univ. Press, 1994.
[40] A. Barrat, M. Barthelemy, R. Pastor-Satorras, and A. Vespignani, “Thearchitecture of complex weighted networks,” Proc. Natl. Acad. Sci. USA,vol. 101, pp. 3747–3752, 2004.
[41] D. J. Watts and S. H. Strogatz, “Collective dynamics of ‘small-world’networks,” Nature, vol. 393, no. 6684, pp. 440–442, 1998.
[42] R. A. Hanneman and M. Riddle, Introduction to Social Network Methods.Riverside, CA, USA: Univ. California, 2005.
[43] S. Borgatti, “Centrality and network flow,” Soc. Netw., vol. 27, no. 1, pp.55–71, Jan. 2005.
[44] S. Fortunato, “Community detection in graphs,” Phys. Rep., no. 486, pp.75–174, Jun. 2010.
Pedro Parraguez received the M.Sc. degree in inno-vation and technology management from the Univer-sity of Bath, Bath, U.K., in 2010, and the Ph.D. degreein engineering systems from the Technical Universityof Denmark (DTU), Kgs. Lyngby, Denmark, in 2015.
He is currently a Postdoctoral Researcher with theEngineering Systems Group, DTU. He was also anentrepreneur, consultant in innovation and technol-ogy transfer, and university lecturer. His current re-search interests include complex engineering designprocesses, interface management, network analysis
of sociotechnical systems, information flows, and innovation in design. He iscurrently involved in data-driven research and industrial projects using digitaltraces to better understand and support the design of complex systems.
Dr. Parraguez is a Member of the Design Society, a Fellow of the U.K.Foreign and Commonwealth Office Chevening Programme, and was selectedas one of the 100 Young Chilean Leaders in 2008.
Steven D. Eppinger received the M.Sc. and Ph.D.degrees in mechanical engineering from the Mas-sachusetts Institute of Technology (MIT), Cam-bridge, MA, USA, in 1988 and 1993, respectively.
He is the General Motors LGO Professor withthe Sloan School of Management, MIT. His currentresearch interests include the management of com-plex engineering design processes. He has authoredor coauthored articles in Management Science, theASME Journal of Mechanical Design, Research inEngineering Design, the Journal of Engineering De-
sign, Harvard Business Review, Sloan Management Review, and other publi-cations. He is the coauthor of the widely used textbook Product Design andDevelopment (McGraw-Hill) and Design Structure Matrix Methods and Appli-cations (MIT Press) in 2012.
Dr. Eppinger is a Member of INFORMS and the Design Society.
Anja M. Maier received the M.A. degree in politi-cal science, communication science, and philosophyfrom the University of Muenster, Muenster, Germany,in 2002 and the Ph.D. degree in engineering designfrom the University of Cambridge, Cambridge, U.K.,in 2007.
She is currently a Professor of Engineering Sys-tems with the Technical University of Denmark, Lyn-gby, Denmark. She was also a Consultant in the man-ufacturing and software industries. Her current re-search interests include engineering systems design,
with a particular emphasis on complexity and human behavior. This includesinterface management, collaborative designing, and design communication. Shehas authored or coauthored articles in the Journal of Engineering and Technol-ogy Management, the Journal of Engineering Design, the International Journalof Design, Co-design, and other publications.
Dr. Maier is a Member of the Advisory Board of the Design Society, a Mem-ber of the International Council on Systems Engineering, and a Fellow of theCambridge Philosophical Society.