geographicalinformationsystemsandlocationscienceratt.ced.berkeley.edu/readings/gis_readings/church_2002.pdffig.1....
TRANSCRIPT
Computers & Operations Research 29 (2002) 541}562
Geographical information systems and location science
Richard L. Church
The National Center for Geographical Information and Analysis and the Department of Geography, University of California atSanta Barbara, Santa Barbara, CA 93106-4060, USA
Abstract
Since the 1970s the "eld of Geographical Information Systems (GIS) has evolved into a mature researchand application area involving a number of academic "elds including Geography, Civil Engineering,Computer Science, Land Use Planning, and Environmental Science. GIS can support a wide range of spatialqueries that can be used to support location studies. GIS will play a signi"cant role in future location modeldevelopment and application. We review existing work that forms the interface between GIS and LocationScience and discuss some of the potential research areas involving both GIS and Location Science.
Scope and purpose
During the past 30 years there have been many developments in spatial data analysis, spatial data storageand retrieval, and mapping. Many of these developments have occurred in the "eld of GeographicalInformation Science. Geographical Information Systems software now supports many elementary andadvanced spatial analytic approaches including the production of high quality maps. GIS will have a majorimpact on the "eld of Location Science in terms of model application and model development. The purposeof this paper is to explore the interface between the "eld of Location Science and GIS. � 2002 ElsevierScience Ltd. All rights reserved.
Keywords: Geographical information systems (GIS); Geographical information science; Facility location; Site selection
1. Introduction
Geographical information systems (GIS) are designed to store, retrieve, manipulate, analyze, andmap geographical data. The central element of a GIS is the use of a location referencing system sothat data about a speci"c location can be analyzed in its relationship to other locations. Both planeand global coordinate systems are commonly used. A systemmay be capable of easily transformingone referencing system (e.g. Universal Tranverse Mercator (UTM)) to some other referencing
E-mail address: [email protected] (R.L. Church)
0305-0548/02/$ - see front matter � 2002 Elsevier Science Ltd. All rights reserved.PII: S 0 3 0 5 - 0 5 4 8 ( 9 9 ) 0 0 1 0 4 - 5

system (e.g. State Plane Coordinates). This makes it possible to take data that has been stored inone form and combine it with data that has been entered and stored in some other form. The use ofGIS has come of age as a result of several interrelated factors. First, there are many GIS softwareproducts that are available from commercial vendors and universities. Second, computer worksta-tions are now capable of handling many of the computational, retrieval, and storage problemswithin a reasonable amount of time and at reasonable cost. Third, graphical displays and plottersare now sophisticated and fast, producing high-quality and high-resolution output. Fourth,geographic data vendors as well as governmental agencies such as the Bureau of the Census of theUS Government have made large amounts of geographic data available at reasonable cost. Fifth,the use of remote sensing has expanded, especially in environmental monitoring, and this has led tothe need for systems that are capable of handling large amounts of data as well as serve as a majorsource of land coverage information. Sixth, the emergence of the satellite based Global PositioningSystem (GPS) has made it easy to collect attribute data along with its location at relatively low costand with relatively high accuracy. Each of these factors has contributed to the growth of the GISindustry.It is now common to see GIS software in use in municipalities, states, utilities, and governmental
agencies like the US Forest Service, transportation companies, and consulting "rms. Such systemsrange from simple, limited systems to large, complex software systems. Many utilize commercialo!-the-shelf systems, but some agencies and companies have developed their own proprietarysystems. There are now many trade magazines and journals that are devoted to aspects of GIS, andmany universities maintain special GIS laboratories and o!er specialized classes in GIS. The merefact that GISs are used to store, retrieve, and map geographic data should be of interest topractitioners of Location Science. But, just what makes GIS so important to the "eld of LocationScience? Are there aspects of Location Science that are inextricablly linked with GIS? Just what arethe emerging problems related to GIS and Location Science? The objective of this paper is toprovide a review of GIS and Location modeling with the purpose of addressing these questions.
2. Background
There are two fundamentally di!erent types of GIS software. They di!er in terms of the datamodel, i.e., the means for storing geographical data. Since the real world is so complex, it wouldtake an in"nitely large database to capture the real world precisely. Data therefore must begeneralized or abstracted to reduce it to somemanageable quantity. Data are represented as a "niteset of objects. The two principal data models are raster and vector. The raster model divides thestudy area into a regular grid of cells, each cell contains a single value. One set of cells andassociated values is a layer and a database typically contains many layers (e.g., land cover,elevation, soil type, etc.). The vector data model uses discrete line segments (or vectors) and pointsto represent locations. The vector data model can represent points, lines, and areas. Areas in thevector data model are de"ned by a string of vectors (each vector in the string starts where theprevious one ends) where the beginning vector of the string starts at the same point that the lastvector in the string ends, thereby enclosing an area. Each area in the raster model is of equal sizeand shape, whereas the vector data model can represent areas of varying sizes and shapes. The useof a speci"c system may depend upon the intended need, the form that data is collected, and cost.
542 R.L. Church / Computers & Operations Research 29 (2002) 541}562
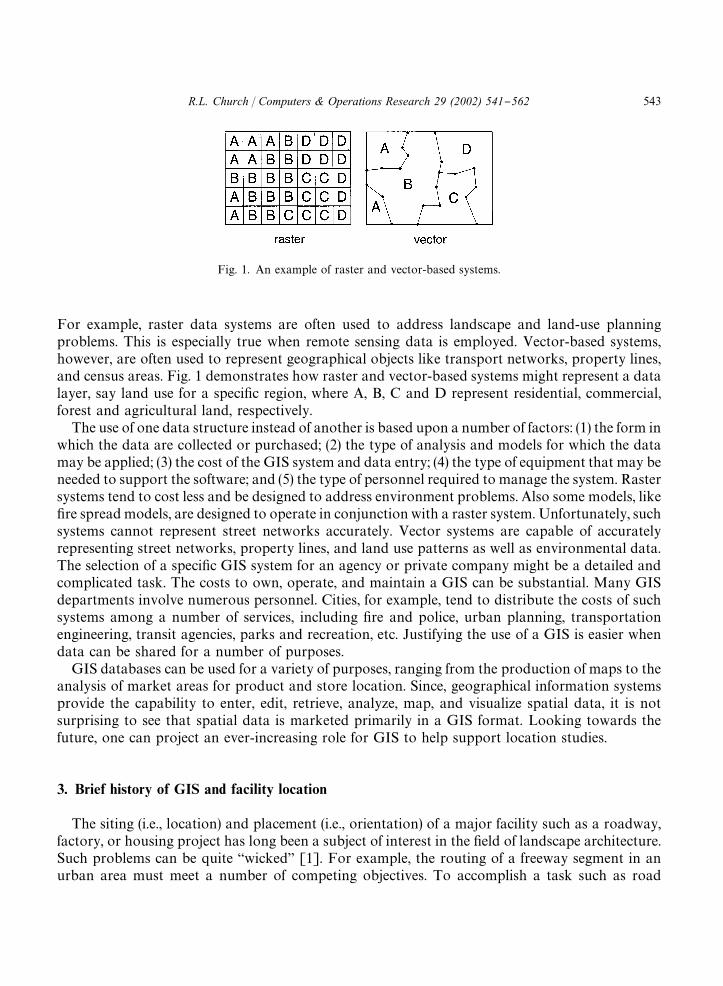
Fig. 1. An example of raster and vector-based systems.
For example, raster data systems are often used to address landscape and land-use planningproblems. This is especially true when remote sensing data is employed. Vector-based systems,however, are often used to represent geographical objects like transport networks, property lines,and census areas. Fig. 1 demonstrates how raster and vector-based systems might represent a datalayer, say land use for a speci"c region, where A, B, C and D represent residential, commercial,forest and agricultural land, respectively.The use of one data structure instead of another is based upon a number of factors: (1) the form in
which the data are collected or purchased; (2) the type of analysis and models for which the datamay be applied; (3) the cost of the GIS system and data entry; (4) the type of equipment that may beneeded to support the software; and (5) the type of personnel required to manage the system. Rastersystems tend to cost less and be designed to address environment problems. Also some models, like"re spreadmodels, are designed to operate in conjunction with a raster system. Unfortunately, suchsystems cannot represent street networks accurately. Vector systems are capable of accuratelyrepresenting street networks, property lines, and land use patterns as well as environmental data.The selection of a speci"c GIS system for an agency or private company might be a detailed andcomplicated task. The costs to own, operate, and maintain a GIS can be substantial. Many GISdepartments involve numerous personnel. Cities, for example, tend to distribute the costs of suchsystems among a number of services, including "re and police, urban planning, transportationengineering, transit agencies, parks and recreation, etc. Justifying the use of a GIS is easier whendata can be shared for a number of purposes.GIS databases can be used for a variety of purposes, ranging from the production of maps to the
analysis of market areas for product and store location. Since, geographical information systemsprovide the capability to enter, edit, retrieve, analyze, map, and visualize spatial data, it is notsurprising to see that spatial data is marketed primarily in a GIS format. Looking towards thefuture, one can project an ever-increasing role for GIS to help support location studies.
3. Brief history of GIS and facility location
The siting (i.e., location) and placement (i.e., orientation) of a major facility such as a roadway,factory, or housing project has long been a subject of interest in the "eld of landscape architecture.Such problems can be quite `wickeda [1]. For example, the routing of a freeway segment in anurban area must meet a number of competing objectives. To accomplish a task such as road
R.L. Church / Computers & Operations Research 29 (2002) 541}562 543

location, McHarg [2] proposed an approach which deals with the preparation of a number ofmaps, each with a di!erent theme. Each land-based unit on a map (whether raster or vector-based)would be colored from light (very suitable) to dark (not suitable or compatible). Each map wouldrepresent a theme such as current land-use compatibility (many other important themes exist aswell: presence of wetlands, soil properties, slope, historical structures, etc.). ForMcHarg, such mapswere drawn on clear actetate sheets. By superimposing the sheets on top of each other and viewingthe composite map of all colors and themes, areas which appear light are highly suitable and thosethat are dark are not. McHarg then argued that this information as a map could then be used toidentify the best route connecting two points or identifying the best location for a speci"c function.Much of the site suitability analysis utilized in GIS today resembles the basic mapping ideasexposed by McHarg.Siting analysis with GIS began in the 1970s with Kiefer and Robbins [3], Durfee [4], Voelker [5]
and Dobson [6]. One of the best early examples of such work is that of Dobson [6]. The probleminvolved identifying those sites in the State of Marylandwhich could be used for a power plant. TheState of Maryland had initiated a special utility tax in order to purchase sites and place them intoa site bank for future use. Such sites could be zoned for future utility use as well as be monitored forenvironmenal purposes over a long period of time. For the purposes of site search, the state wasdivided into approximately 32,000 cells, each measuring approximately 2000 ft on a side. Numer-ous parameters were measured in each cell including land use, land cover, proximity to roads,seismicity, soil, presence of water, distance to transmission grid, population density, etc. A weightedsuitability score was determined for each cell and a map was produced for those cells that scored inthe approximate top 15%. Such a process mimics the approach of McHarg. Dobson utilizedseveral nominal groups to determine weights to apply for each siting criterion. The process ofcombining data layers, each weighted by some factor, can now be easily accomplished in mostGISs. Some provide interfaces to help determine appropriate weights. For example, the IDRISI [7]system (IDRISI is named after a medieval geographer from North Africa and is the product ofClark University) contains a module for such siting which involves the use of the AnalyticHierarchy Process. A good example of suitability analysis applied to habitat identi"cationand protection can be found in Pereira and Duckstein [8]. At the very least, suitability mapsthat are created within a GIS by combining various data layers can be used to screen outinfeasible and undesirable sites (e.g., site drains poorly or soils are unstable). When multiplefacilities are not involved or when allocations are "xed, such a process might be used to identify thebest site.Location models have often been classi"ed in the literature based upon the number of facilities
being located; e.g., Brandeau and Chiu [9]. Many single facility location models are computation-ally less complex than their multiple facility location model counterparts. Consider the criteria forsiting a factory. Assume that the site must be at least 10 acres and that utilities must be present.Further assume that the site must be already zoned for industrial use and that a highway must bewithin 1-mile of the site. Such a search can often be accomplished with a GIS given that the data ispresent to support the task. First, it is necessary to identify which parcels of land are at least 10acres in size and are zoned for industrial use. Then, it is necessary to identify which sites are withina mile of a highway. Often such a query is performed by "rst excluding all sites that are more than1-mile from a highway, using a common GIS function called bu!ering. Then, one attempts toidentify from what is left the set of sites which meet the utility and zoning criteria. From the set of
544 R.L. Church / Computers & Operations Research 29 (2002) 541}562
feasible sites, it is then possible to evaluate them using other criteria, including proximity tocustomers, labor force, raw materials, etc. Changes in criteria can be made interactively (e.g.,moving from a 1-mile bu!er to a 1.5-mile bu!er) within a GIS, allowing the analyst to study thee!ect of a constraint on the number and location of feasible parcels. Although such site searchesseem simple, and they are, they do support the bulk of the site selection problems in industry andcommerce. More sophisticated search procedures have been applied in a GIS or spatial decisionsupport context [10,11]. Carver [12] has integrated a multi-criteria approach with GIS forsuitability analysis. Trade publications like GIS World include many advertisements for "rms thatprovide related GIS services for commercial, retail and idustrial site selection.A good example of market analysis and siting can be found in the paper of Marks et al. [13]; see
also Goodchild [14], Birken [15] and Longley and Clarke [16]. Their paper deals with thepotential siting of hospitals to provide cost-e!ective health care. Their approach utilized a numberof siting criteria for ranking potential sites. They included existing facilities and their capacities,distances to other facilities and metropolitan areas, percent of population older than age 65,existing land use, site availability, percent slope, and the availability of existing infrastructureservices such as water and sewer. They applied their approach to the State of Maryland, using theMaryland Automated Geographic Information (MAGI) database which is maintained by the Stateof Maryland O$ce of Planning. This database was used along with road information and placenames from the US Geological Survey, ZIP code boundaries from Equiax Corp, and healthstatistics from the Maryland Center for Health Statistics. They used a raster-based GIS calledSPANS to map contours of service from existing facilities and contours of demand. Demand wasbased on population of various age groups weighted by a demand factor. A di!erence map ofdemand and service contours represented demand that exists but is not served by a close facility.Gaps in service were used along with the availability of infrastructure to identify potential sites fornew facilities. They assumed that a new hospital could be placed in each area that had enoughexcess demand to justify an additional hospital. They presented their results as `optimala eventhough there was no `formala optimization model. Such siting studies tend to present their resultsas optimal, under the assumption that the optimal sites are those that have the highest value of thesuitability index. If the problem involves some form of demand allocation among the facilities oraccessibility is a factor, then such solutions are probably not optimal on the suitability index. Suchmisconceptions are somewhat common in the GIS literature.At the least, GIS can be used to screen out poor and/or infeasible sites in a logical manner.
Accessibility is often a consideration in location problems and one frequently used measure ofaccessibility is distance [17,18]. GIS provides the capability to rapidly combine and screennumerous databases and allows the analyst to consider more appropriate and speci"c criteria. Forexample, Aultman-Hall [19] give an interesting example of using a GIS for examining pedestrianaccessibility in a neighborhoods and Lindquist [20] has used GIS to show the accessibility of areasto bus stops on transit routes in Seattle, WA.
4. Bridging between traditional location models and GIS
When Revelle and Swain [21] "rst published an integer linear programming formulation of thep-median problem, they gave results based upon a 55 node data set. Subsequent testing and
R.L. Church / Computers & Operations Research 29 (2002) 541}562 545
analysis has reused this data set numerous times. In 1970, few data sets of spatial demand existed,and what existed were small (i.e., less than 75 nodes). One major element controlling problem sizewas the fact that most problems that were larger than 75 nodes could not be solved optimally.A further complication was that data for location models were also collected in some aggregatedform. For example, the Swain 55 node data set represented the centroids of 55 postal codes in theWashington, DC metroploitan area. The "rst published comparison of several approaches tosolving the p-median problem utilized a 49 node data set representing a small region of India [22].With GIS, data can be characterized at a "ner level of detail or scale. It is possible to representa municipality at the level of discrete demand (e.g., student addresses), or some level of aggregationlike block faces, address ranges on street segments, intersections, etc. The size of such problems canbe considerably larger than the type of data sets used in past location studies. Either demand ischaracterized at such a level or it is aggregated. With the availability of GIS, this can be a real choice.Obvious to many location modelers, GIS may be a signi"cant aid in collecting and organizing
spatial data for the application of a location model. For example, assume that a spatial data set ofall road information were available in a geographical region along with point data associated withdemand locations. Further, assume that land use, land zoning and land availablity is alsocharacterized in additional data layers. Then it might be possible to identify potentially feasiblesites as well as calculate the distances between feasible sites and demand points. Thus, givensuitable data of a region, it may be possible to generate data for a speci"c location modelapplication. Further, as the quality of the data improves and as the level of accuracy increases, it ispossible to characterize the landscape upon which the location model is to be applied toa signi"cant level of detail. As an example, Honey et al. [23] have addressed a school resourcesplanning problem for the entire State of Iowa using a GIS data base and a location model. Facingproblems utilizing thousand of nodes for both demand and sites is not uncommon. This means thatalgorithms need to be capable of handling such sizes or that appropriate methods of aggregationneed to be developed.A main bene"t that can be derived from a GIS is that data collected and stored in a GIS for one
purpose can be easily made available to a number of applications, including location modeling,thereby sharing the costs of data collection and storage. It is now possible to purchase data sets,like road networks, for many regions and municipalities in the US. For example, much of the roadnetwork in California has been stored in a digital form by companies including Thomas Brothers,Inc., Etak and Navtech. Further, the US Bureau of the Census, in a database called Tiger, hascharacterized all areas of the US. There are also many companies which specialize in collecting andselling data that can be used to characterize demand, transport linkages, and potential sites (see, forexample, the data and services advertised in Business Geographics). This does not even account forthe type of data that may be available within a given organization associated with a currentcustomer data base. Thus, it is understandable that such data will be used, if at all possible, ina location study. The easiest way to access such data is through the use of a GIS. With a GIS,several databases may be combined and used simulataneously and somewhat e!ortlessly by theanalyst, even when that data might have been entered with di!erent scale, coordinates, and maptransformation. Typical GIS functionality includes the capability to access such data andtransform it into a common set of coordinates. If such functionality is provided by GIS, then it isnot necessary to redevelop the same functionality in a location model outside of a GIS. Conse-quently, it seems reasonable to expect that many siting applications will involve a data storage
546 R.L. Church / Computers & Operations Research 29 (2002) 541}562
system that is a combination of GIS data "les and company or public records. Thus, GIS will atleast serve as a data repository and help assemble data from di!erent sources in many futurelocation studies.Not only can the GIS serve as the source of input data for a location model, it can also be used to
present model results. It is not di$cult to export data from a GIS to support a location model,solve a location model using special purpose software, and then import the results back to the GISfor mapping and display. Such GIS display systems as ARC/View can be used to present resultsthat have either been generated within the ARC/Info GIS or inported to ARC/Info. Several GISsare available which allow the development of a customized application and display. For example,the MapInfo system makes it very easy to apply to a location study, especially for retail or servicesite selection. An interesting example of the use of MapInfo in a location study has been presentedby Camm et al. [24]. That analysis involved the North American operations of Proctor andGamble. Camm et al. disaggregated their problem into a warehouse component and a product-sourcing and distribution component. They argued that the warehouse location problem was notas sensitive to the product sourcing as it was to the location of the customers. By dividing theproblem into two major components, simpler models could be applied. They developed a softwaredecision support system which utilized the MapInfo GIS and a mixed integer-linear programmingsolver. Their system lead to a plan which will reduce Proctor and Gamble's facilities by 20% andresult in saving $200 million each year.Often the data structures that are used to store and manipulate map information are not the
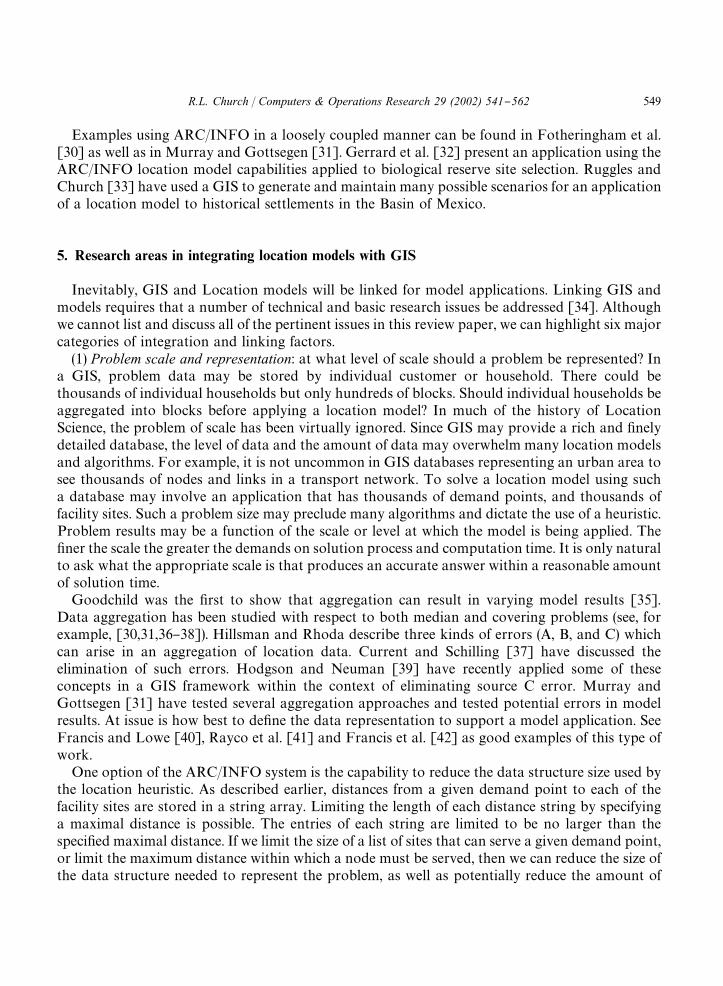
same as those used in the solution of a location model. For a speci"c location model, the datastructure may be important in order to support an e$cient solution code. Consequently, it makessense to export spatial data and transform to a form that is suitable for the location algorithm,execute the location algorithm and then transform the results back into a form that can beimported into the GIS. We will call such an approach to location modeling and GIS a looselycoupled approach, where a data bridge is set up to export and translate data between the twostructures. This is the approach taken by Environmental Science Research Institute (ESRI) indeveloping the capability for solving p-median problems with the ARC/INFO system. TheARC/INFO system calculates distances between each demand point and all of the facility sites andexports the data to an external data "le. For each demand point the distances to the facility sites arestored in order of increasing distance. A separate array string contains the indices of the associatedsites in the same order. The distance strings utilize the format speci"ed by Densham and Rushton[25]. Then, if a desired p-median problem is to be solved, ARC/INFO then executes a locationheuristic that reads the distance strings "le and solves the location problem. ARC/INFO employsboth the Teitz and Bart [26] heuristic and the Global Regional Interchange Algorithm (GRIA) ofDensham and Rushton [27]. This loosely coupled approach takes advantage of the data structurethat has been developed for the location algorithm as well as the data structures for the GIS. Oncethe model has been solved a solutions "le is imported into ARC/INFO and the result can bedisplayed using several options. An example of the `spider displaya for a location problem is givenin Fig. 2. The results depict a 4-median problem solved for data depicting the Swain 55 nodeproblem. The system is designed to handle thousands of demand nodes and thousands of facilitysites.ESRI has made it possible to heuristically solve p-median problems and display solutions using
a GIS. TRANSCAD also provides the capability of solving location problems with GISplus. It is
R.L. Church / Computers & Operations Research 29 (2002) 541}562 547

Fig. 2. Spider display depciting a solution to the p-median problem.
reasonable to expect that other systems will emerge in the near term that will provide thiscapability as well. The capability of solving a p-median problem may seem somewaht limited at"rst, but upon closer observation, one can easily see that a p-median solution heuristic canalso solve covering and attendance models [28,29]. In fact, the ARC/INFO system with thenetwork module readily solves such problems as the maximal covering location problem and theattendance-maximizing problem. To make such a model integration robust requires addressingseveral important issues. These will be discussed in the next section of this paper.
548 R.L. Church / Computers & Operations Research 29 (2002) 541}562
Examples using ARC/INFO in a loosely coupled manner can be found in Fotheringham et al.[30] as well as in Murray and Gottsegen [31]. Gerrard et al. [32] present an application using theARC/INFO location model capabilities applied to biological reserve site selection. Ruggles andChurch [33] have used a GIS to generate and maintain many possible scenarios for an applicationof a location model to historical settlements in the Basin of Mexico.
5. Research areas in integrating location models with GIS
Inevitably, GIS and Location models will be linked for model applications. Linking GIS andmodels requires that a number of technical and basic research issues be addressed [34]. Althoughwe cannot list and discuss all of the pertinent issues in this review paper, we can highlight six majorcategories of integration and linking factors.(1) Problem scale and representation: at what level of scale should a problem be represented? In
a GIS, problem data may be stored by individual customer or household. There could bethousands of individual households but only hundreds of blocks. Should individual households beaggregated into blocks before applying a location model? In much of the history of LocationScience, the problem of scale has been virtually ignored. Since GIS may provide a rich and "nelydetailed database, the level of data and the amount of data may overwhelm many location modelsand algorithms. For example, it is not uncommon in GIS databases representing an urban area tosee thousands of nodes and links in a transport network. To solve a location model using sucha database may involve an application that has thousands of demand points, and thousands offacility sites. Such a problem size may preclude many algorithms and dictate the use of a heuristic.Problem results may be a function of the scale or level at which the model is being applied. The"ner the scale the greater the demands on solution process and computation time. It is only naturalto ask what the appropriate scale is that produces an accurate answer within a reasonable amountof solution time.Goodchild was the "rst to show that aggregation can result in varying model results [35].
Data aggregation has been studied with respect to both median and covering problems (see, forexample, [30,31,36}38]). Hillsman and Rhoda describe three kinds of errors (A, B, and C) whichcan arise in an aggregation of location data. Current and Schilling [37] have discussed theelimination of such errors. Hodgson and Neuman [39] have recently applied some of theseconcepts in a GIS framework within the context of eliminating source C error. Murray andGottsegen [31] have tested several aggregation approaches and tested potential errors in modelresults. At issue is how best to de"ne the data representation to support a model application. SeeFrancis and Lowe [40], Rayco et al. [41] and Francis et al. [42] as good examples of this type ofwork.One option of the ARC/INFO system is the capability to reduce the data structure size used by
the location heuristic. As described earlier, distances from a given demand point to each of thefacility sites are stored in a string array. Limiting the length of each distance string by specifyinga maximal distance is possible. The entries of each string are limited to be no larger than thespeci"ed maximal distance. If we limit the size of a list of sites that can serve a given demand point,or limit the maximum distance within which a node must be served, then we can reduce the size ofthe data structure needed to represent the problem, as well as potentially reduce the amount of
R.L. Church / Computers & Operations Research 29 (2002) 541}562 549

computation work needed to execute an algorithm [25,29]. To do this makes sense, given thatproblems may tend to be very large in terms of number of sites and demand points. Further, if weare locating 20 facilities across a network of several thousand nodes, is it really necessary togenerate the distances between all pairs of demands and sites? Are there not some we can drop,given that we are locating 20 sites? Rosing et al. [43] discuss the fact that demand will never beassigned to the furthest p!1 facility sites. This means that a distance string array for a demandpoint never needs the last p!1 entries. Can this be cut even further for a p-median problemwithout a!ecting results? If problem sizes for location model applications in GIS will be large, thenthis may be an important avenue to explore. Sorensen and Church [44] have shown one promisingapproach to reducing problem size by this method, as well as demonstrated that a "xed distance or"xed number cuto! may generate signi"cant errors in solving a p-median problem.(2) Error propagation: we know that error exists in the representation of spatial data. Errors exist
in location (e.g., coordinates) and attributes (e.g., amount of demand). How does error in such datae!ect model results; e.g., Hodgson [45]? How can error propagate in various functions likeaggregation that can impact "nal model results? Error propagation has been researched for certainGIS functions like overlay [46]. Since overlay functions might be used for de"ning a demand scape,then such research might be of use in terms of locaton model application. Unfortunately, mostmodels are de"ned within the context of a deterministic demand quantity de"ned for each point; aswell as a deterministic quantity used to represent the time of travel between two points. Often, suchdata is far from being deterministic.(3) New models: many of the models that have been developed for location/siting do not include
all of the options necessary for application.Miller [47] has presented an interesting classi"cation oflocation models related to GIS. Some of these constructs are important and need to be furtherdeveloped. For modeling issues in general, there appears to be a lack of handling temporal issues;for example, an urban area is undergoing growth and new facilities need to be phased in over time,but uncertainty exists in terms of exactly where the demand will be present. Planning overa number of "nite time periods has been the subject of few articles, but is more of the norm in actualpublic application. Another example involves how to add to or modify an existing base of facilities.Most algorithms and heuristics have been tested under the assumption that all facilities are new,i.e., a so-called `green-"eld casea. Few heuristics have been designed or tested to optimally add toor modify an existing system, i.e. a `brown-"eld casea [48].(4) Better algorithms and heuristics are needed: consider the dilemma faced by ESRI several years
ago when deciding how to integrate the p-median location model into their network module ofARC/INFO. The design needed to be capable of solving a problem of thousands of nodes (bothdemand and potential facility sites), be relatively fast and produce good results. Their designincluded the use of model transformation commands so that they could also solve covering andattendance maximizing location problems as well, where size dictated the use of a heuristic. Buthow should the heuristic be implemented? Would the heuristic use a random seed or a speciallygenerated starting solution. Users might be upset if a heuristic generated one solution on oneoccasion and another solution on another, based upon di!erent starting seeds. How do yourepresent the unceratinty involved in the performance of the heuristic to a user unfamiliar with thedistinction between optimal and heuristic? Such questions are hardly earth shaking for a locationscientist, but to a user with little expertise they can be major problems. The approach chosen byESRI involved the development of a special routine that generates a starting solution. The routine
550 R.L. Church / Computers & Operations Research 29 (2002) 541}562
is designed to generate the same pattern each time it is executed on the same data set. Also theroutine is designed to generate what is thought to be a pattern that makes sense and might reducethe number of cycles needed for heuristic convergence. By using this starting routine, the heuristicwill always generate the same "nal result for the same data set, regardless of how many times it isexecuted.Manymay feel that this is an inappropriate way to provide a heuristic for widespread use,but it does reduce user uneasiness. As long as the data remain unchanged the "nal heuristic resultwill always be the same.The heuristics that are used in many GIS-Location applications have not been tested for
large problems. Performance may degrade as problem size increases. In fact, some of the earlytesting of heuristics like Teitz and Bart (see, for example, [22,43]) was performed on what weconsider today to be a very small problem. Recent testing of the Teitz and Bart heuristicdemonstrates that there could be numerous local optima, where the chance of identifying anoptima on any start of the heuristic may be lower than 1 out of 250 [34]. This means that thereshould be more testing and heuritic development for the size of problems that are most likely to besolved within a GIS.(5) Interface development: for many potential software applications of a location model, a graphi-
cal user interface is important [49}52]. For example, Densham and Rushton [25] have developeda location allocation decision support system that is linked to GIS software. The interface isdesigned to aid in its use as well as display results in a meaningful way. There exist few papers thataddress the actual design of output displays and interface issues involving GIS. Visualization forboth exploration and model results is an important need in supporting model applications. Severalinteresting examples exist where location model displays have been integrated with a GIS program[32,49,53,54]. An interesting visualization provided by Jones and Yean [55] demonstrates thepossibilities for animating model solutions and sensitivity analysis. Jones and Yean have developedan application for a SiliconGraphics workstation that provides screen updates that are fast enoughto be considered animation. As a factory location is moved with a mouse on the graphics screen, theworkstation solves the transportation problem to e$ciently reallocate the output from all of thefactories including the one being moved. Results are generated fast enough that the screen isrefreshed with new allocations. The amount of allocation between any factory and demand point isrepresent by a line where the thickness is directly proportional to the amount of allocation. So, asthe factory is moved across the landscape, all allocations are continuously updated and displayed,producing a movie-like e!ect.(6) Data structures: Many of the data structures that are used in GIS are not the same as those
that have been developed for location model applications. For example, the Teitz and Bart [26]heuristic that is available in the ARC/INFO system utilizes a `stringa data structure that wasdescribed by Densham and Rushton [25]. This data structure is not the native data structure usedby ARC/INFO. For arc/info to execute the Teitz and Bart routine on a network, it "rst generatesthe distances from a given point by a shortest path routine. The distances are saved in the ordergenerated, thus creating a string data set. Strings are generated for each demand point. Suchstrings are then used by the location heuristic. In terms of a computational perspective, it isimportant to select the data structure that is the easiest to generate from existing data ande$ciently supports the algorithm or heuristic. Such data structures could also be designed tosupport parallel computation and algorithms could be restructured to work in a parallel computa-tion environment [56].
R.L. Church / Computers & Operations Research 29 (2002) 541}562 551
6. Current developments in GIS and location models
ReVelle et al. [57] were the "rst to classify location models into two broad classes of problems:continuous space and discrete network-based models. Location model development has concen-trated on the latter of these two areas. Some of this modeling bias is because a network cancapture a number of nuances of spatial variability that are often assumed away in a unbounded,continuous, planar representation. A network model may accurately represent travel distances inan urban area, whereas an unbounded planar model might not when numerous barriers exist. Eventhough extensions to planar models that allow barriers and gates exist, few have explored suchconcepts; see Larson and Sadiq [58] and Ding et al. [59]. Representing demands as contiguousareas instead of points also makes sense to: but this is also rarely considered in a model; see forexample Wesolowsky and Love [60], and Miller [47]. In addition, only a few hybrid models ofplanar and network paradigms exist [61]. Even though such constructs exist in the locationliterature, they require signi"cant spatial detail to realistically describe a real-world problem.Having such spatial detail present in GISs has led to a continuing and growing interest in suchlocation constructs in the GIS literature. This does not mean that such models and constructs havenot been of interest outside of the "eld of GIS, but that real planning problems need the data ina form and resolution typically found in the GIS. Such location problems include corridor location,cellular telephone transmission site location, "re watchtower location, etc. Corridor locationinvolves identifying the best route or rights-of-way for facilities such as pipelines and transmissionpower lines. They could also involve the route of a road to maximize visibilty of a beautifullandscape, to minimize cost of reaching some resource or to minimize the view or chance of beingdetected [62]. Watchtowers and cellular telephone transmission sites represent facilities thatmaximize areal coverage within a direct, line-of-sight, transmission or view.The simple corridor location problem involves identifying the best route across a landscape that
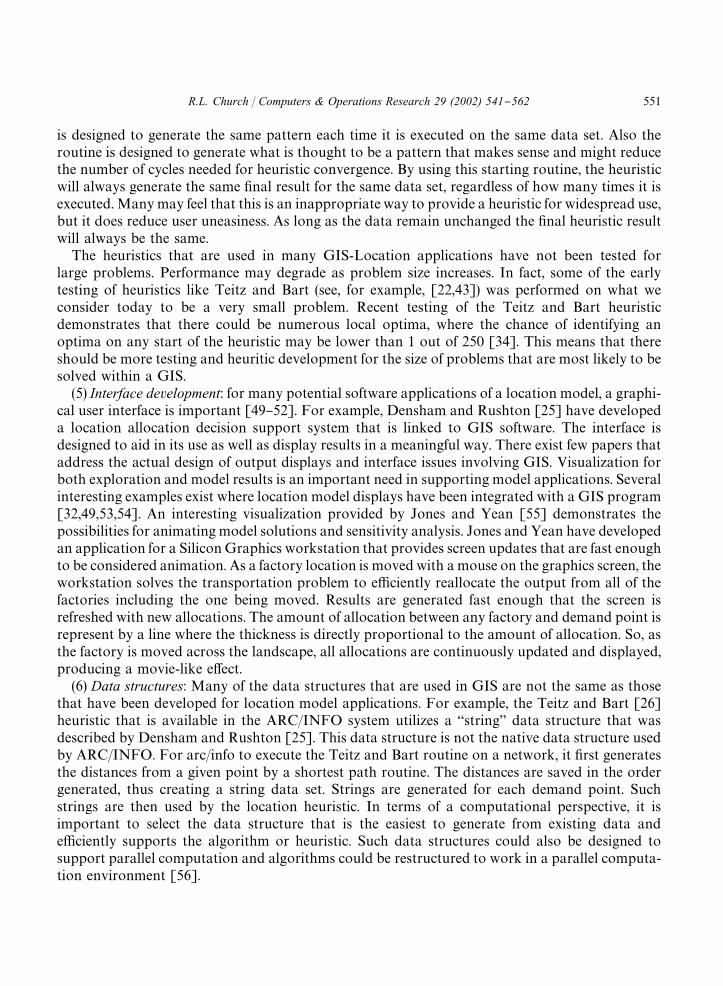
connects two points. Consider an example that involves locating a power transmission line. Thinkof the landscape being depicted as a cost surface representing the environmental impact andengineering cost of placing a power transmission right-of-way. The objective is to route theright-of-way from an origin to a destination at least `environmental and engineeringa cost [63].This problem has been studied by a number of researchers; see for example Goodchild [64], Huberand Church [65], and Smith et al. [66]. Most represent the data for such a problem as a multi-layered raster data GIS. Smith et al. [66] have depicted this problem using a vector GISrepresentation involving triangular regions. For each cell or polygon a number of attributes havebeen measured or estimated. It is typical to include land use, land cover, zoning, soil type, slope,aspect, etc. [67]. The attributes can be weighted and combined into a suitability score, whichdepicts how compatible the use of the cell or polygon is for the routing of a corridor [65]. Lowvalues will depict high suitability and high values will depict low suitability. The objective is to "nda route that travels through the cells that have low scores (i.e., high suitability). We can easilytransform the raster version of this problem into a classical shortest path problem by de"ning anassociated network. This can be done by "rst de"ning the centroid of each cell as a node, and thende"ning arcs that connect the nodes of adjacent cells. This is depicted in Fig. 3. The left side of Fig. 3depicts a classical orthogonal network de"ned by arcs connecting only the four cardinal adjacen-cies. On the right side of Fig. 3, oblique arcs are also given, which can expand the #exibility of thenetwork. For the classical orthogonal network, it is common to give the cost of an arc the
552 R.L. Church / Computers & Operations Research 29 (2002) 541}562

Fig. 3. Orthogonal and non-orthogonal arcs for a potential network.
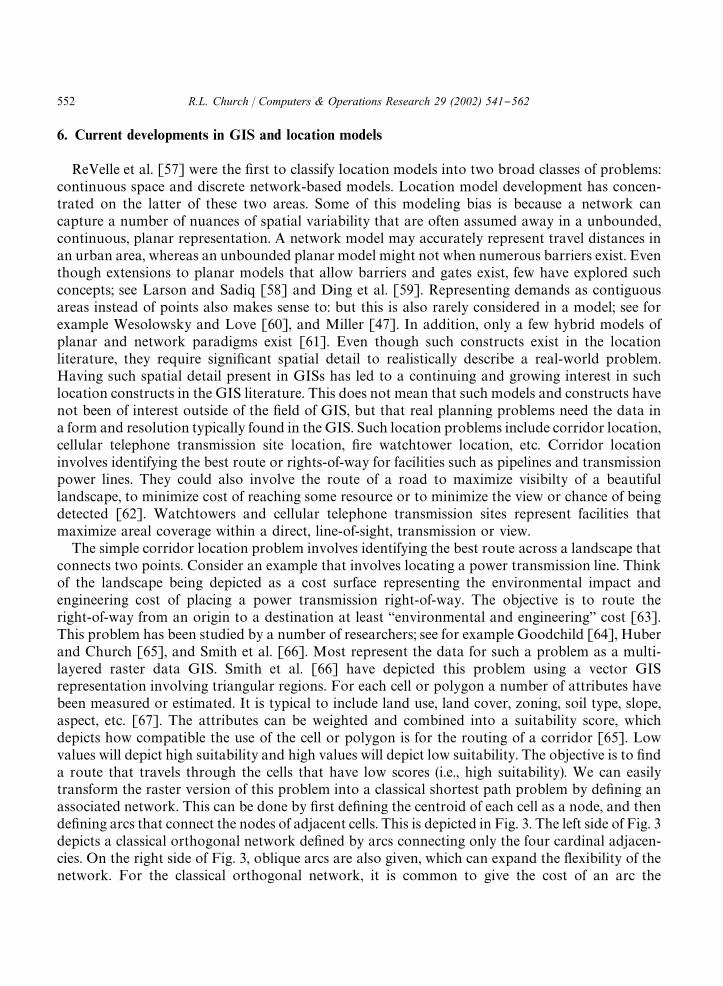
Fig. 4. A raster-based landscape for visibility analysis.
suitability score of the cell that it is entering. For networks that allow greater direction #exibility(using oblique arcs), one can de"ne a weighted score based upon the amount of distance or area(assuming a given corridor width) that an arc intersects a given cell [65]. The generalized weightingscheme is equivalent to the simple orthogonal score assignment approach for a orthogonalnetwork when the width is equal to the width of the cell. Huber and Church [65] and Goodchild[64] have found that it is necessary to de"ne a network beyond that of an orthogonal network toidentify the shortest route across the landscape. An interesting road network location problemusing a GIS can be found in Dean [68].One of the more interesting location problems that have been de"ned as a part of GIS utilizes the
concept of a viewshed [69]. For any point on the landscape, it is possible to identify the area whichwould be within direct sight of the point. We will call this the viewshed of a point. To calculatea viewshed of a point requires some depiction of the elevation of the landscape. If a landscape is
R.L. Church / Computers & Operations Research 29 (2002) 541}562 553
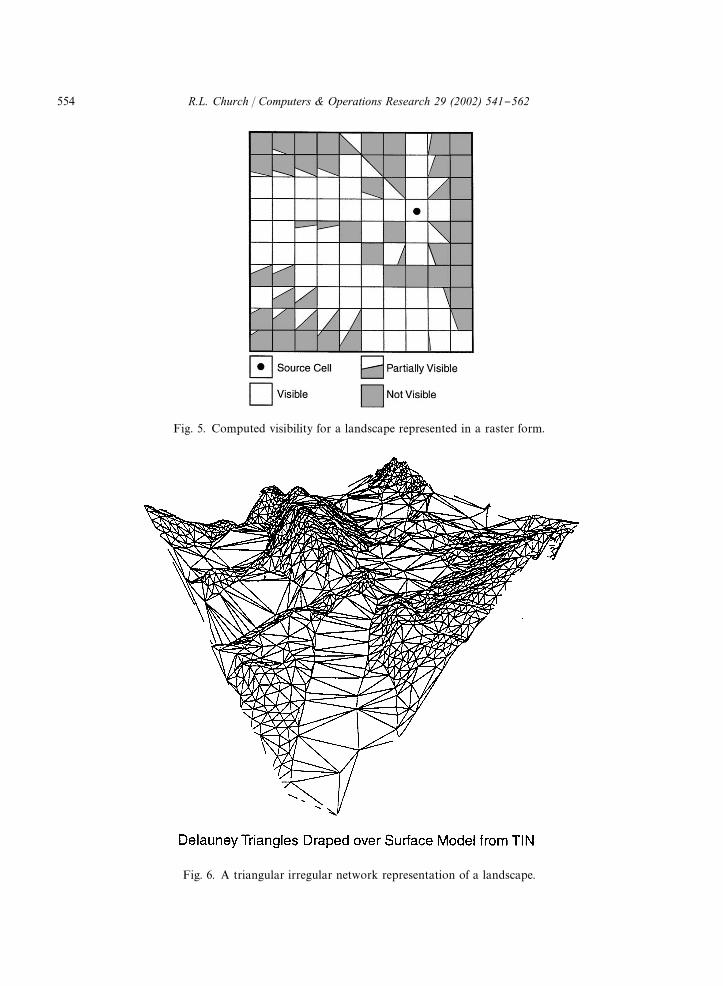
Fig. 5. Computed visibility for a landscape represented in a raster form.
Fig. 6. A triangular irregular network representation of a landscape.
554 R.L. Church / Computers & Operations Research 29 (2002) 541}562
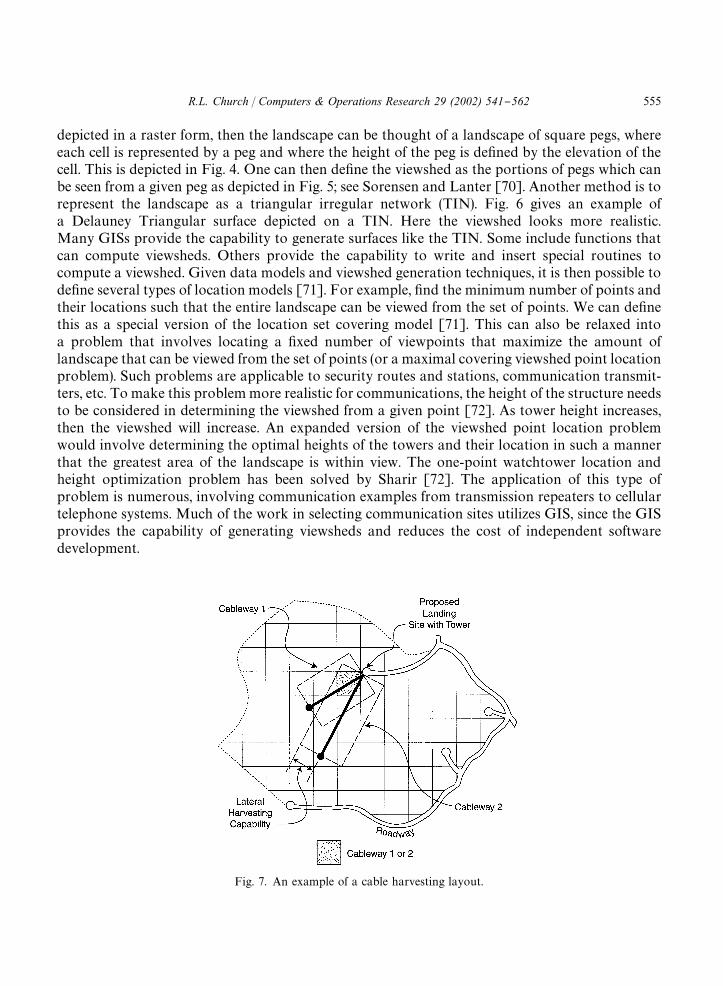
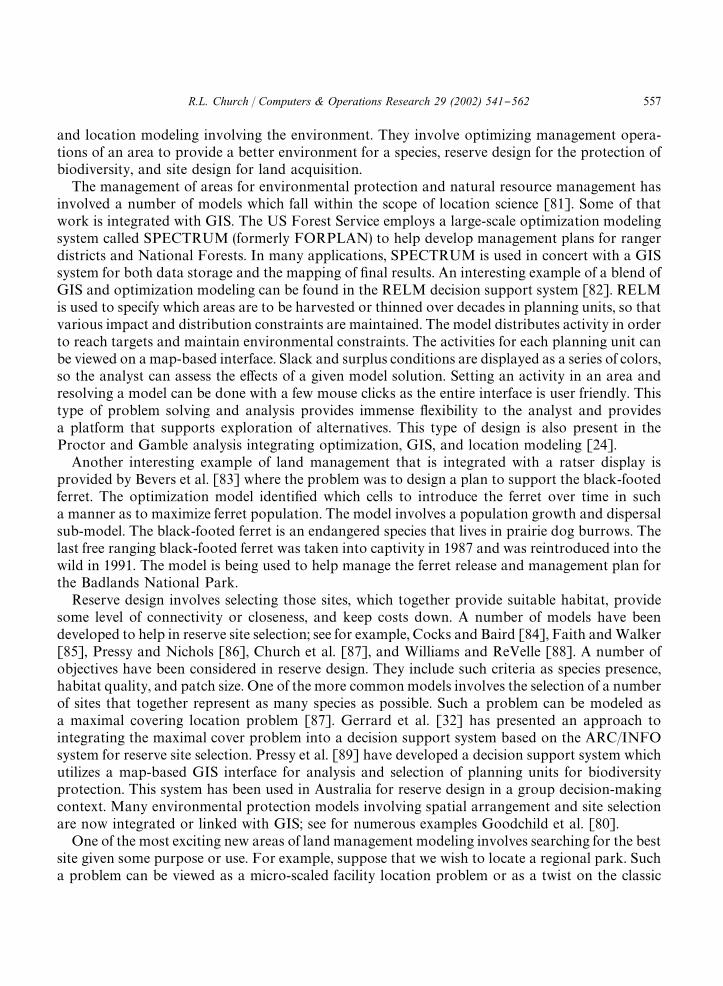
Fig. 7. An example of a cable harvesting layout.
depicted in a raster form, then the landscape can be thought of a landscape of square pegs, whereeach cell is represented by a peg and where the height of the peg is de"ned by the elevation of thecell. This is depicted in Fig. 4. One can then de"ne the viewshed as the portions of pegs which canbe seen from a given peg as depicted in Fig. 5; see Sorensen and Lanter [70]. Another method is torepresent the landscape as a triangular irregular network (TIN). Fig. 6 gives an example ofa Delauney Triangular surface depicted on a TIN. Here the viewshed looks more realistic.Many GISs provide the capability to generate surfaces like the TIN. Some include functions thatcan compute viewsheds. Others provide the capability to write and insert special routines tocompute a viewshed. Given data models and viewshed generation techniques, it is then possible tode"ne several types of location models [71]. For example, "nd the minimum number of points andtheir locations such that the entire landscape can be viewed from the set of points. We can de"nethis as a special version of the location set covering model [71]. This can also be relaxed intoa problem that involves locating a "xed number of viewpoints that maximize the amount oflandscape that can be viewed from the set of points (or a maximal covering viewshed point locationproblem). Such problems are applicable to security routes and stations, communication transmit-ters, etc. To make this problemmore realistic for communications, the height of the structure needsto be considered in determining the viewshed from a given point [72]. As tower height increases,then the viewshed will increase. An expanded version of the viewshed point location problemwould involve determining the optimal heights of the towers and their location in such a mannerthat the greatest area of the landscape is within view. The one-point watchtower location andheight optimization problem has been solved by Sharir [72]. The application of this type ofproblem is numerous, involving communication examples from transmission repeaters to cellulartelephone systems. Much of the work in selecting communication sites utilizes GIS, since the GISprovides the capability of generating viewsheds and reduces the cost of independent softwaredevelopment.
R.L. Church / Computers & Operations Research 29 (2002) 541}562 555

Another continuous terrain-based location model can be found in forestry management. Thisproblem involves designing a harvesting system which can be used to e$ciently harvest timberacross a steep landscape. Harvesting can be accomplished from a tower and a cable. The cable isstretched and anchored down slope from the tower. Trees are felled and raised up slope to thetower by a line that is suspended from a pulley from the anchored cable. A cable and tower-harvesting plan is depicted in Fig. 7. Assume that the harvesting area is divided into a number ofgrid cells. If a harvesting tower is located in one grid cell, it is then possible to identify all downslope cells that can be reached from a cable anchored at appropriate positions. Further, given theslope, distance of cableway and type of timber, it is possible to determine the cost of harvestinga given cell from a tower in a given location. This can be accomplished for all potential harvesttower locations. Weintraub [73] have developed a model which optimizes harvest tower locationsas well as road connections needed to reach the harvest towers which minimizes cost of logtransport and timber harvesting. This model is loosely coupled with the ARC/INFO GIS. Ata computer console a harvest engineer selects potential tower locations on a map of the landscapewith a mouse. The system then generates the possible cable set-ups and determines the cost ofharvesting each cell from tower positions that can reach that cell. Data on potential road linkagesare also generated which are subsequently exported to the road building and tower location model.Various schemes have been developed to solve this model including TABU search and Lagrangianrelaxation.A second example in spatial allocation involving forestry operations is the allocation of
contiguous blocks of trees for harvesting. An area is typically divided into spatial units comprisedof stands of trees. Stands of trees are grouped into larger units called blocks. Each block is relativelycompact and sized under some maximum limit. No two adjacent blocks can be harvested in thesame decade. The objective is to allocate blocks or harvest units to a harvest period such that thenet revenues associated with harvesting are maximized. If each spatial unit can be reached byexisting roads, then the problem can be expressed as a site selection problem with adjacencyconstraints similar to those expressed by Moon and Chaudry [74] for the conditional coveringlocation problem. The problem becomes more complex if existing roads cannot reach all units.Then roads and timing of road building becomes an important but complicating factor to theproblem. Most applications of this type of model are now integrated with some form of GIS. Thistype of problem solution, for example, has been listed as a needed function in the US. ForestService's GIS acquisition program. Examples of this type of problem and solution procedures canbe found in Murray and Church [75], Jones et al. [76], and Snyder and ReVelle [77].One of the biggest developments associated with location science and GIS has occurred in the
area of land management involving environmental protection and land development [78,79]. Asthe natural landscape in many of the regions becomes more fragmented by land conversion, thesize, extent, and quality of natural patches of landscape decreases. The viability of many species hasbeen questioned, as habitat is lost to development or changing land management practices. If thereis any area for which Location Science can have a long-term, lasting impact, it involves theenvironment. Since most environmental problems, like species preservation, are analyzed at a scalethat involves spatial relationships, it is easy to understand why maps of environmental attributes(e.g. vegetation) are necessary. GIS has played an integral role in supporting environmentalanalysis; see Goodchild et al. [80] for a number of examples involving environmental models andGIS. There are three very interesting types of problems being addressed within the context of GIS
556 R.L. Church / Computers & Operations Research 29 (2002) 541}562
and location modeling involving the environment. They involve optimizing management opera-tions of an area to provide a better environment for a species, reserve design for the protection ofbiodiversity, and site design for land acquisition.The management of areas for environmental protection and natural resource management has
involved a number of models which fall within the scope of location science [81]. Some of thatwork is integrated with GIS. The US Forest Service employs a large-scale optimization modelingsystem called SPECTRUM (formerly FORPLAN) to help develop management plans for rangerdistricts and National Forests. In many applications, SPECTRUM is used in concert with a GISsystem for both data storage and the mapping of "nal results. An interesting example of a blend ofGIS and optimization modeling can be found in the RELM decision support system [82]. RELMis used to specify which areas are to be harvested or thinned over decades in planning units, so thatvarious impact and distribution constraints are maintained. The model distributes activity in orderto reach targets and maintain environmental constraints. The activities for each planning unit canbe viewed on amap-based interface. Slack and surplus conditions are displayed as a series of colors,so the analyst can assess the e!ects of a given model solution. Setting an activity in an area andresolving a model can be done with a few mouse clicks as the entire interface is user friendly. Thistype of problem solving and analysis provides immense #exibility to the analyst and providesa platform that supports exploration of alternatives. This type of design is also present in theProctor and Gamble analysis integrating optimization, GIS, and location modeling [24].Another interesting example of land management that is integrated with a ratser display is
provided by Bevers et al. [83] where the problem was to design a plan to support the black-footedferret. The optimization model identi"ed which cells to introduce the ferret over time in sucha manner as to maximize ferret population. The model involves a population growth and dispersalsub-model. The black-footed ferret is an endangered species that lives in prairie dog burrows. Thelast free ranging black-footed ferret was taken into captivity in 1987 and was reintroduced into thewild in 1991. The model is being used to help manage the ferret release and management plan forthe Badlands National Park.Reserve design involves selecting those sites, which together provide suitable habitat, provide
some level of connectivity or closeness, and keep costs down. A number of models have beendeveloped to help in reserve site selection; see for example, Cocks and Baird [84], Faith andWalker[85], Pressy and Nichols [86], Church et al. [87], and Williams and ReVelle [88]. A number ofobjectives have been considered in reserve design. They include such criteria as species presence,habitat quality, and patch size. One of the more commonmodels involves the selection of a numberof sites that together represent as many species as possible. Such a problem can be modeled asa maximal covering location problem [87]. Gerrard et al. [32] has presented an approach tointegrating the maximal cover problem into a decision support system based on the ARC/INFOsystem for reserve site selection. Pressy et al. [89] have developed a decision support system whichutilizes a map-based GIS interface for analysis and selection of planning units for biodiversityprotection. This system has been used in Australia for reserve design in a group decision-makingcontext. Many environmental protection models involving spatial arrangement and site selectionare now integrated or linked with GIS; see for numerous examples Goodchild et al. [80].One of the most exciting new areas of land management modeling involves searching for the best
site given some purpose or use. For example, suppose that we wish to locate a regional park. Sucha problem can be viewed as a micro-scaled facility location problem or as a twist on the classic
R.L. Church / Computers & Operations Research 29 (2002) 541}562 557
facility layout problem. Assume for the moment that each land unit is represented as a square celland that the planning region is X cells by Y cells in size. Each cell has a cost and suitability value foruse as park. The problem involves selecting a set of contiguous cells which altogether representsa useable site and which maximizes suitability and minimizes cost. Wright et al. [90] de"ned thisproblem as the land acquisition problem. What makes this problem somewhat complicated is thefact that a number of possible arrangements of contiguous cells may make a suitable site. Onecriterion which is commonly used is the length of the perimeter compared to size [91]. If the area is10 cells and the perimeter is 22 cell edges, then the site is 10 by 1 cells. However, if the perimeter is14 cell edges, then the pattern is 5 by 2 cells. Williams and ReVelle [88] have de"ned a model thatselects cells and "xes perimeter, total size and optimizes cost. Brookes [92] has developeda patch-growing based upon a multi-criteria greedy algorithm and integrated it with a GIS. Thealgorithm generates patches of di!erent sizes and shapes that optimize suitability. Such modelsintegrated with GIS will become useful tools for site designers, habitat preservations, landmanagers, etc. Minor and Jacobs [93] have developed a parcel selection model for land"ll designthat attempts to select the best set of contiguous parcels that minimize cost and maximize land"llcapacity. Such models are not possible without a great deal of spatial data that is organized andaccessible. It is only natural to think that the development of such models will be closely tied toGIS.
7. Conclusions
Geographical Information Systems involve software that provides storage, retrieval, analysis,visualization, and mapping capabilities for spatial data such as road networks, land use informa-tion, census track data, etc. Some GISs include embedded location models and most provide theopportunity to integrate locationmodels within a map-based graphical user interface. Because GIScan be used to assemble data from various sources involving di!erent map scales and transforma-tions, it can be a signi"cant aid to the location analyst. Even though location studies need notinvolve the use of GLS, there is much to be gained by taking advantage of the functions that areavailable in GIS software, and available in databases that can be purchased. First, some of thesoftware features support needed for operations in a location model application. These mayinclude: data entry, mapping, solution presentation, output, spatial data organization, and spatialmeasurement (e.g., distance matrix). In many cases it would not be cost e!ective to independentlydevelop such software functions for a location study. It is possible, for example, to develop a systemthat can generate a TIN or a viewshed for a cellular telephone location study, but it could be a farsimpler task to integrate the use of a GIS system to provide such functionality when needed.Second, a growing data development industry supported primarily by GIS users now makes orpackages a number of data products which could have signi"cant value in location studies. Suchdata is nominally provided in multiple GIS formats. Third, GIS software often uses state-of-the-artdatabase engines and is designed to handle large volumes of data. Such software can obliviate theneed to develop independently a spatial data base engine. It can also provide data assemblyservices faster than otherwise possible without signi"cant development.On the negative side, one must recognize that there are costs to both software and data
acquisition. Such costs may not be justi"ed in terms of an isolated project; but, in any circumstance
558 R.L. Church / Computers & Operations Research 29 (2002) 541}562

where the costs of the GIS and needed expertise can be averaged over multiple uses, GIS may bethe cost-e!ective alternative. As new software is brought on-line and expertise is developed amonglocation scientists, it is hard to imagine that GIS will provide only a supporting role in locationresearch, as many new models are possible when viewed from a GIS perspective. In fact, demandfor better location model functionality in GIS software will grow. It is easy to conclude that thesuccess of many location applications in the future may be intimately tied to GIS.
References
[1] Liebman J. Some simple-minded observations on the role of optimization in public systems decision-making.INTERFACES 1976;6:102}8.
[2] McHarg IL. Design with nature. Garden City, NY: The Natural History Press, 1969.[3] Kiefer RW, Robbins ML. Computer-based land use suitability maps. Journal of the Surveying and Mapping
Division-ASCE 1973;99:39}62.[4] Durfee RC. Oak Ridge regional modeling information system, Part 1. ORNL-NSF-EP-73, Oak Ridge, TN: Oak
Ridge National Laboratory, 1974.[5] Voelker AH. Indices, a technique for using large spatial data bases. ORNL/RUS-15, Oak Ridge National
Laboratory, Oak Ridge, TN, 1976.[6] Dobson J. A regional screening procedure for land use suitability analysis. The Geographical review
1979;69:224}34.[7] IDRISI 1997 see web page for WEIGHT command at http,//www.idrisi.clarku.edu/PRODUCTS/specindx.
htm�DECISION SUPPORT.[8] Pereira JMC, Duckstein L. A multiple criteria decision making approach to GIS-based land suitability evalustion.
International Journal of Geographical Information Systems 1993;7:407}24.[9] Brandeau ML, Chiu SS. An overview of representative problems in location research. Management Science
1989;35:645}74.[10] Kao J-J, Chen WY, Lin HY, Guo SJ. Network expert geographic information system for land"ll siting. Journal of
Computing in Civil Engineering 1996;10:307}17.[11] Arentze TA, Borgers AWJ, Timmermans HJP. An e$cient search strategy fo site-selection decisions in an expert
system. Geographical Analysis 1996;28:126}46.[12] Carver SJ. Integrating multi-criteria evaluation with geographical information systems. International Journal of
Geographical Information Science 1991;5:321}39.[13] Marks AP, Thrall GI, Arno M. Siting hosiptals to provide cost-e!ective health care. Geo Info Systems
1992;2:58}66.[14] Goodchild MF. Geographic Information Systems. Journal of Retailing 1991;67:3}15.[15] Birkin M. Retail location modeling in GIS. In: Longley P, Batty M, editors. Spatial analysis: modeling in a GIS
environment. Cambridge, UK: GeoInformation International, 1996.[16] Longely P, Clarke G. GIS for business and service planning. Cambridge, UK: GeoInformation International,
1995.[17] Current JR, Min H, Schilling D. Multiobjective analysis of facility location decisions. European Journal of
Operational Research 1990;49:295}307.[18] Current JR, Marsh M. Multiobjective transporatation network design and routing problems } taxonomy and
annotation. European Journal of Operational Research 1993;65:4}19.[19] Aultman-Hall L, RoordaM, Baetz BW. Using GIS for evaluation of neighborhood pedestrian accessibility. Journal
of Urban Planning and Development 1997;123:11}7.[20] Lindquist G. GIS application of the local initiative for neighborhood circulation. Unpublished manuscript,
Department of Geography, University of Washington, Seattle, WA, 1994.[21] ReVelle CS, Swain R. Central facilities location. Geographical Analysis 1970;2:30}4.[22] Rosing KE, Hillsman EL, Rosing-Vogelaar H. A note comparing optimal and heuristic solutions to the p-median
problem. Geographical Analysis 1979;11:86}9.
R.L. Church / Computers & Operations Research 29 (2002) 541}562 559

[23] Honey R, Rushton G, Lolonis P, Daziel BT, ArmstrongMP, De S, Densham PJ. Stages in the adoption of a spatialdecision support system for reorganizing service delivery regions. Environment and Planning C 1991;9:51}63.
[24] Camm JD, Chorman TE, Dill FA, Evans JR, Sweeney DJ, Wegryn GW. Blending OR/MS, judgement, and GIS:restructuring P and G's Supply chain. INTERFACES 1997;27:128}42.
[25] Densham PJ, Rushton G. Designing and implementing strategies for solving large location-allocation problemswith heuristic methods. Technical Report 91-10, National Center for Geographical Information and Analysis,University of California, Santa Barbara, CA, 1991.
[26] Teitz MB, Bart P. Heuristic methods for estimating the generalized vertex median of a weighted graph. OperationsResearch 1968;16:953}61.
[27] DenshamPJ, RushtonG. A more e!cient heuristic for solving large p-median problems. Papers in Regional Science1992;71:307}29.
[28] Church RL, ReVelle CS. Theoretical and computational links between the p-median, location set covering, and themaximal covering location problem. Geographical Analysis 1976;8:406}15.
[29] Hillsman EL. The p-median structure as a uni"ed linear model for location-allocation analysis. Environment andPlanning A 1984;16:305}18.
[30] Fotheringham AS, Densham PJ, Curtis A. The zone de"nition problem in location allocation modeling.Geographical Analysis 1995;27:60}77.
[31] Murray AT, Gottsegen JM. The in#uence of data aggregation on the stability of p-medain location modelsolutions. Geographical Analysis 1997;29:200}13.
[32] Gerrard RA, Stoms DA, Church RL, Davis FW. Using GIS models for reserve site selection. Transactions in GIS1996;2:45}60.
[33] Ruggles A, Church RL. An analysis of late-horizon settlement patterns in the Teotihuacan-Temascalapa basins,a location-allocation and GIS approach. In: Aldenderfer MS, Maschner HDG. editors. Anthropology, space andgeographic information systems. Oxford: Oxford University Press, 1997.
[34] Church RL, Sorensen P. Integrating normative location models into GIS, problems and prospects with thep-median model. In: Longley P, Batty M, editors. Spatial analysis: Modeling in a GIS environment. Cambridge,UK: GeoInformation International, 1996.
[35] Goodchild MF. The aggregation problem in location-allocation. Geographical Analysis 1979;11:240}55.[36] Hillsman EL, Rhoda R. Errors in measuring distances from populations to service centers. Annals of Regional
Science 1978;7:74}88.[37] Curent JR, Schilling DA. Elimination of source A and B errors in p-median location problems. Geographical
Analysis 1987;19:95}110.[38] Current JR, Schilling DA. Analysis of errors due to demand aggregation in the set covering and maximal covering
location problems. Geographical Analysis 1990;22:116}26.[39] HodgsonMJ, Neuman S. A GIS approach to eliminating source C aggregation error in p-medianmodels. Location
Science 1993;1:155}70.[40] Francis RL, Lowe TJ. On worst case aggregation analysis for network location problems. Annals of Operations
Research 1992;40:229}46.[41] Rayco MB, Francis RL, Lowe TJ. Error bound driven demand point aggregation for the rectilinear distance
p-center model. Location Science 1996;4:213}36.[42] Francis RL, Lowe TJ, Rayco MB. Row-column aggregation for rectilinear distance p-median problems. Transpor-
tation Science 1996;30:160}74.[43] Rosing KE, ReVelle CS, Rosing-Vogelaar H. The p-median and its linear programming relaxation, an approach to
large problems. Journal of Operational Research Society 1979;30:815}23.[44] Sorensen PA, Church RL. A comparison of strategies for data storage reduction in location-allocation problems.
Geographical Systems 1996;3:221}42.[45] Hodgson MJ. Stability of solutions to the p-median problem under induced data error. INFOR 1991;29:167}83.[46] Veregin H. Developing and testing of an error propagation model for GIS overlay operations. International
Journal of GIS 1995;9:595}619.[47] Miller HJ. GIS and geometric representation in facility location problems. International Journal of GIS
1996;10:791}816.
560 R.L. Church / Computers & Operations Research 29 (2002) 541}562

[48] Church RL. Location modelling and GIS. In: Goodchild et al., editors. Handbook on GIS Cambridge, UK:GeoInformation International, 1997.
[49] Armstrong MP, Densham PJ, Lolonis P, Rushton G. Cartographic display to support location decision making.Cartography and Geographic Information Systems 1992:154}64.
[50] Arentze TA, Borgers AWJ, Timmermans HJP. Design of a view-based DSS for location planning. InternationalJournal of Geographical Information Systems 1996;10:219}36.
[51] Church RL, Loban SR, Lombard K. An interface for exploring spatial alternatives for a corridor location problem.Computers and GeoSciences 1992;18:1095}105.
[52] Angehrn AA. Modeling by example: a link between users, models and methods in DSS. Eurpoean Journal ofOperations Research 1991;55:296}308.
[53] DenshamPJ. Integrating GIS and spatial modeling: visual interactive modelling and location selection. Geographi-cal Systems 1994;1:203}19.
[54] Densham PJ. Visual interactive location analysis. In: Longley P, Batty M, editors. Spatial analysis, Modeling ina GIS environment, Cambridge, UK: GeoInformation International, 1996.
[55] Jones CV, Yean P. Animated sensitivity analysis and minimum cost network #ow modeling. Presented at theORSA/TIMS National Meeting, Phoenix, AZ, 1993.
[56] Armstrong MP, Densham PJ. Domain decomposition for parallel processing of spatial problems. Computers,Environment and Urban Systems 1992;16:497}513.
[57] ReVelle C, Marks D, Liebman JC. An analysis of private and public sector location models. Management Science1970;16:692}707.
[58] Larson RG, Sadiq G. Facility locations with manhattan metric in the presence of barriers to travel. OperationsResearch 1983;31:652}69.
[59] Ding Y, Baveja A, Batta R. Implementing Larson and Sadiq's location model in a geographic information system.Computers and Operations Research 1994;21:447}54.
[60] Wesolowsky GO, Love RF. Location of facilities with rectangular distances among point and area destinations.Naval Research Logistics Quarterly 1971;18:83}90.
[61] Batta R, Palekar US. Mixed planar/network facility location problems. Computers and Operations Research1998;15:61}7.
[62] Teng YA, DeMenthon D, Davis LS. Stealth terrain navigation. IEEE Transactions on Systems, Man, andCybernetics 1993;23:96}110.
[63] Lombard K, Church RL. The gateway shortest path problem, generating alternative routes for a corridor locationproblem. Geographical Systems 1993;1:25}45.
[64] Goodchild MF. An evaluation of lattice solutions to the problem of corridor location. Environment and PlanningA 1977;9:727}38.
[65] Huber DL, Church RL. Transmission corridor location modeling. Journal of Transportation Engineering1985;111:114}30.
[66] Smith TR, Peng G, Gahinet P. Asynchronous, iterative, and parallel procedures for solving the weighted regionleast cost path problem. Geographical Analysis 1989;21:147}66.
[67] Towers G. GIS versus the community, siting power in southernWest Virginia. Applied Geography 1997;17:111}25.[68] Dean DJ. Finding optimal routes or networks of harvest site access roads using GIS-based techniques. Canadian
Journal of Forest Research 1997;27:11}22.[69] DeFloriani L, Magillo P. Computing visibility maps on a digital terrain model. In: Frank A, Campari I, editors.
Spatial information theory, a theoretical basis for GIS. Berlin: Springer, 1992.[70] Sorensen PA, Lanter DP. Two algorithms for determining partial visibility and reducing data structure induced
error in viewshed analysis. Photogrammetric Engineering and Remote Sensing 1993;59:1149}60.[71] Goodchild MF, Lee J. Coverage problems and visibility regions on topograhic surfaces. Annals of Operations
Research 1989;18:175}86.[72] Sharir M. The shortest watchtower and related problems for polyherdral terrains. Information Processing Letters
1988;29:265}70.[73] Weintraub A, Jones JG, MaechamML, Magendzo A, Malchuk D. Heuristic procedures for solving mixed integer
harvest scheduling-transportation planningmodels. Canadian Journal of Forest Research 1995;25:1618}26.
R.L. Church / Computers & Operations Research 29 (2002) 541}562 561

[74] Moon ID, Chaudhry SS. An analysis of network location problems with distance constraints. Management Science1984;30:290}307.
[75] Murray AT, Church RL. Measuring the e$cacy of constraint structure in forest planning models. CanadianJournal of Forest Research 1995;25:1416}24.
[76] Jones JB, Meneghin B, Kirby M. Formulating adjacency constraints in linear optimization models for schedulingprogects in tactical planning. Forest Science 1988;37:1283}97.
[77] Snyder S, ReVelle C. The grid packing problem, selecting a harvesting pattern in an area with forbidden regions.Forest Science 1996;42:27}34.
[78] Campbell JC, Radke J, Gless JT, Wirtshafter RM. An application of linear programming and geographicinformation systems: cropland allocation in Antigua. Environment and Planning A 1992;24:535}49.
[79] Chuvieco E. Integration of linear programming and GIS for land-use modelling. International Journal ofGeographical Information Systems 1993;7:71}83.
[80] Goodchild MF, Steyaert LT, Parks BO, Johnston C, Maidment D, Crane M, Glendinning, editors. GIS andEnvironmental modeling, progress and research issues. Fort Collins, CO: GIS World Books, 1996.
[81] Church RL, Murray AT, Weintraub A. Locational issues in forest management, 1999, submitted for publication.[82] Church RL, Murray AT, Barber K, Dyrland R. A spatial decision support system for doing hierarchical habitat
planning. Proceedings of the Analysis in Support of Ecosystem Management, Ft. Collins, CO, 1995;283}9.[83] Bevers M, Hof J, Uresk DW, Schenbeck GL. Spatial Optimization of prairie dog colonies for black-footed ferret
recovery. Operations Research 1997;45:495}507.[84] Cocks KD, Baird IA. Using mathematical programming to address the multiple reserve selection problem, an
example from the Eyre Peninsula, South Australia. Biological Conservation 1989;49:113}20.[85] Faith DP, Walker PA. Integrating conservation and development: incorporating vulnerability into biodiversity-
assessment areas. Biodiversity and Conservation 1995;5:417}29.[86] Pressy RL, Nichols AO. Application of a numerical algorithm to the selection of reserves in semi-arid New South
Wales. Biological Conservation 1989;50:263}78.[87] Church RL, Stoms DM, Davis FR. Reserve selection as a maximal covering location problem. Biological
Conservation 1996;76:105}12.[88] Williams JC, ReVelle CS. A 0-1 programming approach to delineating protected reserves. Environment and
Planning B, Planning and Design 1996;23:607}24.[89] Pressy RL, Ferrier S, Hutchinson CD, Siversen DP, Manion G. Planning for negotiation, using interactive
geographic information system to explore alternative protected area networks. In: Saunders DA, Craig JL,Mattiske EM, editors. Nature conservation 4, The role of networks, Vol. 4 Surrey, New South Wales, Australia:Beatty and Sons, 1995 [Chapter 3].
[90] Wright J, ReVelle CS, Cohon J. A multiobjective integer programming model for the land acquisition problem.Regional Science and Urban Economics 1983;13:31}53.
[91] Benabdallah S, Wright J. Shape considerations in spatial optimization. Civil Engineering Systems 1991;8:145}52.[92] Brookes CJ. A parameterized region growing programme for site allocation on raster suitability maps. Interna-
tional Journal of Geographical Information Science 1997;11:375}96.[93] Minor SD, Jacobs TL. Optimal land allocation for solid and hazardous waste land"ll siting. Journal of Environ-
mental Engineering 1994;120:1095}108.
Richard Church is a Professor of Geography at the University of California, Santa Barbara. He has extensiveexperience in the modeling of complex logistics and spatial optimization problems. He received a Ph.D. from the JohnsHopkins University in Environmental Systems Engineering in 1974. He specializes in applied Operations Research aswell as Location and Transportation research and Decision Support Systems. He has published over 100 papers andmonographs in related journals and research publication series. Dr. Church has served as a consultant to numerousfederal agencies and private companies. He has recently published in the area of conservation reserve design, intelligenttransportation systems, forest management, and manpower deployment planning. Current research funding includes theU.S. Forest Service, the Bureau of Land Management, the U.S. Geological Survey, U.S. Department of Transportation,Caltrans, and the National Science Foundation.
562 R.L. Church / Computers & Operations Research 29 (2002) 541}562