6. the social consequences of the industrial revolution · 1 ecn 110b, spring 2005 6. the social...
TRANSCRIPT

1
ECN 110B, Spring 2005
6. The Social Consequences of the Industrial Revolution
Winners and Loser from the Industrial Revolution
The enormous expansion of output since the Industrial Revolution came from the
increased production of knowledge. Yet stunningly the benefits of that growth have gone
disproportionately to unskilled labor. The innovators, the owners of capital, the owners of land,
and the owners of human capital, have all experienced modest gains, or no gain at all, from
knowledge advances. Unskilled workers, and in particular female unskilled workers, have seen
enormous benefits.
But while growth so far has been benign, there is no guarantee that it will continue to
promote equality within high income societies. In the near future we may face the gloomy
dystopia feared by many writers where the wages of unskilled labor drop below the socially
determined “subsistence wage” and societies are forced to support permanently a large fraction
of the population.
To see why unskilled labor got the bulk of the gains note that the growth rate of
measured efficiency gA, the key to modern growth, has to show up in gains to the incomes of one
or more of the factors that contributes to production, capital, human capital, unskilled labor, and
land. Formally an equivalent expression to the fundamental equation of growth is
gA = (aK + aH).gr/p + b.gw/p + c.gs/p (1)
2
Where r/p is the real rental of capital, which is the real interest rate, w/p is the real wage for
unskilled labor, and s/p is the real rental value of land. What this says is that the gains of a 1%
efficiency advance have to show up on average in gains in real incomes for the factors that
cooperate in production of 1% also (since aK + aH + b + c). b in this case is the share of the
economy paid as wages for unskilled labor, rather than the entire labor share in national income,
which would be aH + b .
Modern growth has been driven by people creating knowledge. In general, the creators
of that knowledge have not gained much of the benefits. It has spilled out, rewarding the other
factors that cooperate in production. In general, the final incident of the benefits of
technological advance could be either mostly with land, mostly with capital, or mostly with
unskilled labor, depending on the elasticity of supply of these factors, and the way technological
advance has influenced demand for each factor.
Since the Industrial Revolution none of the gains to income from efficiency advance
have gone to capital owners. The real rental of capital (net depreciation) is just the real interest
rate. But we saw in figures 1 and 2 of chapter 7, the real interest rate has if anything declined
since the Industrial Revolution. Total payments to capital have expanded enormously since the
Industrial Revolution, but only because the stock of capital has grown hugely. The stock of
capital has been indefinitely expandable. It has grown even faster than total incomes, and its
abundance has kept real returns per unit of capital low. Since we expect the return to human
capital to be in line with the returns to physical capital in a competitive economy, the gains of
skilled workers, as we shall see, have been similarly limited.
Ricardo, the first economist to focus explicitly on the distribution of income, writing at
the outset of the Industrial Revolution in the England of 1817, foresaw a future in which land
rents would increase relative to wages and to the return on capital as population increased,
3
because land was the fixed factor in production. But similarly to capital none of the efficiency
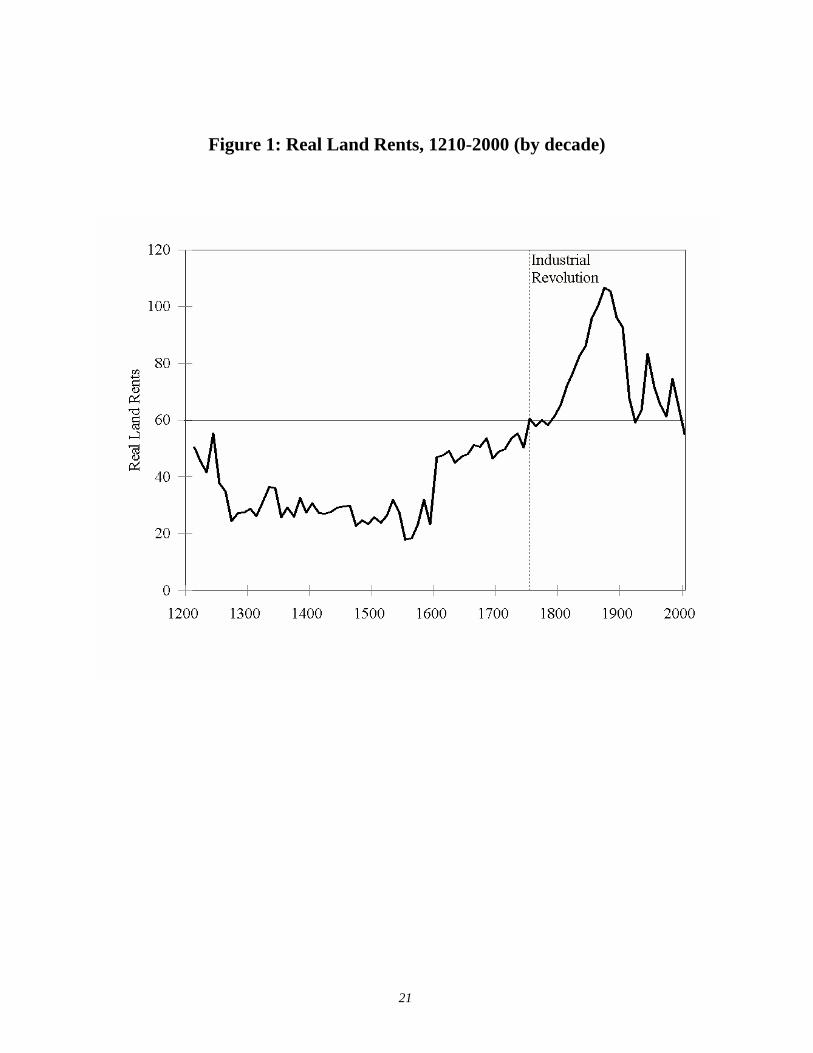
gains have shown up as gains by the owners of farmland. Figure 1 shows the real rent of
farmland, the nominal rent per acre divided by the average price of goods, from the thirteenth
century to 2002. Real land rents peaked in the mid-nineteenth century, but have been in general
decline since. The rent of an acre of farmland in England thus currently only buys as much
goods as it did in the 1760s. This does not take into account changes in the value of urban land,
where it is much more difficult to get long term measures, and where the implicit rental value
may have risen by much greater amounts. But even taking this into account the conclusion
would remain that very little of the productivity growth since the Industrial Revolution was
collected by land owners. Given the fixed stock of land, this result is surprising. I consider
below why it occurred.
Where we do find the gains from the Industrial Revolution is in the increase in real wages
to the unskilled. Wage payments, as we saw, include payments for the human capital embodied
in workers through training and education. The amount of such training and education has
increased greatly since the Industrial Revolution, so that some of the overall wage gains are
really just another form of return to capital. But even if we look at the earnings of the least
skilled workers, building laborers or agricultural laborers, those with very little human capital,
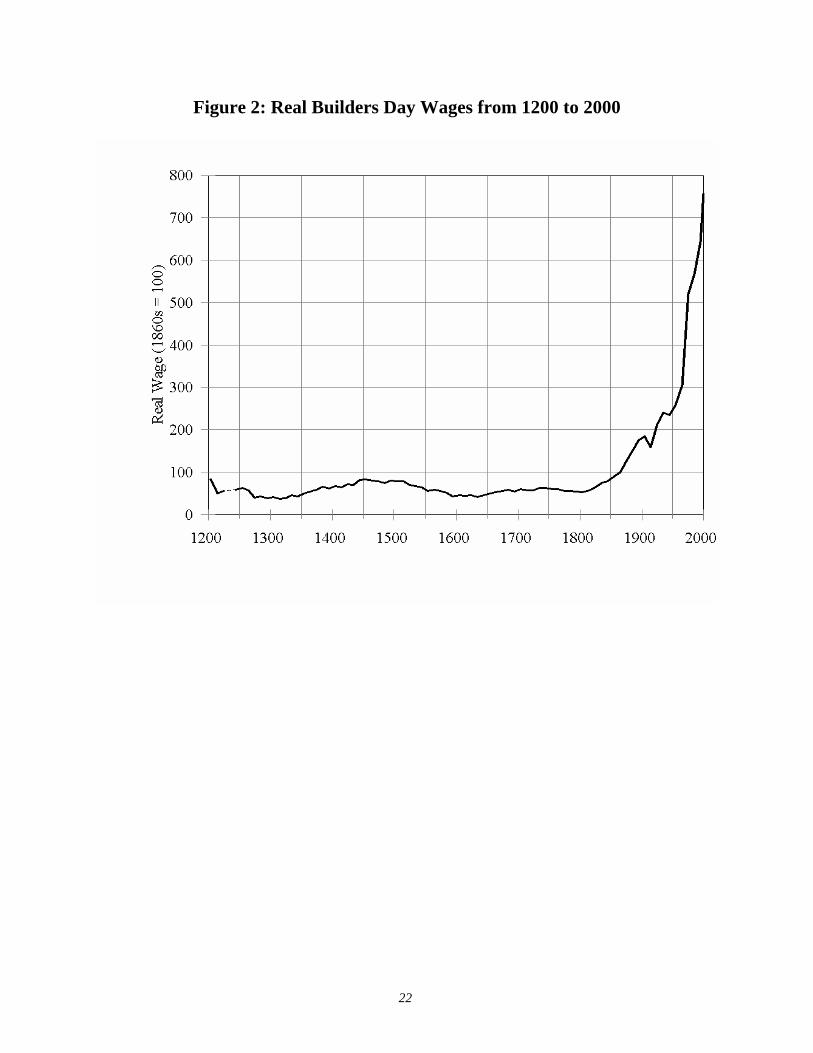
there have been tremendous gains since the Industrial Revolution. Figure 2 shows the real wages
per hour for building workers in England from 1200 to 2000. The enormous gains even for these
unskilled workers are very evident.
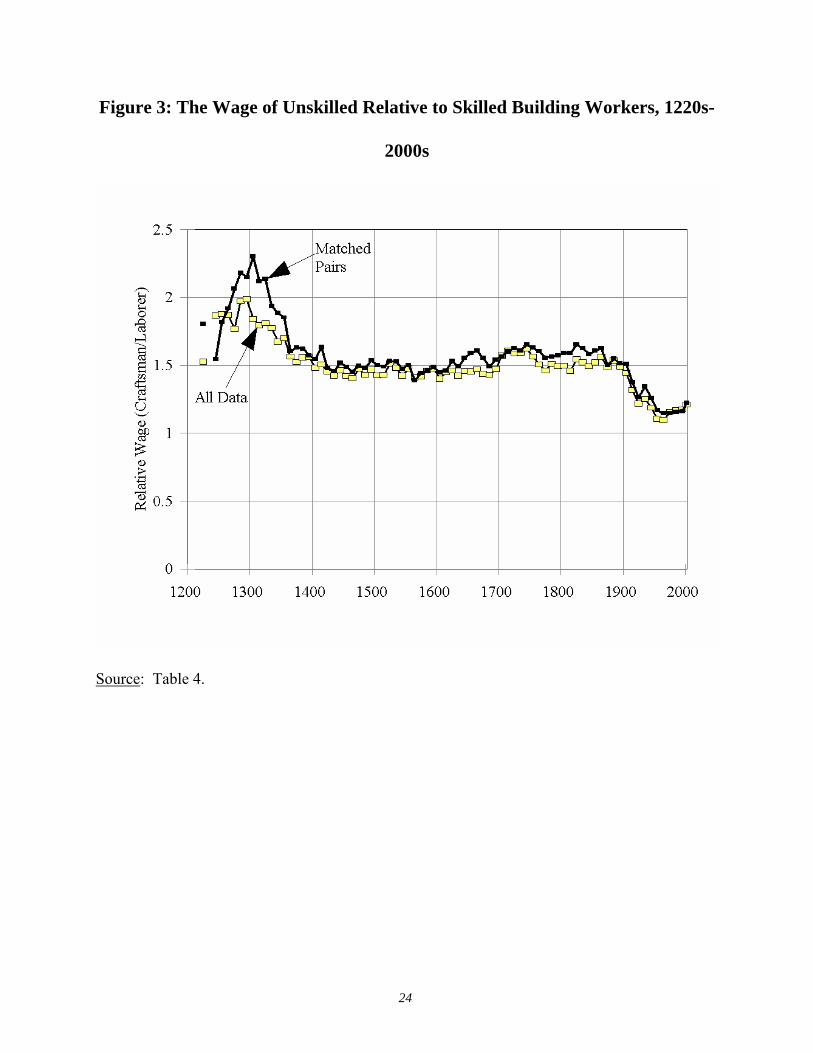
The evidence that the gains went more to unskilled labor than to human capital is the
premium paid for skilled workers. This we can calculate for the building industry all the way
from 1200 to 2000. Figure 3 shows this premium. In the earliest years this premium is more
than 100%. By the time of the Industrial Revolution it had already fallen to about 60%. Then in

4
the twentieth century there were further declines in the skill premium to only about 25% by
2000.
A simple interpretation of this declining skill premium is that it is the result of the
declining return to capital. Thus suppose, as a simplified example, workers worked only for two
periods. They can either get no training, in which case their wage in both periods is wu or they
can train in the first period and get a higher skilled wage ws in the second period. If r is the
discount factor for wages in the second period, then the relationship between the skilled and
unskilled wage, in order for investing in human capital to be just worth while, has to be
r
wr
ww su
u ++=
++
10
1
⇒ rww
u
s += 2
Another trend, that is not apparent in the male wage series we have used, is the narrowing
gap between men’s and women’s wages. In the pre-industrial era women’s wages seem to have
averaged less than half those of men, even for unskilled occupations. Thus for field laborers in
agriculture women’s wages in England in 1770-1860 averaged only 40-45% those of men. In
contrast by 2004 the average hourly wage of unskilled women in the UK was 84% that of
unskilled men.
The low wages of unskilled women laborers in the pre-industrial era probably did not
reflect discrimination against women once they entered the labor market (though there was
undoubtedly discrimination in training people for skilled occupations). Pre-industrial societies
seem to have had little difficulty in hiring women as brute laborers. From the earliest years in
societies such as England women show up in basic agricultural work, and where they had a
comparative advantage such as in reaping they were widely employed. The low average pay for
5
women seems instead to have reflected the premium attached to physical strength in a world
where much human labor supplied brute strength. In a world where men and donkeys were
relatively close substitutes, women were at a disadvantage. The Industrial Revolution, which
first replaced human labor in its most brutish aspects, thus was an instrument of liberation for
women. In some occupations in cotton textiles women for the first time were employed at wages
equal to those of men. By reducing the gap in earnings between men and women the Industrial
Revolution again narrowed overall inequality in modern societies.
The fact that the growth of returns to capital and land has been 0 implied that for the
advanced economies since the Industrial Revolution equation (1) reduces to
gA ≈ b.gw/p
Since the share of income paid to unskilled labor is perhaps 0.5 in modern economies, this
implies that we can measure productivity growth since the Industrial Revolution by just taking it
as half the growth rate of the real wage of unskilled labor.
The Industrial Revolution, by disproportionately favoring unskilled labor, probably
reduced income inequality within the revolutionized economies. In all societies the ownership of
capital and land tends to be highly unequal, with a large share of the population possessing no
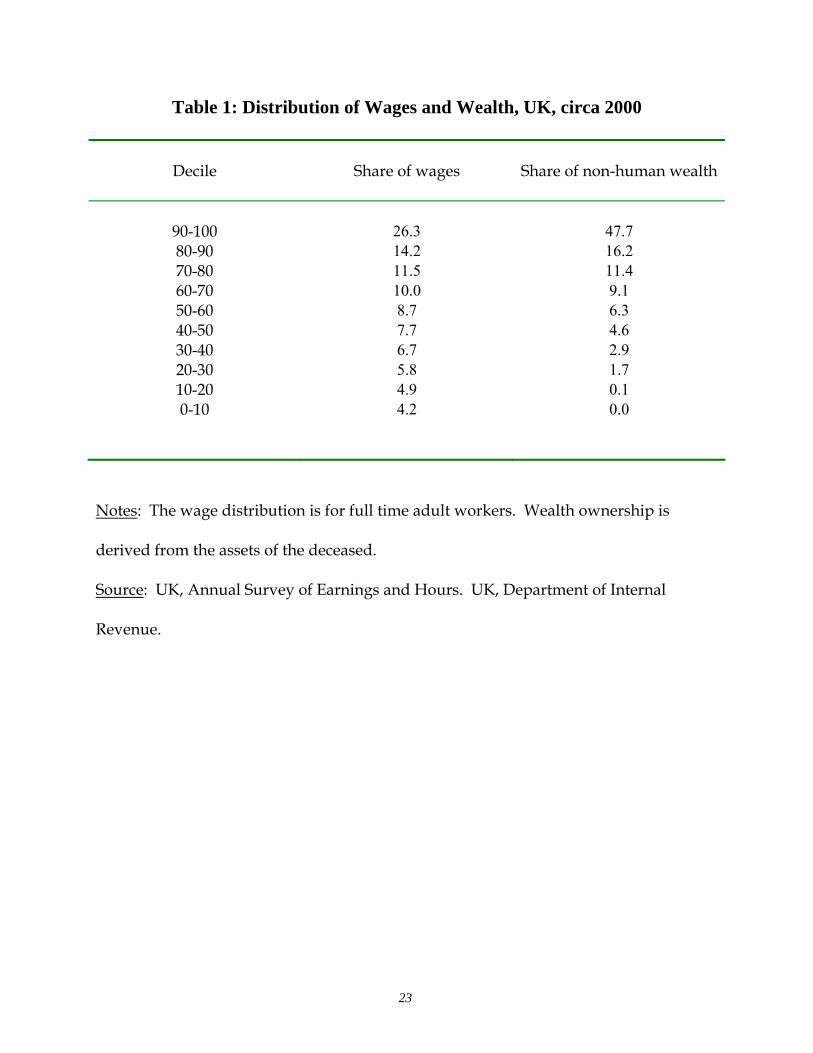
marketable wealth. Table 1, for example, shows the distribution of wage income in the UK in
2004 (for full time workers) compared to the distribution of marketable wealth. Despite the
much greater importance of human capital in modern societies than in earlier economies, the
distribution of wages is still much more equal than is the distribution of the ownership of capital.
The lowest paid decile still gets about 40% of the average wage, and the highest paid decile gets
less than three times the average wage. With wealth the poorest decile has none, while the
richest decile has five times the average wealth per person.
6
Had the gains of the Industrial Revolution gone equally to asset owners (including human
capital) as to unskilled labor, then income inequality would have steadily increased since 1800.
But the benefits went disproportionately to the one income source that every citizen has an equal
allocation of, and the one income source that people cannot alienate. So instead the general
trend since 1800, only reversed in the last twenty years, has been towards greater equality of
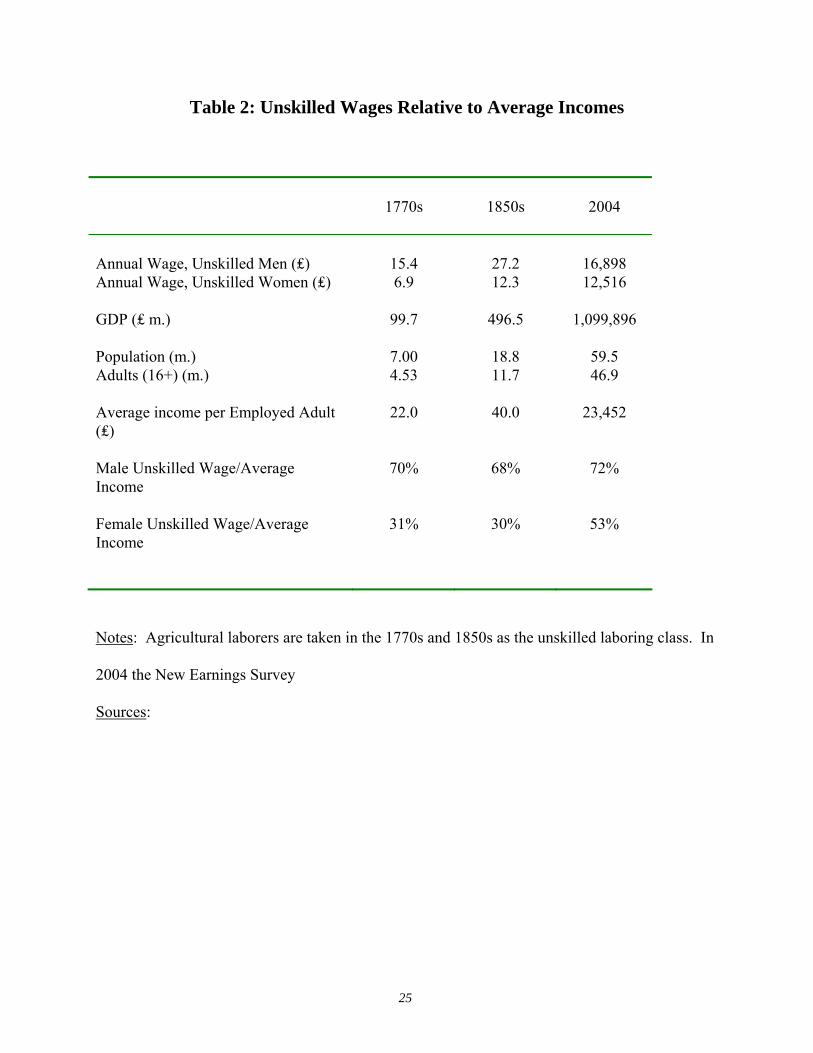
income in Industrial Society. Table 2 shows one measure of the income distribution which is the
annual wage of unskilled labor relative to average income per adult. In the 1770s a male
agricultural laborer earned 70% of the average income per capita for adults, and a female farm
worker only 31%. By 2004 unskilled male laborers in the UK were earning 72% of average
adult income, while unskilled women had climbed to 53%.
Why did land not get the gains?
Given that we had an Industrial Revolution that improved first the productivity of the
industrial sector relative to the agricultural, why did land owners not benefit hugely from an
increased scarcity of land as population and incomes rose rapidly after 1800, as Ricardo
imagined? The reasons that land, after some initial gains early in the Industrial Revolution saw
declines in real returns, are threefold:
(a) The income elasticity of the demand for many products intensive in land has been
relatively low. Thus the number of calories consumed per day by modern high income
consumers is lower than for workers before the Industrial Revolution, because a major
determinant of calorie consumption is the amount of physical labor people undertake. In the pre-
7
industrial era people supplied a lot of the power in production, whether as farm laborers digging,
hauling and threshing, or as wood hewers, brick makers, metal formers and porters. In our
society not only do we have machines to perform all these tasks, we also have machines to move
us from house, to coffee shop, to the doors of our work places. Within these work places
machines haul us up and down between floors. Thus despite our very high incomes, and
relatively large stature, the average male in the modern USA consumed only about 2,700 kcal.
per day, and still many have gained substantial amounts of weight. In the 1860s male farm
workers in some areas of Britain, generally smaller and lighter than modern US males, consumed
4,500 kcal. per day. They consumed this much because they engaged in physical labor 10 hours
a day for 300 days per year.
Thus as incomes expanded the demand for land in production expanded much less than
proportionately.
(b) There has been enormous growth in the productivity of agriculture, specifically in
land saving technologies, so that despite the fixed factor land, farm output has risen faster than
population.
(c) The mining of fossil fuels, coal and oil principally, has provided the energy to
modern societies that agriculture used to be a major provider of. By mining the energy produced
by the land over eons, and stored in the ground for the ages, our society has temporarily at least
expanded the land supply by enormous amounts. By the 1860s in England, for example, farm
outputs were worth ₤114 million per year. Coal outputs by that date were ₤66 million per year,
so that energy from coal had already by then added a huge supplement to the output of the
agricultural sector.
Why did technological advance not reduce the wages of unskilled labor?
8
We think of the Industrial Revolution as practically synonymous with mechanization,
with the replacement of human labor by machine labor. Why is there still in high income
economies a robust demand for unskilled labor? Why are there still unskilled immigrants with
little command of English walking across the deserts of the US southwest to get to the labor
markets of the major US cities because of the enormous rewards to their labor, even as
undocumented workers, in these places? Why were there people camped out for months and
even years at the Channel Tunnel freight depot in northern France waiting for a chance to break
through the security fence and onto a train for Britain?
Soon after the arrival of the Industrial Revolution “the Machinery Question” became a
matter of debate among the new Political Economists. What would happen to labor demand with
new technologies? Famously Ricardo, who had initially defended the introduction of machinery
as benefiting all, by 1821 constructed a model in which some types of labor-saving machinery
produce technological unemployment. Ricardo’s demonstration, however, relied on workers
receiving a fixed subsistence wage, and it was later appreciated that as long as there are
sufficient substitution possibilities between capital and labor, there will always be a positive
marginal product for each type of labor, and hence the possibility of full employment.
This general reassurance from economic reasoning is of little practical value, however,
since it offers no assurance on what the actual level of wages will be. Why was it that there was
not only a job for all unskilled workers, but also a well paying job? After all there was a large
class of employees at the beginning of the Industrial Revolution whose jobs and livelihoods
largely vanished by the early twentieth century. This was the horse! In 1800 it is believed 1-1.5
million horses were at work in England. They ploughed fields, they hauled wagons and
carriages on roads, the pulled boats on the canals, they toiled in the pits, and they drove
machinery, they carried armies into battle. But steam railways and canal boats replaced them in
9
haulage, stationary steam engines drove machinery, and steam ploughs even emerged in
agriculture. Finally with the arrival of the internal combustion engine in the late nineteenth
century they were replaced even for transporting goods short distances. There was always a
wage at which all these horses could have remained in employment. But that wage was so low
that it did not pay their feed, and certainly did not pay to breed fresh generations of horses to
replace them. Horses were thus an early casualty of industrialization.
Many tasks performed by people seemed as replaceable as those of horses. And a
number of human tasks were quickly mechanized. Threshing grains, the staple winter
occupation which absorbed as much as a quarter of agricultural labor input was mechanized by
the 1860s. Reaping and mowing followed in the later nineteenth century. But the grim future of
a largely unemployable unskilled labor force has not resulted. Instead the earnings of these
unskilled workers, as evidenced in figure 3, has risen relative to that of the skilled.
Two things seem to explain the relatively high value to the economy of even unskilled
labor. The first is that unlike horses, people have attributes that machines so far cannot replace,
or can only replace at too high a cost. The first of these is that people supply not just power, but
also dexterity. We are very good at locating objects and moving them to new locations, and
machines are still surprisingly poor at these tasks. Thus the fast food industry that feeds legions
of Americans every day a highly standardized product does so using human labor still to bring
the meat to heat, and singed flesh to bun. Houses and hotel rooms are still cleaned by people,
gardens are still weeded by human gardeners. People guide trucks and cars on highways, and
they guide powered tools in farming, mining and construction. Supermarkets contain thousands
of standardized packages of product, but they are still placed on the shelves by people, and
priced and bundled at checkout by people. Recently there have been attempts to develop
services where customers order groceries on the web and have then delivered to their homes.
10
Some purveyors invested in large custom designed automated warehouses where machines
assembled the order from the already encoded instructions of the customer and packed them in
containers. These attempts were unsuccessful, however, and the surviving online grocery
purveyors combine high tech ordering of the groceries with unskilled workers who pick the
goods from the shelves and pack them in containers.
Ironically computers have found it much easier to replace what we think of as the higher
cognitive functions of humans – calculating amounts due, calculating engineering stresses,
taking integrals – than they have to replace the simple skills we think of even the most unlearned
as possessing.
The second difficult to replace ability of people is our ability to interact with other
people. We have a social intelligence that alerts us, at least in some part, to the thoughts and
moods of others, and that ability can be very valuable in modern commerce. The increasing
returns to scale inherent in most modern production processes implies that for the typical
transaction the price, p, is much greater than the marginal cost, mc, of the good sold. That means
that, unlike in competitive markets such as that for wheat in the pre-industrial world where for
each good p = mc, the producers have an incentive to spend resources in trying to sell more
product, in trying to get customers to choose your product rather than the near identical product
of your competitor. Selling is a huge part of modern economies, and on the front lines in that
war of commerce people are still very useful foot soldiers. A pleasant interaction with the seller
can make customers choose to eat in this restaurant as opposed to that, shop here as opposed to
there. Customer service agents in call centers are thus now guided by computers through a
decision tree that direct them as to how to interact with customers. They are not called upon to
exercise much judgment or discretion, they are just the human face of a planned strategy of
interaction, but a face that is still very much necessary.
11
The past in this, however, is no reliable guide to the future. As long as computer
processing power keeps becoming cheaper the threat will always be present that these last scarce
attributes of even unskilled human labor will lose their value. Then truly there will be a class of
displaced workers forced for their subsistence to look to the charity of their fellow citizens.
While these attributes of the human machine are hard to replace, the other big change
since the Industrial Revolution that has kept unskilled wages high has been the unexpected
curtailment in the supply of people in the most rapidly growing economies. We saw for the
Malthusian era in England that the evidence is that the more income and assets people had at the
time of their death the more surviving children they had. Economic success and reproductive
success went hand in hand. If this pattern had continued to the present population would have
grown enormously, and the Ricardian dystopia where growth is eventually curtailed by the
constraint of the fixed area of land would have been closer to realization. Below I consider
these demographic changes in detail.
Fertility since the Industrial Revolution
Demography mattered crucially to living standards in the Malthusian era because the
fixed factor land was an important share of national income so that any increase in population
had a powerful effect on living standards. After the Industrial Revolution as the share of land
and natural resources in national income has dropped to insignificance for the industrialized
world, demography would seemingly be a minor cause of the surprising shift of income to
unskilled labor. Only in the poorest countries, as in sub-Saharan Africa and in those with large
natural resource endowments would population levels be important determinants of income.
But the small share of land in national income is plausibly the result of the fact that the
income gains of the Industrial Revolution ceased to get translated into more surviving children
12
and instead went into material consumption. Demography is now unimportant in such societies
as England or the USA because of important demographic shifts.
Figure 4 shows the course of the transition to lower fertility in England. The figure
shows two measures of fertility. The first is the gross reproduction rate (GRR), the number of
daughters born per woman who lived to 50, by decade. The average women gave birth to nearly
5 children all the way from the 1540s to the 1890s. Since in England 10-20% of each female
cohort remained celibate, for married women the average number of births was close to 6. The
“demographic transition” to modern fertility rates began only in the 1890s. By 2000 English
women gave birth on average to less than 2 children. The second measure of fertility is the Net
Reproduction Rate (NRR), the number of daughters per woman who lived to childbearing years
themselves. This fell much less. Indeed for the average pre-industrial society the NRR would be
much closer to 1 than in prosperous pre-industrial England in the years 1540-1800. So the
decline in NRR with the arrival of the modern world has been minimal. Note that the GRR and
NRR both rose in the era of the classic Industrial Revolution in England, whose onset is
generally taken as in the 1760s. This accounts for the relatively high population density of
Britain compared to other European countries such as France and Spain.
What triggered the switch to the modern equilibrium with few children despite high incomes?
The first possibility is the general rise of incomes. The decline in fertility is clearly correlated
with income, both if we look across societies and if we look at particular societies over time.
This fact has led some economists, such as Gary Becker, to posit that the driving force in
declining fertility was just the great gain in incomes since the Industrial Revolution. But if
people have fewer children as incomes rise it implies that children in economic terms are
“inferior” goods, in the same category of goods such as potatoes. Why do people want more
housing space, more cars, and more clothes as they get richer, but not more children? Gary
13
Becker has argued that the demand for children can be analyzed as for any commodity, as long
as we are careful to note that there are two constraints on consumption. The first is the budget
constraint: how much a person has to spend. The second is the time constraint - there are only
24 hours in each day with which to consume things. Thus as incomes rise and the budget
constraint relaxes, the time constraint on consumption becomes all the more important. Richer
consumers will thus tend to switch consumption away from time intensive activities and towards
goods that use less time. Thus as people get richer they tend to buy many time saving services,
such as prepared foods or restaurant meals. Children as a consumption item are time intensive in
the extreme. Thus higher income consumers have switched consumption away from children to
goods that use less time - expensive homes, fancy cars, nice clothes. Further, Becker argues, the
way to measure the amount of “child services” parents consume is not just by counting the
number of children. Parents can invest more or less quality in each child. As time gets more
expensive for parents they choose to have fewer children but children that they invest more in so
that they provide more flow of services to the parents.
This would imply the demographic transition was merely an echo of the Industrial
Revolution, and inevitable consequence of rising incomes. Figure 2, for example, which shows
the hourly real wage of building workers in England from 1200 to 2000 reveals that real income
gains were actually modest in the classic Industrial Revolution period. Only after the 1860s did
real wages begin to rise rapidly. And only after the 1860s did fertility decline substantially. In
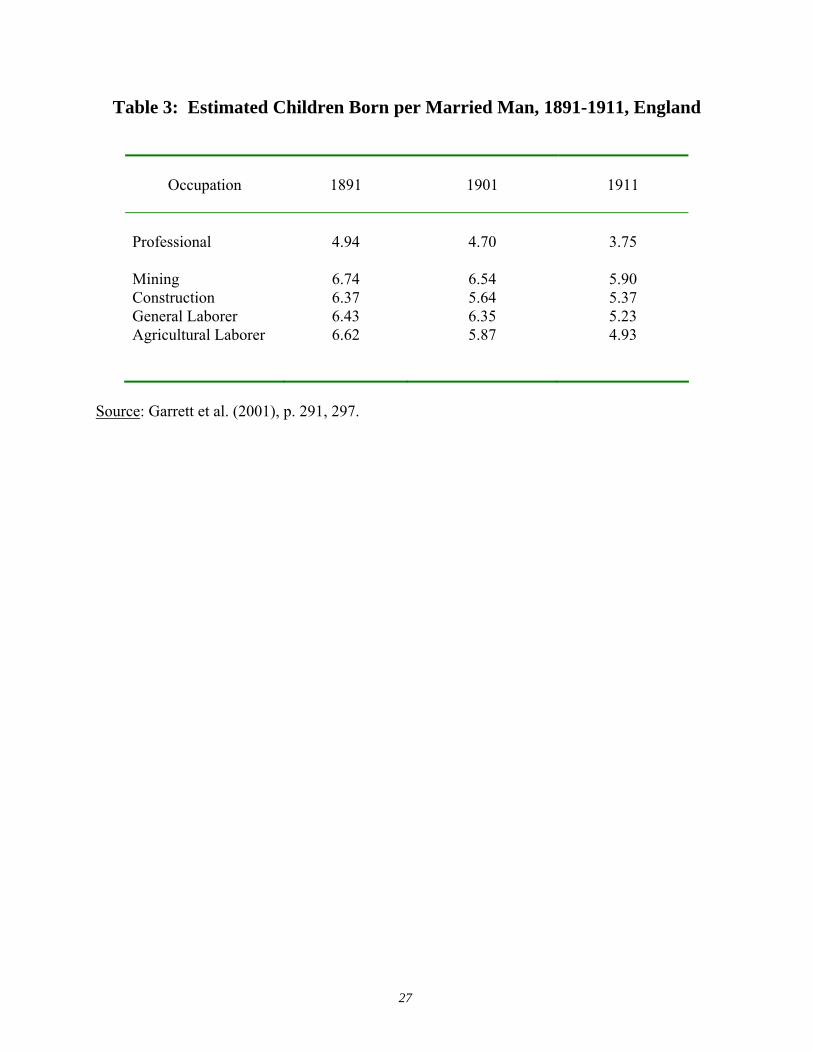
the modern world there is a strong negative fertility-income relationship across countries. We
also see in late nineteenth century England during the demographic transition a negative
association between higher social class (a proxy for income) and numbers of children. Table 1
shows for 1891, 1901 and 1911 the estimated of numbers of children present in households by
the occupation of the male household head. The numbers of children are unchanged from the

14
pre-industrial era for the low income groups, but have already fallen from these levels by 1891
for the professional classes. In all the cross sections the high income group has lower gross
fertility even as by 1911 the gross numbers of children begin to fall for the poorest groups.
The first problem with explaining the fertility transition through income is that all plausible
models of population regulation for the pre-industrial world depend on a positive association
between NRR and income for some range of incomes. Information on fertility compared to
income is rare for the pre-industrial world. But chapter 7 showed how we can infer the
connection in between fertility and income circa 1600 from wills of male testators in pre-
industrial England. A man bequeathing less than ₤10 would typically leave two children, while
one bequeathing more than ₤500, four children. Assets, undoubtedly correlated with income,
predict survivors. Thus in pre-industrial England there was a positive association between
income and net fertility over a wide range of incomes. Those at the higher end of this range of
incomes had real incomes easily as great as many people in the 1900s in England when income
seems negatively associated with income. This positive association between fertility and income
seemingly becomes negative in the period of the demographic transition.
Further in modern high income low fertility societies there seems to be, recently at least, NO
association between income and fertility. A recent study of female fertility found on average no
association between household income and fertility, measured as the numbers of children present
in the households of married women aged 30-42, for both 1980 and 2000, for the six countries
Canada, Finland, Germany, Sweden, the UK, and the USA (Dickmann (2003), Table 2). This
suggests that the income-fertility relationship within societies changed dramatically over time.
But note that in England around 1900, the only period with a clear negative relationship, the
fertility data is for gross fertility. Given high child mortality rates in these years (evident in
figure 4) it may be that in all the cross sections there is no decline of net fertility with income.
15
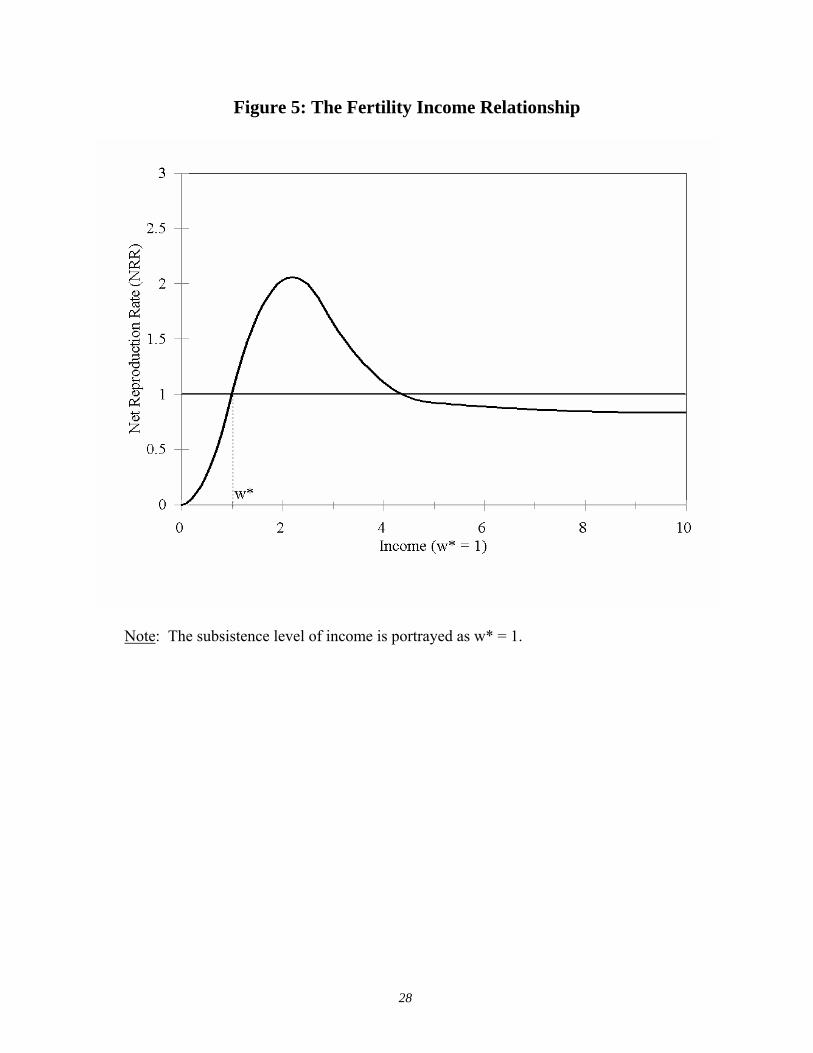
Thus the relationship between net fertility and income as we move from the pre-industrial to
the modern era seems as portrayed in figure 5. The very different behavior of the link between
income and fertility in cross section in the pre-industrial era, the era of the fertility transition, and
recent years makes constructing a link between fertility and income alone challenging.
Modern societies have much better methods of fertility regulation than in the world
before 1800. In particular oral contraceptives for women, vasectomies for men, better materials
for barrier methods such as condoms, and abortion methods that are physically safer for women
and also de-criminalized. It is thus widely believed that the fertility decline is in part another
direct result of technological advance. This would imply that richer people in the pre-industrial
era typically ended up having more surviving children than they desired. But if we look at figure
4 we see that most of the decline towards levels of gross fertility characteristic of modern
developed economies was accomplished in England by the 1920s, long before the Contraceptive
Pill, legalized abortion and vasectomies. Using only abstinence, withdrawal, and less developed
barrier methods, technologies available in England at least as early as the seventeenth century,
birth rates for married women were reduced to less than half their previous levels. This also
happened in a social environment where birth control was rarely discussed in public forums.
Even more dramatically, starting in the late eighteenth century the French reduced their fertility
rates to equivalent to England in 1901 already by the 1850s. Thus the possibility of controlling
fertility seemingly existed long before the Demographic Transition.
Another possible explanation for the decline of fertility since the Industrial Revolution is
the increased social status of women. Plausibly the Industrial Revolution increased the relative
earnings of women. Most labor in the pre-industrial world involved mainly the supply of power
through human muscles. Men have an advantage here. Women’s earnings in pre-industrial
agriculture in England were thus typically only 40-60% those of men (Clark (2003)). But in the
16
modern world workers supply almost exclusively dexterity, cognitive and social skills, where
men have no advantage. The average earnings of women have greatly improved relative to those
of men in the last 50 years.
If women, as a consequence of their low relative earnings before the Industrial
Revolution, did most child rearing, then the rise in relative female earnings could explain
declining modern fertility. The puzzle for historians has been, however, that female labor force
participation seems to have declined in countries such as England when real wages began to rise
in the late nineteenth century. Thus the 1851 census in England ascribes an occupation to 25%
of married women. By 1901 the census categorizes only 13% of married women as employed
and by 1931 a mere 10%. Marital fertility declines just when married women are withdrawing
from the labor force, in part because the Industrial Revolution moved most industrial
occupations out of the domestic setting into factories. Goldin (1990) reports a similar effect for
the USA.
Further, in England in 1851 female participation in different regions is not well explained by
relative wages. In the northern Industrializing areas women constituted more than 30% of the
hired farm labor force in some counties, while in the more rural south women were less than 5%
of hired farm labor in many counties (Clark (2003)). Yet the wages of female farm workers were
lower relative to male farm wages in the north. High labor force participation in the
industrializing north reflected a shift in female labor supply, not changes in demand.
There is a striking coincidence in the rise in the literacy of women in England in the late
nineteenth century and the onset of the demographic transition. Suppose we were to take literacy
rates for women as an index of the relative status and power of women in household decision
making. Also assume that the numbers of children desired by women was always significantly
less than for men in a world where early childcare was the province of women only. Finally
17
assume the rising relative status of women, like female literacy, spread down through the social
classes from the upper classes first.
These assumptions could explain why net fertility falls after the late nineteenth century even
though in cross section in the sixteenth century and in 2000 there is either a positive connection
between income and net fertility or no connection. They could also explain why the
demographic transition appeared first in the higher socio-economic status groups, so that net
fertility is negatively related to income in the transition period.
Why did Capital not get more of the Gains?
I have already discussed above why innovators have from the Industrial Revolution on
generally collected little of the productivity advance their innovations produced. The returns to
capital employed in industrial production have often exceeded the competitive market return on
capital. But the presence of these higher returns seems to owe more to the ability of some firms
to create barriers to entry to their sector than to the existence of rapid productivity growth in the
sector. These entry barriers generally had little to do with technological advances. They owe
more to factors such as increasing returns to scale.
Productivity growth in cotton textiles in England from 1770 to 1870, for example, far
exceeded that in any other industry. But the competitive nature of the industry, and the inability
of the patent system to protect most technological advances, kept profits low. Cotton goods
were homogenous. Yarn and cloth sold in wholesale markets where quality differences were
readily perceptible to buyer. The efficient scale of cotton spinning and weaving mills was
always small relative to the market. New entrants abounded. By 1900 Britain had about 2,000
firms in the industry. Firms learned improved technique innovating firms through hiring away
their skilled workers. The machine designers learned improved techniques from the operating

18
firms. Thus the entire industry – the capital goods makers and the product producers - over time
clustered more and more tightly in the Manchester area. By 1900 40% of the entire world output
of cotton goods was produced within 30 miles of Manchester. The main beneficiaries of this
technological advance thus ended up being two parties: consumers of textiles all across the
world, and the owners of land in the cluster of textile towns which went from being largely
worthless agricultural land to valuable building sites.
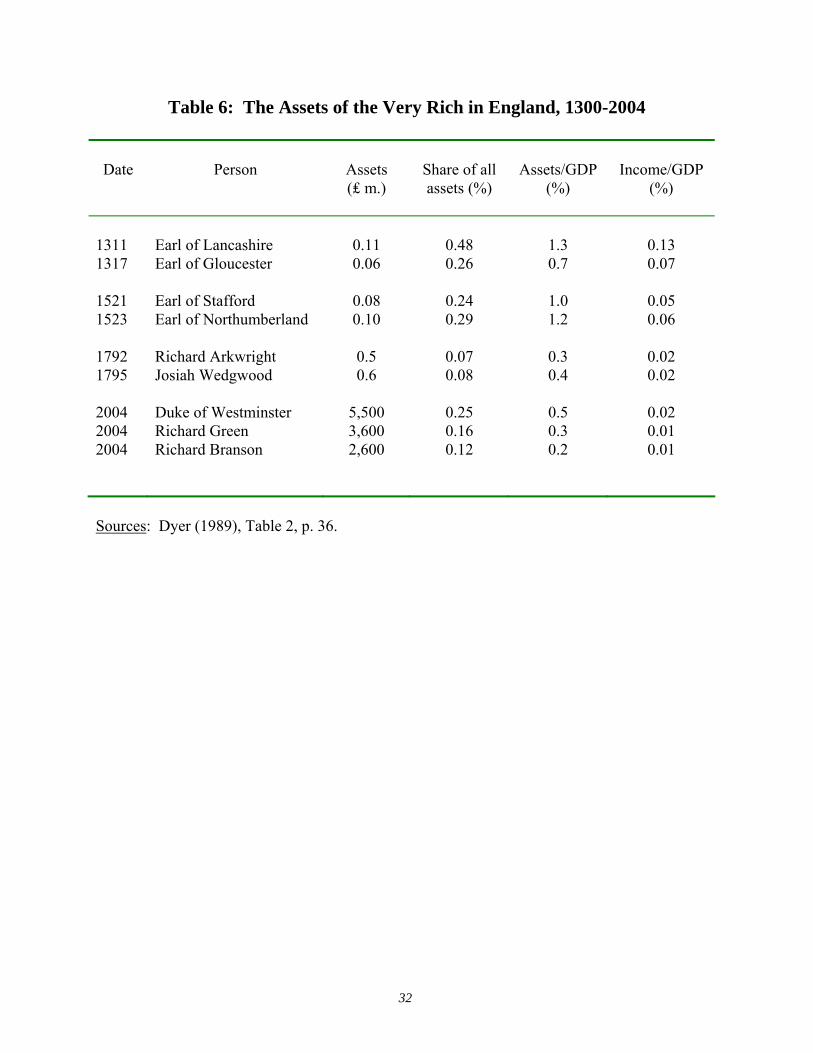
The greatest of the Industrial Revolution cotton magnates, Richard Arkwright, is
estimated to have left £0.5 m. when he died in 1792. His son, also Richard Arkwright, inherited
his father’s spinning mills. But though his son had managed his own mills and had much
experience in the industry which was still showing rapid productivity growth, he soon sold most
of his father’s mills, preferring to invest in land and government bonds. He did well at this
leaving £1.5 m when he died in 1830 despite sinking much money into a palatial country house
for his family. But Arkwright Senior accumulated less wealth than Josiah Wedgwood, who left
£0.6 m in 1795, even though Wedgwood operated in a sector, pottery, which had far less
technological progress (potteries were still hand enterprises by and large even in the late 19th c).
Traditionally none of the productivity advance in the Industrial Revolution has been attributed to
the pottery industry.
While the first great innovation of the Industrial Revolution era did not offer much in the
way of supernormal profits because of the competitive nature of the industry, the second,
railroads seemed to offer more possibilities. Railways are a technology with inherent
economies of scale. At minimum one line has to be built between two cities, and once it is built
a competitor has to enter with a minimum of a complete other line. Since most cities cannot
profitably support multiple links exclusion thus seems possible.
19
The success of the Liverpool-Manchester line in 1830 – by the 1840s equity shares on
this line were selling for twice their par value - inspired a long period of investment in railways.
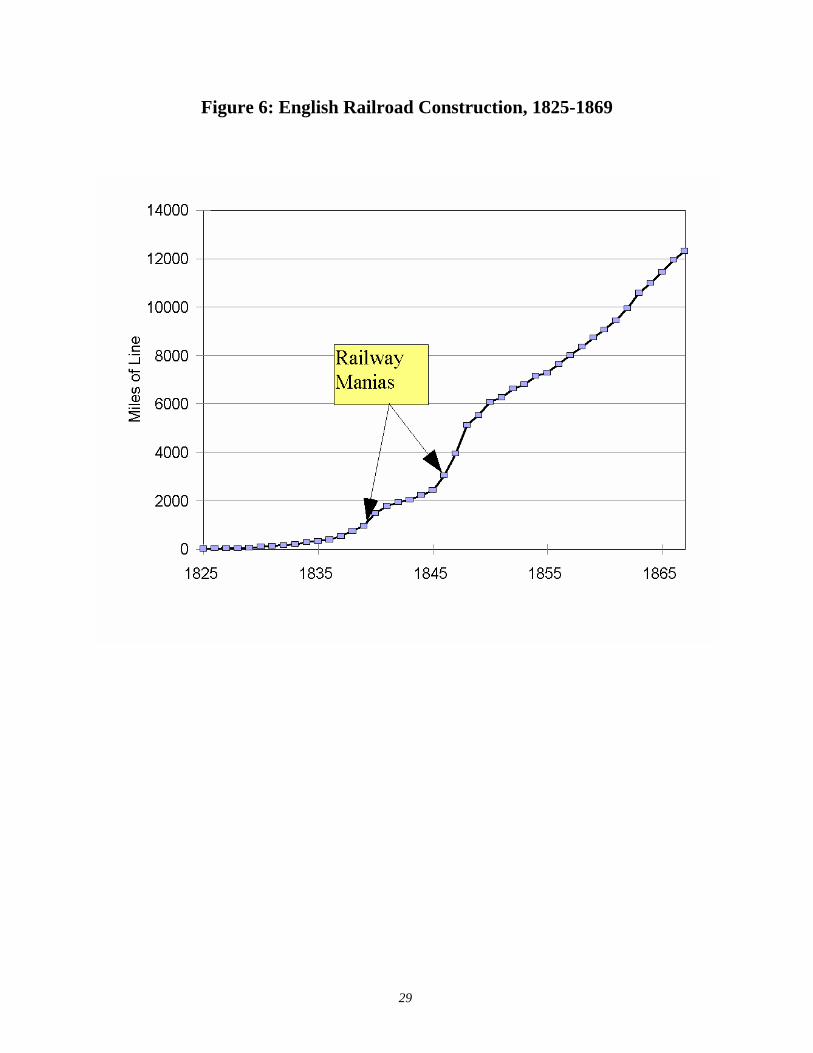
Table 6 shows the rapid growth of the railway network in England from 1825 to 1869, by which
time more than 12,000 miles of track had been laid across the tiny area of England. This
investment and construction was so frenetic that so called “railway manias” struck in 1839 and
1846. But again the rush to enter quickly drove down profit rates to very modest levels, as Table
2 shows. Real returns, the return on the capital actually invested, by the 1860s were no greater
than for very safe investments in government bonds or agricultural land. The reason was that
while railway lines had local monopolies, they ended up in constant competition with each other
through roundabout routes. Thus while, for example, the Great Western may have controlled the
direct line from London to Manchester, freight and passengers could cross over through other
companies to link up with the East Coast route to London. Again profits inspired imitation
which could not be excluded and the profit was squeezed out of the system. Consumers were
again the main beneficiaries.
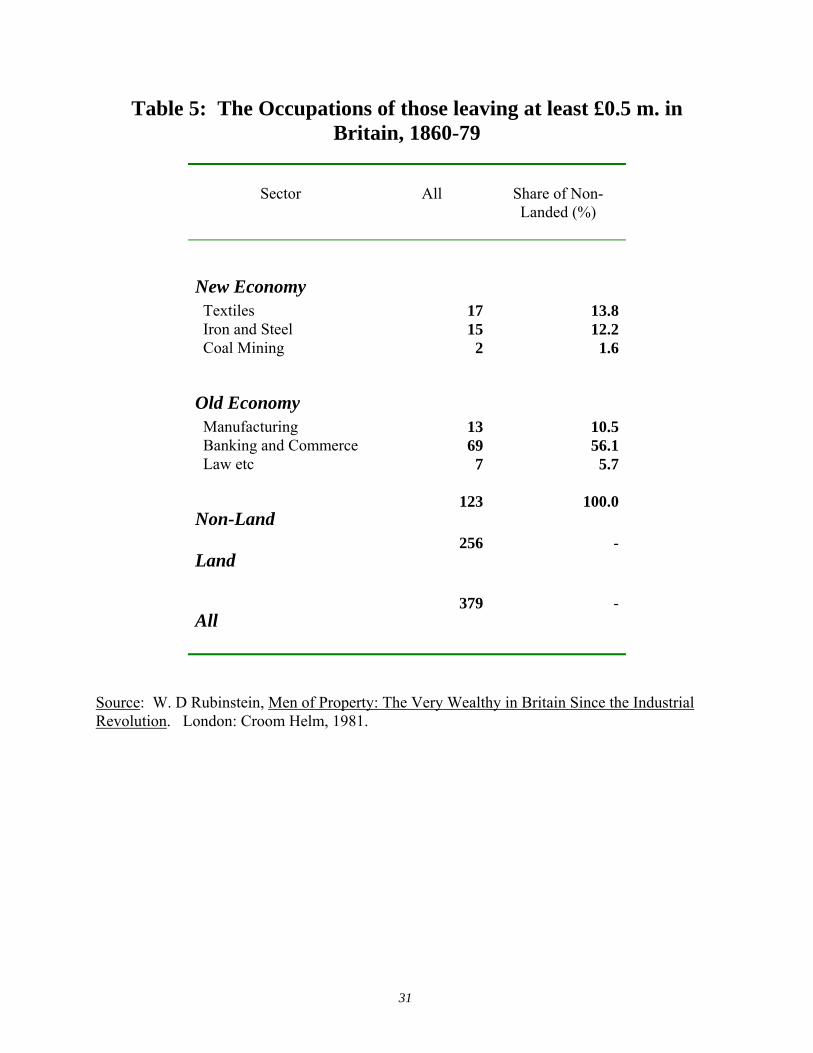
It is for this reason that unlike in the USA, there are very few universities and major
charities funded by private donors in England. The Industrial Revolution did not result in great
individual or family fortunes in England. By the 1860s the rich were still by and large the
descendants of the landed aristocracy. Table 3 shows this for those who died in the 1860s and
1870s.
For some reason the industrialization of the United States created much greater private
and family fortunes. Since prices, incomes, and the size of the population has changed greatly
over time the
20
Bibliography
Clark, Gregory (2003). “Agricultural Labor,” and “Agricultural Wages” in Joel Mokyr (ed.) The
Oxford Encylopedia of Economic History (Oxford: Oxford University Press), Vol. 1, 21-26 and
59-65.
Clark, Gregory (2004a). “The Condition of the Working Class in England, 1209-2003.”
Working Paper, UC-Davis.
Clark, Gregory and Gillian Hamilton (2004). “Was Pre-Industrial Society Malthusian? Tests
from England and New France.” Working Paper, UC-Davis.
Dickmann, Nicola. 2003. “Fertility and Family Income on the Move: An International
Comparison over 20 Years.” Maxwell School of Citizenship and Public Affairs, Syracuse
University, Working Paper #360.
Garrett, Eilidh, Alice Read, Kevin Schurer, and Simon Szreter. 2001. Changing Family Size in
England and Wales: Place, Class and Demography, 1891-1911. Cambridge: Cambridge
University Press.
Goldin, Claudia (1990). Understanding the Gender Gap: An Economic History of American
Women. New York: Oxford University Press.
Van Zanden, Jan Luiten (2004). “The European Skill Premium in International Comparative
Perspective, 1200-1950” Working Paper, University of Utrecht.
Wrigley, E.A. and R.S. Schofield. The Population History of England 1541-1871: A
Reconstruction. Cambridge Studies in Population, Economy, and Society in Past Time.
Cambridge University Press, 1989.
Wrigley, E.A., R.S. Davies, J.E. Oeppen, and R.S. Schofield. English Population History from
Family Reconstitution, 1580-1837. Cambridge Studies in Population, Economy, and Society in
Past Time, 32. Cambridge University Press, 1997.
21
Figure 1: Real Land Rents, 1210-2000 (by decade)
22
Figure 2: Real Builders Day Wages from 1200 to 2000
23
Table 1: Distribution of Wages and Wealth, UK, circa 2000
Decile
Share of wages
Share of non-human wealth
90-100 26.3 47.7 80-90 14.2 16.2 70-80 11.5 11.4 60-70 10.0 9.1 50-60 8.7 6.3 40-50 7.7 4.6 30-40 6.7 2.9 20-30 5.8 1.7 10-20 4.9 0.1 0-10 4.2 0.0
Notes: The wage distribution is for full time adult workers. Wealth ownership is
derived from the assets of the deceased.
Source: UK, Annual Survey of Earnings and Hours. UK, Department of Internal
Revenue.
24
Figure 3: The Wage of Unskilled Relative to Skilled Building Workers, 1220s-
2000s
Source: Table 4.
25
Table 2: Unskilled Wages Relative to Average Incomes
1770s
1850s
2004
Annual Wage, Unskilled Men (₤) 15.4 27.2 16,898 Annual Wage, Unskilled Women (₤) 6.9 12.3 12,516 GDP (₤ m.) 99.7 496.5 1,099,896 Population (m.) 7.00 18.8 59.5 Adults (16+) (m.) 4.53 11.7 46.9 Average income per Employed Adult (₤)
22.0 40.0 23,452
Male Unskilled Wage/Average Income
70% 68% 72%
Female Unskilled Wage/Average Income
31% 30% 53%
Notes: Agricultural laborers are taken in the 1770s and 1850s as the unskilled laboring class. In
2004 the New Earnings Survey
Sources:

26
Figure 4: English Fertility History, 1540-2000
Notes: GRR = Gross Reproduction Rate. NRR = Net Reproduction Rate.
Sources: Wrigley et al. (1997), p. 614. Office of National Statistics, UK.
27
Table 3: Estimated Children Born per Married Man, 1891-1911, England
Occupation
1891
1901
1911
Professional 4.94 4.70 3.75 Mining 6.74 6.54 5.90 Construction 6.37 5.64 5.37 General Laborer 6.43 6.35 5.23 Agricultural Laborer 6.62 5.87 4.93
Source: Garrett et al. (2001), p. 291, 297.
28
Figure 5: The Fertility Income Relationship
Note: The subsistence level of income is portrayed as w* = 1.
29
Figure 6: English Railroad Construction, 1825-1869

30
Table 4: Profit Rates on the Capital Invested in British Owned Railways, 1860-1912
Period
Rate of Return, UK
(%)
Rate of Return, British
Empire (%)
Rate of Return. Foreign Lines
(%)
1860-4 4.3 - - 1865-9 3.2 - 4.7 1870-4 3.5 - 6.7 1875-9 3.0 - 9.4 1880-4 3.8 0.1 7.2 1885-9 2.8 2.8 8.2 1890-4 3.0 2.9 5.4 1895-9 3.1 2.1 4.4 1900-4 2.6 1.4 3.8 1905-9 2.6 1.9 5.0 1910-12 2.6 3.1 6.6
31
Table 5: The Occupations of those leaving at least £0.5 m. in Britain, 1860-79
Sector
All
Share of Non-Landed (%)
New Economy
Textiles 17 13.8 Iron and Steel 15 12.2 Coal Mining 2 1.6
Old Economy
Manufacturing 13 10.5 Banking and Commerce 69 56.1 Law etc 7 5.7
Non-Land 123 100.0
Land 256 -
All 379 -
Source: W. D Rubinstein, Men of Property: The Very Wealthy in Britain Since the Industrial Revolution. London: Croom Helm, 1981.
32
Table 6: The Assets of the Very Rich in England, 1300-2004
Date
Person
Assets (₤ m.)
Share of all assets (%)
Assets/GDP
(%)
Income/GDP
(%)
1311 Earl of Lancashire 0.11 0.48 1.3 0.13 1317 Earl of Gloucester 0.06 0.26 0.7 0.07 1521 Earl of Stafford 0.08 0.24 1.0 0.05 1523 Earl of Northumberland 0.10 0.29 1.2 0.06 1792 Richard Arkwright 0.5 0.07 0.3 0.02 1795 Josiah Wedgwood 0.6 0.08 0.4 0.02 2004 Duke of Westminster 5,500 0.25 0.5 0.02 2004 Richard Green 3,600 0.16 0.3 0.01 2004 Richard Branson 2,600 0.12 0.2 0.01 Sources: Dyer (1989), Table 2, p. 36.