5a -,--4 0 7
TRANSCRIPT

5A -P, 7 - -,--4 07 P
MECHANICS OF COMPOSITE MATERIALS
WITH DIFFERENT MODULI IN TENSION AND COMPRESSION
by
/.' ROBERT M. 'ONES,
JULe 178 . //-I
CIVIL AND MECHANICAL ENGINEERING DEPA~I, T
SCHOOL OF ENGINEERING AND APPLIED SCIENCE
C.2_SOUTHERN METHODIST UNIVEfttr
DALLAS, TEXAS 75275
/FINAL SCIENTIFIC REPIT, 'J.,: 'i(- I,
RESEARCH SPONSORED UNDER AFOSR GRANT NUMBER 73-7532
AIR FORCE OFFICE OF SCIENTIFIC RESEARCH - .
DIRECTORATE OF AEROSPACE SCIENCES F? ;
BOLLING AIR FORCE BASE, D. C. 20332 Lc I
-. L)
APPROVED FOR PUBLIC RELEASE; DISTRIBUTION UNLIMITED
. .+' ,

Qualified requestors may obtain additional
copies from the Defense Documentation Center.
All others should apply to the National Tech-
nical Information Service.
Conditions of Reproduction
Reproduction, translation, publication, use,
and disposal in whole or in part by or for the
United States Government is permitted.
AIR FORCE OFFICE OF SCIENTIFIC RESEARCH (AFSC)IOTICE OF TRANSMITTAL TO DDCThis technical report has been reviewed and isr i proved for public release IAW AFR 190-12 (7b).bijtribution is unlimited. .A. D. BLOSETechnical Informition Officer
b,
SECURITY CLASSIFICATION OF THIS PAGE (When Data Entered) I!
REPORT DOCUMENTATION PAGE BEFORE COMPLETING FORM.REPORT NUMBER 12. GOVT ACCESSION NO. 3. RECIPIENT'S CATALOG NUMBER
4. TITLE (end Subtitle) S. TYPE OF REPORT & PERIOD COVEREDFINALMECHANICS OF COMPOSITE MATERIALS WITH JUNE 973 MAY 1978DIFFERENT MODULI IN TENSION AND COMPRESSION U PERFORMING ORG. REPORT NUMBER
7. AUTHOR(s) S. CONTRACT OR GRANT NUMBER(&)
ROBERT M. JONES AFOSR 73-2532
9. PERFORMING ORGANIZATION NAME AND ADDRESS 10. PROGRAM ELEMENT PROJECT, TASK
SOUTHERN METHODIST UNIVERSITY AREA & WORK UNIT NUMBERSCIVIL AND MECHANICAL ENGINEERING DEPARTMENT 61102F
DALLAS, TEXAS 75275 2307B1I. CONTROLLING OFFICE NAME AND ADDRESS 12. REPORT DATEAIR FORCE OFFICE OF SCIENTIFIC RESEARCH/NA JULY 1978
BUILDING 410 13. NUMBER OF PAGES
BOLLING AFB, D.C. 20332 12914. MONITORING AGENCY NAME & ADDRESS(If different from Controlling Offitce) 15. SECURITY CLASS. (of this report)
UNCLASSI FIED
15. DECLASSIFICATION/DOWNGRADINGSCHEDULE
IS. DISTRIBUTION STATEMENT (of this Report)
Appr:ovd for pulic release;
d 13t rtb!tiou u=Ilmlted.
17. DISTRIBUTION STATEMENT (of the abstract entered in Mlock 20, if different from Report)
IS. SUPPLEMENTARY NOTES
19. KEY WORDS (Continue on reverse side if necessary aid identify by block number)
COMPOSITE MATERIALS, STRESS ANALYSIS, BUCKLING, DIFFERENT STIFFNESSES,ORTHOTROPY, ANISOTROPY, GRAPHITE, CARBON-CARBON, GRAPHITE-EPOXY,BORON-EPOXY, BORON-ALUMINUM
2 . ABSTRACT (Continue on reverse side If necessary and Identify by block number)Composite materials have been used for several years in thermal protectionsystems such as reentry vehicle nosetips and heatshields as well as in moreconventional aerospace structures such as laminated wings and stabilizers inthe latest aircraft. Many composite materials, e.g., ATJ-S graphite, carbon-carbon, and graphite-epoxy, exhibit different strength and stiffness behaviorin tension and compression. The moduli differences range from 20% for ATJ-Sgraphite to between 100% and 400% for carbon-carbon. The principal objective
DD N 73 1473 EDITION OF I NOV65 IS OBSOLETE UNCLASSIFIEDi i SECURITY CLASSIFICATION OF THIS PAGE (When Date Entered)

IINI AISTFTFF)SECURITY CLASSIFICATION OF THIS PAGE(When Date Entered)
OLOCK 20, ABSTRACT, continued
of this research is to model the behavior of solid bodies with differentelastic moduli in tension and compression as well as the behavior oflaminated plates and shells that have different elastic moduli in ten-sion and compression and lamination asymmetries. The results of thiswork are coordinated with research sponsored by the Air Force MaterialsLaboratory on nonlinear stress-strain behavior of reentry vehiclematerials. This report is a summary of work done during the last fiveyears.
ANEIiaKEW Wit
NAHNDINC FUJ TI ,ICAT1,, ...... .......... . . , I
........... ......... ........ ........ .........
.... 2' D
iv UNCLASSIFIEDSECURITY CLASSIFICATION OF THIS PAGE(When Daea Entered)
TABLE OF CONTENTS
1. INTRODUCTION .......... ............................. ..
2. DESCRIPTION OF RESEARCH .......... ........................ 8
2.1 OVERVIEW OF ACTIVITIES DURING THE FIVE YEAR GRANT PERIOD . .. .8
2.2 STATEMENT OF RESEARCH SPONSORSHIP ..... ................. .10
2.3 GRANT-SUPPORTED PUBLICATIONS ..... ................... .. 11
2.4 GRANT-SUPPORTED ADVANCED DEGREES ..... ................. .14
2.5 REVIEW OF SPECIFIC RESEARCH ACCOMPLISHMENTS ............. .. 15
2.5.1 MATERIAL MODELS FOR NONLINEAR MULTIMODULUS
BEHAVIOR OF COMPOSITE MATERIALS .... .............. .15
2.5.1.1 ELASTIC MODELS ...... ................... .15
2.5.1.2 NONLINEAR MODELS ....... .................. 16
2.5.1.3 MULTIMODULUS MODELS ..... ................ .19
2.5.1.4 NONLINEAR MULTIMODULUS MODELS ............. .. 20
2.5.2 STRESS ANALYSIS OF SOLID BODIES MADE OF
NONLINEAR MULTIMODULUS MATERIALS .... .............. .21
2.5.2.1 ATJ-S GRAPHITE MODELING AND RESPONSE ........... 23
2.5.2.2 BORON-EPOXY AND GRAPHITE-EPOXY
MODELING AND RESPONSE .... ............... .. 30
2.5.2.3 CARBON-CARBON MODELING AND RESPONSE ............ 30
2.5.3 STRUCTURAL BEHAVIOR OF LAMINATED PLATES AND SHELLS ....... 34
2.5.3.1 ELASTIC MATERIAL BEHAVIOR..... .. ........... 34
2.5.3.2 NONLINEAR MATERIAL BEHAVIOR ... ............ .44
2.5.3.3 MULTIMODULUS MATERIAL BEHAVIOR ... ........... .49
3. MODELING NONLINEAR DEFORMATION OF CARBON-CARBON COMPOSITE MATERIALS . 52
3.1 INTRODUCTION ........ ......................... .52
3.2 CHARACTERISTICS OF CARBON-CARBON MATERIALS ............. .52
3.3.POSSIBLE THEORETICAL - EXPERIMENTAL RESPONSE COMPARISONS. . 67
3.3.1 MECHANICAL PROPERTY ANISOTROPY CLASSES
FOR CARBON-CARBON MATERIALS .... ............... .69
3.3.2 MATERIAL MODEL VALIDATION TESTS
FOR ATJ-S GRAPHITE ...... ................... .70
3.3.3 POSSIBLE MATERIAL MODEL VALIDATION TESTS
FOR CARBON-CARBON MATERIALS .... ............... .73
3.4 CARBON-CARBON NONLINEAR MULTIMODULUS MATERIAL MODEL ........ 79
V ji
3.5 EFFECT OF SHEAR COUPLING ON UNIAXIAL OFF-AXIS LOADING ....... 91
3.5.1 ADAPTATION OF ELASTIC ANALYSIS FOR
SHEAR COUPLING TO NONLINEAR MATERIALS .............. .91
3.5.2 STRAINS FOR OFF-AXIS LOADING IN THE
xz-PLANE OF AVCO MOD 3a CARBON-CARBON .............. .96
3.5.3 STRAINS FOR OFF-AXIS LOADING IN THE
xy-PLANE OF AVCO MOD 3a CARBON-CARBON .............. 103
3.6 COMPARISON OF PREDICTED AND MEASURED STRAIN RESPONSE FOR
UNIAXIAL OFF-AXIS LOADING OF AVCO MOD 3a CARBON-CARBON.. . .108
3.7 CONCLUDING REMARKS ....... ....................... 113
4. SUMMARY ........... ................................ 115
5. REFERENCES ......... .............................. 118
vi
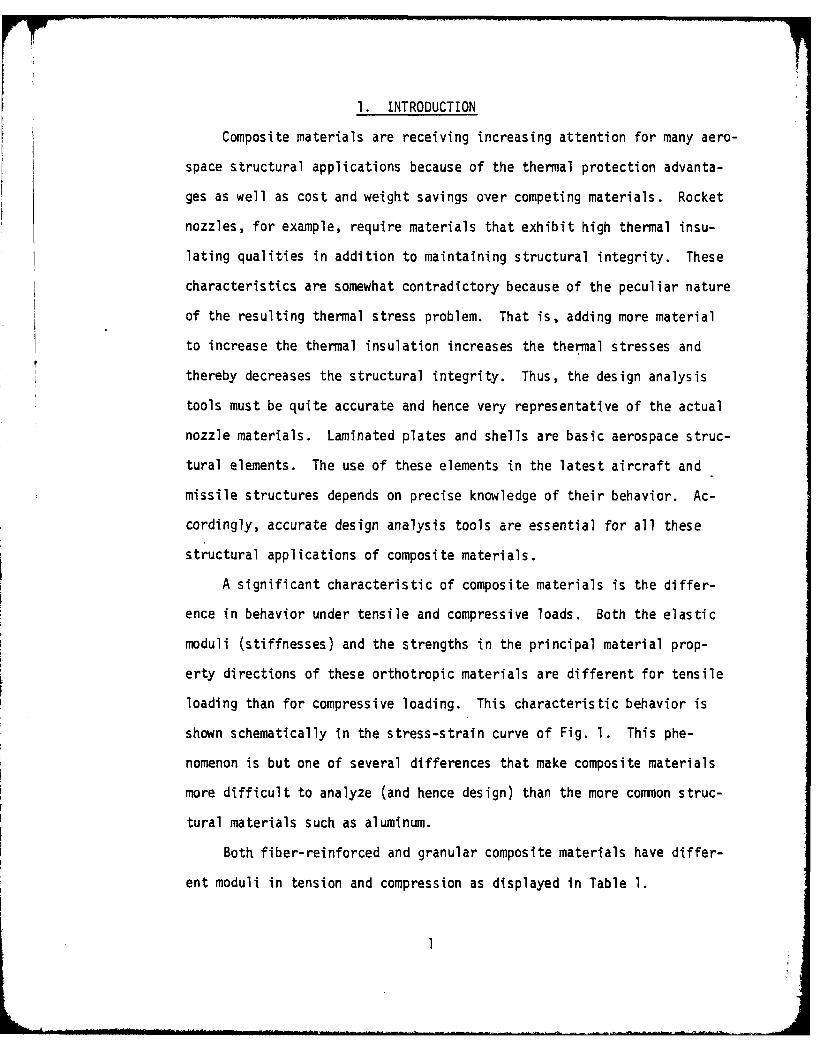
1. INTRODUCTION
Composite materials are receiving increasing attention for many aero-
space structural applications because of the thermal protection advanta-
ges as well as cost and weight savings over competing materials. Rocket
nozzles, for example, require materials that exhibit high thermal insu-
lating qualities in addition to maintaining structural integrity. These
characteristics are somewhat contradictory because of the peculiar nature
of the resulting thermal stress problem. That is, adding more material
to increase the thermal insulation increases the thermal stresses and
thereby decreases the structural integrity. Thus, the design analysis
tools must be quite accurate and hence very representative of the actual
nozzle materials. Laminated plates and shells are basic aerospace struc-
tural elements. The use of these elements in the latest aircraft and
missile structures depends on precise knowledge of their behavior. Ac-
cordingly, accurate design analysis tools are essential for all these
structural applications of composite materials.
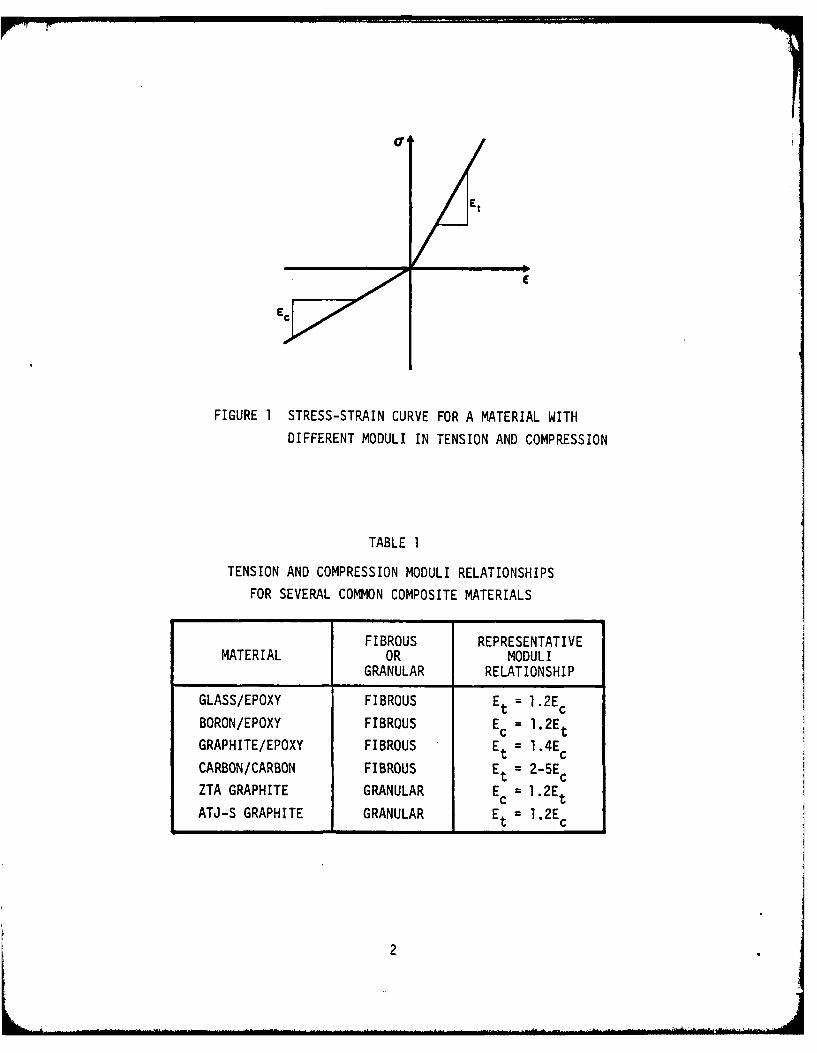
A significant characteristic of composite materials is the differ-
ence in behavior under tensile and compressive loads. Both the elastic
moduli (stiffnesses) and the strengths in the principal material prop-
erty directions of these orthotropic materials are different for tensile
loading than for compressive loading. This characteristic behavior is
shown schematically in the stress-strain curve of Fig. 1. This phe-
nomenon is but one of several differences that make composite materials
more difficult to analyze (and hence design) than the more common struc-
tural materials such as aluminum.
Both. fiber-reinforced and granular composite materials have differ-
ent moduli in tension and compression as displayed in Table 1.
Et
FIGURE 1 STRESS-STRAIN CURVE FOR A MATERIAL WITH
DIFFERENT MODULI IN TENSION AND COMPRESSION
TABLE 1
TENSION AND COMPRESSION MODULI RELATIONSHIPS
FOR SEVERAL COMMON COMPOSITE MATERIALS
FIBROUS REPRESENTATIVEMATERIAL OR MODULI
GRANULAR RELATIONSHIP
GLASS/EPOXY FIBROUS Et = 1.2EcBORON/EPOXY FIBROUS Ec = 1.2EtGRAPHITE/EPOXY FIBROUS Et = 1.4Ev
CARBON/CARBON FIBROUS Et = 2-5EcZTA GRAPHITE GRANULAR Ec =l12EtATJ-S GRAPHITE GRANULAR Et = 1.2E¢
2
Unidirectional glass fibers in an epoxy matrix have compression moduli
20% lower than the tension moduli [l]. For some unidirectional boron/
epoxy fiber-reinforced laminae, the compression moduli are about 15-20%
larger than the tension moduli [2]. In contrast, some unidirectional
graphite/epoxy fiber-reinforced laminae have tension moduli up to 40%
greater than the compression moduli [2]. Other fiber-reinforced compo-
sites such as carbon/carbon have tension moduli from two to five times
the compression moduli [3]. Thus, no clear pattern of larger tension
than compression moduli or vice versa exists for fiber-reinforced compo-
site materials. A plausible physical explanation for this puzzling cir-
cumstance is not available.
For granular composite materials, the picture is no clearer. ZTA
graphite has tension moduli as much as 20% lower than the compression
moduli [4]. On the other hand, ATJ-S graphite has tension moduli as much
as 20% more than the compression moduli [5].
Many other materials have different tension and compression moduli.
Which modulus is higher may depend on the fiber or granule stiffness rela-
tive to the matrix stiffness. This relationship would influence whether
the fibers or granules tend to contact and hence stiffen the composite.
A general physical explanation of the reasons for different behavior in
tension and compression is not yet available. Investigation of micro-
mechanical behavioral aspects of composite materials may lead to a ra-
tional explanation of this phenomenon. Until such an explanation is
available, the apparent behavior can be used in analyzing the stress-
strain behavior of materials. That is, even without knowing why the
materials behave as they do, their apparent behavior can be modeled.
Actual stress-strain behavior is probably not as simple as shown
3

FIGURE 2 COMPARISON OF ACTUAL STRESS-STRAIN BEHAVIOR WITH THE BILINEAR MODEL
0-BILINEAR APPROXIMATION -,
ACTUAL BEHAVIOR E
TRANSITION REGION
in Fig. 1. Instead, a nonlinear transition region may exist between
the tension and compression linear portions of the stress-strain curve.
The measurement of strains near zero stress is difficult to perform accu-
rately, but the stress-strain behavior might be as shown in Fig. 2 where-
in replacement of actual behavior with a bilinear model is offered as a
simplification of obviously nonlinear behavior. For most materials, the
mechanical property data are insufficient to justify use of a more com-
plex material model. However, one possible disadvantage of the bilinear
stress-strain curve approximation is that a discontinuity in slope
(modulus) occurs at the origin of the stress-strain curve.
Given that the uniaxial stress-strain behavior is approximated with
a bilinear representation, the definition remains of the actual multi-
axial stress-strain, or constitutive, relations that are required in
structural analysis. Over the past ten years, Ambartsumyan and his co
workers, [References 6 to 91, in the process of obtaining solutions for
stresses in shells and bodies of revolution, defined a set of stress-
strain relations that will be referred to herein as the Ambartsumyan
4
material model. Tabaddor [10] elaborated somewhat on the Ambartsumyan
material model. Jones [11] applied the model to buckling under biaxial
loading of circular cylindrical shells made of an isotropic material.
However, in application of the Ambartsumyan material model to orthotro-
pic materals, certain characteristics, such as a nonsymmetric compliance
matrix in the stress-strain relations [12], are apparent.
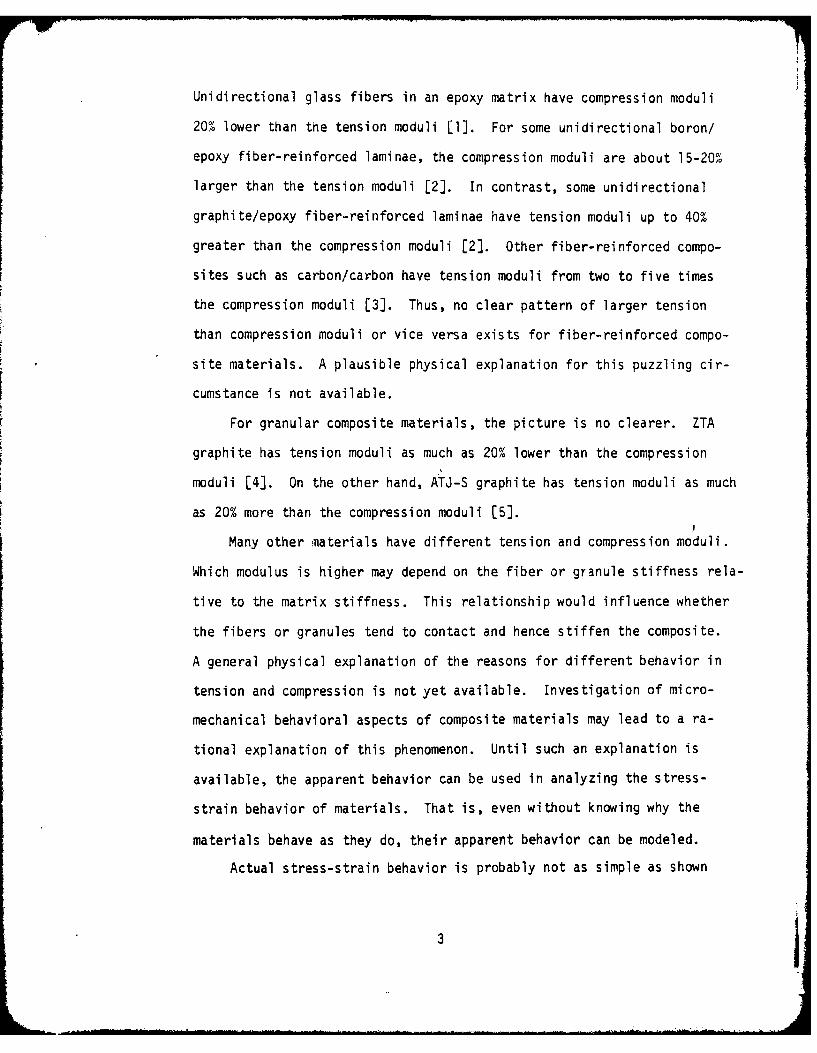
Another significant characteristic of composite materials is non-
linear stress-strain behavior. Not all composites have nonlinear beha-
vior, but for some of the most common such as ATJ-S graphite (a granular
composite) nearly all the stress-strain curves are nonlinear. In addi-
tion, fiber-reinforced composite materials such as graphite/epoxy have
nearly linear stress-strain behavior parallel to and transverse to the
fiber direction, but have highly nonlinear stress - shear strain beha-
vior as shown in Fig. 3. These material nonlinearities can be analyzed
in several fashions. For example, Jones and Nelson [13] present a
2 2
0f-2 E 2 H 1
12 AG12
;r1
/ _'
FIGURE 3 TYPICAL STRESS-STRAIN BEHAVIOR OF FIBER-REINFORCED COMPOSITEMATERIALS
5

nonlinear orthotropic model whose strain predictions agree very well with
experimental data for ATJ-S graphite which exhibits the biaxial softening
phenomenon (larger strains under biaxial tension than are predicted on
the basis of usual Poisson effects). Also, Hahn and Tsai [14] describe
a nonlinear orthotropic model for the single nonlinear shear stress -
shear strain behavior typical of graphite/epoxy.
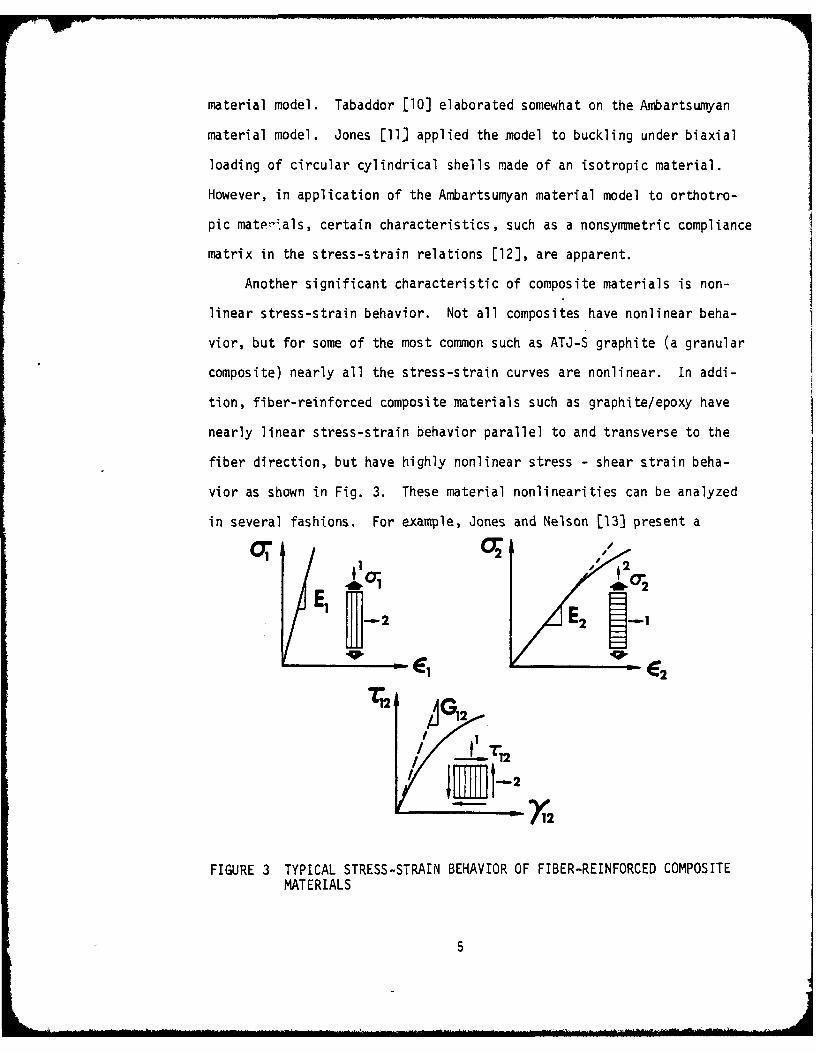
The study of nonlinear stress-strain behavior of fiber-reinforced
composite materials is also motivated by the fact that the stress-strain
curve nonlinearities become more pronounced at elevated temperatures and
moisture contents [15]. The resin matrix materials boron/epoxy and gra-
phite/epoxy readily absorb moisture, and increases in temperature and in
moisture content greatly affect the shear stress - shear strain behavior
of these materials as shown with the schematic shear stress - shear strain
cur-es in Fig. 4. At room temperature, boron/epoxy and gri-,hite/epoxy
have nonlinear shear behavior, but an increase in temperiture to 260'F
E ROOM TEMPERATURE, DRY
2600 F, DRY
2600 F, .85% MOISTURE
260P F, 1.5% MOISTURE Wp
FIGURE 4 EFFECTS OF TEMPERATURE AND MOISTURE ON SHEAR STRESS - SHEARSTRAIN BEHAVIOR
6
leads to an even greater curvature of the stress-strain curve. As the
temperature and moisture content increase from 2600F, dry to 2600F, .85'
moisture (by weight of the overall composite), the curvature of the shear
stress - shear strain curve again increases. For conditions of 260°F
and 1.5% moisture, the stress-strain curve in Fig. 4 is not only highly
nonlinear, but the ultimate capacity of the composite to withstand shear
loading is greatly reduced. Fiber-reinforced composite materials are
often used under conditions similar to those shown in Fig. 4, so provi-
sions for nonlinear stress-strain behavior must be included in the anal-
ysis of these materials at elevated temperatures and moisture contents.
Sufficient experimental data are not available at this time to investi-
gate the nonlinear behavior of fiber-reinforced composite materials under
conditions other than room temperature and no moisture content. However,
the ideas developed in this research are applicable to fiber-reinforced
composites at high temperatures and moisture contents when such experi-
mental data do become available.
The principal objective of this project is to analyze the behavior of
three-dimensional bodies as well as laminated plates and shells with dif-
ferent nonlinear stress-strain behavior in tension and compression. That
is, both of the two aforementioned composite material characteristics,
different moduli in tension and compression and nonlinear stress-strain
behavior, are addressed. A secondary objective is to study the behavior
of laminated plates and shells with different elastic moduli in tension
and compression as well as with lamination asymmetries. This report is
basically a description of the research performed during the past five years
along with some of the work done for the Air Force Materials Laboratory.
7

2. DESCRIPTION OF RESEARCH
This description of research is divided into five parts: (1) an
overview of the activities during the five years of the grant; (2) a
statement of how the Principal Investigator's research was sponsored;
(3) a list of the publications during the grant period; (4) a list of
the advanced degrees generated during the grant; and (5) a brief discus-
sion of each research accomplishment. An especially important result of
the present research, nonlinear modeling of carbon-carbon materials, is
described more fully in Section 3.
2.1 OVERVIEW OF ACTIVITIES DURING THE FIVE YEAR GRANT PERIOD
The research over the past five years under this grant has been
concentrated in three related areas:
(1) material models for nonlinear multimodulus behavior of various
classes of composite materials.
(2) stress analysis of solid bodies made of nonlinear multimodulus
composite materials
(3) analysis of bending, buckling, and vibration behavior of
laminated plates and shells including those with nonlinear
multimodulus behavior.
The first area of developing appropriate material models for composite
materials is an essential precursor to the application of such models in
areas (2) and (3). Conversely, any model developed in area (1) must be
applied in, for example, areas (2) and (3) to test its validity.
The material models are developed by first observing the physical
behavior characteristics of composite materials and then attempting to
construct models for stress-strain behavior that reflect those character-
8

istics. The models are applied in the context of usual structural
mechanics analysis approaches to treat nonlinear multimodulus materials
in various iteration and search schemes. These iteration end search schemes
are sometimes multilevel in order to find all the necessary unknowns in
these transcendental problems.
The structural mechanics analysis areas in which the material models
are applied are, of course, consistent with the Air Force problem areas
which originally motivated this research. Specifically, area (2), stress
analysis of solid bodies, is now motivated by the need to predict the
behavior of carbon-carbon rocket nozzles and was originally motivated by
a similar need to predict the behavior of graphite and carbon-carbon re-
entry vehicle nosetips. On the other hand, area (3), structural behavior
of laminated plates and shells, is motivated by the obviously rapid ex-
pansion of the use of composite materials in aerospace applications. In
particular, aircraft and spacecraft have many nonconventional structural
mechanics design analysis needs.
The specific accomplishments during the five year grant period are
described briefly later, but for now a summary or overview statement of
the accomplishments is that reasonably accurate material models have been
developed to portray not only the nonlinear stress-strain behavior of the
most common composite materials but also the character of different stress-
strain behavior under tension loading than under compression loading.
These material models have been verified or validated by use in structural
mechanics analysis problems related to rocket nozzles and reentry vehicle
nosetips and to laminated aircraft wings and spacecraft structures. The
validations range from correlation of predicted behavior with the measure-
ments in the simplest of laboratory experiments to correlation with more
9
complex experiments and even scaled nosetip test firings.
2.2 STATEMENT OF RESEARCH SPONSORSHIP
The Principal Investigator has conducted the following sponsored
research during the grant period:
(1) "Mechanics of Composite Materials with Different Moduli in
Tension and Compression," Air Force Office of Scientific
Research, June 1973 - May 1978.
(2) "Plastic Volume Change Effects in Deformation of Graphitic
Materials," Air Force Materials Laboratory, March 1973 -
November 1974.
(3) "Buckling of Shells with Different Moduli in Tension and
Compression," Office of Naval Research, April 1973 - July 1974.
(4) "Nonlinear Multiaxial Modeling of Graphitic and Carbon-Carbon
Materials," Air Force Materials Laboratory, February 1975 -
June 1976.
All four projects are closely related because they are all applicable to
problems in Air Force and Navy fiber-reinforced structures. The initial
motivation for this work was thermal stress failure problems in reentry
vehicle nosetips. Recently, however, the primary motivation has been
thermal and mechanical stress problems in rocket nozzles. Throughout the
grant period, an additional motivation has been stress analysis problems
in laminated aircraft structural parts.
10
2.3 GRANT-SUPPORTED PUBLICATIONS
(1) "Buckling and Vibration of Unsymmetrically Laminated Cross-Ply
Rectangular Plates", AIAA Journal, December 1973, pp. 1626-1632,
by Robert M. Jones.
(2) "Buckling and Vibration of Antisymmetrically Laminated Angle-Ply
Rectangular Plates", Journal of Applied Mechanics, December 1973,
pp. 1143-1144, by Robert M. Jones, Harold S. Morgan, and James M.
Whitney.
(3) "Stiffness of Orthotropic Materials and Laminated Fiber-Reinforced
Composites", AIAA Journal, January 1974, pp. 112-114, by Robert M.
Jones.
(4) "Mechanics of Composite Materials with Different Moduli in Tension
and Compression", AFOSR-TR-74-1597, July 1974, by Robert M. Jones.
(5) "A New Material Model for the Nonlinear Biaxial Behavior of ATJ-S
Graphite", Journal of Composite Materials, January 1975, pp. 10-27,
by Robert M. Jones and Dudley A. R. Nelson, Jr.
(6) "Buckling of Stiffened Laminated Composite Circular Cylindrical
Shells with Different Moduli in Tension and Compression", AFOSR-TR-
0547, February 1975, by Robert M. Jones and Harold S. Morgan.
(7) "Buckling of Laminated Composite Circular Cylindrical Shells with
Different Moduli in Tension and Compression", Proceedings of the
1975 International Conference on Composite Materials, Geneva,
Switzerland and Boston, Massachusetts, 7-18 April 1975, Vol.2,
pp. 318-343, by Robert M. Jones and Harold S. Morgan.
(8) "Buckling and Vibration of Cross-Ply Laminated Circular Cylindrical
Shells", AIAA Journal, May 1975, pp. 664-671, by Robert M. Jones and
Harold S. Morgan.
11
(9) "Further Characteristics of a Nonlinear Material Model for ATJ-S
Graphite", Journal of Composite Materials, July 1975, pp. 251-265,
by Robert M. Jones and Dudley A. R. Nelson, Jr.
(10) "Mechanics of Composite Materials with Different Moduli in Tension
and Compression", AFOSR-TR-75-1519, July 1975, by Robert M. Jones.
(11) "Deflection of Unsymmetrically Laminated Cross-Ply Rectangular
Plates", Proceedings of the 12th Annual Meeting of the Society of
Engineering Science, 20-22 October 1975, Austin, Texas, pp. 155-167,
by Robert M. Jones.
(12) "Bending and Extension of Cross-Ply Laminates with Different Moduli
in Tension and Compression", Proceedings of the 17th AIAA/ASME/SAE
Structures, Structural Dynamics, and Materials Conference, King of
Prussia, Pennsylvania, 5-7 May 1976, pp. 158-167, by Robert M. Jones
and Harold S. Morgan.
(13) "Material Models for Nonlinear Deformation of Graphite," AIAA Journal,
June 1976, pp. 709-717, by Robert M. Jones and Dudley A. R. Nelson, Jr.
(14) "Theoretical-Experimental Correlation of Material Models for Nonlinear
Deformation of Graphite", AIAA Journal, October 1976, pp. 1427-1435,
by Robert M. Jones and Dudley A. R. Nelson, Jr.
(15) "Apparent Flexural Modulus and Strength of Multimodulus Materials"
Journal of Composite Materials, October 1976, pp. 342-354, by Robert
M. Jones.
(16) "Mechanics of Composite Materials with Different Moduli in Tension
and Compression", AFOSR Interim Scientific Report, November 1976,
by Robert M. Jones.
(17) "Stress-Strain Relations for Materials with Different Moduli in
Tension and Compression", AIAA Journal, January 1977, pp. 16-23,
by Robert M. Jones.
12

(18) "JNMDATA, A Preprocessor Computer Program for the Jones-Nelson-Morgan
Nonlinear Material Models", Informal AFOSR Report, April 1977, by
Robert M. Jones.
(19) "Mechanics of Composite Materials with Different Moduli in
Tension and Compression", AFOSR Interim Scientific Report,
July 1977, by Robert M. Jones.
(20) "Nonlinear Deformation of a Thermally Stressed Graphite Annular
Disk", AIAA Journal, August 1977, pp. 1116-1122, by Robert M. Jones
and H. Stuart Starrett.
(21) "A Nonsymmetric Compliance Matrix Approach to Nonlinear Multi-
modulus Orthotropic Materials", AIAA Journal, October 1977,
pp. 1436-1443, by Robert M. Jones.
(22) "Analysis of Nonlinear Stress-Strain Behavior of Fiber-Reinforced
Composite Materials", AIAA Journal, December 1977, pp. 1669-1676,
by Robert M. Jones and Harold S. Morgan.
(23) "Effect of Prebuckling Deformations on Buckling of Laminated
Composite Circular Cylindrical Shells", Proceedings of the 19th
AIAA/ASME Structures, Structural Dynamics, and Materials Conference,
Bethesda, Maryland, 3-5 April 1978, by Robert M. Jones and Jose C. F.
Henneman. To appear in AIAA Journal.
(24) "Biaxial Strength Characteristics of Fiber-Reinforced Composite
Laminae", Proceedings of the Second International Conference on
Composite Materials, Toronto, Canada, 16-20 April 1978, by Robert M.
Jones and Jose C. F. Henneman.
(25) "Analysis of Nonlinear Deformation Behavior of Laminated Fiber-
Reinforced Composite Materials", Proceedings of the Second Inter-
national Conference on Composite Materials, Toronto, Canada, 16-20
April 1978, by Harold S. Morgan and Robert M. Jones.
13
(26) "Buckling of Cross-Ply Laminated Rectangular Plates with Nonlinear
Stress-Strain Behavior", Paper No. 78-PVP-64, ASME/CSME Pressure
Vessels and Piping Conference, Montreal, Canada, 25-29 June 1978,
by Harold S. Morgan and Robert M. Jones to appear in Journal of
Applied Mechanics.
In addition, results from this grant research were presented in:
(1) "Nonlinear Deformation of Graphitic Materials", AFML-TR-74-259,
February 1975, by Robert M. Jones and Dudley A. R. Nelson, Jr.
(2) "Nonlinear Multiaxial Modeling of Graphite and Carbon-Carbon
Materials", AFML-TR-76-215, December 1976, by Robert M. Jones.
(3) Mechanics of Composite Materials, McGraw-Hill, 1975, by Robert
M. Jones.
2.4 GRANT-SUPPORTED ADVANCED DEGREES
The following individuals had partial support from this grant during their
pursuit of a degree:
(1) Dudley A. R. Nelson, Jr., Ph.D., February 1975.
(2) Harold S. Morgan, Ph.D., October 1976.
Parviz Moayad was supported during 1976-77 and A. L. Somanath during
1977-78, but they have not completed a degree. In addition, the following
individual was supported by the Brazilian Government but worked on research
for this grant:
Jose C. F. Hennemann, Ph.D., July 1975.
14

2.5 REVIEW OF SPECIFIC RESEARCH ACCOMPLISHMENTS
This review of specific research accomplishments is divided into
three areas: (1) material models for nonlinear multimodulus behavior of
composite materials; (2) stress analysis of solid bodies made of nonlinear
multimodulus materials; and (3) analysis of bending, buckling, and vibra-
tion of laminated plates and shells including those with nonlinear multi-
modulus behavior. The papers and reports generated during the grant
period are categorized within those three areas. Some publications are
contributions in more than one area, so they are multiply cited. Each of
the publications is fully cited in Section 2.3 and will be referenced with
that section number and the publication number within that section, e.g.,
[2.3-li is the first cited reference in Section 2.3. The material models
used in applications in areas (2) and (3) generally progress over the
grant period from linear elastic to linear elastic multimodulus or non-
linear elastic and finally to nonlinear multimodulus. The progress in
developing and applying this hierarchy of models to various structural
mechanics problems is briefly described in the following three subsections.
2.5.1 Material Models for Nonlinear Multimodulus Behavior of
Composite Materials
The material models developed start from elastic and progress
through nonlinear to multimodulus to, finally, ncnlinear multimodulus.
Chronologically, the progression is uneven in the sense that contributions
were made to the nonlinear multimodulus models prior to full investigation
of the nonlinear and multimodulus models. The chronological order of develop-
ment will be ignored, and the progression itself will be emphasized.
2.5.1.1 Elastic Models
Elastic models serve only as a base from which to develop the
15
ultimate objective. However, two contributions were made which enable
better understanding of the baseline elastic models. First, the stiffness
of orthotropic materials loaded in nonprincipal material directions was
investigated 12.3-3. The off-axis stiffness is shown to be highly de-
pendent on the shear modulus. Explicit relations are derived to enable
the determination of whether the off-axis modulus is lower, higher, or in
between the moduli in principal material directions. Of major significance
is the observation that the off-axis modulus for a composite lamina is
lower than E2 (the stiffness transverse to the fibers for a unidirection-
ally reinforced lamina) if the shear modulus is low enough. The second
contribution involves the strength of orthotropic materials loaded in
nonprincipal material directions [2.3-241. This problem is the strength
analog of the preceding problem. Similar relations between off-axis
strength and the strengths in principal material directions are derived
for two common strength theories, Tsai-HilT and Tsai-Wu. Of major sig-
nificance is the observation that the off-axis strength for a composite
lamina is lower than Y (the strength transverse to the fibers for a uni-
directionally reinforced lamina) if S (the shear strength) is low enough.
2.5.1.2 Nonlinear Models
The most significant development in nonlinear models is the Jones-
Nelson-Morgan ronlinear material model. In its original form [2.3-5),
the secant moduli in the various principal material directions of a com-
posite material are expressed in terms of the strain energy density (here-
after abbreviated as strain energy) in the form
Mechanical Propertyi = Ai Bi ( u/U o )Ci] (2.1)
where the strain energy is
16
Nib-,
+c +c + +y +T / (2.2)( x Cx + a y Cy + a z Ez + yzYyz +Tzx Yzx+ T xyYxy )12(2)
and the constants Ai. Bi. and Ci are the initial value of the mechanical
property, the initial curvature of the stress-strain curve, and the rate
of chfange of curvature of the stress-strain curve, respectively [2.3-9].
The term U0 is used to nondimensionalize the term in brackets in Eq. (2.1).
This model has been successfully used to predict the nonlinear deforma-
tion of graphite [2.3-5, 2.3-9, and 2.3-20].
A basic limitation of the model in Eq. (2.1) is that the implied
stress-strain curve [the stress-strain curve that can be back-calculated
from Eq. (2.1)] first rises and then falls. The rising takes place at an
ever-decreasing rate and finally becomes a negative slope as shown with
the short dashed curve in Fig. 2.1. The degree of stress-strain curve
nonlinearity inherent to graphites is small enough that the model limita-
tion doesn't influence the behavior. However, the nonlinearities and/or
the orthotropy of fiber-reinforced composite materials are high enough
that the stress-strain curve must be rationally extended beyond the defined
data. An additional reason for the extension is that the energy associated
with multiaxial stress states is larger than with the uniaxial stress
states in which the mechanical properties are measured. The chosen form
of the extension [2.3-221 is a straight line on the stress-strain curve
in Fig. 2.1 and has a limit of a constant slope on the mechanical property
vs. strain energy curve in Fig. 2.2. This model is tested for boron-epoxy
and graphite-epoxy in Ref. 2.3-22.
A key characteristic of the nonlinear models is that the stress and
strain states are unknown as are the mechanical properties, and all are
transcendentally related. Thus, an iteration procedure [2.3-5] is
essential to determine the proper strains and mechanical properties for a
17

Gu" I TRANSITION POINT
NI- EXTRAPOLATED.,- STRESS -STRAIN CURVE
INPUT DATA POINTS
IMPLIED STRESS -STRAIN CURVE
FIGURE 2.1 STRESS-STRAIN CURVE EXTRAPOLATION
MECHANICALPROPERTY
MECHANICAL PROPERTY - A[1-BUCj
I dt~ 1
Umax U* U U
FIGURE 2.2 MECHANICAL PROPERTY VERSUS STRAIN ENERGY CURVE EXTRAPOLATION
18
specified stress state.
2.5.1.3 Multimodulus Models
The basis for the multimodulus material models is Ref. 2.3-17.
There, all the logic for choosing the appropriate mechanical properties
from values under tension or compression loading is described including
how cross-compliances (Poisson's ratios) are determined. These choices
are made in principal stress coordinates to avoid any shearing stresses
which are inherently a state of mixed tension and compression. Accord-
ingly, the usual shear moduli of a material are not essential mechanical
properties. Instead, tension and compression moduli at 450 to principal
material directions are used; thus, a set of mechanical characterization
tests different from that for ordinary orthotropic materials is necessary.
The manner of choosing the tension or compression compliances in
Ref. 2.3-17 revolves about an assumption that the resulting compliance
matrix must be symmetric. The effect of relaxing this assumption is
examined in Ref. 2.3-21 where use of a nonsymmetric compliance matrix is
found to be slightly more accurate than use of a symmetric compliance
matrix for deformation of a tubular graphite specimen. However, the
difference between the two approaches is essentially negligible because
it is on the order of only a few percent.
A very simple multimodulus model is used in Ref. 2.3-15 to analyze
the usual ASTM 3-point and 4-point bending specimens when applied for
multimodulus materials. This uniaxial but nonconstant stress state is
especially easy to analyze. The significance of this work is that the
flexural modulus calculated from the prescribed ASTM equations is not the
flexural modulus of a multimodulus material. Perhaps more important is
the fact that the actual flexural modulus is a quantity derived from the
tension and compression moduli, i.e., the flexural modulus is not an
19

independent quantity. Therefore, the flexural modulus should not be the
goal of any experimental program for multimodulus materials because it is
not basic mechanical characterization information.
2.5.1.4 Nonlinear Multimodulus Models
The original version of the Jones-Nelson-Morgan nonlinear material
model, i.e., with no stress-strain curve extrapolation, is coupled with
the multimodulus compliance matrix concepts in Ref. 2.3-13 for ATJ-S
graphite. The search and iteration procedures for both the nonlinear and
the multimodulus elements are nested to accomplish this merger of models.
The agreement between predicted and measured strains for a comprehensive
hierarchy of experiments is quite impressive as will be seen in Section
2.5.2.
The nonlinear multimodulus model is not needed for the character-
istics of boron-epoxy or graphite-epoxy, but is essential to the treatment
of carbon-carbon. The straight line extrapolation of the stress-strain
curve is necessary to fit th? available carbon-carbon data, i.e., the
extrapolation is not used in its original sense to arbitrarily extend data
beyond their range of validity. As will be seen in Section 3, the applica-
tion of the Jones-Nelson-Morgan nonlinear multimodulus material model to
carbon-carbon is quite successful.
In all applications of the nonlinear material modeling procedure,
the JNMDATA program [2.3-18] is essential in the otherwise tedious task
of converting reported stress-strain data to mechanical property versus
strain energy data and subsequently fitting Eq. (2.1) to the latter data.
A nonlinear regression technique was developed for the JNMDATA program
to automate the curve fitting operation and to provide the most accurate
model. This program is the key to effective use of the Jones-Nelson-
Morgan material models.
20
2.5.2 Stress Analysis of Solid Bodies Made of Nonlinear Multimodulus
Materials
The stress analysis of solid bodies made of nonlinear multimodulus
composite materials is performed in this grant with two computer programs,
SAAS HIM and MULTIAX, developed or modified during this grant. The
SAAS HIM program is a finite element stress analysis computer program
for axisymmetric bodies under axisymmetric loading and for bodies under
plane stress or plane strain. The SAAS HIM program is a modification of
the SAAS III program [16] to incorporate the Jones-Nelson-Morgan nonlinear
multimodulus material models. The MULTIAX computer program is essentially
a one element version of SAAS HIM used for uniform multiaxial stress
states. Neither program is documented in a report, but all changes in in-
put instructions from the SAAS III program are available for the SAAS HIM
program. The input instructions for MULTIAX are listed on comment cards
in the program.
A validation of the Jones-Nelson-Morgan material models is now
sought in a heirarchy of comparisons between theory and experiment. The
Jones-Nelson-Morgan models are defined with data from stress-strain curves
in principal material directions and at 450 to principal material directions,
but not with shear stress-strain behavior (unless the material does not
exhibit multimodulus behavior in which case the shear behavior is sub-
stituted for the 450 off-axis behavior in the model definition). The
validation should progress from simple, well-controlled laboratory experi-
ments to more complicated, less well-controlled simulation tests. Specific-
ally, for orthotropic materials, the following heirarchy seems appropriate
and has been used for at least one material in this grant:
(1) uniaxial off-axis loading tests wherein a uniform stress state
21 I
is developed in the gage section under highly controlled
laboratory conditions.
(2) biaxial loading tests in principal material directions wherein
a uniform stress state is developed in the gage section under
highly controlled laboratory conditions
(3) biaxial loading tests which are not in principal material
directions wherein a uniform stress state is developed in the
gage section under highly controlled laboratory conditions
(4) thermal loading tests like (1), (2), or (3) but with the load
generated with heat and not with mechanical means. The stress
state is not likely to be uniform nor is it usually possible
to achieve a thermal loading with the accuracy of most mechan-
ical loadings.
(5) simulation tests such as reentry vehicle nosetip ground tests
in a rocket nozzle exhaust wherein both thermal and mechanical
stresses are developed throughout the nosetip or rocket nozzle
ground test firings wherein both thermal and mechanical stresses
are also developed. Neither of these simulation tests can be
performed with the accuracy and reliability of any of the fore-
going tests.
(6) instrumented flight tests of reentry vehicle nosetips, rockets,
aircraft, etc. The loading conditions in all of these tests
are generally difficult to define. Moreover, the amount of
instrumentation is likely to be much lower than for ground tests.
Obviously, upon progression in the foregoing hierarchy, the quality of
experimental information decreases at the same time the quantity increases
[although sometimes the quantity decreases too, as in (6)]. Thus, correla-
22
tions between theory and experiment must be carefully evaluated at all
levels in the heirarchy in order to draw appropriate conclusions about
the validity or lack of validity of any material models.
In what follows, the almost complete use of the foregoing hierarchy
will be described for ATJ-S graphite, as well as partial uses of the hier-
archy for boron-epoxy, graphite-epoxy, and carbon-carbon.
2.5.2.1 ATJ-S Graphite Modeling and Response
The Jones-Nelson material model for ATJ-S graphite [2.3-5,9,131 is
a nonlinear multimodulus model, but does not have (or need) the stress-
strain curve extension character of the Jones-Nelson-Morgan model [2.3-22].
This material is transversely isotropic in cylindrical coordinates with
the r-6 plane being the plane of isotropy. The model is defined with data
from stress-strain curves for uniaxial loading in principal material
directions and at 450 to principal material directions. Then, the model
is verified in a four-step process: (1) uniaxial off-axis loading at 70'
to principal material directions; (2) biaxial loading of a tubular specimen;
(3) biaxial thermal loading of an annular disk; and (4) thermal and mechan-
ical loading of a reentry vehicle nosetip. Each of these four steps is
described in the following paragraphs.
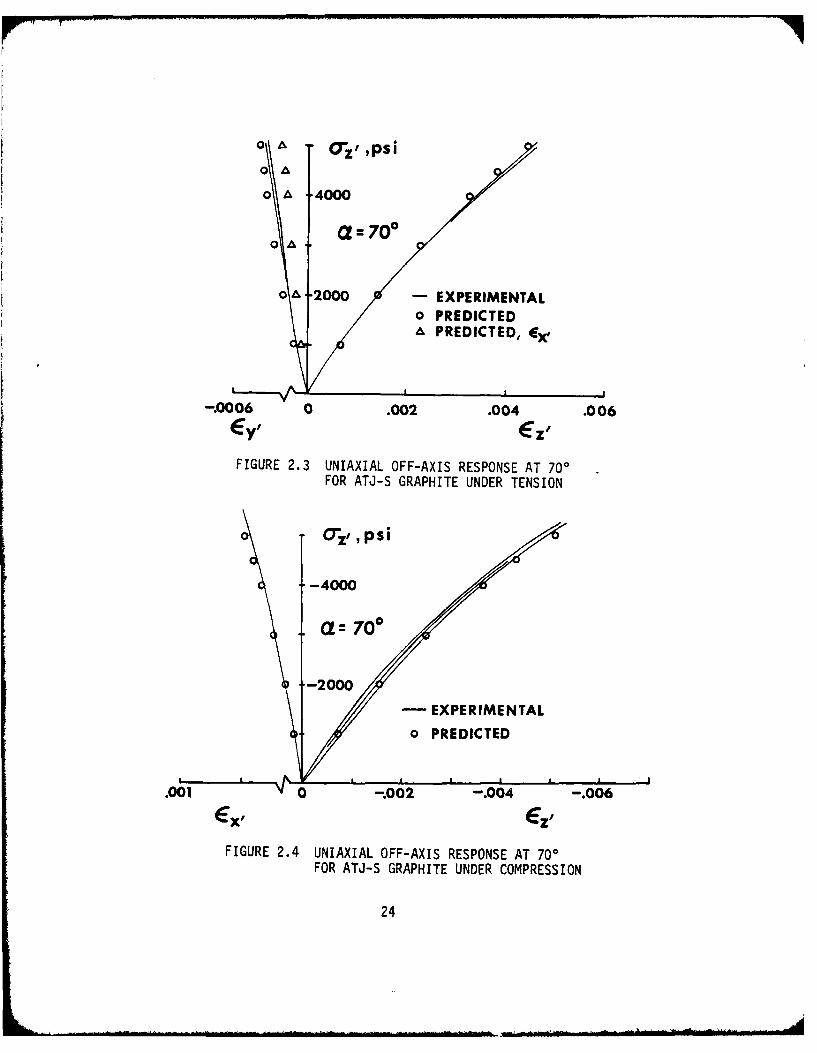
Uniaxial Off-Axis Loading at 70* The measured response of ATJ-S
graphite to uniaxial off-axis loading at 700 to the across-grain direction
(the z-direction in cylindrical coordinates)[17] is shown for tension
loading in Fig. 2.3 and for compression loading in Fig. 2.4. The predicted
(with MULTIAX) normal strain [2.3-9,141 for a specified stress is essentially
identical to the measured response under both tension and compression load-
ing. The predicted transverse strain under tension loading is not as
accurate as the predicted normal strain. However, the predicted transverse
23
o Oz 'zpsiQA
0 -4000
O 700
0A 2000 -EXPERIMENTALo PREDICTEDA PREDICTED, Ex,
-. 0006 0 .002 .004 .006
FIGURE 2.3 UNIAXIAL OFF-AXIS RESPONSE AT 700FOR ATJ-S GRAPHITE UNDER TENSION
0 all,, psi
-4000
a = 7o0
-2000
- EXPERIMENTAL
o PREDICTED
.001 0 -.002 -. 004 -. 006lex, ce
FIGURE 2.4 UNIAXIAL OFF-AXIS RESPONSE AT 700FOR ATJ-S GRAPHITE UNDER COMPRESSION
24
strain under compression loading is identical to the measured response.
This initial and simplest comparison between predicted and measured re-
sponse is quite satisfying.
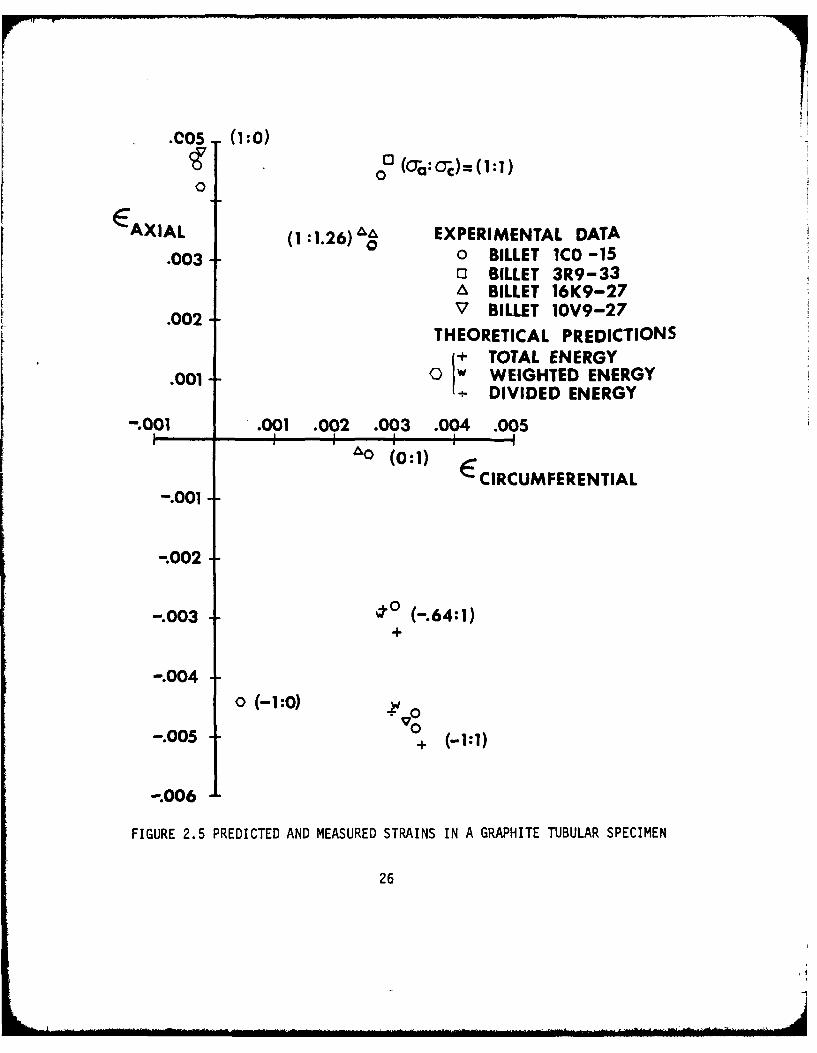
Biaxial Loading of a Tubular Specimen Jortner [17] measured the
axial and circumferential strains in a tubular test specimen under inter-
nal pressure and axial tension or compression (hence, a biaxial stress
state) for several different billets of ATJ-S graphite. These measured
strains for a maximum principal stress of 3550 psi are shown along with
the strains predicted with the Jones-Nelson model in MULTIAX and SAAS HIM
in Fig. 2.5 [2.3-5,14]. The predictions are a function of the specific
energy value used in Eq. (2.1), namely whether all the energy is used
(total), only the tension energy for tension properties and compression
energy for compression properties (divided), or a portion of each (weighted).
These differences arise only in mixed tension and compression stress states.
All predicted strains for this stress level are quite close to the measured
values thereby increasing confidence in the Jones-Nelson model for graphite.
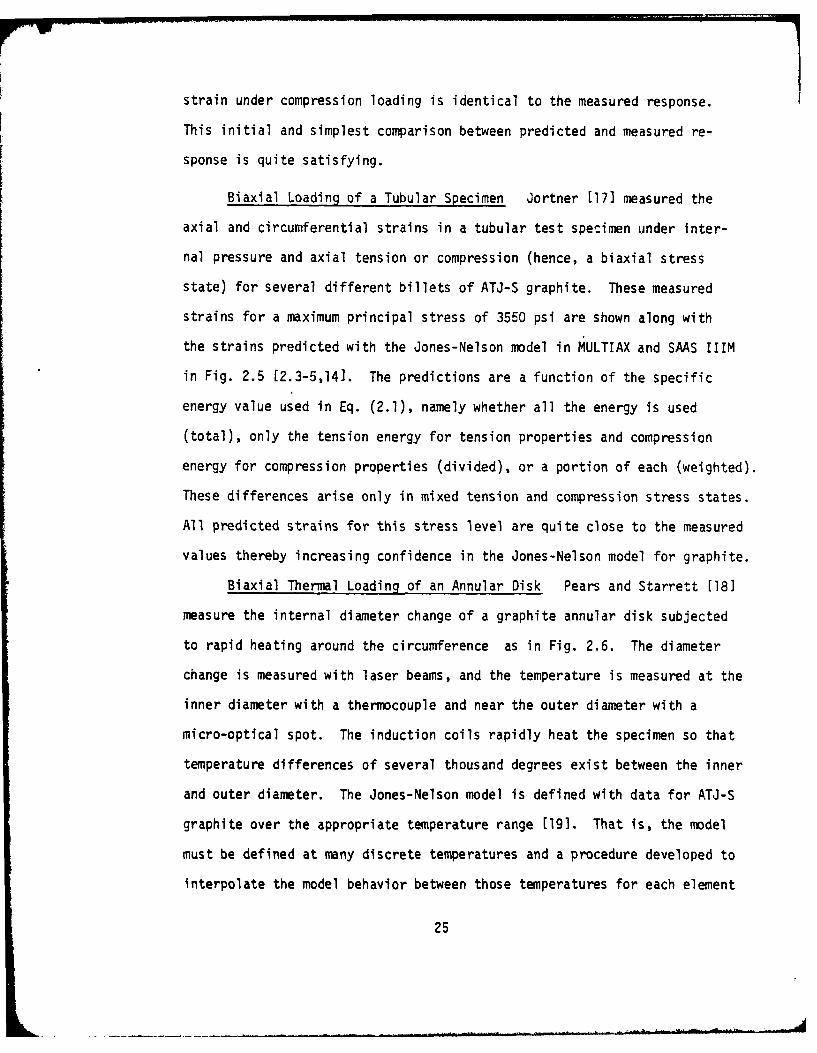
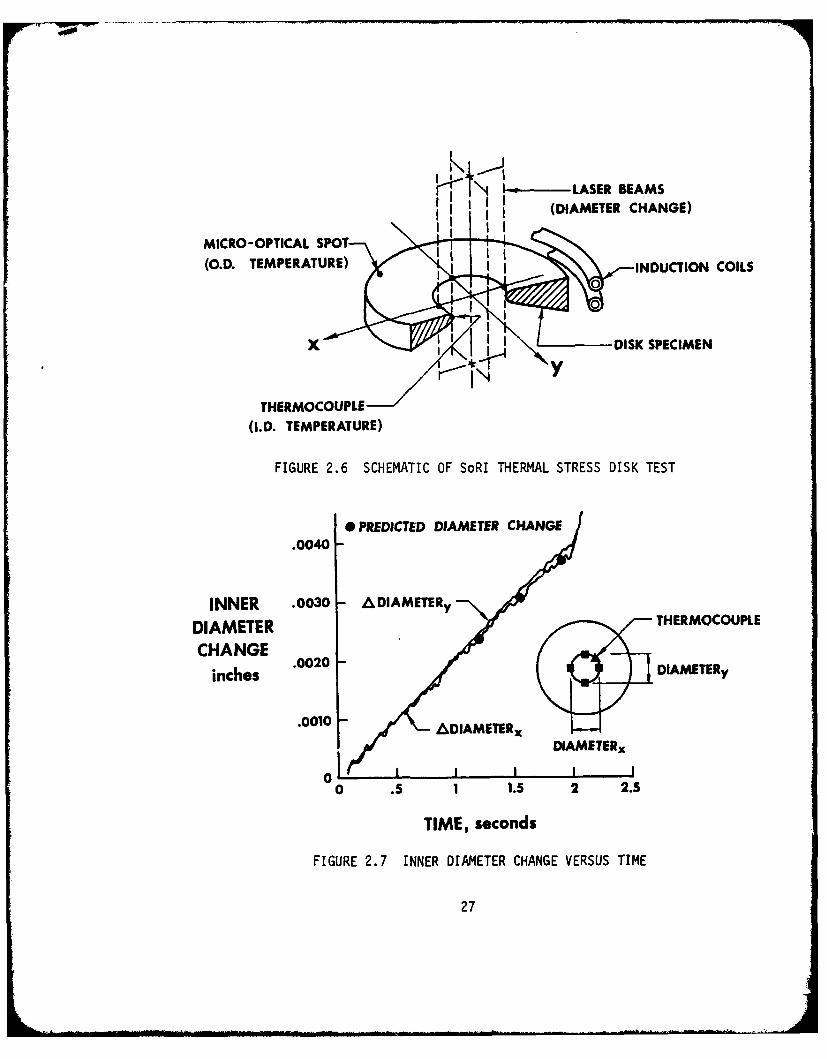
Biaxial Thermal Loading of an Annular Disk Pears and Starrett [18]
measure the internal diameter change of a graphite annular disk subjected
to rapid heating around the circumference as in Fig. 2.6. The diameter
change is measured with laser beams, and the temperature is measured at the
inner diameter with a thermocouple and near the outer diameter with a
micro-optical spot. The induction coils rapidly heat the specimen so that
temperature differences of several thousand degrees exist between the inner
and outer diameter. The Jones-Nelson model is defined with data for ATJ-S
graphite over the appropriate temperature range [19]. That is, the model
must be defined at many discrete temperatures and a procedure developed to
interpolate the model behavior between those temperatures for each element
25
.C05 (1:0)0C (aa: a-)-(1: 1)
00
EAXIAL (1:1.26) ' EXPERIMENTAL DATA.003 0 BILLET 1CO -15
o BILLET 3R9-33
& BILLET 16K9-27.002 V BILLET 1OV9-27THEORETICAL PREDICTIONS
STO TAL ENERGY.001 w WEIGHTED ENERGY
4 DIVIDED ENERGY
-. 001 .001 .002 .003 .004 .005I I I110 (0:1) ECIRCUMFERENTIAL
-.001
-.002
--.003 (-.64:1)+
-. 004o (-1:0) w o
-. 005 0 (-1:1)
-.006
FIGURE 2.5 PREDICTED AND MEASURED STRAINS IN A GRAPHITE TUBULAR SPECIMEN
26
LASER BEAMSI I (DIAMETER CHANGE)
MICRO-OPTICAL SPOT
(O.D. TEMPERATURE) INDUCTION COILS
X I , DISK SPECIMEN
THERMOCOUPLE(I.D. TEMPERATURE)
FIGURE 2.6 SCHEMATIC OF SoRI THERMAL STRESS DISK TEST
*.PREDICTED DIAMETER CHANGE
.0040-
INNER .0030 - DIAMETER yDIAMETER THERMOCOUPLE
CHANGEinches 0020 DIAMETER
.0010 &DIAMETERX IMTx. # DIAMETERx
0 I 1
0 .5 1 1.5 2 2.5
TIME, seconds
FIGURE 2.7 INNER DIAMETER CHANGE VERSUS TIME
27

of the finite element idealization of the disk. A quasistatic stress
analysis is then performed with SAAS IIIM, i.e., at each time, the tem-
perature distribution (predicted with a heat transfer program and cali-
brated to the measured inner diameter temperature) is used to predict the
thermal stresses and resulting deformations. Thus, the inner diameter
change is predicted as a function of time in Fig. 2.7 where the agreement
with measured response is excellent. Accordingly, the level of validation
of the Jones-Nelson model is raised to yet another level in the heirarchy
presented earlier.
Thermal and Mechanical Loading of a Reentry Vehicle Nosetip The
prediction of stresses and strains in a shell-type reentry vehicle nose-
tip under thermal and mechanical loading from the 50 MW arc jet facility
at Wright-Patterson AFB, Ohio was performed under a related AFML contract
[201. The Jones-Nelson-Morgan model (i.e., with an extended stress-strain
curve) is essential to obtain convergence of the iteration procedure in
SAAS IIIM. The data for the model are obtained from Starrett and Pears
[19]. The strains in element 232 on the inner radius of the nosetip in
Fig. 2.8 are about 20% higher than the strains predicted with the DOASIS
program [21] (this comparison was the objective of the contract), whereas
the present stresses are about 15% lower than the DOASIS stresses. Cor-
relation with strains measured in the actual nosetip test was not meaning-
ful (nor in the scope of the contract) because information sufficient to
deduce the actual temperature distribution corresponding to the measured
strains was not available. A crude and not entirely rational comparison
of raw strain predictions with measured strains leads to the conclusion
that the predicted strains are higher than the measured strains. However,
28

ELEMENT NUMBER
1.0 -r ,o -34 8inches
0.5- 3
00.5 1.0 1.5 2.0 2.5 3.0z ,inches
FIGURE 2.8 FINITE ELEMENT IDEALIZATION OFSHELL-TYPE REENTRY VEHICLE NOSETIP
29

the temperatures at which the predictions were made are not the same as
those at which the measurements were made. This step in the validation
procedure for the Jones-Nelson-Morgan model is obviously inconclusive,
but not discouraging
2.5.2.2 Boron-Epoxy and Graphite-Epoxy Modeling and Response
The Jones-Nelson-Morgan nonlinear model (not multimodulus because
the multimodulus character is negligible) is defined for data obtained
by Cole and Pipes [22] for both boron-epoxy and graphite-epoxy. The model
is then used to predict strains under off-axis tension loading for boron-
epoxy in Fig. 2.9 and for graphite-epoxy in Fig. 2.10 [2.3-22]. For
boron-epoxy, the Jones-Nelson-Morgan model leads to strains that are
sometimes larger and sometimes smaller than both the Cole and Pipes data
and the Hahn and Tsai nonlinear model (14]. For graphite-epoxy, the Jones-
Nelson-Morgan model leads to essentially the same strains as the Hahn and
Tsai model and, as with boron-epoxy, sometimes larger and sometimes
smaller than the Cole and Pipes data. This correlation is not entirely
satisfying, but the data with which the models are compared are not always
consistent because, perhaps, of inconsistent aging of the test specimens.
2.5.2.3 Carbon-Carbon Modeling and Response
The Jones-Nelson-Morgan model for carbon-carbon was defined with
data obtained by Starrett, Weiler, and Pears [23] for AVCO Mod 3a carbon-
carbon. The model was then used in MULTIAX to predict strains under
uniaxial off-axis tension and compression loading as well as under shear
loading. For example, see the 220 off-axis (from the x-direction) tension
response prediction in Fig. 2.11 along with measured response for that
direction, the x-direction, and at 45° to the x-direction (the latter two
30

40 20
HANN & 13Al THEORY PRE4T THml
PRUSN THEM
30 COLEPIPES
HAHN &TSAICOLE & PIPES THEORY
DATA
(7x.I x3 lOw
20 - *r I 10
FORONIEPOXES V/T
11 *aOixlapd //BORON/EPOXY 1 2 .A7X pol V//
10 & I -30.Ix1P T
12 m2.87x10pul 0 12-..8IW. psi v
0 -0 0 2 4 6 10
4
FIGURE 2.9 BORON-EPOXY OFF-AXIS LOADING RESULTS
16
( 25 4HAHN & TSAI THEORYCOLE&£ PIPES DATA
PRESENTTHEORY
0 RESENT TH 12 - COLE & PIPES
HAH &TSAI DT
THEORY
.9x (7X i
Cr10 p
W3ps I 2GRAPHTE-EP OY F-A4 LOADING 'PESTS
5 1, 23x 106 psi E~1 .2 5x 1 psi
4 J.6 0 2 4 6 a 10
A FIGURE 2.10 GRAPHITE-EPOXY OFF-AXIS LOADING RESULTS
31

7
6- 40
30
ksi MN/rn2
3 -20
2 - SoRI DATA
1 0-JNM MODEL WITH 1SHEAR COUPLING (L/w=5)
0 2 4 6 8 10
E, 10-3
FIGURE 2.11 XY-PLANE TENSION RESPONSE OF AVCO MOD 3a CARBON-CARBON
150010
1000
psi 5 MN/rn 2
500
-SoRI DATA-4-JIM, MODEL
0 1 1 1 1 1 -00 1 2 3 4 5 6 7 8 9 10
FIGURE 2.12 XZ-PLANE SHEAR RESPONSE OF AVCO MOD 3a CARBON-CARBON
32
responses are used to define the model) in the xy-plane. Also, observe
the predicted and measured shear response in the xz-plane in Fig. 2.12.
Both agreements are very reasonable considering that both the data used
to define the model and that used to compare with the predicted response
are "most probable value" data, i.e., a sort of averaged representation
of a collection of somewhat inconsistent and highly variable (from billet
to billet) stress-strain curves. Thus, agreement between predicted and
measured response is no guarantee of material model validity nor is dis-
agreement an indication of model invalidity. The modeling and response
of carbon-carbon is discussed more fully in Section 3.
33

2.5.3 Structural Behavior of Laminated Plates and Shells
The various aspects of structural behavior (bending, buckling, and
vibration) of laminated plates and shells are discussed in three sub-
sections: (1) elastic material behavior; (2) nonlinear material behavior;
and (3) multimodulus material behavior. No research was performed for
nonlinear multimodulus material behavior of laminated plates and shells
because no materials currently used in laminates have different enough
stress-strain behavior under tension loading than under compression load-
ing to justify its consideration.
2.5.3.1 Elastic Material Behavior
The major contribution in the present research on elastic material
behavior is the proper understanding of analysis of unsymmetrically lami-
nated plates and shells. Prior to this grant, the common belief was that
the effect of laminate asymmetry (of material and geometrical parameters)
on structural behavior is negligibly small if the laminate has more than
six or eight layers. That belief was founded on Whitney and Leissa's
correct observation [24] that for anticymmetric laminates the effect of
bending-extension coupling on structural behavior does die out very rapidly
as the number of layers in the laminate increases. However, the fallacy
was in people incorrectly applying the result for the special class of
antisymmetric laminates to the general class of unsymmetric laminates.
In fact, the effect of bending-extension coupling can be of engineering
significance for a fifty-layer laminate:
Buckling and Vibration of Unsymmetrically Laminated Plates The
first vehicle for investigating the unsymmetric laminate problem is buck-
ling and vibration of unsymmetrically laminated cross-ply plates [2.3-1].
First, a new solution is obtained for buckling and vibration of antisym-
34

metrically laminated cross-ply plates. Then, the solution can be general-
ized to treat unsymmetrically laminated cross-ply plates. For a graphite-
epoxy plate in which all unidirectionally reinforced layers are at 0' to
-the applied load (fibers parallel to load), except for one layer at 900
(fibers perpendicular to the load), the normalized buckling load is plotted
against the number of laminate layers in Fig. 2.13. There, the 90' layer
is always the second layer from the bottom (and hence it gets thinner and
closer to the bottom as the number of layers increases). The solution
for all O: layers is independent of the number of layers and is approached,
as the number of layers increases, by the exact solution as well as by the
solution in which coupling between bending and extension is ignored (Bij=
0). The important point is that the exact solution differs from the Bij= 0
solution by nonnegligible amounts even for a 100-layer laminate: This
specific laminate example is a counterexample to the statement that lami-
nate symmetry is not important for laminates with many layers. Thus, al-
though laminate asymmetry might not be important for a specific unsymmetric
laminate, the mere existence of many layers does not mean laminate asym-
metry can be ignored safely. The word safely is significant because the
principal effect of lamination asymmetry is to increase deflections, lower
buckling loads, and lower vibration frequencies. Thus, neglect of non-
negligible lamination asymmetries is unconservative design analysis. Re-
sults for vibration of unsymmetrically laminated cross-ply plates are
similar to the buckling results. The only significant difference is that
vibration frequencies calculated with the various approaches mentioned
are not so different as buckling loads because the vibration frequencies
involve the square root of a function of the laminate properties whereas
the buckling load involves the function itself.
35

35 Bil 0- L -40 2.2 5E2E
303/1 .25
25 -EXACT SOLUTION
20
E2t3
15
5
2b
0 I0 20 40 60 80 100
NUMBER OF LAYERS
FIGURE 2.13 UNIAXIAL BUCKLING LOADS FOR GRAPHITE-EPOXYRECTANGULAR UNSYMMETRIC CROSS-PLY LAMINATED PLATES
36
/
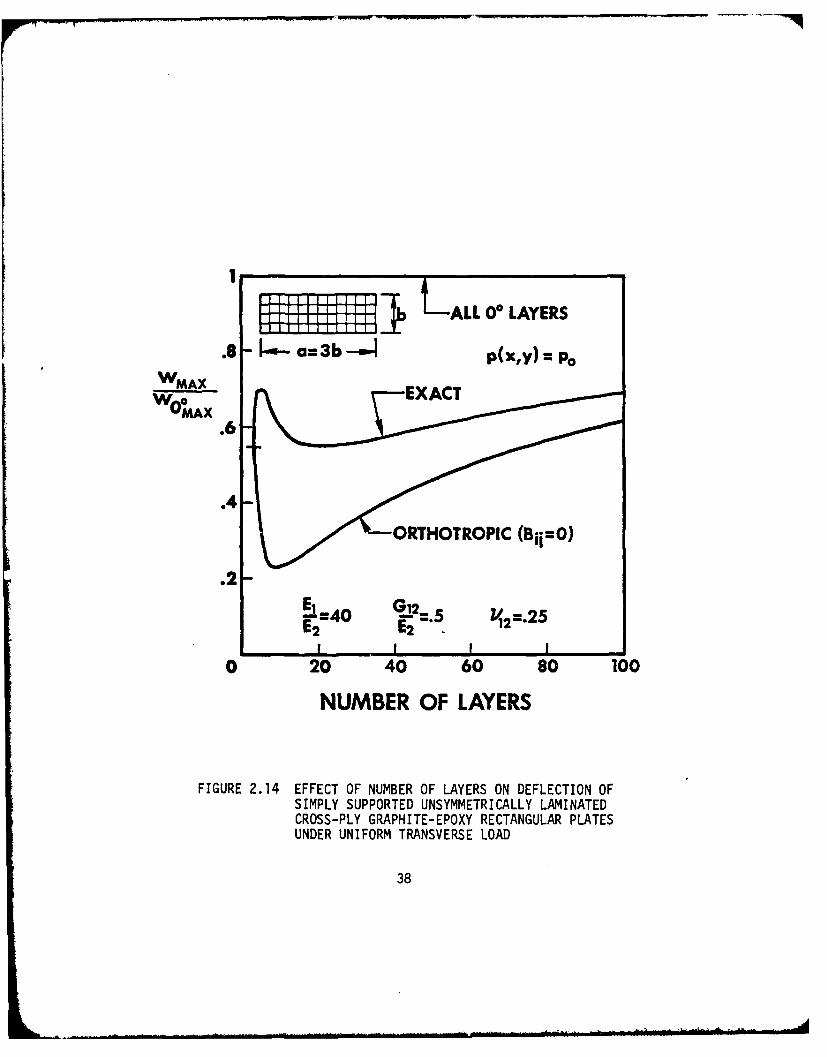
Deflection of Unsymmetrically Laminated Cross-Ply Plates The un-
symmetric laminate problem is continued with an investigation of the
specific influence of laminate asymmetry on plate deflection under trans-
verse load. An exact solution is obtained [2.3-111 for response to a
sinusoidal load on a plate with simply supported edges. Solutions for
various sinusoidal loadings can be summed to obtain the solution for a
general loading if a Fourier series is applied. For example, the results
for a uniform transverse load are shown in Fig. 2.14. There, the exact
solution is a much higher deflection than the approximate Bij = 0 solution
in which laminate asymmetry is ignored even if the laminate has more than
50 layers! This study complements the study on buckling and vibration
[2.3-1] and completes the basic plates analysis aspect of lamination asym-
metries.
Application of Unsymmetric Plate Analysis to Lightning Strike
Protection Concepts The unsymmetric plate analyses developed in the
preceding paragraphs are applied to design analysis of three lightning
strike protection concepts for the Space Shuttle payload bay doors. The
baseline configuration is a 20" x 13' panel (20" in the axial direction
between frames and 13' in the circumferential direction). The panel is
composed of a honeycomb core with two layers of graphite-epoxy tape and
one layer of graphite-epoxy cloth on top and bottom of the core. The
mechanical properties and geometry of each layer are listed in Table 2.1.
Also displayed are the mechanical properties and geometry of the three
lightning strike protection concepts: (1) .005 in. aluminum foil on top
of an adhesive layer; (2) 200 x 200 aluminum mesh embedded in adhesive;
and (3) flame sprayed aluminum covered by an adhesive protective layer.
The objective of the study is to determine the effect on structural
37
1Li i ,ALL 00 LAYERSILil I I I I i - t
.8 [ - a=3b--m4 p(x,y) : PoWMAX
.6
V =.2E2 "'
0 20 40 60 80 100
NUMBER OF LAYERS
FIGURE 2.14 EFFECT OF NUMBER OF LAYERS ON DEFLECTION OFSIMPLY SUPPORTED UNSYMMETRICALLY LAMINATEDCROSS-PLY GRAPHITE-EPOXY RECTANGULAR PLATESUNDER UNIFORM TRANSVERSE LOAD
38

TABLE 2.1 GEOMETRY AND MECHANICAL PROPERTIESOF LIGHTNING STRIKE STUDY CONFIGURATIONSFOR SPACE SHUTTLE PAYLOAD BAY DOORS
CONFIGURATION LAYER Exf 106 ps 1 y .106 psi 0 6 pi 1n. D'lbyin.
1 20.5 1.9 .3 .66 .0044 .0602 9.65 9.45 .044 .60 .0073 060
BASIC PAYLOAD BAY DOOR 3 20.5 1.9 .3 .66 .0044 .060(THESE SEVEN LAYERS ARE 4 0 0 0 0 .600 .005
IDENTICAL FOR ALL FOUR 5 20.5 1.9 .3 .66 .0044 .060CONFIGURATIONS) 6 9.65 9.45 .044 .60 .0073 .060
7 20.5 1.9 .3 .66 .0044 .060
PAYLOAD BAY DOOR WITH 8 .5 .5 .4 .179 .008 .044.005 in. ALUMINUM FOIL 9 10.0 10.0 .33 3.76 .005 .097
PAYLOAD BAY DOOR WITH200x200 ALU41NUM MESH 8 1.6 1.6 .3 .2 .006 .054
PAYLOAD BAY DOOR WITH 8 10.0 10.0 .3 3.76 .010 .097FLAME SPRAYED ALUMINUM 9 .5 .5 :4 .179 .008 .044
TABLE 2.2 DEFLECTION OF PAYLOAD BAY DOOR PANELS WITHVARIOUS LIGHTNING STRIKE PROTECTION CONCEPTS
MAXIMUM (CENTER) DEFLECTION, w, in.
CONFIGURATION EXACT REDUCED
SOLUTION B j- 0 ERROR BENDING ERRORSTIFFNESS
BASIC PAYLOAD BAY DOOR .0223 - --
PAYLOAD BAY DOOR WITHALUMINUM FOIL .0198 .0196 -1.0% .0199 +.5%
PAYLOAD BAY DOOR WITHALUMINUM MESH .0218 .0218 - .0218
PAYLOAD BAY DOOR WITHFLAME SPRAYED ALUMINUM .0184 .0177 -3.8 .0185 +.52
39

behavior of ignoring bending-extension coupling caused by the laminate
asymmetry induced by the application of lightning strike protection layers.
The specific structural behavior measures are maximum panel deflection
(at the center), buckling under axial load, and fundamental natural fre-
quency. The analysis approaches compared are the exact solutions discussed
earlier, the complete neglect of bending-extension coupling (Bij = 0), and
the approximate treatment of bending-extension coupling in the form of
the reduced bending stiffness approximation. For each concept and each
structural behavior aspect, the three analysis approaches are compared in
Tables 2.2, 2.3, and 2.4 for deflection, buckling and vibration, respec-
tively. The exact solution is used as the baseline for all calculations
of percentage error. The aluminum mesh concept is noteworthy from the
standpoint that all analysis approaches yield the same result, i.e., their
error is zero. The Bij = 0 approximation is from one to five percent in
error on the unconservative side for the other two concepts. The reduced
bending stiffness approximation is essentially correct with the error
being less than ±.5% in all cases.
The principal conclusion to be drawn is that neglecting coupling
between bending and extension due to laminate asymmetry in this problem
might not be unacceptable. Certainly the reduced bending stiffness ap-
proximation is perfectly acceptable. Neither of these two conclusions is
necessarily applicable beyond the parameters of the present study.
Buckling and Vibration of Antisymmetrically Laminated Angle-Ply
Rectangular Plates The simplest solution for buckling and vibration of
antisymmetrically laminated angle-ply plates is obtained by Whitney and
Leissa [24]. In Ref. 2.3-2, the numerical errors uncovered in the investi-
gation of laminated plates are corrected.
40

TABLE 2.3 BUCKLING OF PAYLOAD BAY DOOR PANELS WITHVARIOUS LIGHTNING STRIKE PROTECTION CONCEPTS
BUCKLING LOAD, N., lb/in.
CONFIGURATION EXACT REDUCED
SOLUTION Bij- 0 ERROR BENDING ERRORSTIFFNESS
BASIC PAYLOAD BAY DOOR 1187 - ..
PAYLOAD BAY DOOR WITHALUMINUM FOIL 1332 1352 +1.5% 1330 -.22
PAYLOAD BAY DOOR WITHALUMINUM MESH 1214 1214 - 1214 -
PAYLOAD BAY DOOR WITHFLAME SPRAYED ALUMINUM 1431 1496 +4.5% 1426 -. 3%
TABLE 2.4 VIBRATION OF PAYLOAD BAY DOOR PANELS WITHVARIOUS LIGHTNING STRIKE PROTECTION CONCEPTS
FUNDAMENTAL VIBRATION FREQUENCY, w, cps
CONFIGURATION EXACT REDUCEDSOLUTION B j- 0 ERROR BENDING ERROR
STIFFNESS
BASIC PAYLOAD BAY DOOR 61.3 - - -
PAYLOAD BAY DOOR WITHALUMINUM FOIL 60.6 61.1 + .82 60.6
PAYLOAD BAY DOOR WITHALUMINUM MESH 60.3 60.3 - 60.3
PAYLOAD BAY DOOR WITHFLAME SPRAYED ALUMINUM 60.6 61.9 +2.1Z 60.5 -. 2%
41
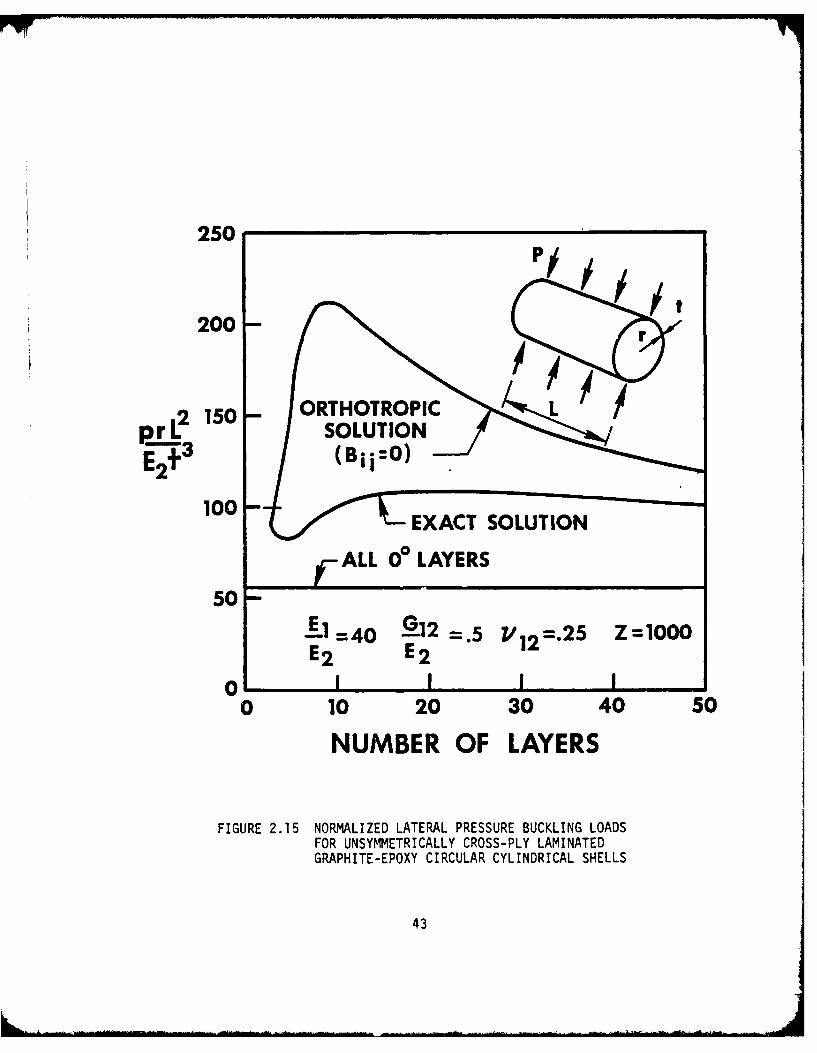
Buckling and Vibration of Cross-Ply Laminated Circular Cylindrical
Shells The unsymmetric laminate problem is extended from plates to
circular cylindrical shells in this research [2.3-8). First, for S2
simply supported edge boundary conditions, a closed form (but computer
implemented because of mode shape searching) solution is derived which
leads to new results for both antisymmetrically and unsymmetrically lami-
nated shells. For antisymmetric laminates, both buckling and vibration
results are presented in the form of Batdorf k-Z plots where k is a
normalized buckling load or vibration frequency and Z is the Batdorf shell
curvature parameter. The effect of bending-extension coupling on buckling
loads and vibration frequencies is seen to rapidly die out as the number
of layers increases. However, for unsymmetric laminates (the one specified
for the plate problem earlier in this sub-section), the effect of bending-
extension coupling on lateral pressure buckling loads dies out very slowly
as the number of layers increases as in Fig. 2.15. Similar results are
obtained for axial compression and vibration.
Effect of Prebuckling Deformations on Buckling of Laminated
Composite Shells A distinctly different problem from the unsymmetric
laminate problem is addressed, namely how the deformations that exist prior
to buckling influence the buckling load [2.3-231. Two types of deforma-
tion exist prior to buckling: both are a form of bending-extension coup-
ling, but one exists even if the laminate is symmetric about its middle
surface. This type of bending-extension coupling is shown by Almroth
[25] to lower the axial buckling load of isotropic shells by up to 20%
depending on the boundary conditions. Here, the other bending-extension
coupling due to laminate asymmetry (both antisymmetry and general lack of
symmetry) is investigated. For buckling under axial compression of anti-
symmetric cross-ply laminated circular cylindrical shells, the buckling
42
250
200-
2 150- ORTHOTROPIC LQLL 3SOLUTION
E2+ ° (Bii:O)
100 , EXACT SOLUTION
ALL 0° LAYERS
50El = 4 0 a12 =.5 1/12 =.25 Z=1000E2 E2
0 I I I I0 10 20 30 40 50
NUMBER OF LAYERS
FIGURE 2.15 NORMALIZED LATERAL PRESSURE BUCKLING LOADSFOR UNSYMMETRICALLY CROSS-PLY LAMINATEDGRAPHITE-EPOXY CIRCULAR CYLINDRICAL SHELLS
43
load normalized by the buckling load for a laminate with an infinite
number of layers is plotted against the orthotropy ratio, EI/E 2, for
several laminates with different numbers of layers in Fig. 2.16. There,
the results for membrane prebuckling deformations are shown as solid
curves and the results when rigorous prebuckling deformations are con-
sidered are shown as discrete points connected with dashed lines. Ob-
viously, the effect of laminate asymmetry is dependent on the level of
orthotropy, starting from the 20% effect at isotropy and rapidly decreas-
ing to a few percent as the orthotropy ratio increases. That is, the
major influence of laminate asymmetry is captured in a classical buckling
analysis with membrane prebuckling deformations for shells. For plates,
similar conclusions are anticipated, but the actual numerical results
would be much harder to obtain than the present shell results.
2.5.3.2 Nonlinear Material Behavior
Nonlinear material behavior is included in analysis of deformation
of laminae and laminates as well as buckling of laminates. Such material
behavior is seen in boron-epoxy, graphite-epoxy, and boron-aluminum lami-
nates. These analyses are described in the following paragraphs.
Off-Axis Loading of a Composite Lamina The nonlinear material be-
havior that results when stress is applied in nonprincipal material direc-
tions is analyzed for boron-epoxy and graphite-epoxy in Ref. 2.3-22.
There, as described in Sections 2.5.1.2 and 2.5.2.2, the linear extension
of the stress-strain curve is used to model the mechanical behavior. The
load or stress applied in nonprincipal material directions excites a
combination of nonlinear responses of the material. As seen in Section
2.5.2.2, the agreement between predicted and measured response is quite
44

1 NUMBER OF LAYERS
FOR SHR ANTIS YMMETRICALYLMNTDSEL
45-. a-2
good. This lamina behavior model is used as the basic building block
for the laminate analyses described in the next two paragraphs.
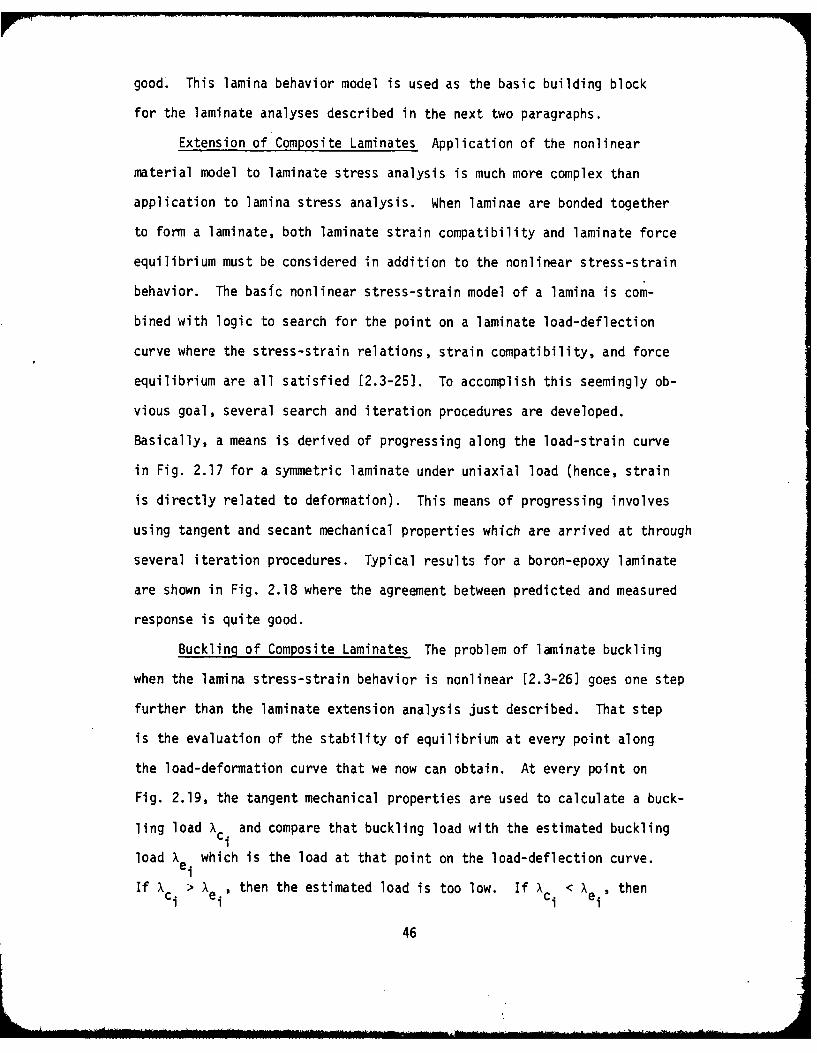
Extension of Composite Laminates Application of the nonlinear
material model to laminate stress analysis is much more complex than
application to lamina stress analysis. When laminae are bonded together
to form a laminate, both laminate strain compatibility and laminate force
equilibrium must be considered in addition to the nonlinear stress-strain
behavior. The basic nonlinear stress-strain model of a lamina is com-
bined with logic to search for the point on a laminate load-deflection
curve where the stress-strain relations, strain compatibility, and force
equilibrium are all satisfied [2.3-25]. To accomplish this seemingly ob-
vious goal, several search and iteration procedures are developed.
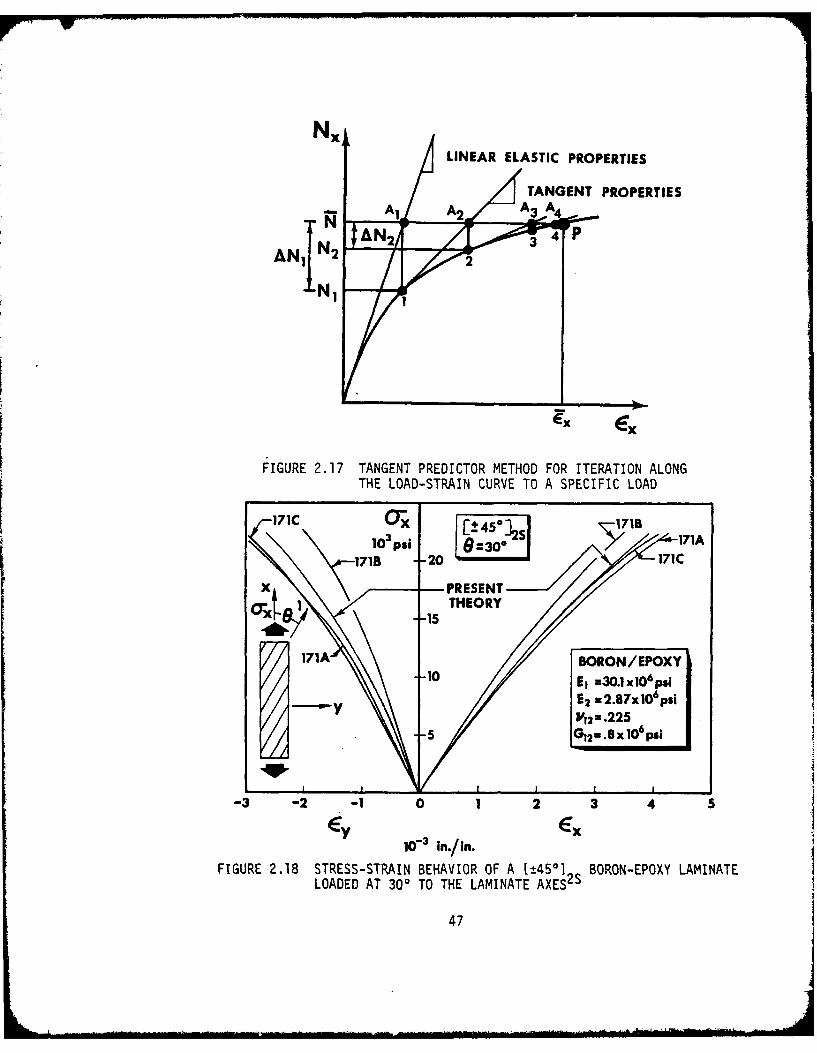
Basically, a means is derived of progressing along the load-strain curve
in Fig. 2.17 for a symmetric laminate under uniaxial load (hence, strain
is directly related to deformation). This means of progressing involves
using tangent and secant mechanical properties which are arrived at through
several iteration procedures. Typical results for a boron-epoxy laminate
are shown in Fig. 2.18 where the agreement between predicted and measured
response is quite good.
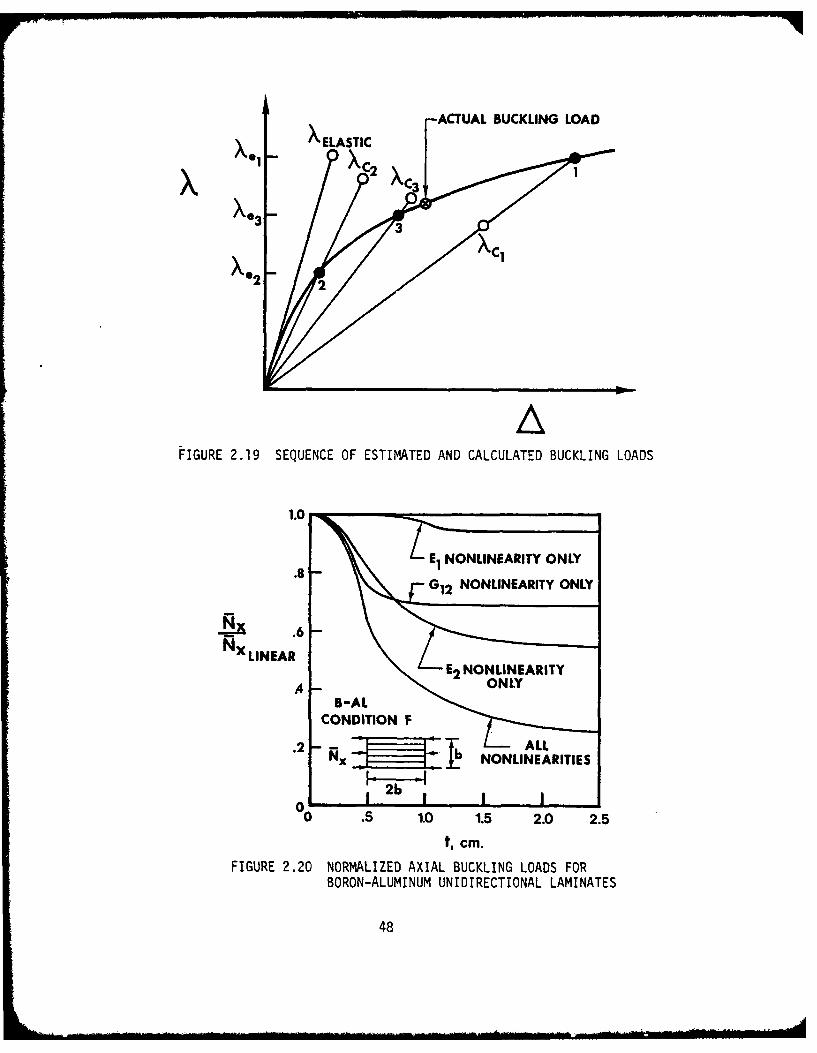
Buckling of Composite Laminates The problem of laminate buckling
when the lamina stress-strain behavior is nonlinear [2.3-26] goes one step
further than the laminate extension analysis just described. That step
is the evaluation of the stability of equilibrium at every point along
the load-deformation curve that we now can obtain. At every point on
Fig. 2.19, the tangent mechanical properties are used to calculate a buck-
ling load Xci and compare that buckling load with the estimated buckling
load Xei which is the load at that point on the load-deflection curve.
If Xc > Xe then the estimated load is too low. If Xc < Xei then
46
Nx,
LINEAR ELASTIC PROPERTIES
ATANGENT PROPERTIES
A 1 A2 A3 A 4
ANI N2 ' 3
24
FIGURE 2.17 TANGENT PREDICTOR METHOD FOR ITERATION ALONGTHE LOAD-STRAIN CURVE TO A SPECIFIC LOAD
171C 711
10 3 psi :3o0 S 171A-3 -2 7-1 0 1 2 3 4171Cx - PRESENT/
()r-15 THEORY
., I I r In./inI
-3 - -- 0is2 3
FIGURE 2.18 STRESS-STRAIN BEHAVIOR OF A [+45 ] BORON-EPOXY LAMINATELOADED AT 300 TO THE LAMINATE AXES2S
47
EAIACTUAL BUCKLING LOAD
xCXe-
X0e2
AFIGURE 2.19 SEQUENCE OF ESTIMATED AND CALCULATED BUCKLING LOADS
1.0
.8 El NONLINEARITY ONLY
G2NONLINEARITY ONLY
_N= .6Nx LINEAR
.4 OLB'AL
CONDITION F.2- "1 Ilb ALL
.2 Nx " NONLINEARITIES
• 2b "00 .5 10 1.5 2.0 2.5
cm.
FIGURE 2.20 NORMALIZED AXIAL BUCKLING LOADS FORBORON-ALUMINUM UNIDIRECTIONAL LAMINATES
48
- - .. . .. . . . . m land lIIi lm m .,..,,mh .,.,, ... .. . . ....... .. A

the estimated load is too high. These bounds are the basis for an in-
terval halving search procedure to calculate the buckling load to any
desired accuracy. For example, the buckling results for unidirectional
0* laminates of boron-aluminum are shown in Fig. 2.20 as a function of
laminate thickness. There, the thicker the laminate, the more prominent
the nonlinear stress-strain behavior is in lowering the buckling load.
These effects are separated for the several nonlinear stress-strain be-haviors of boron-aluminum, namely nonlinearities in El .E2 , and Gl2'
Obviously, these nonlinearities are predicted to be quite influential in
determining buckling loads. However, no measured buckling loads are
available for comparison with the predictions.
2.5.3.3 Multimodulus Material Behavior
Multimodulus material behavior is generally not a dominant behavioral
characteristic for laminated plates and shells. That is, the materials
out of which laminated plates and shells are made generally do not have
strong multimodulus characteristics. Moreover, these characteristics are
somewhat diminished in a structural analysis: a 10% variation between
tension and compression moduli does not become a 10% variation in struc-
tural behavior, but instead has a somewhat lower influence. Two such
structural analyses Of laminates from which these conclusions are drawn
will be described.
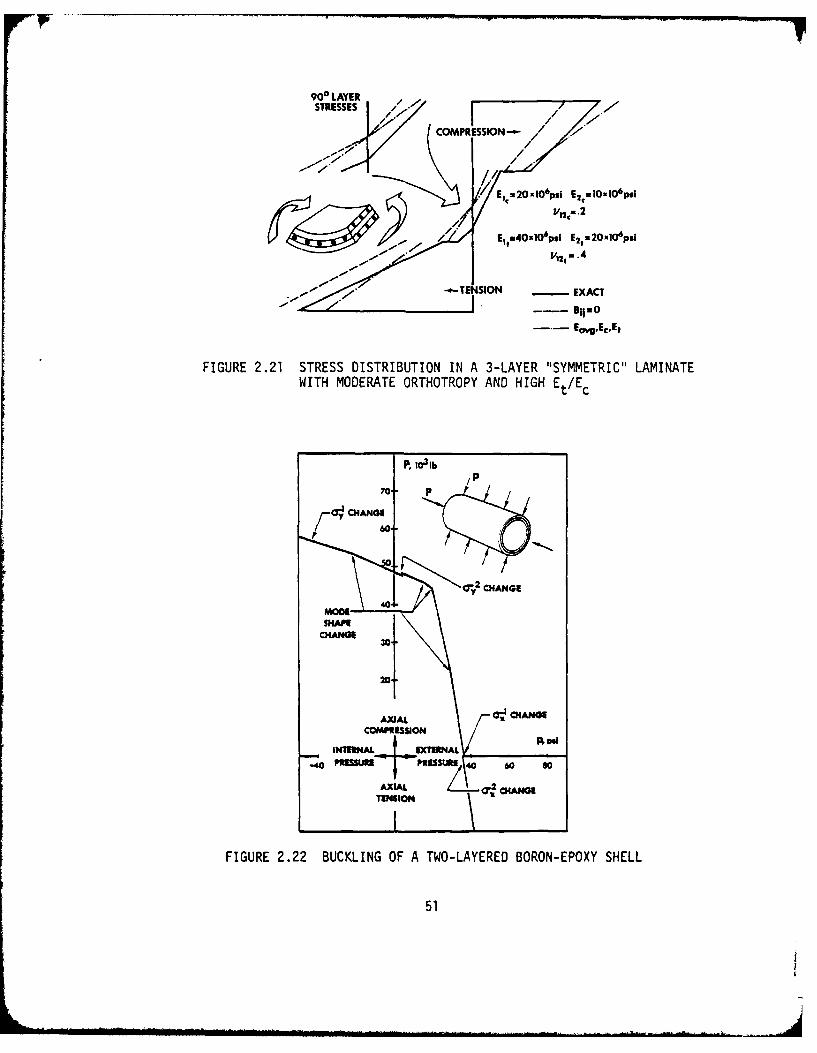
Bending of Cross-Ply Laminates Cylindrical bending of cross-ply
laminates with different moduli in tension and compression [2.3-121 is
studied as a vehicle to learn about the influence of multimodulus material
behavior on structural behavior. The key unknown is the location of the
neutral surface which is determined through an iteration and search pro-
cedure. The resulting laminate is not symmetric about the neutral surface,
49

so bending-extension coupling arises. This coupling complicates the de-
termination of the effect of the multimodulus behavior. An example of
stresses in a somewhat contrived multimodulus laminate is shown in Fig.
2.21. Considerable difference, percentagewise, is seen between the various
stress calculations for the middle layer. However, the stresses in the
outer layers for the various approximations are not different from each
other by amounts anywhere close to the factor of two difference in tension
and compression moduli. The larger differences in the middre layer could
be significant, however, in laminate strength predictions.
Buckling of Laminated Shells The influence of multimodulus
material behavior on buckling loads of laminated shells is investigated
in Refs. 2.3-6 and 2.3-7. There, the basic multimodulus material model is
included in a buckling analysis with all the appropriate logic, including
variation in stress versus variation in strain relations. A physical
discontinuity in buckling loads is predicted for biaxial loading of a
laminated shell whenever a layer stress changes from tension to compression
or vice versa. The size of the discontinuity depends on the multimodulus
ratio Et/Ec* For boron-epoxy, the ratio Et/Ec is quite close to one.
Thus, the discontinuities in Fig. 2.22 are quite small and are, in some
cases, almost indistinguishable. The buckling load can be shown to be
proportional to the square root of Et/Ec9 so a 10% difference in moduli
leads to a 5% difference in buckling load at the corresponding discon-
tinuities. This diminishing of the structural importance of the multi-
modulus ratio is the most important observation to make in this section.
50
900 LAYER
STRESSES //
COMPRESSION-- // 7
..- . // .
/ E200'psl E2 ulOxlO6 psi
Y,2 -.2
4," Et40l0'psI E2 ,=20x1O6 psi
7" -- TENSION EXACT
. ENvg, Ec,Et
FIGURE 2.21 STRESS DISTRIBUTION IN A 3-LAYER "SYMMETRIC" LAMINATEWITH MODERATE ORTHOTROPY AND HIGH Et/Ec
p70 P
CC"' CHANGE
C02 CHAC-l-AXIAL CHANGE
COMMISSION
INTIIUNAL IXTERNAL i
peamal PRESSURE 40 60 s
AXIAL 0 IAN C.
TENMiON
FIGURE 2.22 BUCKLING OF A TWO-LAYERED BORON-EPOXY SHELL
51

3. MODELING NONLINEAR DEFORMATION OFCARBON-CARBON COMPOSITE MATERIALS
3.1 INTRODUCTION
The process of modeling the nonlinear deformation behavior of carbon-
carbon composite materials is quite involved and requires many steps for
complete understanding. First, the characteristics of carbon-carbon
materials are described in Section 3.2 so the mechanical behavior properties
that must be modeled can be observed. Then, the possible comparisons
that can be made between theoretically predicted and measured response
are discussed in Section 3.3. Next, a specific carbon-carbon model is
obtained in Section 3.4 for AVCO Mod 3a three-dimensionally fiber-reinforced
carbon-carbon. The effect of how actual test specimens deform in perhaps
the simplest test is derived in Section 3.5. Finally, predicted strains
under uniaxial off-axis loading and under shear loading are compared in
Section 3.6 with measured strains to validate the model displayed in
Section 3.4.
3.2 CHARACTERISTICS OF CARBON-CARBON MATERIALS
Carbon-carbon is not a single material, but is instead a broad class
of materials. Many types of carbon-carbon are manufactured including
various kinds of woven fibers or felt materials both of which are coated
or impregnated with a matrix material in a vapor deposition process or a
pressure impregnation process. The combination of materials is subse-
quently carbonized and graphitized to create carbon-carbon.
The steps in a typical pressure impregnation process are illustrated
in Fig. 3.1. In the first step, woven graphite fabric in the horizontal
plane is pierced with metal rods in the vertical direction while being
built up layer by layer in the vertical direction. The warp and fill
52

IMPREGNATE WITH PHENOLICOENCEANPIERCE GRAPHITE REPLACE METAL REI YEAUTO I-POST CURE TOFABRIC OVER ROS ITH LOWED BYPRESSURIZATIONMETAL ROD$ GRAPHITE YARN TO 2000 PSI 35VF
STEP. 1. STEP.2. STEP 3. STEP 4
ARGON
VOLAII.E OUTREPEAT STEPS 3 TO
6 .Z AS REQUIRED TODENSIFY BILLET
CARBONIZE UP TO GRAPHITIZE TO 49110F2000F IN KILN IN INDUCTION FURNACE
STEP. 5. STEP 6.
FIGURE 3.1 AVCO MOD 3a FABRICATION PROCESS
ORTHOGONALLY REINFORCED ORTHOGONALLY REINFORCEDPARALLEL YARNS WOVEN FABRIC
z y z
FIGURE 3.2 GEOMETRY OF LAYERS IN xy-PLANE
53
directions are alternated with each layer. Next, the metal rods are
replaced with graphite yarn or graphite fibers. This somewhat loose
assembly of layers is impregnated with phenolic resin in step three. The
impregnation process takes place first by evacuation of the chamber in
which the material is located and then by pressurization to force the
phenolic resin into the voids of the woven and pierced fabric. Then, in
step four, the material is cured in an oven at 3500 F. Next, the material
is carbonized at 2000OF in a kiln in step five. Finally, the material is
graphitized to 4900°F in an induction furnace in step six. At this stage,
the billet of carbon-carbon does not have the degree of density possible,
i.e., not all the voids are filled with a graphitized form of the phenolic
resin. Accordingly, steps three through six are repeated until the de-
sired density is attained.
Carbon-carbon is made with several different geometries. Each of
the layers in Fig. 3.1 can be either woven in the horizontal (x-y) plane
or made of parallel fibers as in Fig. 3.2. AVCO 3D is of parallel fiber
construction and is shown schematically in Fig. 3.3. One variation on a
three-dimensional weave or three-dimensional construction of orthogonal
fibers is to add fibers at 450 angles to the x-, y-, and z-directions.
The resulting "7D" construction is shown schematically in Fig. 3.4 for
fibers with prismatic cross sections. A much simpler carbon-carbon
structure is obtained after carbon vapor deposition on carbonized felt.
The fibers of uncarbonized felt are shown in the scanning electron photo-
micrograph in Fig. 3.5 where obviously the fibers have no preferred orien-
tation. The scale of all these possible carbon-carbon constructions is
revealed in Fig. 3.6 where the approximate fiber spacings in 7-D carbon-
carbon are shown in a nosetip. Obviously, the microscale of carbon-carbon
materials is not negligible in comparison to the nosetip dimensions.
54
Z X x
FIGURE 3.3 AVCO 3D CONSTRUCTION
z
ZY
z r v -0 AS
wI
FIGURE 3.4 PACKING MODEL OF PRISMS HAVING EQUAL CROSS SECTIONAL AREAIN 7-D CUBIC GEOMETRY
55

FIGURE3.5 UNCARBONIZED VISCOSE-RAYON FELT
FIGURE 3.6 7-0 CARBON-CARBON NOSETIP WITH
REPRESENTATIVE FIBER SPACINGS
56
Generally, the microscale dimensions of graphite, namely the particle
size, etc. are negligible for nosetip stress analysis problems. However,
the characteristic material dimensions of carbon-carbon are not clearly
negligible for nosetip problems although perhaps the answer to this
question is dependent on the specific carbon-carbon material to be con-
sidered.
The anisotropy of the various carbon-carbon materials depends pri-
marily on the geometry of the fiber construction and secondarily on the
manner of incorporating a carbon matrix. *For example, the orthogonally
reinforced carbon-carbons with parallel fibers such as AVCO 3D (Figs. 3,
3.2 and 3.3) and with woven fabric such as AVCO MOD-3 (Figs. 3.1 and 3.2)
are orthotropic with princ4'al material directions in the three fiber
directions. In contrast, GE 7-D is not only orthogonally reinforced,
but also has fibers at 450 to the x-, y-, and z-directions in which the
orthogonal fibers are placed. Accordingly, GE 7-D is anisotropic
(although with so many fiber directions, the degree of anisotropy for
GE 7-D is lower than the degree of orthotropy for AVCO 3D, i.e., GE 7-D
is more like an isotropic material than is AVCO 3D). The manner of in-
corporating a carbon matrix in carbon-carbon can be an influencing factor
for anisotropy only when the process of constructing or depositing the
matrix has some directional dependence. For example, a matrix formed by
chemical vapor deposition in a shell structural element can have a
directional dependence of mechanical properties because of vapor penetra-
tion perpendicular to the shell surface and no penetration parallel to
the surface. This effect is similar to effects obtained with pyrolytic
graphite because of alignment of particles due to direction preferential
deposition of material. In summary, the most obvious clue to the degree
57
of anisotropy remains the fiber geometry, but anisotropy is also influ-
enced by the matrix construction.
At least two difficulties arise in analysis of carbon-carbon
materials. The first obvious difficulty is the analytical complication
due to the many more mechanical properties necessary to characterize
carbon-carbons as compared to simpler materials. This analytical compli-
cation is handled with relative ease in comparison to the more trouble-
some problem of measuring the additional mechanical properties. Basically,
the problem is that simple strain states do not result from simple imposed
stress states. For example, a uniaxial stress at 45' to the fiber direc-
tions in Fig. 3.7 leads to both extension in the direction of the load
(and the usual Poisson contraction perpendicular to the load) and in-
plane shearing if the ends of the specimen are not restrained in any way.
On the other hand, if the specimen ends are restrained to remain perpen-
dicular to the load, then a complicated nonuniform shearing and exten-
sional response results. The complicated response occurs if the test
specimen is short and wide whereas the simpler response occurs if the
test specimen is long and narrow. In fact, if the specimen is relatively
short and wide, the stiffness being measured is not the Young's modulus
in the x-direction of the sketch in Fig. 3.8 but the two-dimensional
(transformed reduced ) stiffness Qll. The reason for this discrepancy
is that the geometrically admissible state of strain in the specimen
depends strongly on the geometry. If the specimen is long and slender,
then the boundary conditions at the specimen end grips are of no conse-
quence a la Saint Venant. Accordingly, a pure uniaxial strain is obtained
andax = Exex (3.1)
58

r-o
NO END EFFECT RESTRAINED ENDS
FIGURE 3.7 DEFORMATION OF A UNIDIRECTIONALLY REINFORCED LAMINALOADED AT 450 TO THE FIBER DIRECTION
30
El 4 2 =5 P12=.2
x
20 1
STIFFNESSES EAND
MODUU 2106 pSi
10"
-00 15 30* 4r 60* 750 900
ORIENTATION ANGLE, 8
FIGURE 3.8 STIFFNESSES II AND Q66 VERSUS MODULI Ex AND Gxy
59
However, for a short, wide specimen, the end restraint of ax 0 O,
EY = Yxy= 0 leads to the stress-strain relation
ax = Qll x (3.2)
Similar results are shown in Fig. 3.8 for an applied shear stress result-ing in either Gxy as desired or Q66 if the test specimen geometry is not
properly chosen.
The foregoing situation is but one example of many complicated
mechanics problems which arise in the design of "proper" test specimens.
By "proper" test specimens is meant specimens for which the desired re-
sponse can be measured without undue influence of some unwanted response.
For example, even with end restraint in Fig. 3.7, a specimen can be made
long enough that the resulting deformation looks like the unrestrained
end response. From a practical standpoint, if the response can be made
predominantly simple by suitable choice of specimen geometry, then the
godl of a proper test specimen is attained. Analysis of specimen re-
sponse for various geometries to determine the geometry for which simple
response occurs is the objective in many mechanics efforts. However, to
date, little has been done to apply the principles of mechanics in ra-
tional treatment of carbon-carbon materials.
Some of the difficulties in rationally analyzing the mechanical be-
havior of carbon-carbon materials are related to even more complicated
response characteristics than just discussed for a unidirectionally rein-
forced lamina. For example, anisotropic carbon-carbon under shear loading
in one principal material plane will also have shear deformation in the
two principal material planes which are perpendicular to the stressed
principal material plane. This shear coupling obviously results in very
complicated strain response. Moreover, the multimodulus characteristic
60
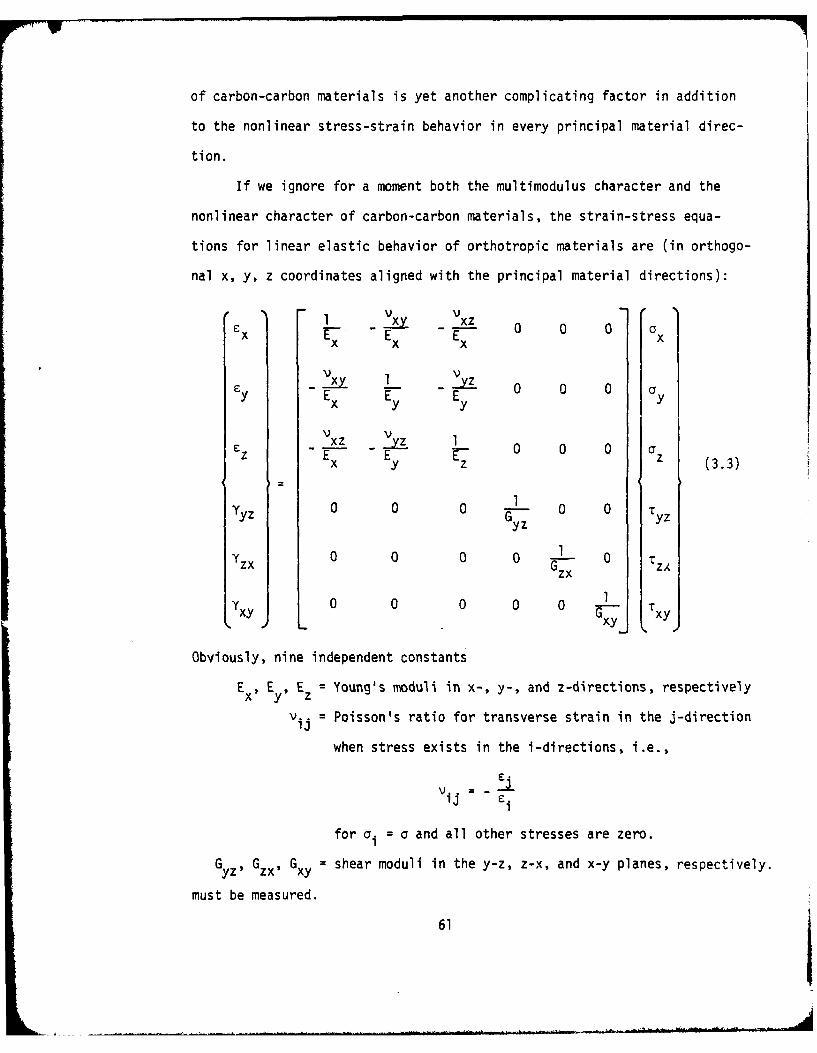
of carbon-carbon materials is yet another complicating factor in addition
to the nonlinear stress-strain behavior in every principal material direc-
tion.
If we ignore for a moment both the multimodulus character and the
nonlinear character of carbon-carbon materials, the strain-stress equa-
tions for linear elastic behavior of orthotropic materials are (in orthogo-
nal x, y, z coordinates aligned with the principal material directions):
-1 Vx Vx
Ex Ex Ex 0 0 0 xEx ExEx x
y E Ey E yyy y
vxz 1 E 1S y Z (3.3)
Yyz0 0 0 l 0 0 T
Yzx 0 0 G1 0 TZ
Yxy 0 0 0 0 0 Gxy TxyP L_ xy _
Obviously, nine independent constants
Ex , Ey, Ez = Young's moduli in x-, y-, and z-directions, respectively
v.. = Poisson's ratio for transverse strain in the j-direction
when stress exists in the i-directions, i.e.,
Vl1~E.
for a. = a and all other stresses are zero.
Gyz, Gzx, Gxy = shear moduli in the y-z, z-x, and x-y planes, respectively.
must be measured.
61

We now recognize that the strain-stress relations in Eq. (3.3) must
be modified to account for multimodulus behavior. Hence, in the manner
Jones (2.3-171, the shear moduli are replaced with Young's moduli at 450
to principal material directions. We then have the following nine inde-
pendent mechanical properties:
45 45 45E , E. 9 E , v . V V E E~~ , E, (3.4)Ex , y, z , yz' zx' xy, yz Ezx' xy
when the carbon-carbon composite has three orthogonal principal material
directions with unequal fiber volumes or unequal fiber sizes in the three
directions. If the fiber volumes or fiber sizes are equal in two direc-
tions (as in AVCO 3D shown in Fig. 3.3), the six independent mechanical
properties are:
45 45 45 45Ex, Ey : E= , Ez, yz, vzx = Vzy, xy Eyz' Ezx Ezy' Exy (3.5)
Finally, if equal fiber volumes or fiber sizes exist in all three direc-
tions, the thre. independent mechanical properties are:
45 45 45Ex Ey Ez Vyz = Vzx = Vxy yz = zx xy (3.6)
(Note, however, that because of the three fiber directions the modulus
at 45' is independent of the direct moduli and Poisson's ratios because
the shear behavior is independent). All of the properties in Eqs. (3.4),
(3.5), and (3.6) must be measured both in tension and in compression.
Moreover, these properties must be measured at many stress levels to
account for the nonlinear stress-strain behavior in the manner of the
Jones-Nelson-Morgan material models discussed in Section 2.
We examine orthotropic and anisotropic carbon-carbon mechanical
behavior which is representative of that found in References 23 and 26
through 34. Those references are the primary body of information on
carbon-carbon mechanical properties although other information exists
62

in the Journal of Composite Materials and in other classified and unclass-
ified reports. Typical stress-strain curves are shown in Figs. 3.9 and
3.10 for the materials examined in the CCAP program (Carbon-Carbon Assess-
ment Program). All of the stress-strain curves displayed have some degree
of nonlinearity ranging from mild to strong. Notice how the shapes of
the actual stress-strain curves are similar to the basic shape of the
Jones-Nelson-Morgan nonlinear material model stress-strain curve in Fig.
2.1-on p. 18. The Jones-Nelson-Morgan model was developed to treat carbon-
carbon behavior in addition to ATJ-S graphite as well as boron/epoxy,
graphite/epoxy, and boron/aluminum.
The multimodulus characteristic of carbon-carbon is a manufacturer-
dependent phenomenon. Early materials had drastic differences in tension
and compression moduli. For example, the MDAC low modulus block course
weave material [261 has a ratio of tension modulus to compression modulus
in the z-direction ranging from 4 to 5! More recent materials have closer
tension and compression moduli - for example, AVCO MOD 3 [291 has a ten-
sion modulus greater than the compression modulus by about 60% in both
the x-direction and the z-direction.
Another behavioral characteristic worthy of note is the classical
viscoplastic behavior of carbon-carbon at high temperatures. For example,
AVCO MOD 3a exhibits this behavior at 5000°F in Fig. 3.11. The stress
rate is increased by factors of ten and the stress-strain curve rises in
the usual viscoplastic manner.
Some carbon-carbon materials have a characteristic of rectangular
orthotropy which is quite different from the transverse isotropy of ATJ-S
graphite. The practical significance of this difference is that in a
reentry vehicle nosetip application, ATJ-S graphite is axisymmetric
whereas carbon-carbon is not. This important distinction is quite sig-
63

36-
32-
28 /
~24-
S20 I
u.j
,u- 16 /
12-A
TENSILE STRAIN, 10-3 IN/IN
FIGURE 3.9 PROBABLE VALUE TENSION STRESS-STRAIN CURVES FOR
CCAP MATERIALS AT 70OF IN THE Z-DIRECTION 130]
64

40
38-
36-
34-
32-
30-
28
.~26-
24-
0
16 22
4-
S6-
S4--
0 1 2 3 4. 5 6 7 8 9 10 11 12 13 14 15 16 17 18 19 20
COMPRESSIVE STRAIN IN 10-3 ININ
FIGURE 3.10 PROBABLE VALUE COMPRESSION STRESS-STRAIN CURVES FOR
CCAP MATERIALS AT 5000OF IN THE Z-DIRECTlON [130]
65

6
1 2A
FG I CPS STRESS-STRA i CRE F V O 3
A T ' 0 ' I THE ZI, CTO
z i I I IF,.11
10 psi; i I Ii I .4 67 [ ' s . ..
"7 67 psi sec= - ,'6 7 psi se ' "
103p ",- in./i . ,
ATi 50 0O I THEi Z-D RET " I
,Nl , : i, '
FOR VARIOUS STRESS RATES [29]
66

nificant from the point of view of the nosetip stress analyst.
On the other hand, many different carbon-carbon fiber geometries
are used in rocket nozzle applications. The most comon orientations are
shown in Fig. 3.12. There, five orientations of two-dimensionally woven
carbon-carbon are displayed along with a three-dimensional carbon-carbon
with fibers in the radial and circumferential direction as opposed to the
rectangularly orthotropic three-dimensional carbon-carbon in Fig. 3.3.
Four of the orientations in Fig. 3.2 are cylindrically orthotropic, namely
900 to J, 450 to J, 00 to Q, and 3-D weave, and are reasonably easy tocharacterize and analyze. However, the remaining two orientations, tan-
gential and rosette, are anisotropic and present considerable difficulty
in both characterization and analysis.
In summary, carbon-carbon materials have mechanical behavioral
characteristics which are a substantial escalation in degree of complica-
tion over the characteristics of graphite materials. The carbon-carbon
analysis problem is very difficult and complex. Hence, the progress will
be slow because of the many mechanics problems that must be addressed.
3.3 POSSIBLE THEORETICAL-EXPERIMENTAL RESPONSE COMPARISONS
The types of experiments for which behavior can be meaningfully
predicted will be discussed. The objective is to obtain sufficient vali-
dation of a material model for carbon-carbon by successful prediction of
measured behavior of representative materials under representative load-
ing conditions (both mechanical and thermal). Thus, a multilevel theo-
retical-experimental correlation effort must be addressed. This effort
will be discussed by comparison with a similar effort for ATJ-S Graphite,
a transversely isotropic polycrystaline particulate composite material.
First, the mechanical property characteristics of various carbon-carbon
67
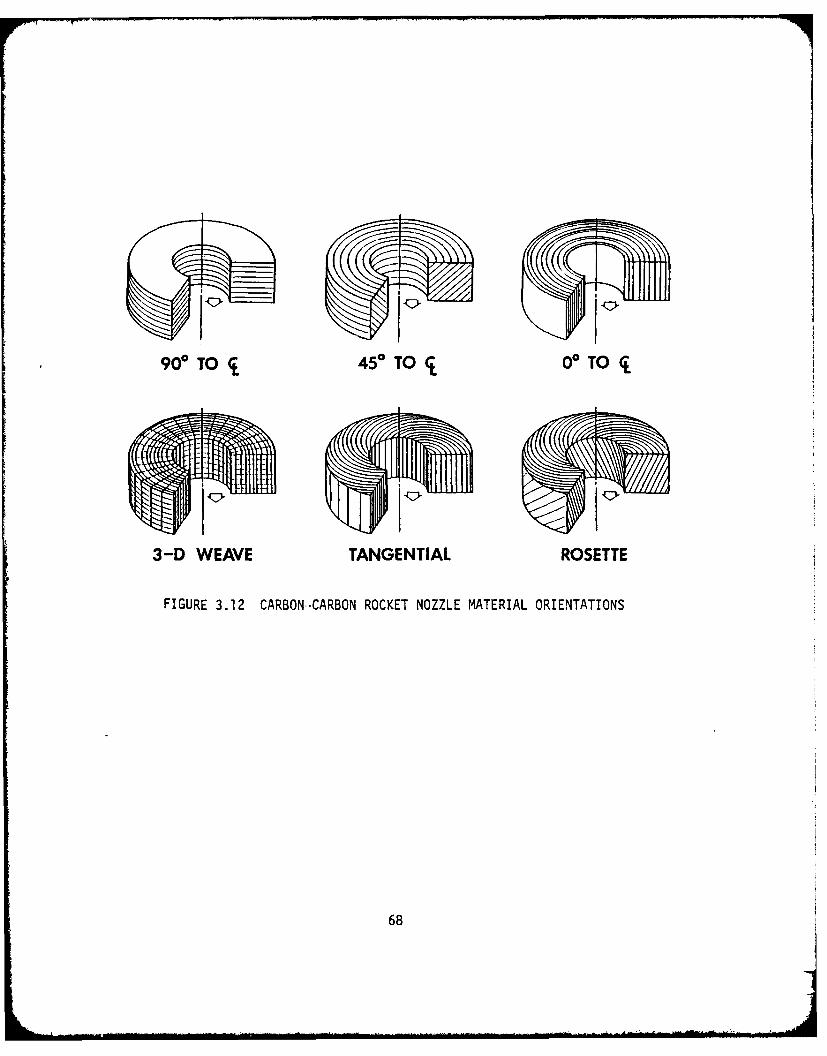
9 0 TOj 45TOj 00TO r
3-D WEAVE TANGENTIAL ROSETTE
FIGURE 3.12 CARBON-CARBON ROCKET NOZZLE MATERIAL ORIENTATIONS
68
materials will be categorized. Then, the heirarchy correlation efforts
for ATJ-S Graphite will be described. Finally, possible correlation efforts
for carbon-carbon materials will be discussed.
3.3.1 Mechanical Property Anisotropy Classes for Carbon-Carbon Materials
Carbon-carbon materials are made in many forms with the primary
difference between the various forms being the direction of the fibers.
Unidirectional fibers are not common for carbon-carbons, but two-dimensional
woven fibers are a very common form. See Fig. 3.12 for various two-
dimensional fiber orientation relative to the body geometry of a rocket
nozzle. Moreover, three-dimensionally woven fibers such as the 3-D weave
in Figs. 3.3 or 3.12 are used. Finally, multidirectional weaves are
possible, e.g., the 7-D weave in Figs. 3.4 and 3.6. We will categorize
these various forms of carbon-carbon according to the type of anisotropy
they exhibit. For convenience, we will concentrate on three broad classes:
anisotropic, rectangularly orthotropic, and cylindrically orthotropic.
Anisotropic Carbon-Carbon Materials Anisotropic carbon-carbon
materials are made of multidirectionally woven fibers that are not per-
pendicular to one another and do not exhibit any planes of mechanical
property symmetry. Examples of anisotropic carbon-carbons include the
GE 7-D carjon-carbon in Figs. 3.4 and 3.6 and the tangential and rosette
weaves in Fig. 3.12. The latter materials are two-dimensional woven
fabric that has been reoriented such that the fibers no longer lie in
a single plane nor are they all parallel to one another as they were
when they were formed in a single plane.
Rectangularly Orthotropic Carbon-Carbon Materials For rectangu-
larly orthotropic carbon-carbon materials, the fiber directions are always
parallel to one of the three rectangular coordinate directions. Moreover,
69

the material has three mutually perpendicular planes of mechanical
property symmetry (a consequence of the first statement). Examples of
such materials are shown in Figs. 3.1, 3.2, and 3.3.
Cylindrically Orthotropic Carbon-Carbon Materials For cylindrically
orthotropic carbon-carbon materials, the fiber directions are always in
cylindrical coordinate directions (i.e., radial, axial, and circumferential).
The material has three mutually perpendicular planes of mechanical pro-
perty symmetry at each point of the body, i.e., locally. Globally, the
material is axisymmetric and is often referred to as a polar weave materi-
al. An example of a cylindrically orthotropic carbon-carbon is the 3-0
weave in Fig. 3.12.
3.3.2 Material Model Validation Tests for ATJ-S Graphite
In contrast to the various carbon-carbon materials, ATJ-S graphite
is a transversely isotropic material with the plane of isotropy perpen-
dicular to the axis of symmetry of the bodies in which ATJ-S graphite is
used. Accordingly, ATJ-S graphite is a much simpler material to model
and to conduct experiments on than any of the carbon-carbon materials.
The model of ATJ-S graphite was constructed from information on mechanical
behavior (i.e., stress-strain curves) in the principal material directions
and at 450 to principal material directions. Thus, validation of the
model is performed by conducting tests to obtain response independent of
the behavior used to construct the model. Three types of laboratory-
quality tests were performed for ATJ-S graphite:
(1) Uniaxial Off-Axis Mechanical Loading Specimens of graphite
were subjected to either tension or compression loading in
directions at an angle of 700 to the principal material
directions. The Jones-Nelson-Morgan model was used to predict
70

the corresponding strain response which was in excellent
agreement with the measured response in the stress direction,
but not as good in the direction transverse to the stress
direction [2.3-9 and 2.3-141.
(2) Biaxial Mechanical Loading in Principal Material Directions
Internal pressure and axial tension or compression were applied
to a tubular specimen of ATJ-S graphite. The tube axis coin-
cided with the direction perpendicular to the plane of isotropy;
hence, the loading, which leads to axial and circumferential
stresses, is in principal material directions. The axial and
circumferential strains predicted with the Jones-Nelson-Morgan
model in the SAAS HIM computer program are in excellent agree-
ment with the measured strains at room temperature. The ex-
perimental device is not as reliable at elevated temperatures
as it is at room temperature, so correlations between predicted
and measured strain response are not as good as at room tempera-
ture [2.3-5 and 2.3-14].
(3) Biaxial Thermal Loading in Principal Material Directions A
graphite circular disk with a central hole (i.e., an annular
disk) is rapidly heated on its outer circumference with induc-
tion heating coils. An axisymmetric state of thermal stress
results because of the thermal gradient and the fact that the
plane of isotropy of the material coincides with the plane of
the disk. Excellent agreement is obtained between predicted
and measured central hole diameter change as a function of
time [2.3-201
Important observations from the foregoing discussion of model validation
71

tests for ATJ-S graphite are:
(1) The uniaxial off-axis mechanical loading test can be performed
for any material, although various kinds of coupling such as
shear coupling can arise in addition to the usual Poisson effects
because of anisotropy or apparent anisotropy in nonprincipal
material directions. Moreover, response predictions can be
made for any material provided the minimum number of mechanical
properties is available to determine the material model coef-
ficients (of which there are more for orthotropic and anisotropic
materials than for transversely isotropic materials). Specimen
size is of concern only when the influence of shear coupling,
etc. must be eliminated in a gage section.
(2) The Biaxial Tube Test can be performed for materials from which
a tube can be machined. However, the characteristics of the
loading response are different for the various types of carbon-
carbon considered. For axisymmetric response, the circular
cross section of the tube must remain circular, and the only
way for that to happen is for the material to have an axis of
symmetry coincident with the tube axis; otherwise the response
is asymmetric. Tube wall thickness can be a problem. The grain
size of ATJ-S graphite is somewhat smaller than the .050 in.
tube wall thickness used by Jortner [171. However, that small
a wall thickness might not allow a representative amount of
carbon-carbon fibers to be subjected to load. Thus, the micro-
mechanical response might overhwelm the desired uniform macro-
mechanical response.
(3) The SoRI Thermal Stress Disk Test can be performed for materials
72

r!from which an annular disk of about 2 inches in outer dia-
meter and .5 inch in inner diameter can be machined. These
size limitations arise because of power limitations for
generation of the heat on the outer circumference (but have
been relaxed somewhat because of acquisition of a large power
supply). That is, the size of specimen is related to the
maximum power available to create the thermal gradients which
lead to high enough thermal stresses to fracture the specimen.
3.3.3 Possible Material Model Validation Tests for Carbon-Carbon Materials
The possible application of the ATJ-S graphite hierarchy of valida-
tion tests to various kinds of carbon-carbon is examined to determine the
suitability of this use. Each test is separately addressed to compare its
limitations to the characteristics of each of the kinds of carbon-carbon.
(1) Uniaxial Off-Axis Loading Test
This test can be performed for any carbon-carbon with only two
conditions to meet: (1) the length of the specimen must exceed
that required for the various kinds of coupling such as shear
coupling to not influence the stiffness measurement being made
and (2) the specimen length must be short enough that the
geometry of the carbon-carbon fiber array does not vary within
the specimen. The latter restriction is significant for polar
weave C-C in the plane of the polar weave. An off-axis speci-
men in the plane of the polar weave obviously has a variable
direction of circumferential fibers with length; such a varia-
tion is generally unacceptable except for the crudest of
evaluation tests and certainly is not suitable for a model
73

verification test. Note also that even the basic circum-
ferential mechanical properties are difficult to measure with
a straight uniaxial tension test specimen; instead, a ring or
hoop is usually subjected to internal pressure. However, the
NOL ring test is not at all geometrically suited to an off-
axis loading specimen for obvious geometric reasons. Problems
similar to polar weave C-C can occur for general configurations
of anisotropic C-C. However, no limitations exist on applica-
tion of the uniaxial off-axis loading test to rectangularly
orthotropic C-C.
(2) Biaxial Tube Test
The first limitation encountered for the biaxial tube test is
the fact that a tubular specimen must be machined from the
material. For solid materials such as anisotropic, rectangu-
larly orthotropic, or quasi-isotropic C-C, which are made in
solid billets, this limitation is not important except for
possible limitations on thinness of tube relative to repre-
sentative cell size of the material microstructure. However,
polar weave C-C is not made as a solid billet, but instead
has a central hole. This central hole exists because of the
way polar weave is made and because of the usual application
to rocket nozzles which have a central hole, by definition,
and so no excess material is created in the billet that
would just have to be wastefully machined away. Moreover, the
central hole is on the order of several inches to tens of
inches in diameter. Thus, the usual biaxial tubular specimen
of about an inch in inner diameter, length of four inches, and
74
17
wall thickness of .050 inch simply cannot be made from polar
weave C-C. Back to the possible limitation of thinness of
tube wall for other C-C materials: the typical fiber spacings
in all directions are not negligible relative to the tube
wall thickness of .050' Thus, we should expect difficulty in
capturing the macroscopic behavior of these materials without
the adverse influence of microscopic behavioral characteristics
such as fiber pull out. This latter problem could be cured by
increasing the specimen size with corresponding increases in
loading device capacity and multitudenous other cost increas-
ing factors.
The second limitation of the biaxial tube test is the ability
to easily predict the response only when it is axisymmetric.
Asymmetric response can be predicted if either a 3-D stress
analysis or a psuedo 3-D stress analysis like ASAAS [35] is
used. Both possibilities are more expensive than axisymmetric
analysis with the 3-D stress analysis being the most expensive.
Asymmetric response occurs for anisotropic and rectangularly
orthotropic C-C, but axisymmetric response occurs for polar
weave C-C (recall that a tube cannot, however, be made from
polar weave C-C).
(3) The SoRI Thermal Stress Disk Test
Polar weave C-C is not available with a central hole in the
billet small enough to make an annular disk for the SoRI test.
The response to an axisymmetric thermal gradient would be
axisymmetric and hence readily predictable if only the capacity
to impose such a thermal loading were available.
75
Rectangularly orthotropic C-C has been subjected to thermal
loading in the SoRI Thermal Stress Disk Test, and the resulting
response is asymmetric. Thus, predicted response can be ob-
tained if we are willing to pay the price of psuedo-3-D or
3-D finite element analysis. Anisotropic C-C falls in essen-
tially the same category as rectangularly orthotropic C-C.
However, there is a difference between the two material classes
in the finite element model needed to treat the behavior. For
rectangularly orthotropic materials, two planes of symmetry
exist perpendicular to the disk plane. Then, if Ex = Ey, the
response can be modeled with a disk segment that is of the
disk that must be modeled depends on the symmetries that do
exist in the mechanical properties.
Thus, the sequence of theoretical-experimental correlation followed
for ATJ-S graphite is difficult to follow for carbon-carbon materials.
The uniaxial off-axis loading test can be meaningfully performed, but the
biaxial tube test must be substantially modified to treat larger specimens
than at present for anisotropic and rectangularly orthotropic materials,
and probably cannot be applied to polar weave materials. The SoR! Thermal
Stress Disk Test can obviously be used for anisotropic and rectangularly
orthotropic carbon-carbons, but the difficulty in obtaining accurate re-
sponse predictions is high because of the necessity to use 3-D or perhaps
pseudo-3D finite element programs. And, polar weave carbon-carbons have
too large a central hole in the billet to obtain a disk specimen that is
small enough to be stressed and fractured in the SoRI Thermal Stress Disk
Test. Moreover, polar weave carbon-carbon specimens cannot be made ar-
bitrarily small because the material cannot be scaled down in fiber spac-
76

ings, etc. without inherently changing the material itself. Scaling
down the material might enable us to validate a model for the same class
of materials, but would involve a specifically different material.
The obvious question now is: can tests be devised that are suitable
for validation of carbon-carbon material models? The different character-
istics of the various carbon-carbons lead to different response and speci-
men characteristics. As we have seen, rectangularly orthotropic carbon-
carbon which is used for reentry vehicle nosetips is quite different from
polar weave carbon-carbon used for rocket nozzles. And, our objective is
not to address all carbon-carbon analysis problems, but to concentrate on
the problems inherent to the proper development of material models for
rocket nozzle carbon-carbons. Thus, we are interested in polar weave and
rosette carbon-carbons in solid body and shell configurations under axi-
symmetric thermal and mechanical loading that can be cyclic in nature
because of firing, cease firing, firing sequences. Accordingly, a se-
quence of laboratory quality experiments should be developed to pro-
gressively validate the various features of the material model. That is,
uniaxial off-axis behavior and biaxial behavior under mechanical loading
plus biaxial behavior under thermal loading must be separately examined.
We cannot hope to predict the complicated response of an object as com-
plex as a rocket nozzle without first being certain that our model is
valid for response of simpler bodies. Our situation is precisely that
we must learn to crawl before we walk and walk before we run with the
inn exception being that we now have more stages to grow through and
-ac' is more complex than the last to a higher degree than in the crawl-
-, naloqy. To attempt to correlate new material model response
!-,76f ith rocket nozzle behavior without first validating
'7
the material moael would be somewhat akin to playing pin the tail on the
donkey!
An even more basic problem is the lack of measured mechanical
property data to characterize a model, much less to validate it. AVCO
MOD 3a carbon-carbon is the only material for which even uniaxial off-
axis loading tests are available to validate the models. Tests at angles
other than 450 must be performed for all carbon-carbon materials of
interest.
78
3.4 CARBON-CARBON NONLINEAR MULTIMODULUS MATERIAL MODEL
The carbon-carbon material modeed in this report is AVCO Mod 3a, a
rectangularly orthotropic material constructed of woven fibers in the
xy-plane with pierced fibers in the z-direction. An equal number of
fibers exists in the x-direction as in the y-direction on the average
because the woven layers in the xy-plance are laid down with the warp
and fill directions alternating from layer to layer. The mechanical be-
havior of Mod 3a is reported by Starrett, Weiler, and Pears [231 for room
temperature and several elevated temperatures. The behavior at room
temperature will be addressed because it appears to be more consistent
data than exist at elevated temperatures. Other carbon-carbor materials
could be modeled but stress-strain curves essential to the validation of
those models are not available. Thus, AVCO Mod 3a is the only carbon-
carbon material which we can both model and validate. The modeling with
the Jones-Nelson-Morgan model will be described in this section, and the
model validation will be addressed in the next two sections.
The Jones-Nelson-Morgan nonlinear multimodulus material model is
basically an expression of the secant moduli of a material as a function
of strain energy density in the form
Mechanical Propertyi = Ai[l - B )c] (3.7)
where the strain energy density (hereafter abbreviated as strain energy)
is
U = x + UyCy + a zCz + TyzYyz + TzxYzx + xyYxy )/2 (3.8)
and the constants Ai, Bi. and Ci are the initial value of the mechanical
property, the initial curvature of the stress-strain curve, and the rate
of change of curvature of the stress-strain curve, respectively. The
79
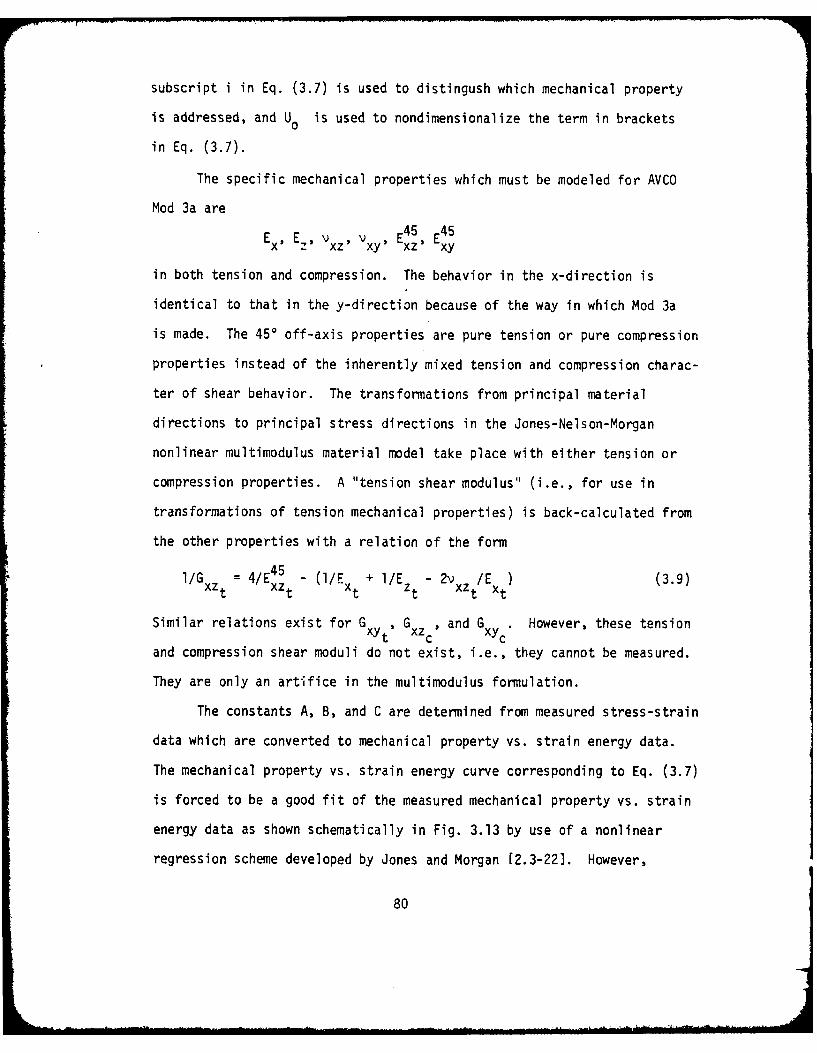
subscript i in Eq. (3.7) is used to distingush which mechanical property
is addressed, and U is used to nondimensionalize the term in brackets
in Eq. (3.7).
The specific mechanical properties which must be modeled for AVCO
Mod 3a areE45 E45
E x, E,, v xz' VExz xy
in both tension and compression. The behavior in the x-direction is
identical to that in the y-direction because of the way in which Mod 3a
is made. The 450 off-axis properties are pure tension or pure compression
properties instead of the inherently mixed tension and compression charac-
ter of shear behavior. The transformations from principal material
directions to principal stress directions in the Jones-Nelson-Morgan
nonlinear multimodulus material model take place with either tension or
compression properties. A "tension shear modulus" (i.e., for use in
transformations of tension mechanical properties) is back-calculated from
the other properties with a relation of the form
1/G = 4/Ex t - (I/E + lI/E 2v /Ex) (3.9)xzt xz t x z t xz t Xt
Similar relations exist for Gx, Gxzc and Gx. However, these tensionxyt z xy c
and compression shear moduli do not exist, i.e., they cannot be measured.
They are only an artifice in the multimodulus formulation.
The constants A, B, and C are determined from measured stress-strain
data which are converted to mechanical property vs. strain energy data.
The mechanical property vs. strain energy curve corresponding to Eq. (3.7)
is forced to be a good fit of the measured mechanical property vs. strain
energy data as shown schematically in Fig. 3.13 by use of a nonlinear
regression scheme developed by Jones and Morgan [2.3-221. However,
80
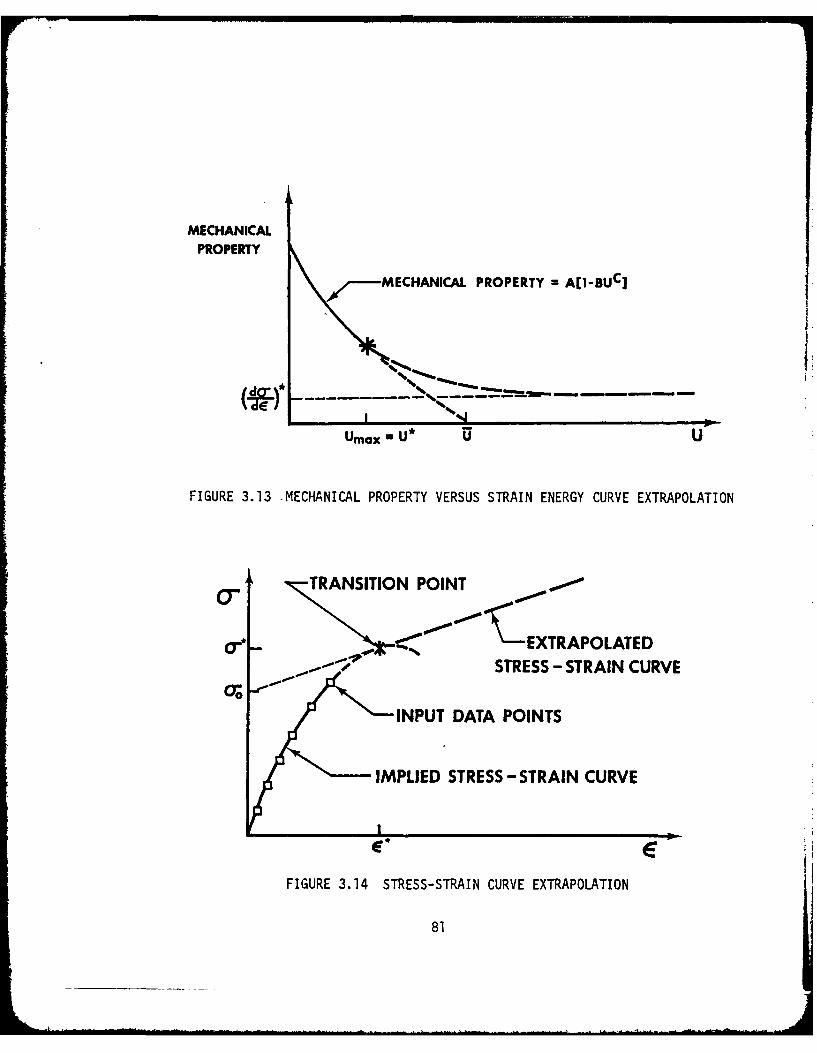
MECHANICALPROPERTY
MECHANICAL PROPERTY =A[l13BUCI
Umax U* U U
FIGURE 3.13 -MECHANICAL PROPERTY VERSUS STRAIN ENERGY CURVE EXTRAPOLATION
TRANSITION POINT
O'o.,._* IC - EXTRAPOLATED. .:STRESS - STRAIN CURVE
INPUT DATA POINTS
IMPLIED STRESS - STRAIN CURVE
E E ,
FIGURE 3.14 STRESS-STRAIN CURVE EXTRAPOLATION
81
measured stress-strain data, and hence mechanical property vs. strain
energy data, do not exist for all strain energies corresponding to all
possible multiaxial loading conditions (recall that mechanical properties
are usually measured in uniaxial loading states). Thus, the mechanical
property expression in Eq. (3.7) is valid only up to the last measured
value of strain energy, i.e., up to strain energy U* in Fig. 3.13. Above
that strain energy, the measured stress-strain data must be extrapolated
so that the mechanical properties are defined nonzero quantities for all
values of strain energy.
In the Jones-Nelson-Morgan model, the stress-strain data are ex-
trapolated by adding a linear extension to the implied stress-strain
curve corresponding to the mechanical property expression in Eq. (3.7) as
shown in Fig. 3.14. That is, for strains less than e* in Fig. 3.14, the
stress-strain data are approximated with Eq. (3.7), and for strains
greater than e*, the stress-strain behavior is extended as the straight
line. The portion of the mechanical property vs. strain energy curve to
the right of U* in Fig. 3.13 corresponds to the linear extension of the
stress-strain curve data in Fig. 3.14. This extrapolation of the mechanical
property vs. strain energy data approaches a constant nonzero value as the
strain energy increases. For carbon-carbon, the linear extension of the
stress-strain curve is necessary to fit the measured data directly (with-
out extrapolation). That is, the shape of many carbon-carbon stress-strain
curves is quite similar to Fig. 3.14.
The numerical values for the Jones-Nelson-Morgan model for room
temperature behavior of AVCO Mod 3a carbon-carbon are obtained with the
JNMDATA program [2.3-181, and are given in Table 3.1. The mechanical
property vs. strain energy curves are displayed in Figs. 3.15 - 3.18, and
82
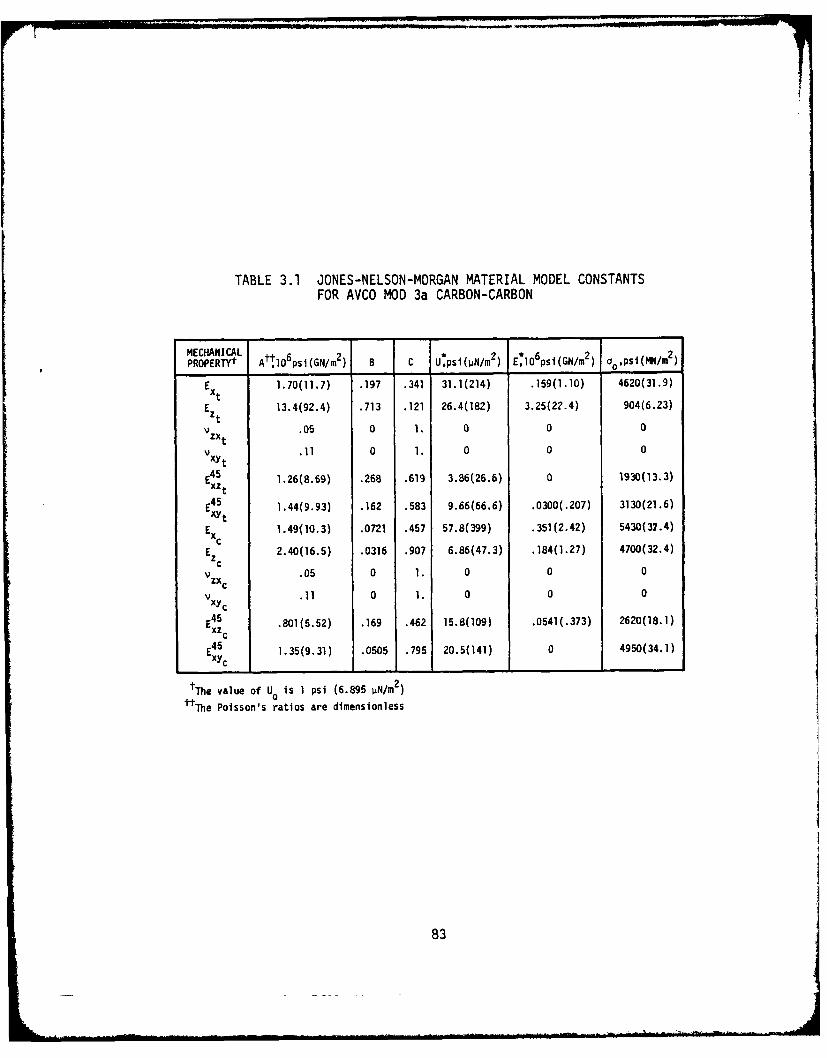
TABLE 3.1 JONES-NELSON-MORGAN MATERIAL MODEL CONSTANTSFOR AVCO MOD 3a CARBON-CARBON
MECHANICAL B C 2psisj(N/m2) asi(/m 2
PROPERTYt At106 psi(GN/m2) B C Upsi(pN/ ,) Ops m ,P)
E x 1.70(11.7) .197 .341 31.1(214) .159(1.10) 4620(31.9)
E z 13.4(92.4) .713 .121 26.4(182) 3.25(22.4) 904(6.23)
z .05 0 1. 0 0 0ZX t
V .11 0 1. 0 0 0Vxyt
45 1.26(8.69) .268 .619 3.86(26.6) 0 1930(13.3)xzt
45 1.44(9.93) .162 .583 9.66(66.6) .0300(.207) 3130(21.6)xytExt 1.49(10.3) .0721 .457 57.8(399) .351(2.42) 5430(37.4)
E 2.40(16.5) .0316 .907 6.86(47.3) .184(1.27) 4700(32.4)
.05 0 1. 0 0 0zxcV xy .11 0 1. 0 0 0xy c
45 .801(5.52) .169 .462 15.8(109) .0541(.373) 2620(18.1)xzc
E45 1.35(9.31) .0505 .795 20.5(141) 0 4950(34.1)xyc
tiThe value of U o is I psi (6.895 pN/m2)
tThe Poisson's ratios are dimensionless
83
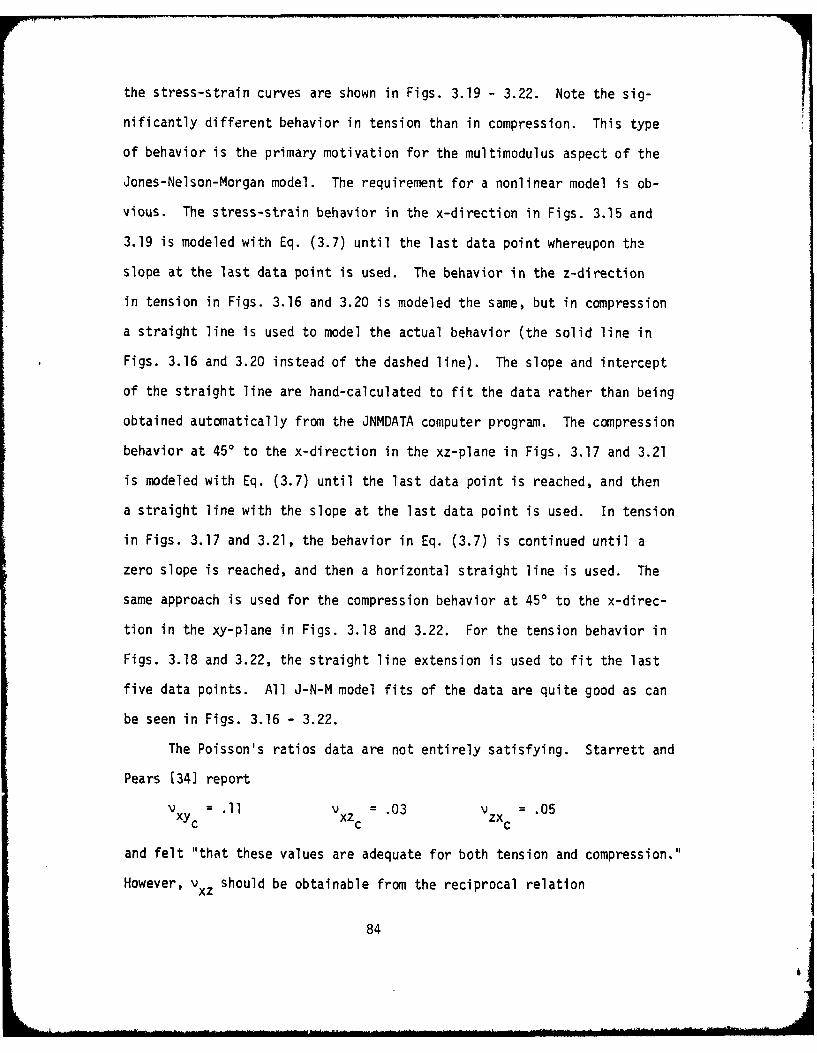
the stress-strain curves are shown in Figs. 3.19 - 3.22. Note the sig-
nificantly different behavior in tension than in compression. This type
of behavior is the primary motivation for the multimodulus aspect of the
Jones-Nelson-Morgan model. The requirement for a nonlinear model is ob-
vious. The stress-strain behavior in the x-direction in Figs. 3.15 and
3.19 is modeled with Eq. (3.7) until the last data point whereupon the
slope at the last data point is used. The behavior in the z-direction
in tension in Figs. 3.16 and 3.20 is modeled the same, but in compression
a straight line is used to model the actual behavior (the solid line in
Figs. 3.16 and 3.20 instead of the dashed line). The slope and intercept
of the straight line are hand-calculated to fit the data rather than being
obtained automatically from the JNMDATA computer program. The compression
behavior at 450 to the x-direction in the xz-plane in Figs. 3.17 and 3.21
is modeled with Eq. (3.7) until the last data point is reached, and then
a straight line with the slope at the last data point is used. In tension
in Figs. 3.17 and 3.21, the behavior in Eq. (3.7) is continued until a
zero slope is reached, and then a horizontal straight line is used. The
same approach is used for the compression behavior at 450 to the x-direc-
tion in the xy-plane in Figs. 3.18 and 3.22. For the tension behavior in
Figs. 3.18 and 3.22, the straight line extension is used to fit the last
five data points. All J-N-M model fits of the data are quite good as can
be seen in Figs. 3.16 - 3.22.
The Poisson's ratios data are not entirely satisfying. Starrett and
Pears 134] report
V = .11 V = .03 c = .05xY c xz c zx c
and felt "that these values are adequate for both tension and compression."
However, vxz should be obtainable from the reciprocal relation
84
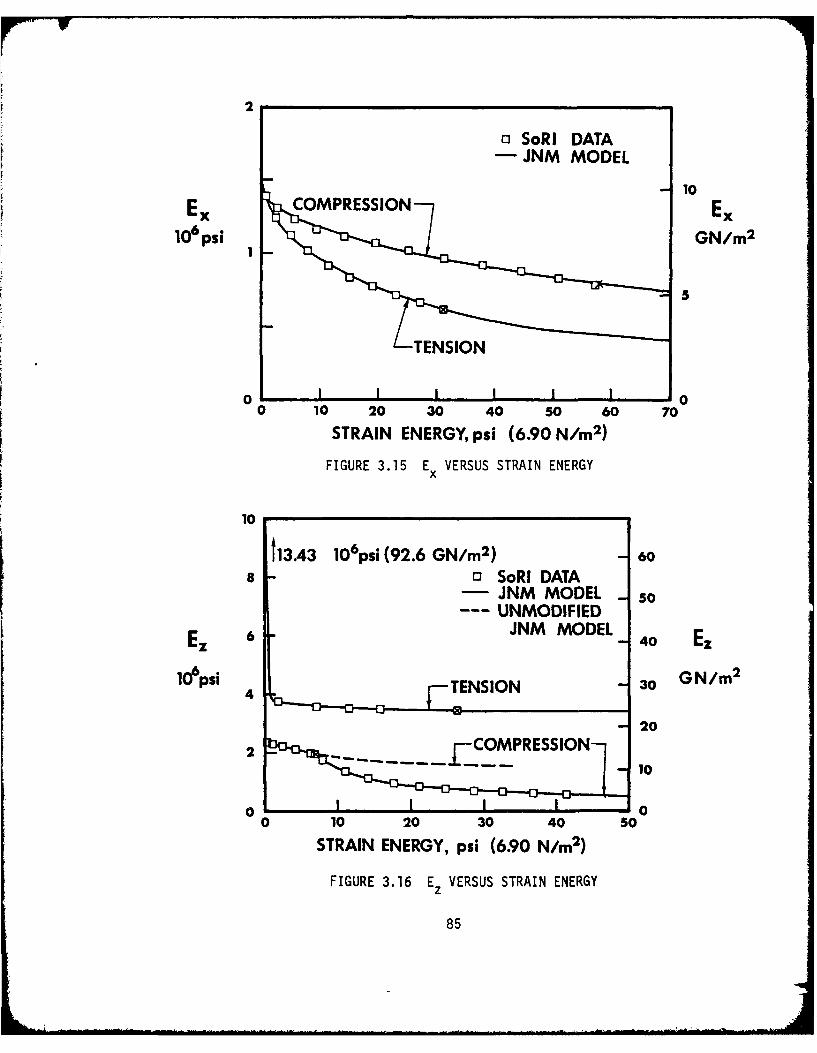
2
o SoRI DATA- JNM MODEL
X 10
Ex COMPRESSIONEx106psi GN/m 2
1
5
0N.0 10 20 30 40 50 60 70STRAIN ENERGY, psi (6.90 N/m 2 )
FIGURE 3.15 E VERSUS STRAIN ENERGYx
10
t1343 106psi (92.6 GN/m 2) 608 13 SoRI DATA
JNM MODEL 50--- UNMODIFIED
Ez 6 JNM MODEL 40 Ez
106psi TENSION 30 GN/m 2
202 .... COMPRESSION-
10
0 00 10 20 30 40 50
STRAIN ENERGY, psi (6.90 N/m 2)
FIGURE 3.16 Ez VERSUS STRAIN ENERGY
85
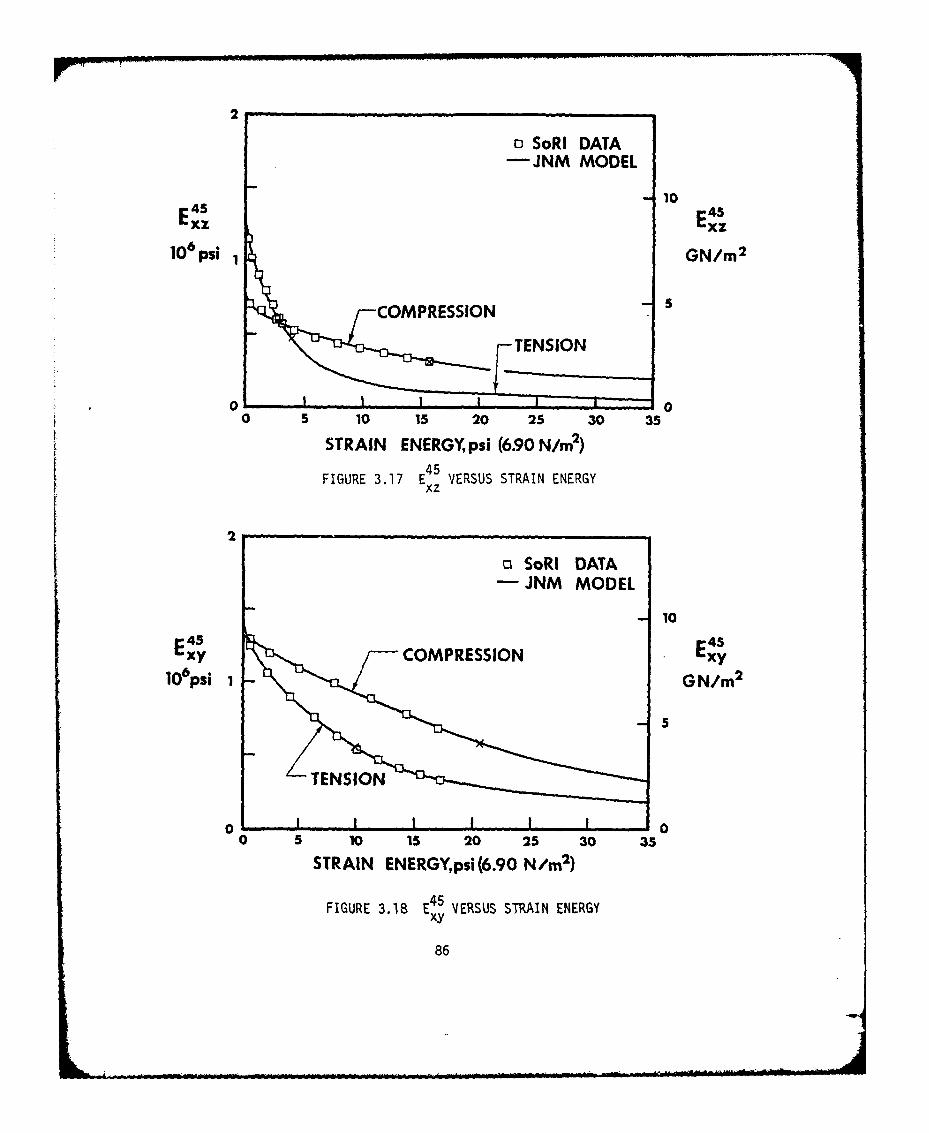
2
o SoRI DATA- NM MODEL 1
psi 1GN/m 2
COMPRESSION
TENSION
0l 00 5 10 i5 20 25 30 35
STRAIN ENERGYpsi (690 N/n 2)
FIGUE 3.7 E45 VRU TANEEGxz
2
cSoRI DATAJNM MODEL
10
Ex. COMPRESSION Ex.1O6 psi I GN/m 2
0 5 10 1s 20 25 30 35
STRAIN ENERGYpsi(6.90 N/n 2)
FIGURE 3.18 E 45 VERSUS STRAIN ENERGYxy
86
10
60
8 COMPRESSION50
ksi MN/rn2
4 30
20
2 -o SoRI DATA- JNM MODEL 10
0 1 100 2 4 6 8 10 12 14
ESX, 10-3FIGURE 3.19 STRESS-STRAIN BEHAVIOR IN THE x-DIRECTION
20
TENSIONA 12
15- 100
ksi 0CMRESO 0 MN/m2
5 o0 SoRI DATA -40
-- UNMODIFIED 20
0 00 2 4 6 8 10 12 14
FIGURE 3.20 STRESS-STRAIN BEHAVIOR IN THE z-DIRECTION
87
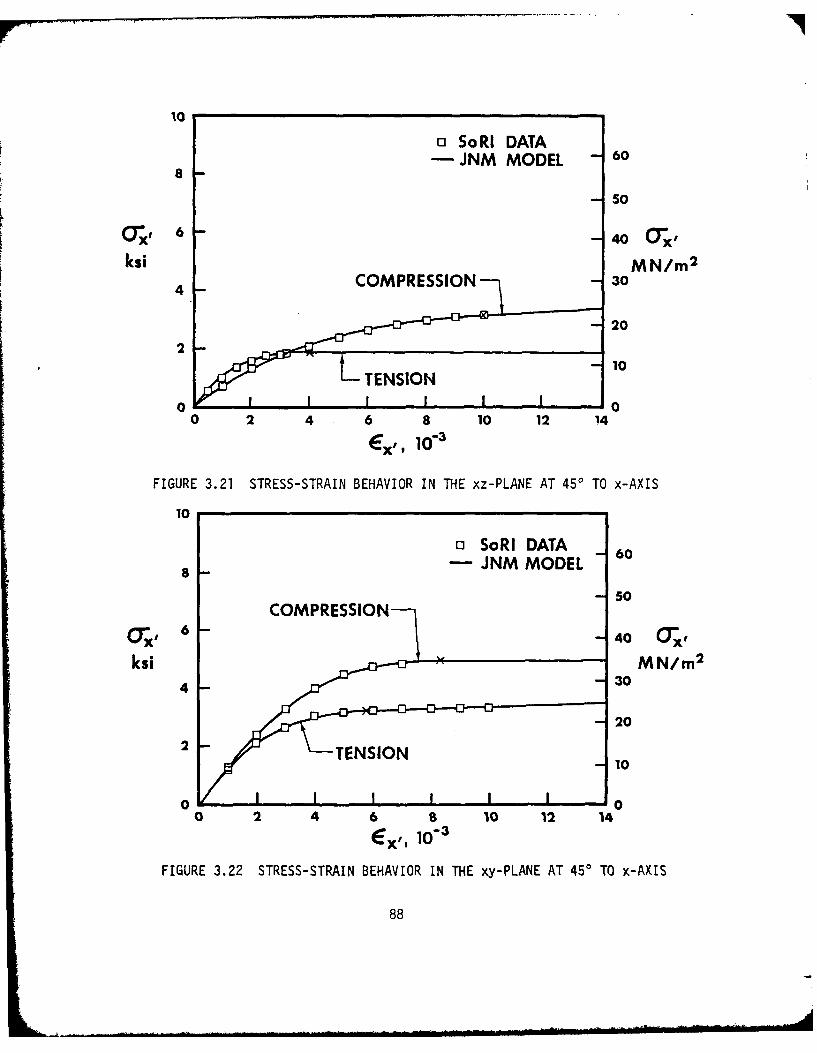
10
o SoRI DATA-JNM MODEL 6
50
(TX 40 C~
ksi MN/rn2
4COMPRESSION -3
-20
2
L 10
0 100 2 4 6 8 10 12 14
Ex 1, io-3
FIGURE 3.21 STRESS-STRAIN BEHAVIOR IN THE xz-PLANE AT 45' TO x-AXIS
10
o SoRI DATA 68- JNM MODEL 60
-50COMPRESSION
ax, 6 - 40 (X
ksi MN/rn2
4 -30
-20
2 T E N I O N - 10
0 1 00 2 4 6 8 10 12 14
FIGURE 3.22 STRESS-STRAIN BEHAVIOR IN THE xy-PLANE AT 450 TO x-AXIS
88

EVxz zx E
For compression properties, vxz does turn out to be .03. However, for
tension properties, v is .02 or even as small as .006 if the values of
A are used in the calculation. Moreover, the Poisson's ratios are not
reported to be a function of stress level as would be expected for pro-
perties of a material with highly nonlinear stress-strain behavior. These
are the reasons for some uneasiness about the values of Poisson's ratios
in Table 3.1.
The data reported by Starrett, Weiler, and Pears [23] are in the
form of "most probable value" curves to attempt to represent the amalga-
mation of many billets of Mod 3a carbon-carbon. That is, the billet-to-
billet variation of mechanical properties is quite high. However, the
most probable value curves are not sufficiently well established statis-
tically to render good comparisons between theory and experiment valid
nor to render unsatisfactory comparisons invalid. Accordingly, because
of the discomforting nature of the Poisson's ratios data and the statis-
tically unsatisfying nature of the other mechanical property data, com-
plete confidence that a model has been established for AVCO Mod 3a carbon-
carbon cannot be claimed. However, the quality of this model is higher
than can be obtained for any other carbon-carbon because the data base
for all other materials is even less satisfactory!
After the model is obtained, predictions of strains for specified
multiaxial stress states can be made. However, the mechanical properties
in Eq. (3.7) depend on the stresses and strains through the strain energy.
Also, the stresses are related to the strains through the mechanical
properties. Thus, for a given multiaxial loading condition, the stresses,
strains, and mechanical properties are interdependent in transcendental
89

relationships. Accordingly, the iteration procedure due to Jones and
Nelson [2.3-13] is used to find the correct stresses, strains, and
mechanical properties for a given loading state.
90
3.5 EFFECT OF SHEAR COUPLING ON UNIAXIAL OFF-AXIS LOADING
The strains for a specified uniform stress state can be predicted by
use of the MULTIAX computer program. These predictions can be
made for materials with nonlinear stress-strain behavior by use of the
Jones-Nelson-Morgan nonlinear material model. However, actual test speci-
mens under off-axis loading are in constrained states of strain which do
not coincide with the usual objective for a test specimen of a uniform
state of strain and stress. As discussed in Section 3.2, the ends of a
uniaxial test specimen are usually forced to remain parallel by clamping
devices at each end. Thus, the shearing deformation that would otherwise
develop is partially prevented unless the observation is made at the center
portion of a very long slender test specimen. The bounds on such behavior
are shown in Fig. 3.8; there, a short wide specimen (length over width
effectively zero) is shown to exhibit an effective or apparent modulus C,
Qll whereas a long narrow specimen (length over width effectively infinite)
exhibits the actual modulus Ex,. Pagano and Halpin [36] analyze the
strains that exist in a simple rectangular tension (or compression) speci-
men of length L and width w (hence, their specimen is intermediate to the
bounding cases on L/w just described). Their material behavior is linear
elastic but orthotropic in principal material directions. However, the
material behavior of present interest is nonlinear and orthotropic. Thus,
their analysis must be modified or their results must be reinterpreted to
account for the material nonlinearity. Then, the results of the new
analysis for AVCO Mod 3a carbon-carbon will be examined.
3.5.1 Adaptation of Elastic Analysis for Shear Coupling to NonlinearMaterials
For a rectangular specimen L long and w wide, Pagano and Halpin
(36] obtain an apparent off-axis Young's modulus from their solution for
91

the strains as
x Cy S11
x' -Sl (3.11)
r n=3 6/ [3[66 + 2S11() (3.11)
and the S.. are the transformed compliances of an orthotropic material
(see Jones [371). As L/w approaches infinity (a long slender specimen),
n approaches zero, so E*, approaches Ex, = 1/S the Young's modulus inx 11'
a uniform stress and strain state. On the other hand, as L/w approaches
zero (a short wide specimen),
Ex *: 6 (3.12)
11S66 16
which can be shown to be less than QII of Eq. (3.2) and Fig. 3.8. For
AVCO Mod 3a carbon-carbon, the results for E*,, E ,, and are shownx X
as a function of off-axis angle in Fig. 3.23. Obviously, E* is well
above the actual modulus Ex,, but not as much above as is Q11 " For a
specific applied stress - ,, the implication of shear coupling for a
specimen of length L and width w is that the axial strain e , is smaller
than without shear coupling and is obtained by multiplying the uniform
stress and strain state strain by the factor (1-n):
Ex' = (l-n)E, , (3.13)actual Xuniform
or, if the modulus factor is defined as 1/(l-n), then we divide the uni-
form stress and strain state strain by the modulus factor.
Similarly, Pagano and Halpin obtain the lateral and shear strains
along the specimen centerline as
92

15
L/w=O
E * 1- X ,' --XXI
10 6 psiz
5
0 IEx'
0 30 60 90
FIGURE 3.23 APPARENT MODULI FOR AVCO MOD 3a CARBON-CARBONOFF-AXIS TEST SPECIMENS WITH L/w = 0
93
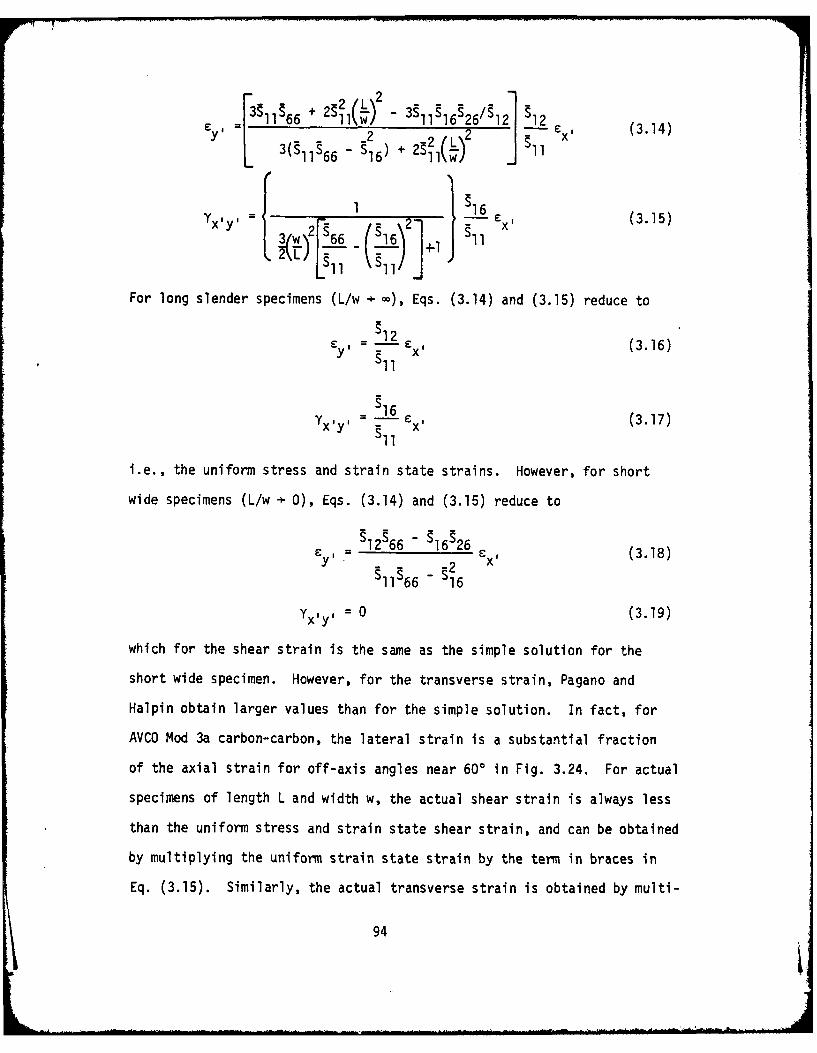
39 1 6 +2 1 l(wo) - 3S 11S 16 S26/S 12] 12 (.4Y 2 L
Y 1!1 (3.15)3 w 2!6 6 1
For long slender specimens (L/w Ca), Eqs. (3.14) and (3.15) reduce to
£y, !12 x' (3.16)
11
Yx=y Cx (3.17)
i.e., the uniform stress and strain state strains. However, for short
wide specimens (L/w - 0), Eqs. (3.14) and (3.15) reduce to
S 12S66 - 16 S26C y , I -x (3.18)
S i6S11S66 16
Yx'y' = 0 (3.19)
which for the shear strain is the same as the simple solution for the
short wide specimen. However, for the transverse strain, Pagano and
Halpin obtain larger values than for the simple solution. In fact, for
AVCO Mod 3a carbon-carbon, the lateral strain is a substantial fraction
of the axial strain for off-axis angles near 600 in Fig. 3.24. For actual
specimens of length L and width w, the actual shear strain is always less
than the uniform stress and strain state shear strain, and can be obtained
by multiplying the uniform strain state strain by the term in braces in
Eq. (3.15). Similarly, the actual transverse strain is obtained by multi-
94

IIi ~1. ' ,
.6
.2
00 30 6 60 90
FIGURE 3.24 LATERAL STRAIN FOR AVCO MOD 3a CARBON-CARBONOFF-AXIS TEST SPECIMENS WITH L/w -0
95
plying the uniform strain state strain by the term in brackets in Eq.
(3.14).
The key issue now is how can the foregoing analysis be used in the
analysis of materials with nonlinear stress-strain behavior? The Pagano
and Halpin analysis is adapted to treat nonlinear material behavior by
using the compliances as a function of stress levels in all the preceding
equations. That is, secant moduli are used to calculate the compliances
in a deformation theory of orthotropic plasticity (the Jones-Nelson-
Morgan model). As the stress level increases in an off-axis test, the
compliances grow larger and the moduli get smaller. Thus, the modulus
reduction factors and strain reduction factors can be calculated for use
in modifications of the MULTIAX strain predictions for off-axis loading.
3.5.2 Strains for Off-Axis Loading in the xz-plane of AVCO Mod 3a
Carbon-Carbon
The uniform stress and strain state strains obtained with MULTIAX
for off-axis tension and compression loading in the xz-plane of AVCO Mod
3a carbon-carbon are shown in Figs. 3.25 to 3.28 for several stress levels.
The off-axis normal strains are largest near e = 45' and increase rapidly
with increasing stress. The off-axis shear strains are largest near 200
and 600 and are zero near 450 (and, of course, are zero at e = 0* and 90').
The magnitudes by which these uniform strain state strains must be
adjusted to obtain reasonable approximations of actual test specimen be-
havior are plotted for several L/w ratios as modulus factors in Figs.
3.29 and 3.30 and as shear strain reduction factors in Figs. 3.31 to 3.33.
The tension modulus increase (reciprocal of the normal strain decrease)
in Fig. 3.29 is negligible for off-axis angles less than 500 and greater
96
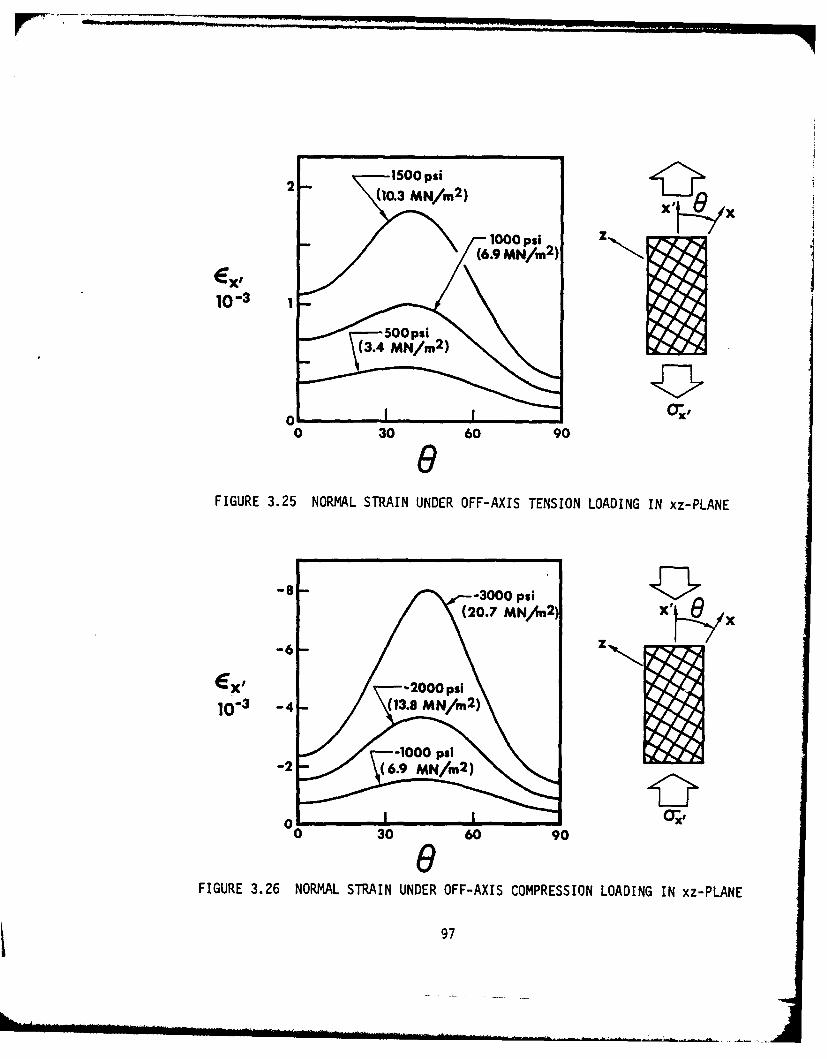
2--1500 psi2-)(10.3 MN/n 2 ) L.
1000 psi z
Ex,
'"500 psi
\ 6NMNm2
0 30 60 90
&FIGURE 3.25 NORMAL STRAIN UNDER OFF-AXIS TENSION LOADING IN xz-PLANE
-6- -3000 psi(20.7 M N/m21 x'
-6 -
e t -2000 psi
-2 6.9 MN/m2)
0 30 60 90
&FIGURE 3.26 NORMAL STRAIN UNDER OFF-AXIS COMPRESSION LOADING IN xz-PLANE
97

10- 1500 psi(10.3 MN/m2) x e;/
104 0 500 psi --
(3.4 MN/m 2 ) "/,
- 1000 piF--
(6 20 30 60 90
FIGURE 3.27 SHEAR STRAIN UNDER OFF-AXIS TENSION LOADING IN xz-PLANE
4 - -3000 psi
3 (20.7 MN/m 2 ) x
2 -2000 psi1 f 'K (13.8 MN/m 2 )
103 0 ----l00psi
-1 - (6.9 MN/m 2 )
-2-
"4-3
-5
0 30 60 90&FIGURE 3.28 SHEAR STRAIN UNDER OFF-AXIS COMPRESSION LOADING IN xz-PLANE
98
L.A
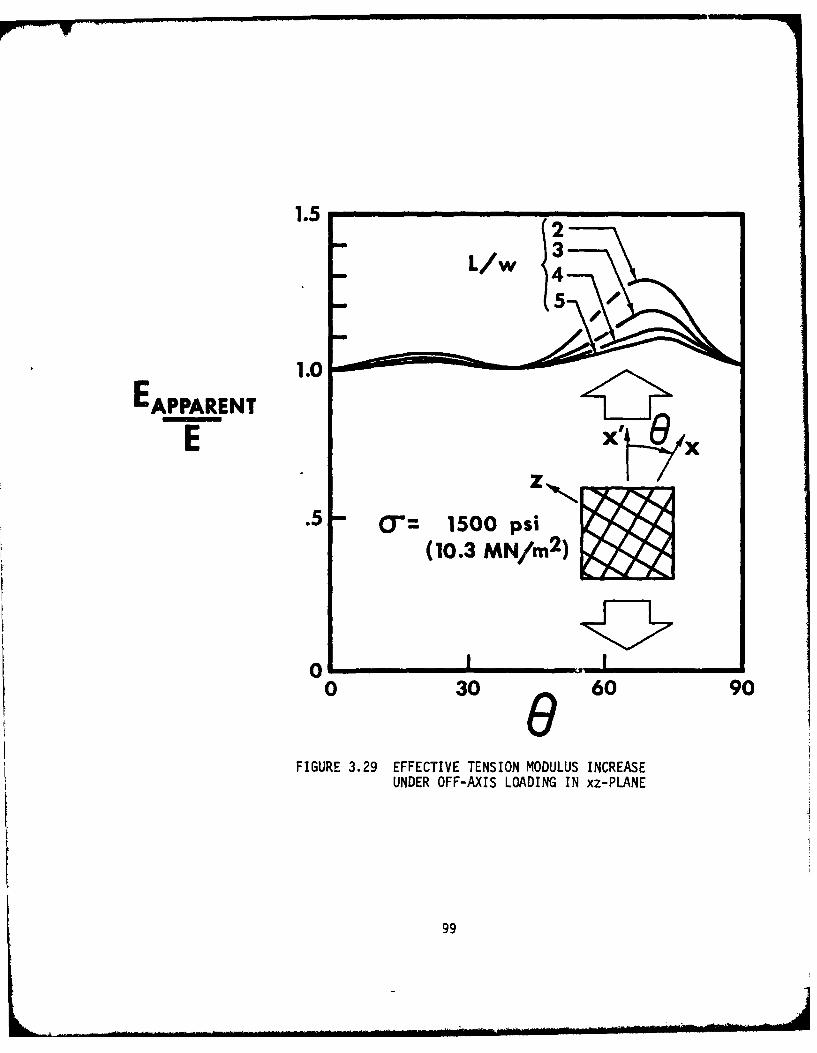
1.5,
1.0EAPPARENT
E x
. 1500 psi(10.3 MN/m 2 )
00 30 60 90
FIGURE 3.29 EFFECTIVE TENSION MODULUS INCREASEUNDER OFF-AXIS LOADING IN xz-PLANE
99
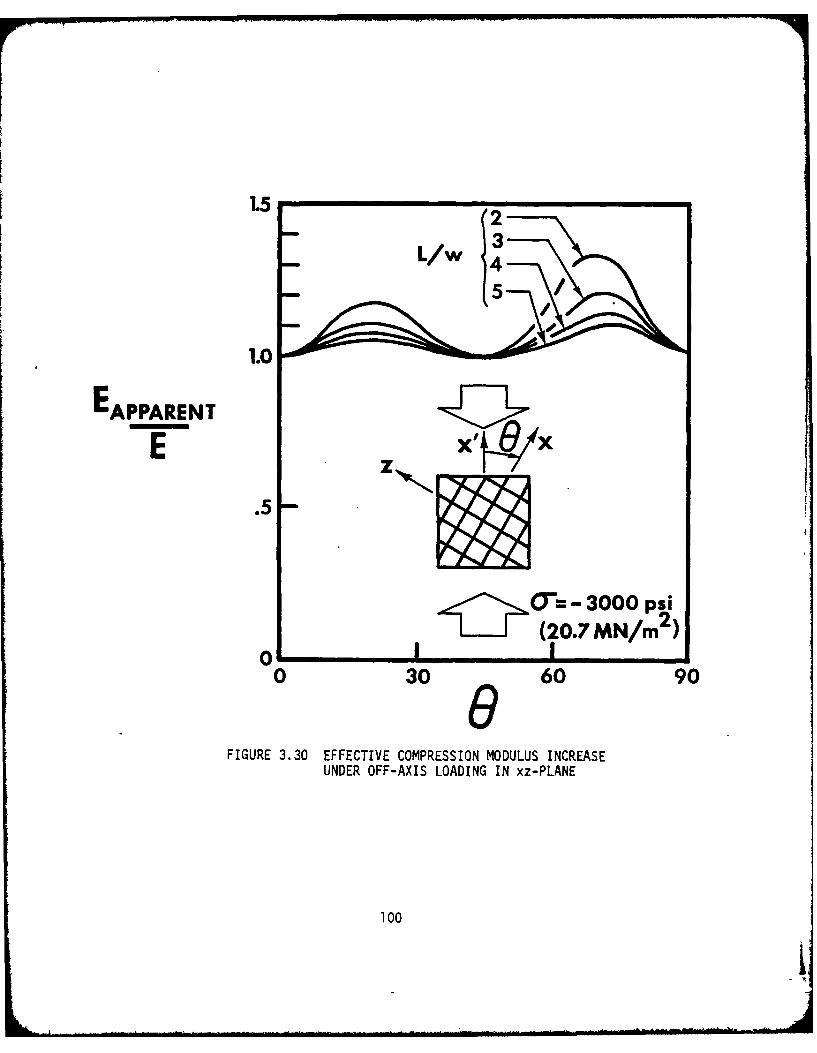
15 '21.55
1.0
EAPPARENT
"'=- 3000 psi(20.7 MN/m 2 )
0 -1 _0 30 60 90
FIGURE 3.30 EFFECTIVE COMPRESSION MODULUS INCREASEUNDER OFF-AXIS LOADING IN xz-PLANE
100
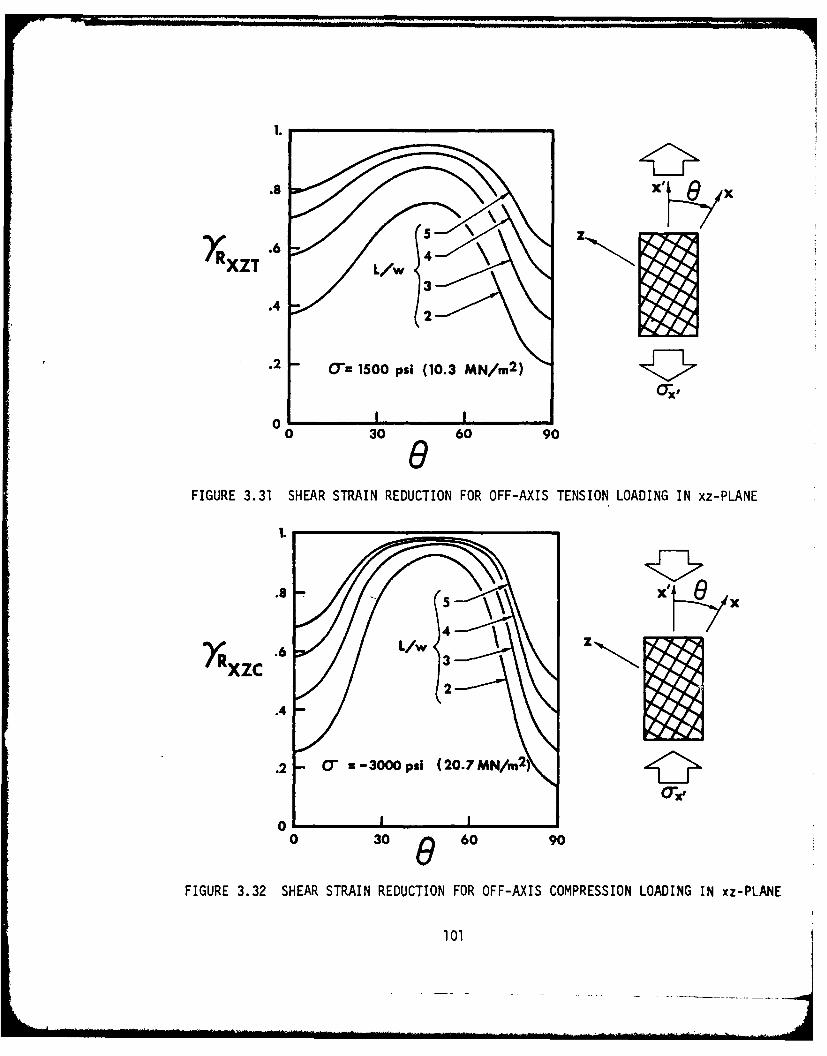
.8
5"
YXZT -6IL/.4
.2 = 1500 psi (10.3 MN/m 2 )
ox,
00 30 60 90
&FIGURE 3.31 SHEAR STRAIN REDUCTION FOR OFF-AXIS TENSION LOADING IN xz-PLANE
I.
8 "5 -x X
.6 L/w z
.4 -
.2 - :-3000 psi (20.7MN/m 2
O'x,
of0 30 & 60 90
FIGURE 3.32 SHEAR STRAIN REDUCTION FOR OFF-AXIS COMPRESSION LOADING IN xz-PLANE
101

1.:
-3000 psi
.8
Rxzc
-1000 psi.4 (6.9 MN/rn2 )
.2 IL/2
00 30 60 90
&FIGURE 3.33 SHEAR STRAIN REDUCTION AS A FUNCTION OF STRESS LEVEL
UNDER OFF-AXIS COMPRESSION LOADING IN xz-°LANE
102
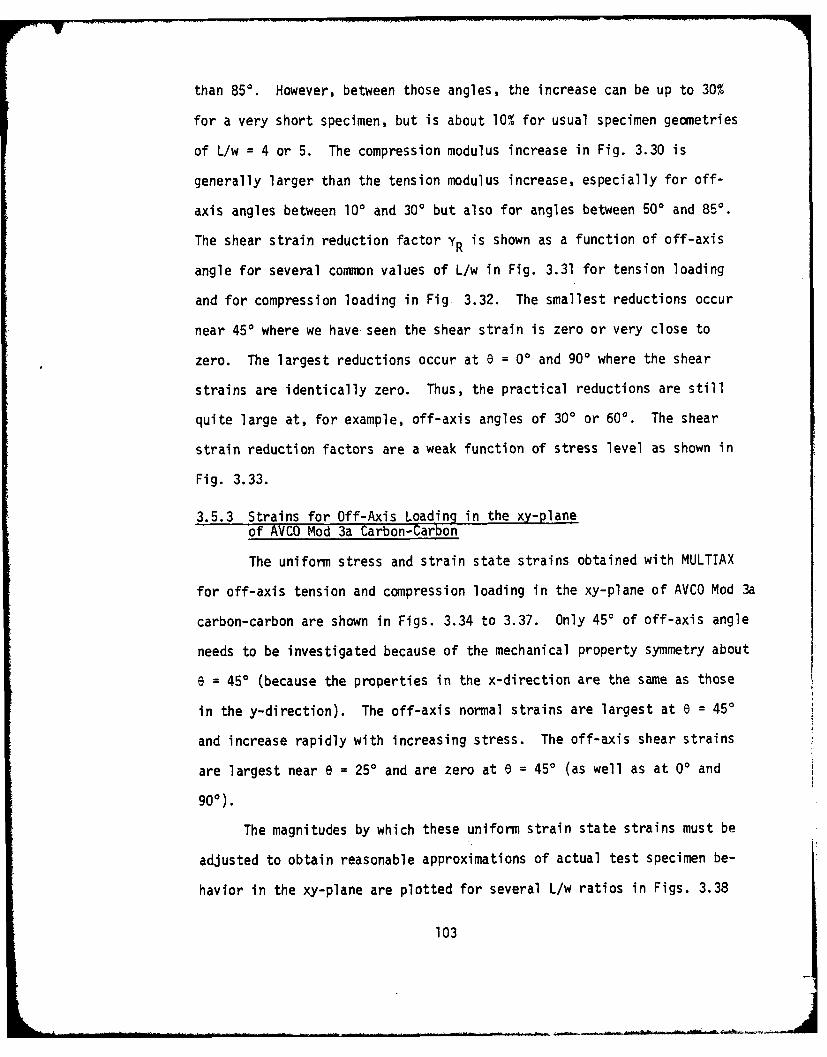
than 850. However, between those angles, the increase can be up to 30%
for a very short specimen, but is about 10% for usual specimen geometries
of L/w = 4 or 5. The compression modulus increase in Fig. 3.30 is
generally larger than the tension modulus increase, especially for off-
axis angles between 100 and 300 but also for angles between 500 and 850.
The shear strain reduction factor YR is shown as a function of off-axis
angle for several common values of L/w in Fig. 3.31 for tension loading
and for compression loading in Fig 3.32. The smallest reductions occur
near 450 where we have-seen the shear strain is zero or very close to
zero. The largest reductions occur at 6 = 0' and 900 where the shear
strains are identically zero. Thus, the practical reductions are still
quite large at, for example, off-axis angles of 300 or 600. The shear
strain reduction factors are a weak function of stress level as shown in
Fig. 3.33.
3.5.3 Strains for Off-Axis Loading in the xy-plane
of AVCO Mod 3a Carbon-Carbon
The uniform stress and strain state strains obtained with MULTIAX
for off-axis tension and compression loading in the xy-plane of AVCO Mod 3a
carbon-carbon are shown in Figs. 3.34 to 3.37. Only 45' of off-axis angle
needs to be investigated because of the mechanical property symmetry about
6 = 450 (because the properties in the x-direction are the same as those
in the y-direction). The off-axis normal strains are largest at 6 = 450
and increase rapidly with increasing stress. The off-axis shear strains
are largest near e = 250 and are zero at e = 450 (as well as at 00 and
900).
The magnitudes by which these uniform strain state strains must be
adjusted to obtain reasonable approximations of actual test specimen be-
havior in the xy-plane are plotted for several L/w ratios in Figs. 3.38
103
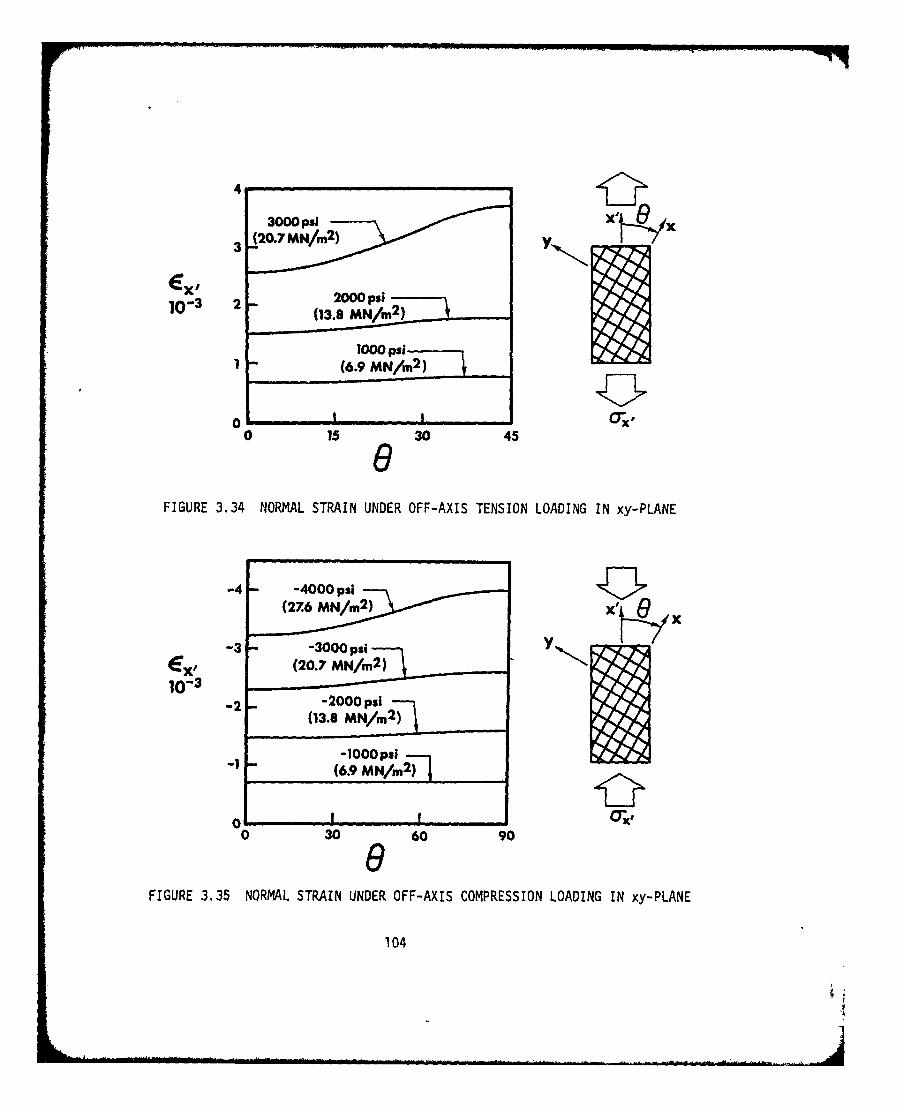
4 1(20. 7 MN/rn2)y
.7 (6./MNrn2
00
-4X -4 000 psi
13000 p2
(13.8 MN/n 2 )
-13
0 1 _
0 30 60 90
FIGURE 3.3 NORMAL STRAIN UNDER OFF-AXIS COPESION LOADING IN xy-PLANE
-4 - -000 104
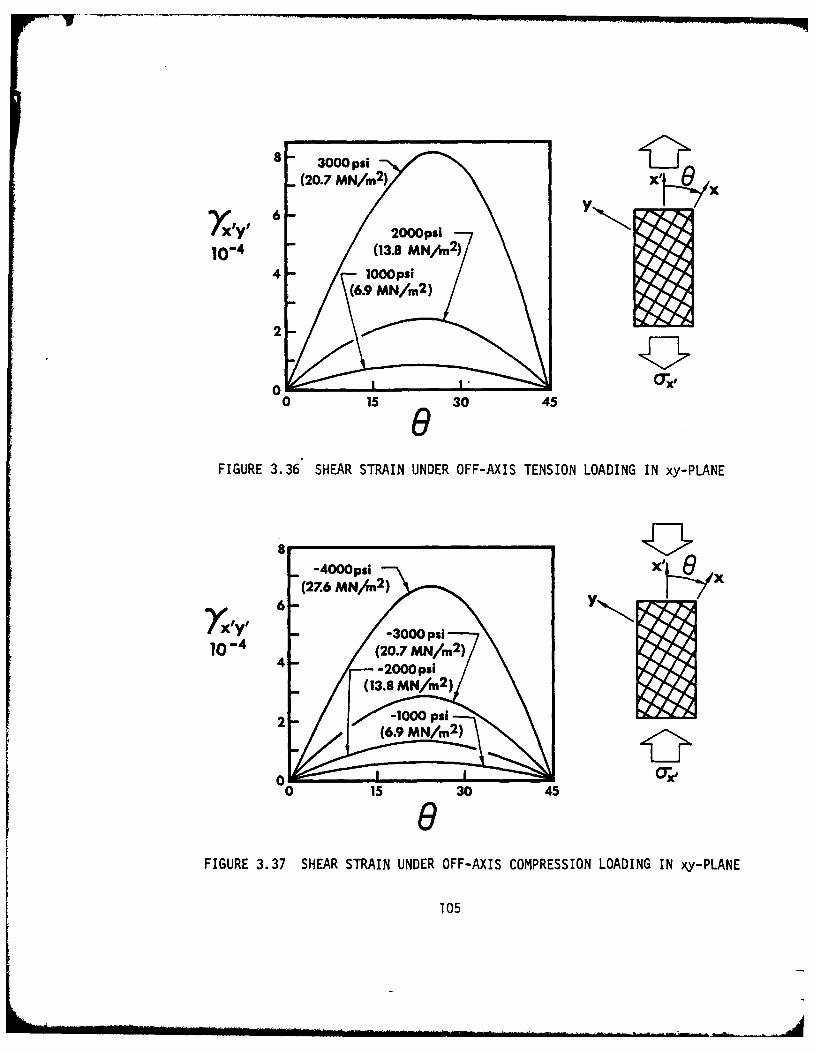
3000 psi
(20.7 13. MN m N/y .
6 -Xly I O00ps
ioi4 looopsi
2
0 aKx,0 15 30 45
&FIGURE 3.36 SHEAR STRAIN UNDER OFF-AXIS TENSION LOADING IN xy-PLANE
-4000psi - I x
6 -4
0 15 30 45&
FIGURE 3.37 SHEAR STRAIN UNDER OFF-AXIS COMPRESSION LOADING IN xy-PLANE
105

.
.6 - .........
XYT.24
t1000 psi (6.9 MN/n 2 )
.2- 3000 psi (20.7 MN/n 2 )
oI I
0 15 30 45&FIGURE 3.38 SHEAR STRAIN REDUCTION FOR OFF-AXIS TENSION LOADING IN xy-PLANE
.8
..2 -4000 psI ( 2. Nr
-1000 ps 06 Nr

and 3.39. Actually, the tension and compression modulus factors are
essentially one, so no adjustment is necessary for normal strains. For
shear strains, the reductions are shown for tension loading in Fig. 3.38
and for compression loading in Fig. 3.39 where we see that the reductions
depend mainly on the value of L/w. That is, the reductions are a weak
function of stress level and of off-axis angle.
107
3.6 COMPARISON OF PREDICTED AND MEASURED STRAIN RESPONSE FOR
UNIAXIAL OFF-AXIS LOADING OF AVCO MOD 3a CARBON-CARBON
Starrett, Weiler, and Pears subjected specimens of AVCO Mod 3a
carbon-carbon to uniaxial tension and compression off-axis loading in the
xy- and xz- planes. Their specimens have length-to-width ratios of ap-
proximately four and five (approximate because of specimen fillets). The
Jones-Nelson-Morgan nonlinear multimodulus material model developed in
Section 3.4 is used in the MULTIAX computer program to predict uniform
strain state strains under the off-axis loading applied to the test speci-
mens. Also in the MULTIAX program are strain corrections caused by shear
coupling for the length-to-width ratios of the actual test specimens as
described in Section 3.5.
Following are the predicted and measured strain response for these
specimens used to validate the Jones-Nelson-Morgan material model.
Generally, the uniaxial loading is applied at 22;0 to the x-direction in
the xy-plane and in the xz-plane. In only one case is response at 67 0
to the x-direction measured. Shear loading is also applied, and the
results are used as another independent validation of the Jones-Nelson-
Morgan model predictions. The word independent is used because no shear
behavior is used to define or construct the Jones-Nelson-Morgan model.
The xy-plane tension stress-strain behavior is shown in Fig. 3.40
where the x-direction behavior (identical to the y-direction behavior) is
displayed along with the behavior at 450 to the x-direction (the 45xy
curve). Those two curves are part of the behavior used to define the
Jones-Nelson-Morgan material model in Section 3.4. The model is used to
predict the response at 22 0 to the x-direction which is very close to
the measured response. A similar set of curves is shown for the xy-
plane compression behavior in Fig. 3.41. However, the Jones-Nelson-Morgan
108

7
5 x
Ei 3- 0
FIGURE 3.40 TENlSION STRESTRIN BEHAVIOR INXypLANE
10
ksi
MN/M2
03
IE, 10-3FIGURE 3.47 COMPRESSIO8 STRESS.S TRAIN BEHAVIOR IN XY-PLAXE
I 09
model is not forced to dip as low as the actual 45xy curve does. Even
so, the predicted response at 22 0 is well below the measured response.
However, the measured response looks quite high in that it seems to be
too close to the x-direction behavior and not close enough to the behavior
at 450 to the x-direction.
The xz-plane tension behavior is shown in Fig. 3.42 where the x-
direction behavior, z-direction behavior, and the behavior at 450 to the
x-direction (the 45xz curve) are displayed. Those three curves are part
of the behavior used to define the Jones-Nelson-Morgan material model in
Section 3.4. The model is used to predict the response at 22 ° and 67 0
to the x-direction. The predicted response at 22 0 (the 22xz curve) is
quite close to the measured behavior. On the other hand, the predicted
response at 67 0 (the 67xz curve) is above the measured behavior. However,
the measured 67 0 response appears a bit low, i.e., it would seem reason-
able for the measured response to be closer to the z-direction response
that occurs. A similar set of curves is shown for the xz-plane compression
behavior in Fig. 3.43. There, the predicted response at 22 ° to the x-
direction is below the measured response. The predicted 22 ° response does
not rise significantly when the z-direction behavior is modeled as a
continuously rising curve instead of the broken curve in Fig. 3.43. That
is, even if we ignore whatever physical reason that causes the broken
curve and assume it won't happen in off-axis loading, we don't obtain a
higher 22xz predicted response.
The measured and predicted xy-plane shear response is shown in Fig.
3.44. There, we see that the predicted response is somewhat below the
measured response. For the xz-plane in Fig. 3.45, the predicted response
is first higher and then lower than the measured response. In both cases,
the predicted response is reasonably close to the measured response,
110
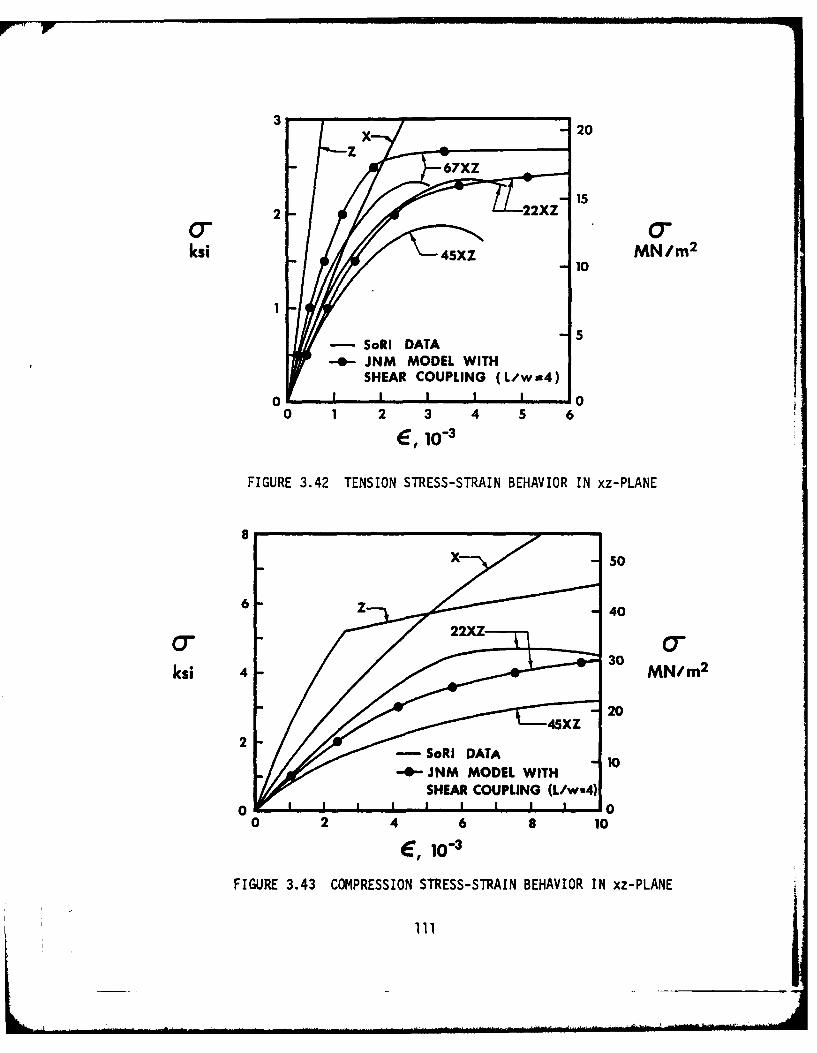
3 20
67XZ " l V7 7 15
2 MN2XZ
ksi45Z1 N m
11
-SoRI DATA5-0-JNM MODEL WITH
SHEAR COUPLING (L/w=4)
0 1 1 I 10 1 2 3 4 5 6
6,1io3
FIGURE 3.42 TENSION STRESS-STRAIN BEHAVIOR IN xz-PLANE
Ix 50
6 Z- 40
ksi 4 30 MN/rn2
20
-SoRt DATA 1
0 2 4 6 8 10
FIGURE 3.43 COMPRESSION STRESS-STRAIN BEHAVIOR IN xz-PLANE

2500
-152000
1500 - 10 TF
psi MN/rn
5
500 - SoRI DATA-- JNM MODEL
0 1 1 1 1 1 10 1 2 3 4 5 6 7 8 9 10
FIGURE 3.44 SHEAR STRESS-STRAIN BEHAVIOR IN xy-PLANE
1500 10
10001
psi 5 MN/rn2
500
-SoRI DATA4-JNM MODEL
0 1 00 1 2 3 4 5 6 7 8 9 10
10-o3
FIGURE 3.45 SHEAR STRESS-STRAIN BEHAVIOR IN xz-PLANE
112
especially when we consider the imperfect nature of the shear test [38].
3.7 CONCLUDING REMARKS
The class of fiber-reinforced composite materials called carbon-
carbon is investigated from the standpoint of mechanical response to
loading. This class is found to have many characteristics that require
modeling and analysis techniques well beyond in complexity those used for
simpler materials. The possible efforts for correlation between predicted
and measured response are discussed in order to begin to define a plan
for the rational development and validation of suitable material models
to be used in design analysis of rocket nozzles and other carbon-carbon
applications. Then, a specific material model is developed for a repre-
sentative carbon-carbon, namely AVCO Mod 3a, a rectangularly orthotropic
material. Next, a single response measurement, the uniaxial off-axis
loading test, is discussed from the standpoint of how to account for the
shear coupling which for orthotropic materials is inherent to that test.
A method for adjusting predicted strain response to account for the shear
coupling is developed. Then, strain response predictions for off-axis
loading in two planes of AVCO Mod 3a carbon-carbon are compared with
measured response. The response predictions are quite reasonable when we
consider the fact that stress-strain data used to define the Jones-Nelson-
Morgan model are based on "most probable value" curves. "Most probable
value" curves are an approximate (but statistically incomplete) representa-
tion of a collection of somewhat inconsistent and highly variable (from
billet to billet) stress-strain curves. Thus, agreement between predicted
and measured response is no guarantee of material model validity nor is
disagreement necessarily an indication of material model invalidity.
However, the Jones-Nelson-Morgan nonlinear multimodulus material model
113
appears to be a reasonable representation of carbon-carbon behavior,although the model must be validated for more complex strain responsethan the present uniaxial off-axis loading test.
114

4. SUMMARY
The Jones-Nelson-Morgan nonlinear material models have been developed
and employed for several materials of interest for aerospace structures as
listed in Table 4-1. There, the material modeling capability is seen to
be most highly advanced for carbon-carbon and ATJ-S graphite as evidenced
by the fact that the most sophisticated material model, a nonlinear multi-
modulus material model, has been developed and used. The multimodulus
characteristics of boron-epoxy, graphite-epoxy, and boron-aluminum have
been investigated with a linear model. Also, nonlinear behavior of boron-
epoxy, graphite-epoxy, and boron-aluminum has been investigated. However,
the nonlinear and multimodulus characteristics of these materials have
not been investigated simultaneously because the potential interaction
between those characteristics should be small due to the low level of
multimodulus behavior.
The types of correlations between experimental measurements of be-
havior and theoretical predictions are shown for the materials of interest
in Table 4-2. ATJ-S graphite is the most comprehensively studied material.
A representative set of configurations with various stresses excited rela-
tive to principal material directions has been examined for both thermal
and mechanical loadir-i. Moreover, one of the ultimate applications of
the material, a reentry vehicle nosetip with thermal and mechanical load-
ing resulting in a multiaxial stress state is examined in Ref. 20. Ex-
perimental-theoretical correlation is somewhat sparse for the other
materials.
Basically, significant multimodulus effects have been observed for
granular composite materials such as ATJ-S graphite. On the other hand,
115
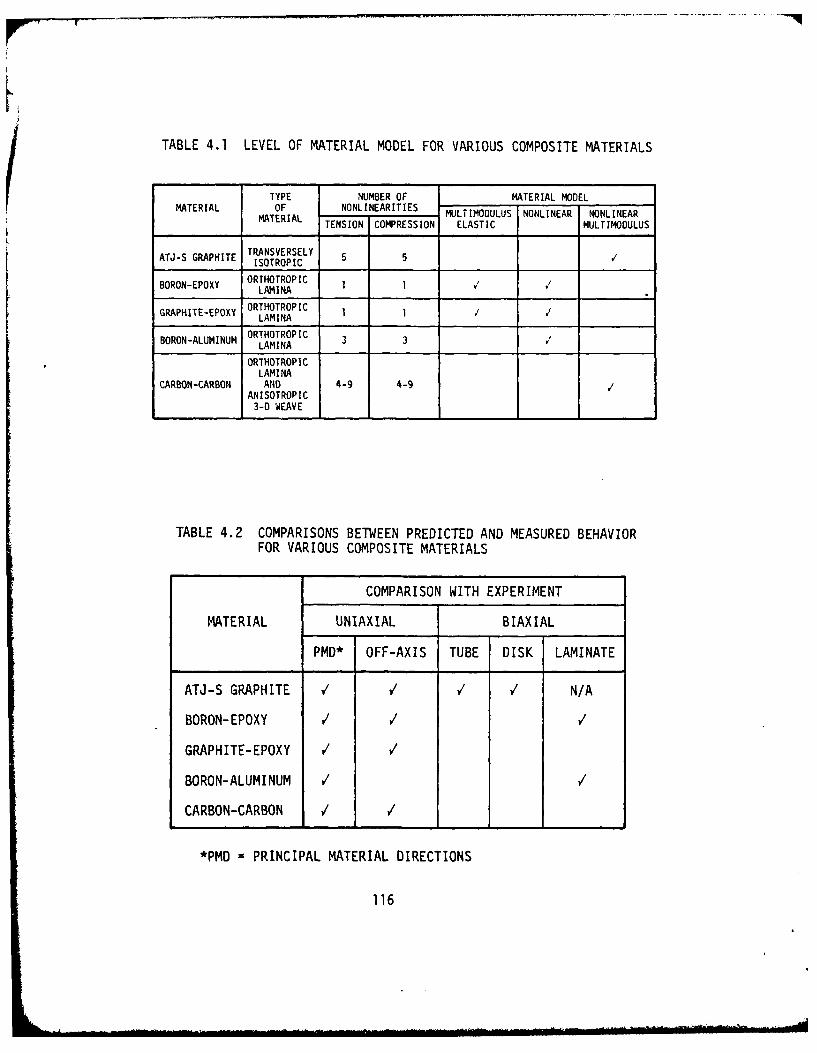
TABLE 4.1 LEVEL OF MATERIAL MODEL FOR VARIOUS COMPOSITE MATERIALS
TYPE NUMBER OF MATERIAL MODELMATERIAL OF NONLINEARITIES MULTIMODULUS NONLINEAR NONLINEAR
MATERIAL TENSION COMPRESSION ELASTIC MULTIMODULUS
ATJ-S GRAPHITE TRANSVERSELY 55ISOTROPIC
BORON-EPOXY ORTHOTROPIC I ILAMINA
GRAPHITE-EPOXY ORTHOTROPIC 1 1LAMINA
BORON-ALUMINUM ORTHOTROPIC 3 /____________ LAMINA ____ ______ _______ _ ____ ______
ORTHOTROPICLAMINA
CARBON-CARBON AND 4-9 4-9ANISOTROPIC3-0 WEAVE
TABLE 4.2 COMPARISONS BETWEEN PREDICTED AND MEASURED BEHAVIORFOR VARIOUS COMPOSITE MATERIALS
COMPARISON WITH EXPERIMENT
MATERIAL UNIAXIAL BIAXIAL
PMD* OFF-AXIS TUBE DISK LAMINATE
ATJ-S GRAPHITE v / v V N/A
BORON-EPOXY / / /
GRAPHITE-EPOXY Y /
BORON-ALUMINUM / V
CARBON-CARBON / /
*PMD = PRINCIPAL MATERIAL DIRECTIONS
116
the importance of multimodulus effects for fiber-reinforced composite
materials is somewhat mixed. The epoxy-based composites (boron-epoxy
and graphite-epoxy) do not exhibit strong multimodulus or nonlinear ef-
fects under room temperature and normal humidity conditions, but are ex-
pected to have enhanced effects at elevated temperatures and humidities.
Carbon-carbon composites exhibit strong multimodulus and nonlinear
effects. Irrespective of the specific material, both multimodulus
effects and nonlinear effects have been demonstrated to be susceptible to
rational analysis which leads to material models suitable for use in de-
sign analysis.
11

5. REFERENCES
1. J. William Davis and N. R. Zurkowski, Put the Strenoth and Stiffness Where
You Need It, Report T-STDB(I0 .05)R, Reinforced Plastics Division,
Minnesota Mining and Manufacturing Company.
2. Structural Design Guide for Advanced Composites Applications, Vol. I,
Material Characterization, 2nd Edition, Air Force Materials Laboratory,
January 1971.
3. K. M. Kratsch, J. C. Schutzler, and D. A. Eitman, "Carbon-Carbon 3-D
Orthogonal Material Behavior," AIAA Paper No. 72-365, AIAA/ASME/SAE 13th
Structures, Structural Dynamics, and Materials Conference, San Antonio,
Texas, 10-14 April 1972.
4. E. J. Seldin, "Stress-Strain Properties of Polycrystalline Graphites in
Tension and Compression at Room Temperature", Carbon, 1966, pp. 177-191.
5. H. S. Starrett and C. D. Pears, Probable and Average Properties of
ATJ-S(WS) Graphite, Southern Research Institute, AFML-TR-73-14, Volume 1,
February 1973.
6. S. A. Ambartsumyan, "The Axisymmetric Problem of a Circular Cylindrical
Shell Made of Material with Different Stiffness in Tension and Compression",
Izvestiya adademii nauk SSSR, Mekhanika, No. 4(1965), pp. 77-85, Translation
available from STAR as N69-I1070.
7. S. A. Ambartsumyan and A. A. Khachatryan, "Basic Equations in the Theory
of Elasticity for Materials with Different Stiffness in Tension and Com-
pression", Inzhenernyi zhurnal, Mekhanika tverdogo tela, No. 2(1966),
pp. 44-53. Translation available as LRG-67-T-12, The Aerospace Corporation
El Segundo, California.
118
............... .. .......... ... . ..... .. ... ... ..... ..... . ', ' i , , * 1.. .
8. S. A. Ambartsumyan, "Equations of the Plane Problem of the Multimodulus
Theory of Elasticity", Izvestiya akademii nauk armianskoi SSR, Mekhanika
Vol. 19, No. 2(1966), pp. 3-19. Translation available as LRG-67-T-14,
The Aerospace Corporation, El Segundo, California.
9. S. A. Ambartsumyan and A. A. Khachatryan, "Theory of Multimodulus
Elasticity", Inzhenernyi zhurnal, Mekhanika tverdogo tela, No. 6 (1966),
pp. 64-67. Translation available from STAR as N67-27610.
10. Farhad Tabaddor, "Two Dimensional Bi-Linear Orthotropic Elastic Materials,"
Journal of Composite Materials, October 1969, pp. 725-727.
11. Robert M. Jones, "Buckling of Circular Cylindrical Shells with Different
Moduli in Tension and Compression", AIAA Journal, January 1971, pp. 53-61.
12. S. A. Ambartsumyan, "Basic Equations and Relations in the Theory of
Elasticity of Anisotropic Bodies with Differing Moduli in Tension and
Compression", Inzhenernyi zhurnal, Mekhanika tverdogo tela, No. 3 (1969),
pp. 51-61. Translation available as LRG-70-T-l, The Aerospace Corporation,
El Segundo, California.
13. Robert M. Jones and Dudley A. R. Nelson, Jr., "A New Material Model for
Inelastic Biaxial Behavior of ATJ-S Graphite," AIAA Paper No. 74-396,
AIAA/ASME/SAE 15th Structures, Structural Dynamics, and Materials Conference
Las Vegas, Nevada, April 1974. Journal of Composite Materials, January 1975,
pp. 10-27.
14. Hong T. Hahn and Stephen W. Tsai, "Nonlinear Elastic Behavior of
Unidirectional Composite Laminae," Journal of Composite Materials,
January 1973, pp. 102-118.
15. James M. Whitney, Informal presentation at Air Force Workshop on Dura-
bility Characteristics of Resin Matrix Composites, Columbus, Ohio, 30
September - 2 October 1975.
119
16. James G. Crose and Robert M. Jones, SAAS III, Finite Element Stress
Analysis of Axisymmetric and Plane Solids with Different Orthotropic,
Temperature-Dependent Material Properties in Tension and Compression,
TR-0059($6816-53), The Aerospace Corporation, San Bernardino,
California, June 1975.
17. J. Jortner, Multiaxial Behavior of ATJ-S Graphite, McDonnell-Douglas
Astronautics Company - West, Huntington Beach, California, Air Force
Materials Laboratory Technical Report AFML-TR-71-253, December 1971.
18. C. D. Pears and H. S. Starrett, Polygraphites Subjected to Temperature
Stress Loadings, Southern Research Institute, Birmingham, Alabama,
Air Force Materials Laboratory Technical Report AFML-TR-73-59, March
1973.
19. H. S. Starrett and C. D. Pears, Probable and Average Properties of
ATJ-S (WS) Graphite, Southern Research Institute, Birmingham,
Alabama, Air Force Materials Laboratory Technical Report AFML-TR-73-14,
Volume I, February 1973.
20. Robert M. Jones, Nonlinear Multiaxial Modeling of Graphitic and
Carbon-Carbon Materials, Southern Methodist University, Dallas, Texas,
Air Force Materials Laboratory Technical Report AFML-TR-76-215,
December 1976.
21. Frank C.Weiler, DOASIS, A Computer Program for the Deformation Plastic,
Orthotropic, Axisynimetric (and Plane) Solution of Inelastic Solids,
Volumes I-III, Weiler Research, Inc., Mountain View, California, Air
Force Materials Laboratory Technical Report AFML-TR-75-37, September
1975.
22. B. W. Cole and R. B. Pipes, Filamentary Composite Laminates Subjected
to Biaxial Stress Fields, lIT Research Institute, Chicago, Illinois
120
and Drexel University, Philadelphia, Pennsylvania, Air Force Flight
Dynamics Laboratory Technical Report AFFDL-TR-73-115, June 1973.
23. H. S. Starrett, F. C. Weiler, and C. D. Pears, Thermostructural
Response of Carbon-Carbon Materials Under High Heat Flux Environments,
Southern Research Institute, Birmingham, Alabama, AFML-TR-74-232,
June 1975.
24. J. M. Whitney and A. W. Leissa, "Analysis of Heterogeneous Anisotropic
Plates' Journal of Applied Mechanics, June 1969, pp. 261-266.
25. Bo 0. Almroth, "Influence of Edge Conditions on the Stability of
Axially Compressed Cylindrical Shells',' AIAA Journal, January 1966,
pp. 134-140.
26. K. M. Kratsch, J. C. Schutzler, and D. A. Eitman, "Carbon-Carbon
3-D Orthogonal Material Behavior AIAA Paper No. 72-365, AIAA/
ASME/SAE 13th Structures, Structural Dynamics, and Materials Con-
ference, San Antonio, Texas, 10-14 April 1972.
27. J. K. Legg, H. S. Starrett, H. G. Sanders, and C. D. Pears, Mechan-
ical and Thermal Properties of Mod 3, Southern Research Institute,
Birmingham, Alabama, Air Force Materials Laboratory Technical Re-
port AFML-TR-73-14, Volume IV, September 1973.
28. James G. Crose, Structural Assessment of Carbon-Carbon Materials
for the Carbon-Carbon Assessment Program (CCAP), Prototype Develop-
ment Associates, Inc., Costa Mesa, California, PDA Report No.
1011-00-01, January 1974.
29. H. S. Starrett, F. C. Weiler, and C. D. Pears, Thermostructural
Response of Carbon-Carbon Materials under High Heat Flux Environ-
ments, Southern Research Institute, Birmingham, Alabama, Air Force
Materials Laboratory Technical Report AFML-TR-73-255, Volume I,
February 1974.
121

30. Eric M. Ross, The Carbon-Carbon Assessment Program, Air Force
Materials Laboratory Technical Report AFML-TR-74-39, September 1974.
31. J. K. Legg and C. D. Pears, Mechanical and Thermal Properties of
Mod 3a, A Pierced Fabric Carbon-Carbon Material, Southern Research
Institute, Birmingham, Alabama, Air Force Materials Laboratory
Technical Report AFML-TR-74-211, December 1974.
32. J. K. Legg, H. G. Sanders, H. S. Starrett, W. T. Engelke, and
C. D. Pears, The Carbon-Carbon Assessment Program, Supplement I
(Appendix A), Materials Characterization, Southern Research Insti-
tute, Birmingham, Alabama, Air Force Materials Laboratory Technical
Report AFML-TR-74-39, Supplement 1, January 1975.
33. J. K. Legg, H. G. Sanders, H. S. Starrett, W. T. Engelke, and
C. 0. Pears, The Carbon-Carbon Assessment Program, Supplement 5
(Appendix E), Failure Analysis, Southern Research Institute,
Birmingham, Alabama, Air Force Materials Laboratory Technical
Report AFML-TR-74-39, Supplement 5, January 1975.
34. H. S. Starrett and C. D. Pears, Elastic Compliances for ATJ-S
Graphite and Mod 3a Carbon-Carbon, Southern Research Institute,
Birmingham, Alabama, Air Force Materials Laboratory Technical
Report AFML-TR-74-271, February 1975.
35. James G. Crose, ASAAS, Asynmetric Stress Analysis of Axisymmetric
Solids with Orthotropic Temperature-Dependent Material Properties
that can Vary Circumferentially, TR-0172($6816-15)-I, The Aerospace
Corporation, San Bernardino, California, December 1971.
36. N. J. Pagano and J. C. Halpin, "Influence of End Constraint in the
Testing of Anisotropic Bodies7 Journal of Composite Materials,
January 1968, pp. 18-31.
122
p
37. Robert M. Jones, Mechanics of Composite Materials, McGraw-Hill, 1975.
38. Nicolae Iosipescu, "New Accurate Procedure for Single Shear Testing
of Metals',' Journal of Materials, September 1967, pp. 537-566.
1
* 123