5.5 north coast system - umgeni water...north coast system is located north of durban stretching...
TRANSCRIPT

304
5.5 North Coast System
5.5.1 Description
The North Coast System comprises of the Mdloti System, the Lower Mvoti System and the Lower Thukela System (Figure 5.57). These systems have been grouped together because of the current (and proposed) water resource interdependencies and infrastructure integration that is required to supply bulk potable water along the coastal strip of the North Coast region. The North Coast System is located north of Durban stretching along the coast from the Mdloti River in the south to the uThukela River in the north (Figure 5.57). It encompasses the Nonoti River catchment (U5), the lower Mvoti River catchment (U4), part of the Mdloti River catchment (U3) and the lower uThukela catchment (V5). The bulk supply infrastructure along the coastal strip is known as the North Coast Supply System (NCSS), and currently comprises two bulk supply systems, viz:
The Mdloti Supply System serving Phoenix, Verulam and La Mercy in northern eThekwini, a portion of rural Ndwedwe Local Municipality, the coastal towns along the Dolphin Coast and the low cost housing areas of Etete and Groutville; and
The Mvoti Supply System serving the town of KwaDukuza (previously known as Stanger). In addition to this bulk system, Umgeni Water implemented the Maphumulo Bulk Water Supply Scheme in May 2013 to eradicate some of the backlogs and alleviate the supply problems of the borehole schemes in the rural areas of iLembe DM. Umgeni Water further manages 32 smaller water supply systems for Ilembe District Municipality, some of which are shown in Figure 5.57. The Mdloti Supply System is presented in Figure 5.58. A schematic of the bulk water distribution is presented in Figure 5.59. Other schemes that supply potable water to people in the region are Umgeni Water’s Durban Heights WTP, eThekwini Municipality’s Tongaat WTP and Ogunjini WTP (previously owned by Umgeni Water) and Ilembe District Municipality’s Zinkwazi, Blythedale and Darnall schemes.

305
Figure 5.57 General layout of the North Coast Supply System.

306
Figure 5.58 Detailed layout of the North Coast Supply System.

307
Md
loti
Riv
er
Ø 250
Ø 3
00
Ø 3
00
Ø 7
00
Ø 3
50
Grange / Verulam
Waterloo /Phoenix
No
rth
Co
ast
PL I
No
rth
Co
ast
PL I
I
Stanger Tanks PS
Groutville
Etete
Ballito and Zimbali
300 BackfeedHazelmere to Bifurcation PL
La Mercy
Tongaat
Ndwedwe Retic
Ndwedwe Retic
Ndwedwe Retic
Kwahlope
Nyalinga and King Shaka
Airport
Ballito Lea
Shakas Rock
Umhlali
Shakas Kraal
Ø 450
Ø 3
50
Shakas HeadHugh Dent drive
Ø 250
Ø 2
00
Ø 1
000 –
800
Ø 5
00
Ø 3
50
Ø 500
Ø 3
75
Ø 3
00
Ø 3
50
Salt Rock PS
Ø 375
KwaDukuza (Stanger)
Avondale High
Ndwedwe Retic
Hazelmere
WTP
Hazelmere
Dam
Ndwedwe 1
Ndwedwe 2
Ndwedwe 3
Ndwedwe 4
Ndwedwe 5
La Mercy
Avondale
Honolulu
Mvoti Balancing
Mvoti
WTP
Mv
oti
Riv
er
Belvedere
1.94Ml
4Ml
2Ml
2Ml
4Ml
5.3Ml
5Ml
15Ml
8Ml
Umgeni Water Pipeline
Municipal Pipeline
Sales Off-take
Tunnel
New Infrastructure
All diameters in mm
All flows in Ml/day
LEGEND
Honolulu-Mvoti PS
Ø 8
00
Darnall/Zinkwazi
Ø 8
00
Figure 5.59 Schematic of the North Coast Supply System.

308
Hazelmere Water Treatment Plant
Hazelmere Dam is the source of raw water for the Hazelmere WTP (Figure 5.60, Table 5.52). The current yield of the dam, at a 98% assurance of supply, is 55 Mℓ/day. The WTP currently has a capacity of 45 Mℓ/day and receives raw water through a 600 mm diameter Asbestos Cement (AC) gravity pipeline and recently commissioned 800mm diameter steel pipeline routed from the dam to the WTP (Table 5.53).
Figure 5.60 Hazelmere Water Treatment Plant.
The treatment process at Hazelmere WTP consists of chemical dosing, clarification, filtration and disinfection. Sludge treatment is by means of gravity settling and a Centrifuge Sludge Dewatering System. The characteristics of the Hazelmere WTP are shown in Table 5.44.

309
Table 5.52 Characteristics of the Hazelmere WTP.
WTP Name: Hazelmere WTP
System: North Coast Supply System
Maximum Design Capacity: 45 Mℓ/day
Current Utilisation: 44 Mℓ/day
Raw Water Storage Capacity: 0 Mℓ
Raw Water Supply Capacity: 90.0 Mℓ/day
Pre-Oxidation Type: Prechlorination
Primary Water Pre-Treatment Chemical: Polymeric Coagulant
Total Coagulant Dosing Capacity: 15 l/hour
Rapid Mixing Method: Conventional Paddle Flash Mixer
Clarifier Type: Clari-Flocculator
Number of Clarifiers: 3
Total Area of all Clarifiers: 1469 m2
Total Capacity of Clarifiers: 45 Mℓ/day
Filter Type: Constant Rate Rapid Gravity Filters
Number of Filters: 9
Filter Floor Type Laterals without Nozzles
Total Filtration Area of all Filters 324 m2
Total Filtration Design Capacity of all Filters: 45 Mℓ/day
Total Capacity of Backwash Water Tanks: 180 m3
Total Capacity of Sludge Treatment Plant:
Capacity of Used Washwater System: 0.98 Mℓ/day
Primary Post Disinfection Type: Chloramination
Disinfection Dosing Capacity: 30 l/hr
Disinfectant Storage Capacity:
Total Treated Water Storage Capacity: 25 Mℓ

310
Table 5.53 Pipeline details: Hazelmere Raw Water Pipeline.
System Pipeline Name From To Length
(km)
Nominal Diameter
(mm) Material
Capacity* (Mℓ/day)
Age (years)
North Coast Hazelmere Raw Water Pipeline Hazelmere Dam Hazelmere WTP 2.42 600 AC 48.93 31
North Coast Hazelmere Raw Water Pipeline Hazelmere Dam Hazelmere WTP 2.42 800 Steel 90.0 0.3
* Based on a velocity of 2m/s.
Table 5.54 Reservoir details: Hazelmere WTP.
System Reservoir Site Reservoir Name Capacity
(Mℓ) Function
TWL (aMSL)
FL (aMSL)
North Coast Hazelmere WTP Hazelmere WTP 25 Balancing 47.0 42.0
311
Hazelmere/Phoenix Sub-System
The eThekwini area of Phoenix is supplied via the eThekwini owned and managed, 375 mm diameter Waterloo Pumping Main (Table 5.55). Water treated at Hazelmere WTP is pumped via the Umgeni Water Waterloo Pump Station (Table 5.56) situated at the Hazelmere WTP and sold to eThekwini Municipality at a metered point at the outlet of the pump station.
Hazelmere/Verulam Sub-System
The eThekwini area of Verulam is supplied via the eThekwini owned and managed, 500 mm diameter Grange Pumping Main (Table 5.57). Water treated at Hazelmere WTP is pumped via the Umgeni Water Grange Pump Station (Table 5.58) and sold to eThekwini Municipality at a metered point at the outlet of the pump station. In addition, the Grange Reservoir can be supplied from the Durban Heights WTP via eThekwini’s Northern Aqueduct Pipeline.
Hazelmere/Ndwedwe Sub-System
This sub-system supplies the rural communities of Ndwedwe by staged pumping from Hazelmere WTP through Ndwedwe Reservoirs 1, 2.1, 2, 3, 4 and 5 (Table 5.59, Table 5.60 and Table 5.53). Ndwedwe Reservoir 1 also feeds the southern areas of Tongaat through an emergency gravity line via Belvedere Reservoir. This emergency line is to augment the supply to the town of Tongaat when the Tongaat WTP (owned and operated by eThekwini Municipality) has insufficient water to supply the town’s needs. Ndwedwe Reservoir 1 is fed directly from Hazelmere WTP through a 500 mm diameter steel rising main (Table 5.60) from a dedicated pump station (Table 5.61) at the WTP. There are three pumps in the Hazelmere to Ndwedwe Reservoir 1 and Ndwedwe Reservoir 2 pump stations of which one or two pumps are called to duty depending on the system demand. Ndwedwe Reservoir 1 and Ndwedwe Reservoir 2 were upgraded through the construction of a second 2 Mℓ reservoir, at each site, during 2010/2011.

312
Table 5.55 Pipeline details: Waterloo Pumping Main.
System Pipeline Name From To Length
(km)
Nominal Diameter
(mm) Material
Capacity* (Mℓ/day)
Age (years)
North Coast Waterloo Pipeline Hazelmere WTP Waterloo Sales Meter 0.05 500 Steel 14.33 18
* Based on a velocity of 2m/s.
Table 5.56 Pump details: Waterloo Pump Station.
System
Pump Station Name
Number of Pumps Pump Description
Supply From
Supply To
Static Head (m)
Duty Head (m)
Duty Capacity (Mℓ/day)
Number of
Duty Pumps Number of
Standby Pumps
North Coast Waterloo Pump Station 1 KSB Omega 200-670 Hazelmere WTP Waterloo Reservoir 112.0 125 15.55
North Coast Waterloo Pump Station 1 Sulzer Bb HSC Hazelmere WTP Waterloo Reservoir 112.0 115* 2.80*
* Assumption
Table 5.57 Pipeline details: Grange Pumping Main.
System Pipeline Name From To Length
(km)
Nominal Diameter
(mm) Material
Capacity* (Mℓ/day)
Age (years)
North Coast Grange Pipeline Hazelmere WTP Grange Sales Meter 0.05 375 AC 14.30 23
* Based on a velocity of 2m/s.

313
Table 5.58 Pump details: Grange Pump Station.
System
Pump Station Name
Number of Pumps Pump Description
Supply From
Supply To
Static Head (m)
Duty Head (m)
Duty Capacity (Mℓ/day)
Number of
Duty Pumps Number of
Standby Pumps
North Coast Grange Pump Station 1 1 Sulzer BPK 35 Hazelmere WTP Grange Reservoir 68.9 96 11.52
Table 5.59 Reservoir details: Hazelmere/Ndwedwe Sub-System.
System Reservoir Site Reservoir Name Capacity
(Mℓ) Function
TWL (aMSL)
FL (aMSL)
North Coast Ndwedwe Ndwedwe 1 3.94 Distribution 209.8 205.8
North Coast Ndwedwe Ndwedwe 2.1 0.22 Terminal 238.6 234.6
North Coast Ndwedwe Ndwedwe 2 4.00 Distribution 318.4 314.4
North Coast Ndwedwe Ndwedwe 3 2.00 Distribution 417.4 413.4
North Coast Ndwedwe Ndwedwe 4 2.00 Distribution 530.9 526.9
North Coast Ndwedwe Ndwedwe 5 1.94 Terminal 661.8 657.2

314
Table 5.60 Pipeline details: Hazelmere/Ndwedwe Sub-System.
System Pipeline Name From To Length
(km)
Nominal Diameter
(mm) Material
Capacity* (Mℓ/day)
Age (years)
North Coast Hazelmere to Ndwedwe Reservoir 1 Hazelmere WTP Ndwedwe Reservoir 1 3.76 500 Steel 25.48 19
North Coast Ndwedwe Reservoir 1 to Ndwedwe Reservoir 2 Ndwedwe Reservoir 1 Ndwedwe Reservoir 2 6.93 350 Steel 12.49 18
North Coast Ndwedwe Reservoir 2 to Ndwedwe Reservoir 3 Ndwedwe Reservoir 2 Ndwedwe Reservoir 3 6.46 350 Steel 12.49 18
North Coast Ndwedwe Reservoir 3 to Ndwedwe Reservoir 4 Ndwedwe Reservoir 3 Ndwedwe Reservoir 4 1.78 300 Steel 9.17 18
North Coast Ndwedwe Reservoir 4 to Ndwedwe Reservoir 5 Ndwedwe Reservoir 4 Ndwedwe Reservoir 5 4.69 250 Steel 6.37 18
* Based on a velocity of 1.5m/s.
Table 5.61 Pump details: Hazelmere/Ndwedwe Sub-System.
System
Pump Station Name
Number of Pumps
Pump Description
Supply From
Supply To
Static Head (m)
Duty Head
m)
Duty Capacity (Mℓ/day)
Number of Duty Pumps
Number of Standby Pumps
North Coast Ndwedwe Pump Station 2 KSB WKLn 150/5 Hazelmere WTP Ndwedwe Reservoir 1 165.8 196 5.82
North Coast Ndwedwe Pump Station 1 KSB WKLn 160/5 Hazelmere WTP Ndwedwe Reservoir 1 165.8 196 5.82
North Coast Ndwedwe Reservoir 1 Pump Station 1 1 KSB WKLn 125/5 Ndwedwe Reservoir 1 Ndwedwe Reservoir 2 111.6 171 3.80
North Coast Ndwedwe Reservoir 2 Pump Station 1 1 KSB WKLn 125/5 Ndwedwe Reservoir 2 Ndwedwe Reservoir 3 102.0 149 3.34
North Coast Ndwedwe Reservoir 3 Pump Station 1 1 KSB WKLn 125/4 Ndwedwe Reservoir 3 Ndwedwe Reservoir 4 116.5 135 3.72
North Coast Ndwedwe Reservoir 4 Pump Station 1 1 KSB WKLn 125/5 Ndwedwe Res 4 Ndwedwe Res 5 133.9 177 3.34

315
Hazelmere/La Mercy/Avondale Sub-System
The Hazelmere/La Mercy/Ballito sub-system (Figure 5.58) consists of parallel pipelines, a 450 mm and 700mm diameter steel main respectively (Table 5.62), from Hazelmere WTP to a bifurcation point near the Tongaat Toll Plaza on the N2. One leg of the bifurcation supplies the coastal areas of La Mercy and Westbrook Beach via the 450 mm diameter steel pipeline (Table 5.62) to La Mercy Reservoir (Table 5.63). The other leg supplies the Avondale Reservoir (Table 5.63) in Ballito via a 700 mm diameter steel main (Table 5.54). The 700 mm diameter Bifurcation to Avondale (Table 5.62) leg has two off-takes that can supply the Mamba Ridge Reservoir (currently closed) and the reticulation to the Greylands/Frasers area.
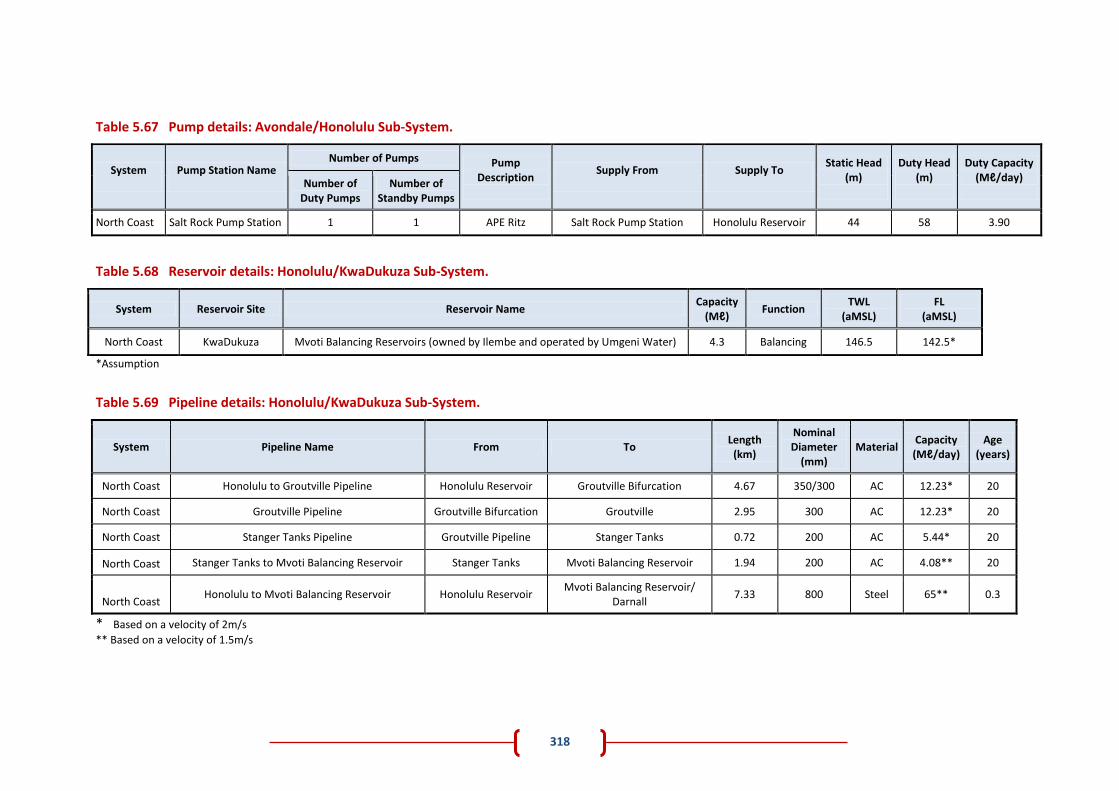
Avondale/Honolulu Sub-System
Avondale Reservoir (Table 5.63) supplies the areas of Zimbali and Simbithi to the south of Ballito through a series of gravity pipelines and reservoirs (Figure 5.58). There is a 300 mm gravity pipeline which also supplies the areas along the Hazelmere/La Mercy/Avondale subsystem’s 700 mm rising main (Table 5.66). In addition, Avondale Reservoir supplies water north, through the North Coast Pipeline I (NCP-1) (Table 5.65) to Shakas Rock, Chakas Head, Salt Rock, Sheffield Beach, and Tinley Manor. Up until December 2009, the option existed to boost pressure at the Salt Rock Pump Station (Table 5.67) and to then supply further to Tiffany, Umhlali Village, Shakas Kraal and the Honolulu Reservoir (Table 5.65) through the NCP-1. In 2009 Umgeni Water commissioned the North Coast Pipeline II (NCP-2) (Table 5.66) to supply additional water from Avondale to Honolulu Reservoir. This is a gravity pipeline with diameters ranging from 1 000 mm to 800 mm. Subsequent to the commissioning of the NCP-2, the Salt Rock Pump Station was decommissioned.
Honolulu/KwaDukuza Sub-System
The Honolulu Reservoir, which is fed from Avondale Reservoir, supplies the areas of Etete and Groutville and provides a supplementary feed to the Mvoti Balancing Reservoirs (Table 5.68) of KwaDukuza/Stanger via a 200 mm diameter rising main (Table 5.69). The pressure in this supplementary feed is boosted at the Stanger Tanks Pump Station (Table 5.70). An 800 mm diameter pipeline and a new pump station were commissioned in November 2013 to augment the supply of water from Honolulu Reservoir to the Mvoti Balancing Reservoirs. The pipeline and pump station will supply water from Honolulu to KwaDukuza until the commissioning of the Lower Thukela BWSS. Thereafter the supply to Mvoti Balancing Reservoirs will be from the Lower Thukela BWSS and the flow in the Honolulu to Mvoti Balancing Reservoirs Pipeline will be reversed to bring water from the northern areas of the NCSS to the south (Figure 5.59, Figure 5.69, Figure 5.70 and Figure 5.71).

316
Table 5.62 Pipeline details: Hazelmere/La Mercy/Avondale Sub-System.
System Pipeline Name From To Length
(km)
Nominal Diameter
(mm) Material
Capacity (Mℓ/day)
Age (years)
North Coast Hazelmere to Bifurcation Pipeline Hazelmere WTP La Mercy Bifurcation 10.86 450 Steel 20.64* 33
North Coast Hazelmere to Bifurcation Pipeline Hazelmere WTP La Mercy Bifurcation 10.86 700 Steel 49.88* 1.0
North Coast Bifurcation to Avondale Reservoir La Mercy Bifurcation Avondale Reservoir 9.87 700 Steel 49.94* 15
North Coast La Mercy Pipeline La Mercy Bifurcation La Mercy Reservoir 2.62 450 Steel 20.64* 15
North Coast Avondale to Ballito Reservoir Avondale Reservoir Ballito Reservoir 0.83 375 Steel 19.11** 26
North Coast 300 Backfeed Ballito Reservoir La Mercy Bifurcation 9.79 300 Steel 12.23** 33
* Based on a velocity of 1.5 m/s ** Based on a velocity of 2 m/s
Table 5.63 Reservoir details: Hazelmere/La Mercy/Avondale Sub-System.
System Reservoir Site Reservoir Name Capacity
(Mℓ) Function
TWL (aMSL)
FL (aMSL)
North Coast Ballito Avondale Reservoir 15.0 Distribution 137.4 130.6
North Coast Ballito Ballito Terminal Reservoir 3.0 Distribution 117.0 112.0
North Coast La Mercy La Mercy Reservoir 5.0 Distribution 156.0 152.0

317
Table 5.64 Pump details: Hazelmere/La Mercy/Avondale Sub-System.
System
Pump Station Name
Number of Pumps Pump Description
Supply From
Supply To
Static Head (m)
Duty Head (m)
Duty Capacity (Mℓ/day)
Number of Duty Pumps
Number of Standby Pumps
North Coast La Mercy Pump Station 1 1 Sulzer RPK 42 Hazelmere WTP Avondale Reservoir /La Mercy Reservoir 96 152 19.01
North Coast La Mercy Pump Station 1 Samco Hazelmere WTP Avondale Reservoir /La Mercy Reservoir 96 135 24.00
Table 5.65 Reservoir details: Avondale/Honolulu Sub-System.
System Reservoir Site Reservoir Name Capacity
(Mℓ) Function
TWL (aMSL)
FL (aMSL)
North Coast Shakas Kraal Honolulu Reservoir 8.0 Distribution 105.0 99.8
Table 5.66 Pipeline details: Avondale/Honolulu Sub-System.
System Pipeline Name From To Length
(km)
Nominal Diameter
(mm) Material
Capacity (Mℓ/day)
Age (years)
North Coast North Coast Pipeline 1 Avondale Reservoir Salt Rock Pump Station 7.01 350 Steel 16.65** 26
North Coast North Coast Pipeline 1 Salt Rock Pump Station Umhlali Off-take 3.10 300 uPVC 9.17* 26
North Coast North Coast Pipeline 1 Umhlali Off-take Honolulu Reservoir 6.90 250 uPVC 6.37* 26
North Coast North Coast Pipeline 2 Avondale Reservoir Honolulu Reservoir 17.65 800/1000 Steel 86.98** 4
* Based on a velocity of 1.5 m/s ** Based on a velocity of 2 m/s
318
Table 5.67 Pump details: Avondale/Honolulu Sub-System.
System
Pump Station Name
Number of Pumps Pump Description
Supply From
Supply To
Static Head (m)
Duty Head (m)
Duty Capacity (Mℓ/day)
Number of
Duty Pumps Number of
Standby Pumps
North Coast Salt Rock Pump Station 1 1 APE Ritz Salt Rock Pump Station Honolulu Reservoir 44 58 3.90
Table 5.68 Reservoir details: Honolulu/KwaDukuza Sub-System.
System Reservoir Site Reservoir Name Capacity
(Mℓ) Function
TWL (aMSL)
FL (aMSL)
North Coast KwaDukuza Mvoti Balancing Reservoirs (owned by Ilembe and operated by Umgeni Water) 4.3 Balancing 146.5 142.5*
*Assumption
Table 5.69 Pipeline details: Honolulu/KwaDukuza Sub-System.
System Pipeline Name From To Length
(km)
Nominal Diameter
(mm) Material
Capacity (Mℓ/day)
Age (years)
North Coast Honolulu to Groutville Pipeline Honolulu Reservoir Groutville Bifurcation 4.67 350/300 AC 12.23* 20
North Coast Groutville Pipeline Groutville Bifurcation Groutville 2.95 300 AC 12.23* 20
North Coast Stanger Tanks Pipeline Groutville Pipeline Stanger Tanks 0.72 200 AC 5.44* 20
North Coast Stanger Tanks to Mvoti Balancing Reservoir Stanger Tanks Mvoti Balancing Reservoir 1.94 200 AC 4.08** 20
North Coast Honolulu to Mvoti Balancing Reservoir Honolulu Reservoir
Mvoti Balancing Reservoir/ Darnall
7.33 800 Steel 65** 0.3
* Based on a velocity of 2m/s
** Based on a velocity of 1.5m/s

319
Table 5.70 Pump details: Honolulu/KwaDukuza Sub-System.
System
Pump Station Name
Number of Pumps
Pump Description
Supply From
Supply To
Static Head (m)
Duty Head (m)
Duty Capacity (Mℓ/day)
Number of Duty
Pumps
Number of Standby Pumps
North Coast Stanger Tanks 1 1 KSB WKLn 100/5 Stanger Tanks Mvoti Balancing Reservoir 93 115* 2.69*
North Coast Honolulu-Mvoti 1 1 KSB Omega 200-420A Honolulu Reservoir MvotiBalancing and Darnall 11 45 15
* Assumption

320
Mvoti Water Treatment Plant and Supply System
The primary source of potable water for KwaDukuza Town is the Mvoti WTP (Figure 5.61) situated on the banks of the Mvoti River. This run-of-river scheme has raw water abstracted from the Mvoti River and supplied to the WTP via submersible pumps and a short raw water rising main. The abstraction system at the Mvoti WTP consists of a diversion channel and lateral screen wells which supply water to the abstraction point. In addition seven boreholes situated on the banks of the river provide access to the aquifer below the coarse river sand. Potable water is pumped from the WTP through two potable water rising mains to the Mvoti Balancing Reservoirs and from there the water is gravity fed to Lot 16, Memory Loyds and Saunders Street (Figure 5.62). Potable water is then supplied via pumped systems and gravity systems from the Saunders Street Reservoir to the suburbs of KwaDukuza.
The Mvoti WTP and supply infrastructure is owned by Ilembe Municipality, and Umgeni Water is contracted to manage the plant and supply infrastructure up to the Saunders Street Reservoirs. The plant capacity is 14.5 Mℓ/day (including the pressure filters) and the average demand placed on the Mvoti WTP over the last 12 months is 16.3 Mℓ/day (Figure 5.68). A 2 Mℓ/day package plant has been installed at Mvoti WTP to sustain the growing demand. Umgeni Water Umgeni Water is currently implementing the Lower Thukela Bulk Water Supply Scheme (Section 7.7.4) as a long-term option to supply, inter alia, the town of KwaDukuza.
Figure 5.61 Mvoti Water Treatment Plant.

321
Figure 5.62 General layout of the Mvoti Sub-System.

322
The characteristics of the Mvoti WTP are shown in Table 5.71.
Table 5.71 Characteristics of the Mvoti WTP.
WTP Name: Mvoti WTP
System: North Coast Supply System
Maximum Design Capacity: 12.5 Mℓ/day including Pressure Filters
Current Utilisation: 17 Mℓ/day
Raw Water Storage Capacity: 0 Mℓ
Raw Water Supply Capacity: 16 Mℓ/day
Pre-Oxidation Type: Prechlorination
Primary Water Pre-Treatment Chemical: Polymeric Coagulant
Total Coagulant Dosing Capacity: 15 l/hour
Rapid Mixing Method: Conventional Paddle Flash Mixer
Clarifier Type: Clari-Flocculator
Number of Clarifiers: 3
Total Area of all Clarifiers: 407 m2
Total Capacity of Clarifiers: 12.5 Mℓ/day
Filter Type: Constant Rate Rapid Gravity Filters
Number of Filters: 12
Filter Floor Type Laterals without Nozzles
Total Filtration Area of all Filters 141 m2
Total Filtration Design Capacity of all Filters: 19 Mℓ/day
Total Capacity of Backwash Water Tanks: 120 m3
Total Capacity of Sludge Treatment Plant: None
Capacity of Used Washwater System: 0 Mℓ/day
Primary Post Disinfection Type: Chlorine Gas
Disinfection Dosing Capacity: 10 kgCl2/hr
Disinfectant Storage Capacity:
Total Treated Water Storage Capacity: 1.36 Mℓ
Maphumulo Water Treatment Plant and Supply System
The demand for water on the KwaZulu-Natal North Coast, and in particular the inland rural areas of the iLembe District Municipality, are forecast to increase significantly in the future. The requirement for potable water supply to rural backlog areas along the coastal belt has prompted Umgeni Water to implement a new potable bulk water supply scheme with a source on the iMvutshane River and supply to the iLembe District Municipality. Phase 1 of this scheme, known as the Maphumulo Bulk Water Supply Scheme (Figure 5.63 and Figure 5.64) was commissioned in May 2013 and the construction of Phase 2 is underway.

323
Figure 5.64 shows a schematic of the Maphumulo Bulk Water Supply Scheme, which includes an abstraction works, and subsequently a dam on the iMvutshane River, a treatment plant higher up and bulk rising and gravity mains to supply the water from the water treatment works into the Ilembe District Municipality’s greater Maphumulo area. The bulk infrastructure for Phase 1 includes the following:
Temporary raw Abstraction Works on the iMvutshane River at 255m mASL,
Temporary Abstraction Pumps Duty/Duty configuration 2 x 3 Mℓ/day
Temporary 355 DN uPVC raw water delivery main (length 400 m)
Raw Water Pump Station (@ 262m mASL)
Raw Water Pumps Duty/Duty/Standby configuration 3 x 3 Mℓ/day
400 DN grade X42 steel Raw Water Rising Main (length 1.850 Km)
6 Mℓ/day Water Treatment Works at 420m mASL
Extension and upgrade of Eskom supply lines to accommodate the pump electrical
load requirements.
4 km of 400 DN Grade X42 steel Potable Water Rising Main
The temporary abstraction works consists of a rock filled gabion basket structure with a concrete
base and reinforced concrete roof. This structure is constructed within the iMvutshane River course
some 50 metres upstream of the proposed dam wall. The structure has an internal dimension of 3.0
x 3.0 x 2.0 metre deep. Periodic maintenance (cleaning) will be required and this is considered to be
in keeping with the Value Engineering principles for this temporary structure.
Two 7.5 KW submersible pumps (duty/duty configuration) are provided in the abstraction structure
to pump raw water from the abstraction works to the raw water pumpstation located at an
elevation equal to the proposed iMvutshane Dam low-water draw off level @ 262 m mASL as a
temporary measure. These pumps are fitted with soft starters in order to reduce start up loads in
keeping with ESKOM requirements.
(This infrastructure will become redundant upon the commissioning of the iMvutshane Dam).
Raw water is treated at the Maphumulo WTP and pumped to a booster reservoir. From the booster
reservoir, potable water is pumped to the Maphumulo and the Nyamazane Reservoirs. The
Maphumulo Reservoir serves as a distribution reservoir for the town of Maphumulo and also
supplies the Masibambisane Reservoir, which in turn supplies Maphumulo Hospital Reservoir. The
Nyamazane Reservoir serves as a distribution reservoir, for the towns of Nyamazane and Maqumbi
(from Reservoir F). The Maqumbi Reservoir F in turn supplies both the Maqumbi Reservoir T and
Ashville Reservoirs.

324
Figure 5.63 General layout of the Maphumulo BWSS.

325
Figure 5.64 Schematic of the Maphumulo Supply System.
Maphumulo
WTP
Booster Reservoir
iMv
uts
ha
ne
Riv
er
Maphumulo Res
Masibambisane Res
Maphumulo Hosp
Nyamazane Maqumbi Res F
Ashville
Maqumbi Res T
Umgeni Water Pipeline
Municipal Pipeline
Sales Off-take
Tunnel
New Infrastructure
All diameters in mm
All flows in Ml/day
LEGEND
Masib
am
bis
an
e/
Kw
asiz
eb
an
tu/
Balc
om
Maqumbi
Map
hu
mu
lo
Ho
sp
ital an
d
Pris
on
Ash
ville
Maq
um
bi
Maphumulo
Sindi
Emtanjeni
Nyam
azan
e
Maphumulo Booster PS
Raw Water Pump
Station
Abstraction Pumps
Ø 4
00
Ø 400
Ø 3
00
Ø 3
50
Ø 3
00
Ø 1
60
Ø 2
00
Ø 1
10
Ø 355
Ø 350

326
Table 5.64 Pump details: Maphumulo BWSS.
System
Pump Station Name
Number of Pumps
Pump Description
Supply From
Supply To
Static Head (m)
Duty Head (m)
Duty Capacity (Mℓ/day)
Number of Duty
Pumps
Number of Standby Pumps
Maphumulo Temporary abstraction 2 0 (Current)
1 (Future) KSB – KRTE80-250 Imvutshane River Raw Water Pump Station 9 18 6
Maphumulo Raw water Pump Station 2 1 KSB – WKLN 125/6 Raw Water Pump Station Maphumulo WTP 160 178 6.9
Maphumulo WTW Pump Station 2 1 KSB – WKLN 125/6 Maphumulo WTW Booster Reservoir 166 190 7
Maphumulo Booster Pump Station 1 Booster Pump Station 2
2 1 KSB – WKLN 100/7 Booster Reservoir (PS 1) Maphumulo Reservoir 83 136 6.6
2 1 KSB – WKLN 100/3 Booster Reservoir (PS 2) Ngcebo Reservoir 47 66 3.6
Maphumulo Maphumulo Pump Station
2 1 KSB – WKLN 100/8
Maphumulo Reservoir Masibambisane Reservoir 124 154 6
Maphumulo Nyamazane (Ngcebo) Pump Station
2 1 KSB – WKLN 80/6
Nyamazane Reservoir Maqumbi Reservoir F 53 83 2.9
Maphumulo Maqumbi Pump Station 2 1 KSB – WKLN 65/9 Maqumbi Reservoir F Maqumbi Reservoir T 85 104 1.3

327
Table 5.72 Reservoir details: Maphumulo BWSS.
System Reservoir Site Reservoir Name Capacity
(Mℓ) Function
TWL (aMSL)
FL (aMSL)
Maphumulo Maphumulo Maphumulo WTW Res 0.5 Distribution 424.1 420.5
Maphumulo Maphumulo Booster Reservoir 0.3 Distribution 585.5 582.5
Maphumulo Maphumulo Maphumulo Reservoir 0.5 Distribution 668.2 664.5
Maphumulo Maphumulo Masibambisane Reservoir 1.0 Distribution/Terminal 793.5 789.5
Maphumulo Maphumulo Maphumulo Hospital 0.2 or 0.25 Terminal 750 ? Exist
Maphumulo Maphumulo Nyamazane Reservoir 1.0 Distribution 633.5 629.5
Maphumulo Maphumulo Maqumbi Reservoir F 0.5 Distribution 683 ? Exist
Maphumulo Maphumulo Maqumbi Reservoir T 0.5 Terminal 769 ? Exist
Maphumulo Maphumulo Ashville Reservoir 0.5 Terminal 440 ? Exist

328
Table 5.73 Pipeline details: Maphumulo BWSS.
System Pipeline Name From To Length
(km)
Nominal Diameter
(mm) Material
Capacity (Mℓ/day)
Age (years)
Maphumulo Temporary abstraction Imvutshane River Raw Water Pump Station 0.4 355 uPVC 12.8** 0.6
Maphumulo Raw Water Pipeline Raw Water Pump Station Maphumulo WTP 1.85 400 Steel 16.3** 0.6
Maphumulo Maphumulo Pipeline Maphumulo WTP Booster Reservoir 5.08 400/300 Steel 16.3** 0.6
Maphumulo Ngcebo Pipeline Booster Reservoir Ngcebo Reservoir T 3.535 350 Steel 12.5** 0.6
Maphumulo Maqumbi Pipeline Ngcebo Reservoir Maqumbi Reservoir F 10.15 300 Steel 9.16** 0.6
Maphumulo Maqumbi Pipeline Maqumbi Reservoir F Maqumbi Reservoir T 1.38 200 Steel 4.07** 0.6
Maphumulo Ashville Pipeline Maqumbi Reservoir T Ashville Reservoir 9 160 Steel 3.5* 0.6
Maphumulo Maphumulo Pipeline Booster Reservoir Maphumulo Reservoir 3.815 300 Steel 9.16** 0.6
Maphumulo Masibambisane Pipeline Maphumulo Reservoir Masibambisane Reservoir 2.25 300 steel 9.16** 0.6
* Based on a velocity of 2m/s
** Based on a velocity of 1.5m/s

329
The characteristics of the Maphumulo WTP are shown in Table 5.74.
Table 5.74 Characteristics of the Maphumulo WTP.
WTP Name: Maphumulo WTP
System: North Coast Supply System
Maximum Design Capacity: 6 Mℓ/day for Phase 1 and 12 Mℓ/day for Phase 2
Current Utilisation: 4 Mℓ/day
Raw Water Storage Capacity: 0 Mℓ
Raw Water Supply Capacity: 6 Mℓ/day for Phase 1 and 12 Mℓ/day for Phase 2
Pre-Oxidation Type: Prechlorination
Primary Water Pre-Treatment Chemical: Polymeric Coagulant
Total Coagulant Dosing Capacity: 15 l/hour
Rapid Mixing Method: Conventional Paddle Flash Mixer
Clarifier Type: Dortmund manual clarifiers
Number of Clarifiers: 4 for phase 1 increasing to 6 for Phase 2
Total Area of all Clarifiers: 345.6 m2
Total Capacity of Clarifiers: 12.5 Mℓ/day
Filter Type: Constant Rate Rapid Gravity Filters
Number of Filters: 5 for Phase 1 increasing to 8 for Phase 2
Filter Floor Type Laterals without Nozzles
Total Filtration Area of all Filters 80 m2
Total Filtration Design Capacity of all Filters: 12.5 Mℓ/day
Total Capacity of Backwash Water Tanks: 100 m3
Total Capacity of Sludge Treatment Plant: None
Capacity of Used Washwater System: 0 Mℓ/day
Primary Post Disinfection Type: Chlorine Gas
Disinfection Dosing Capacity: 10 kgCl2/hr
Disinfectant Storage Capacity:
Total Treated Water Storage Capacity: 0.5 Mℓ

330
5.5.2 Status Quo and Limitations
Hazelmere WTP Supply System
Figure 5.58 (schematically) illustrates the North Coast System in its current configuration and the current demands being placed on the network. This schematic should be referred to when reading this Section. The primary source of potable water supplied to the North Coast Supply System (NCSS) is from the 45 Mℓ/day Hazelmere WTP. Over the last 12 months the average demand placed on the Hazelmere WTP was 44.6 Mℓ/day with daily peaks as high as 53 Mℓ/day. With the demand nearing and regularly exceeding the capacity of the plant, the operation of the plant is difficult and routine maintenance on components of the plant is near impossible. As an interim measure to sustain the growing demand, a 5 Mℓ/day Package Water Treatment Plant was commissioned in February 2013. The historical demand placed on Hazelmere WTP is presented in Figure 5.65. It is evident from Figure 5.65 that the current demand (44.6 Mℓ/day) placed on the WTP, is near the capacity of the plant. The comparatively high supply from the WTP, when compared to the plant capacity and the expected increase in future demand, has necessitated the upgrading of the WTP from 45 Mℓ/day to 75 Mℓ/day (98% assured yield of the raised Hazelmere Dam). The demand forecast shown in Figure 5.65, includes the supply to Verulam (Grange) as it has not yet been transferred to Durban Heights WTP and eThekwini Municipality’s Northern Aqueduct. The high sales from the WTP between June 2013 and October 2013 are evidence that the Verulam (Grange) demand has not yet been fully transferred onto the Durban Heights WTP. In addition, a number of industrial developments have been implemented in the Greater Ballito area, and these have also contributed to the steady increase in the demand on Hazelmere WTP.
Figure 5.65 Water demand from Hazelmere WTP.

331
An analysis of daily historical production for the Hazelmere WTP over the past year (November 2012 to October 2013) is presented in Figure 5.66, and shows that for 97% of the time the WTP was being operated above the optimal operating capacity (80% of design capacity) and for 57% of the time the WTP was operated at above design capacity. The previous year Hazelmere WTP was operating above the optimal operating capacity for 97% of the time and 42% of the time above the design capacity. This indicates that a greater demand has been placed on the WTP due to a steep growth in development in the supply area of the Hazelmere WTP.
Mvoti WTP Supply System
The town of KwaDukuza is supplied from the Mvoti WTP via the Mvoti Balancing Reservoirs. The average demand placed on the WTP over the past year was 17.25 Mℓ/day. The design capacity of the WTP is 12.5 Mℓ/day. Four additional pressure filters have recently been installed and these have increased the capacity of the filters to 15.5 Mℓ/day, however, the 12.5 Mℓ/day capacity of the clarifiers still limits the plant capacity to 12.5 Mℓ/day. This is well below the demand and the system is difficult to manage and to maintain acceptable water quality standards. As an interim measure, to sustain the growing demand, a 2Mℓ/day Package Water Treatment Plant was commissioned in November 2012. An analysis of daily historical production for the Mvoti WTP over the past year (November 2012 to October 2013) is presented in Figure 5.67, and shows that for 97.54% of the time the WTP was being operated above the optimal operating capacity and for 91.8% of the time the WTP was operated at above design capacity. Supply from this plant can be augmented to a limited extent from the Hazelmere WTP when required.
0
20
40
60
0 20 40 60 80 100
Sale
s V
olu
me
(Ml/
day
)
Probability p occurrence (%) Design capacity
Figure 5.66 Analysis of historical production at Hazelmere WTP (November 2012 to October 2013).

332
Figure 5.68 Water demand from Mvoti WTP.
Figure 5.67 Analysis of historical production at Mvoti WTP (November 2012 to October 2013).
0
5
10
15
20
0 20 40 60 80 100
Sale
s V
olu
me
(Ml/
day
)
Probability p occurrence (%) Design capacity

333
iLembe DM has appointed a Professional Service Provider to implement a Water Demand Strategy in the Kwadukuza Municipal area and the municipality is confident that a reduction in water demand, by 1 Mℓ/day per year, can be achieved over the next two years .
Maphumulo WTP Supply System
The town of Maphumulo and surrounding areas are supplied from the recently commissioned Maphumulo WTP. The average demand placed on the WTP since it was commissioned was 3.7 Mℓ/day. The current design capacity of the WTP is 6 Mℓ/day with the aim of upgrading it to 12 Mℓ/day by the year 2017. An analysis of daily historical production for the Maphumulo WTP, since it has been commissioned, is presented in Figure 5.69, and shows that for 0% of the time the WTP was being operated above the optimal operating capacity and for 0% of the time the WTP was operated at above design capacity. Although, the demand is below the sound operating level of the WTP, the raw water abstraction pumps are only sized for 4 Mℓ/day.
Figure 5.69 Analysis of historical production at Maphumulo WTP (August 2013 to October 2013).

334
The initial demand (based on an estimate of 25 litres per person per day) at the commissioning phase, was projected at 2.7 Ml/day increasing to 4 Ml/day towards the year 2017. The phasing of the temporary raw water abstraction pumps was based on this projected demand. At the commissioning stage, the actual demand was measured at 3.7 Ml/day and the levels of the Maqumbi Reservoirs F and T could not be maintained. An investigation indicated that a high water loss, in the region of 75%, is prevalent in the Maqumbi area, and this places a constant peak loading onto the system. iLembe DM is currently implementing Water Demand Management initiatives to reduce the high Non Revenue Water in this area.
North Coast Supply System (NCSS)
The total current demand, together with a breakdown of sales throughout the NCSS, is presented in Figure 5.. There is potential for growth in the demand for water in the area currently supplied by the NCSS. Identified development nodes include:
The Phase 1 of the Cornubia Housing Development, planned by eThekwini Municipality near Verulam, has already commenced. This project has a projected growth over the next 30 years to 60 000 residential housing units and industrial and commercial sites.
The King Shaka International Airport, which became operational on the 1st May 2010. Demand from the airport, associated Dube Trade Port and other developments surrounding the area is expected to grow to greater than 20 Mℓ/day over the next five to ten years.
More than 70 development projects are proposed within the area covered by the NCSS. These include up market housing developments such as Blythedale and Royal Palm Estates, low cost housing developments such as the Etete Low Cost Housing Projects, the Driefontein Medium Income Housing Project and the Nonoti Land Restitution Project and commercial and industrial developments.
The current economic climate has resulted in a slowdown in the housing development sector. However, many of the developments are still likely to be implemented although the timing of them is expected to be delayed or extended. For this reason the five, ten, twenty and thirty year forecasts, are shown in Figure 5.70, Figure 5.71, Figure 5.72, Figure 5.73 and Figure 5.74. These figures are the same as those projected in the 2013 Infrastructure Master Plan.

335
8.8
7.5
Md
loti
Riv
er
0.4
4.4
2.7
7.1
1.0
0.9
8.1
1.0
9.4
0.3
45.7
6.0
Hazelmere
WTP
Hazelmere
Dam
Grange / Verulam
Waterloo /Phoenix
Ndwedwe 1
Ndwedwe 2
Ndwedwe 3
Ndwedwe 4
Ndwedwe 5
La Mercy
Avondale
Honolulu
Mvoti Balancing
Mvoti
WTP
No
rth
Co
ast
PL I
No
rth
Co
ast
PL I
I
Stanger Tanks PS
Groutville
Etete
Ballito and Zimbali
300 BackfeedHazelmere to Bifurcation PL
La Mercy
Belvedere
Tongaat
Ndwedwe Retic
Ndwedwe Retic
Ndwedwe Retic
Kwahlope / Res 5 Retic
Nyaninga and King Shaka
Airport
Ballito Lea
Shakas Rock
Umhlali
Shakas Kraal
2.4
0.5
17.3
Salt Rock PS
5.5
1.3
1.1
1.1
1.0
0.35
1.0
2.6
5
3.65
2.8
0.8
2.0
17.5
5.4
22.9
4.9
23.9
1.0
3.5
Ndwedwe Retic
1.0
Avondale High
2.2
0.5
17.3
Shakas HeadHugh Dent drive
KwaDukuza (Stanger)
Mv
oti
Riv
erUmgeni Water Pipeline
Municipal Pipeline
Sales Off-take
Tunnel
New Infrastructure
All diameters in mm
All flows in Ml/day
LEGEND
Tiffany
1.3
Honolulu-Mvoti PS
Darnall/Zinkwazi
0
Figure 5.70 Demand on the North Coast Supply System as at October 2013.

336
Figure 5.70 Five year demand forecast for the North Coast Supply System.

337
Figure 5.71 Ten year demand forecast for the North Coast Supply System.

338
Figure 5.72 Twenty year demand forecast for the North Coast Supply System.

339
Figure 5.73 Thirty year demand forecast for the North Coast Supply System.

340
5.5.3 Recommendations
Figure 5.69, Figure 5.70, Figure 5.71 and Figure 5.72 depict the potential for growth in the NCSS over the next five, ten, twenty and thirty years respectively. Also shown in these figures is the configuration of the system that is planned to supply this demand. The following section provides the details of how each subsystem of the NCSS will be affected by the growth in demand over the next thirty years and how the configuration of the system will have to be altered and projects implemented to supply the demand. The Water Reconciliation Strategy Study for the KwaZulu-Natal Coastal Metropolitan Areas, inter alia, looked at a strategy in which the water resources of the KwaZulu-Natal North Coast could be augmented in the future (DWA, 2009). The scenarios considered as future augmentation options included the following:
Raising of Hazelmere Dam and upgrade of the Hazelmere WTP (Section 7.7.1).
The Lower Thukela Bulk Water Supply Scheme (Section 7.7.4).
A new dam on the Mvoti River (e.g. the Welverdient or Isithundu Dam) with an associated regional WTP.
Results from this study show that the raising of the full supply level of Hazelmere Dam is the most cost effective and quickest means of augmenting the water resources on the North Coast. Following this, the Lower Thukela Bulk Water Supply Scheme (LTBWSS) would be the most practical scheme (and next quickest) to implement to supply additional water to the coastal region of the North Coast. This scheme would be required to augment the water supplies of the Hazelmere Supply System as the Hazelmere Dam raising on its own does not have sufficient resource to supply the demand in the short to medium term. It is anticipated that the conveyances of the Lower Thukela BWSS would be able to take water from the uThukela River down to the Ballito area via the North Coast Pipeline II (Figure 5.71, Figure 5.72, Figure 5.73 and Figure 5.74). DWA has confirmed that there is initially 20 million m3/annum (approximately 55 Mℓ/day), and up to a maximum of 40 million m3/annum (approximately 110 Mℓ/day) of firm yield available from the uThukela River close to its mouth. DWA’s Directorate National Water Resource Planning has agreed that this yield is available for abstraction, treatment and supply to the KwaDukuza and Mandini areas. This available yield is a combination of natural flows in the uThukela River and unused yield in dams in the upper uThukela catchment. The scheme that would take the longest to implement, and is most likely to be the most expensive, would be to develop a dam on the Mvoti River, at either Welverdient or Isithundu. This scheme would feed into the NCSS to augment the water supplies of the Hazelmere Supply System. The strategic development plan for the region, that would utilise the available resources from the Mdloti, Thukela and Mvoti systems in the most sustainable and cost effective manner, is presented below. Details are provided in the paragraphs that follow.
Initially supply the NCSS from Hazelmere Dam via the Hazelmere WTP.
Raise the full supply level of Hazelmere Dam to increase its firm yield and upgrade the Hazelmere WTP to supply up to 75 Mℓ/day to the NCSS. In addition to the upgrade of the WTP, pump stations and pipelines within the NCSS will have to be augmented to ensure the demand placed on the system does not exceed the capacity of the infrastructure. Pipelines that are constructed as part of this augmentation process will be built with the ability to allow

341
for bi-directional flow to ensure that in the future water can be brought south from a WTP situated at the uThukela River or the Mvoti River.
Construct an abstraction works on the uThukela River with a regional WTP and associated infrastructure to supply water south to KwaDukuza Local Municipality and north to Mandini Local Municipality. This system would link into the NCSS. The WTP would be constructed to initially serve 55 Mℓ/day and when demands dictate it would be upgraded to 110 Mℓ/day.
Develop water resource infrastructure on the Mvoti River, either at Welverdient or Isithundu with a regional WTP and associated supply infrastructure to further augment the NCSS. At some stage in the future, the long-term water demands to the north of the uThukela River may require the full (or majority of) allocation from the Lower Thukela WTP. In this scenario potable water may need to be supplied northwards from the NCSS (i.e. towards the Lower Thukela WTP) to meet the demands on the southern side of the uThukela River.
Develop a desalination plant to link into the NCSS as a long-term strategy that would be implemented as and when demands are predicted to exceed supply from the other systems. It should be noted that this intervention could be developed ahead of a regional scheme on the Mvoti River if either demands in the Mgeni System require it or if it proves of better financial value than the Mvoti scheme (Sections 1.6 and 2)
The infrastructure to be constructed, as detailed above, would incur high capital cost and as such the philosophy is to only develop the schemes as and when demand dictates. With the long lead time in feasibility and design of projects of this size and nature, the intention is to undertake the feasibility investigations and design of the schemes as early as possible and then to implement the schemes as and when demand dictates. The following sections detail the recommendations for development within each subsystem.
Hazelmere Water Treatment Plant
Growth in water demand at the Hazelmere WTP is expected to rise over the next five years to an amount greater than the capacity of the plant (Figure 5.68). The Mdloti system is constrained by the amount of water available from Hazelmere Dam. The current 98 % assured yield of the dam is 55 Mℓ/day. DWA are in the process of raising the height of the Hazelmere Dam wall through the construction of the “piano key” structure as per Midmar Dam. This project is expected to be completed in September 2017 and will increase the 98% assured yield of the dam to 75 Mℓ/day. In order to meet the projected growth in demand in the region, and to make use of the additional yield that will soon become available, Hazelmere WTP is being upgraded to a capacity of 75Mℓ/day (Section 7.25). This project will be completed by July 2014. The possibility of increasing the size of the works to 90 Mℓ/day (95% assurance of supply) will be investigated, if needed. The raw water pipeline between the dam and the WTP has been augmented with an 800 mm diameter steel pipeline to match the upgraded capacity of the WTP (Section 7.7.1). The increase in yield that will be available once the dam has been raised is reliant on the ecological reserve of the Mdloti River below the dam not being implemented immediately. The ecological reserve is to be implemented in a phased manner according to a DWA developed strategy. Since the growth in demand is expected to increase to greater than the 75 Mℓ/day assured supply from Hazelmere Dam, an additional source of water for supply to the NCSS will be required in the medium to long-term. The uThukela River has an available yield of 110 Mℓ/day and is considered to be the most feasible additional source of water to the system. Construction of the 110 Mℓ/day Abstraction Works and a separate contract for the construction of the 55 Mℓ/day Water Treatment

342
is currently in progress, which constitutes phase 1 of the LTBWSS. The anticipated completion date for Phase 1 is December 2016. Phase 2 of the LTBWSS is the upgrade of the WTP to a design capacity of 110 Mℓ/day and will be completed towards the end of 2017 (Section 7.7.4). Figure 5.71, Figure 5.72, Figure 5.73 and Figure 5.74 show the interlinking of the Lower Thukela Bulk Water Supply Scheme into the NCSS. This scheme has the potential to provide water as far south as Ballito or even La Mercy if required. Following the implementation of the LTBWSS, the next scheme to augment the North Coast water supply is on the Mvoti River. Various Mvoti options were assessed by DWA in conjunction with Umgeni Water and are discussed in Section 4.4.2. Factors influencing these assessments have changed subsequent to the study. It is now necessary to review the findings of the selection process in order to confirm the preferred development option before any planning investigations can be concluded. DWA plans to undertake a review of the previous study and to undertake any further detailed water resource development investigations that are required. Lagging slightly behind these investigations, Umgeni Water intends undertaking its own detailed investigations into the associated WTP and supply infrastructure to the NCSS. Figure 5.71 and Figure 5.72 show the interlinking of the Lower Mvoti Bulk Water Supply Scheme into the NCSS. This scheme will also have the potential to provide water as far south as Ballito or even La Mercy if required.
Hazelmere/Verulam Sub-System
The demand at Verulam (Grange) is expected to increase over the next 30 years as shown in Figure 5.69 and Figure 5.70. This growth is attributed to the development of Cornubia and the requirement to shed the Verulam demand back to Hazelmere WTP. This would reduce the impact that this demand has on the Durban Heights WTP and in particular eThekwini Municipality’s Northern Aqueduct. The sales point for this subsystem is at the Hazelmere WTP, and hence the only infrastructure that is affected by the growth in demand is the WTP itself and the Verulam Pump Station.
Hazelmere/Phoenix Sub-System
Natural growth in demand in Phoenix (Waterloo) is predicted as Figure 5.68, Figure 5.69, Figure 5.70 and Figure 5.71. The sales point for this subsystem is at the Hazelmere WTP and hence the only infrastructure that is affected by the growth in demand is the WTP itself and the Waterloo Pump Station.
Hazelmere/Ndwedwe Sub-System
Until recently, the comparatively high demand placed on the Ndwedwe Reservoirs 1 and 2, when compared with the size of the reservoirs, made the management of the pumping systems in the Ndwedwe Sub-system difficult. For this reason both the Ndwedwe Reservoir 1 and Ndwedwe Reservoir 2 were upgraded by constructing an additional 2 Mℓ reservoir at each site. This project was completed in early 2011. The pipeline infrastructure for this subsystem has sufficient capacity to supply the required demand over the next thirty years. Umgeni Water, in close liaison with iLembe District Municipality, conducted a reconnaissance study in 2007 to assess supplying Ndwedwe Local Municipality with potable water. A pre-feasibility and detailed feasibility level investigation is now being undertaken to further identify the most feasible option for supply. The completion of this study is scheduled for the end of March 2015.

343
In addition to this, the viability of an interim water supply solution to portions of Ndwedwe (KwaChili KwaShangase) from Ndwedwe Reservoir 5 was assessed. A hydraulic analysis has been conducted. The analysis indicate that it is feasible to supply the KwaShangase and KwaChilli areas from Reservoir 5, provided That the high water losses in the area can be reduced by 2 Mℓ/day. This volume will then be available to on-supply to the KwaShangase and Kwa-Chilli areas. Ilembe DM has appointed a Professional Service Provider to reduce the Non-Revenue Water in the Greater Ndwedwe area and to design and implement a pipeline from Reservoir 5 to gravity feed the above areas within a 7km radius.
Hazelmere/La Mercy/Avondale Sub-System
Supply to the Avondale Reservoir and the areas north of Ballito will increase to greater than 20 Mℓ/day over the next five years. This coupled with an increase in demand expected from the new KSIA will mean that the demand on the Hazelmere to Bifurcation Pipeline will be greater than the available capacity of the pipeline. The construction of a new bi-directional 700 mm diameter pipeline (Section 7.7.1) to augment the Hazelmere to Bifurcation pipeline has been completed in November 2012 and is operational. This line is linked to the existing 700 mm diameter pipeline from Bifurcation to Avondale and will become a dedicated supply to Avondale Reservoir. This line can be reversed to supply water from Avondale Reservoir to the northern suburbs of eThekwini Municipality if necessary. The existing 450 mm diameter Hazelmere to Bifurcation Pipeline is now dedicated to supply the Airport and La Mercy Reservoir.
Avondale/Honolulu Sub-System
Umgeni Water has recently completed the augmentation of the North Coast Pipeline. The 1 000 mm to 800 mm diameter North Coast Pipeline II (NCP-2) provides sufficient capacity between Avondale and Honolulu for supply over the next 30 years. This pipeline has been constructed to transport water in both a northerly and southerly direction. In Figure 5.68 the pipeline supplies water from the Hazelmere System north as far as KwaDukuza. In Figure 5.69, Figure 5.70 and Figure 5.71 the pipeline is reversed to supply water from the Lower Thukela BWSS to Avondale Reservoir and the southern areas of the NCSS. The North Coast Pipeline I (NCP-1) is now used to supply users along the pipeline from Avondale to Salt Rock in a northerly direction and is also used to supply south from Honolulu Reservoir to off-takes along the pipeline route including Shakas Kraal. The Salt Rock Pump Station will now only be used in emergency situations.
Mvoti Water Treatment Plant and Supply System
A 2 Mℓ/day package plant has been installed at Mvoti WTP to sustain the growing demand. The intention is for the Mvoti WTP to be handed back to iLembe DM once the Lower Thukela BWSS is able to provide water to the Mvoti Balancing Reservoirs.
Lower Mvoti Supply System
The North Coast is one of the fastest growing areas in Kwazulu-Natal due to the position of the King Shaka Airport and the development of the Dube Trade Port. These developments will spearhead residential and commercial developments in the respective WSA’s. The availability of a sustainable water supply system will fast track such developments. Umgeni Water is currently constructing the Lower Thukela BWSS to meet the future demands of the North Coast area. However, the limited raw water resource necessitates the need to investigate alternative sources. One such source is the lower regions of the Mvoti River.

344
As part of the long-term growth plan, Umgeni Water, will undertake a Detailed Feasibility study to assess the viability of a BWSS on the lower regions of the Mvoti River, named the Lower Mvoti BWSS. The Lower Mvoti BWSS will include a dam, a water treatment plant, pump stations and pipelines.