53372793 pioneer cement final
TRANSCRIPT

DEDICATION
We like to dedicate this report to all those people who want to
establish a strategic move to cater an opportunity in cement Industry.
We hope that they would be satisfied from our task and that would
help them in their knowing knowledge. We owe profound gratitude to
Prof. Asad Hameed for stimulating our creative abilities by assigning
this project. We want to give vote of thanks to Prof. Asad Hameed
for his guidance, lifting up the morale and solving our problems with a
smile on his face. All can say is, are always thankful to you Respected
Sir. Whatever we have learnt from him has put indelible impression on
our mind. It is our conviction that this learning experience will always
be a source of help in our practical life and professional career.

PREFACE
The objective of this project and analysis is to provide suitable
information about how to make strategies in Cement business. We
have a very good experienced while making this project. All the valid
information about the analysis and strategic moves was given on
different sites and in books which was also the major advantage.
Sometimes it looked we cannot do task, but there is always a hope
which takes us to the destiny. We thank ALLAH for giving us hope and
belief in our self.

ACKNOWLEDGEMENT
Praise is to ALLAH Almighty, the one testing us all at all times and
making decisions about what we don’t know and can’t know.
Writing this report appeared to be a great experience to us. It added a
lot to our knowledge while working on this report. If we say that this
report is one of our memorable and knowledgeable experiences in our
student life, then it would not be wrong.
May Allah Bestow His Blessings on All of Us.

DISCLAIMER
The purpose and scope of this information report is to introduce the subject matter and provide a general idea and information on the said area. All the material included in this document is based on data/information gathered from various sources and is based on certain assumptions. Although, due care and diligence has been taken to compile this document, the contained information may vary due to any change in any of the concerned factors, and the actual results may differ substantially from the presented information. Therefore, the content of this report should not be relied upon for making any decision, investment or otherwise. The prospective user of this report is encouraged to carry out his/her own due diligence and gather any information he/she considers necessary for making an informed decision.

PROJECT PROFILE
IntroductionCement industry is indeed a highly important segment of industrial sector that plays a pivotal role in the socio-economic development. Though the cement industry in Pakistan has witnessed its lows and highs in recent past, it has recovered during the last couple of years and is buoyant once again.
Purpose of the DocumentThis document is developed, to provide the Pioneer Cement with potential investment opportunity in setting up and operating a medium and large scale cement production plant.The document is designed to provide relevant details to facilitate the entrepreneur in making the decision by providing various technological as well as business alternatives. It is aimed at providing the entrepreneur with general advice and pointers to help in setting up a new Cement production unit. This information can be helpful for the existing businesses to expand and grow their operations further. The document also allows flexibility to change various project parameters to suit the needs of the entrepreneur.
Opportunity RationaleThe overall Cement market is a growing in Pakistan, relying heavily on the trend of construction on big projects like industrial estates, house building projects, and other infrastructure like Dams or development projects of government like building of schools, hospitals, etc. In Pakistan this business will pick up as development in infrastructure rises.

Industry ProfileA market is a group of buyers and sellers exchanging goods that are highly substitutable for one another. Markets are defined by demand conditions; they embody the zone of consumer choice for the goods. Product typeSince cement is a specialized product, requiring sophisticated infrastructure and production location. So, most of the cement industries in Pakistan are located near/within mountainous regions that are rich in clay, iron and mineral capacity. Structure of Cement industry in Pakistan is as such that there is not much substitutability to buyers. Which shows that the Cross elasticity of demand is negligible. Geographical AreaThe other factor i.e. geographic location also doesn’t affects a lot considering the flexibility of demand. Example can be taken from the fact that if DG cement in DG KHAN raises its price and MAPLE LEAF CEMENT in DaudKhel will raise its price to match DG cement’s. This is due to cartel of all of the cement manufacturers in Pakistan. Thus the customer has no choice at all to switch between two brands of cement. As the cement market is moving from a virtual 'sellers' market' to an over-supply situation, it is expected that when prices stagnate and profitability becomes a function of volume and economies of scale, location advantage and proximity to markets will become extremely important factors. At present the freight charges are a massive 20% of the retail prices. The plants located very close to each other and tapping the same market will have to expand their markets which will increase their freight expenses. Dandot, Pioneer, Maple Leaf and Garibwal are all located within a radius of 100 kilometers and are selling bulk of their production in the same areas and will thus face serious competition from each other. Understanding the DemandAfter the massive losses that the cement sector incurred during FY’96-03 period, the dynamics of the industry have entirely changed.Cement dispatches registered a healthy growth of 19.7% and 20.0% in FY'04 and FY'05 respectively.In FY'05, domestic dispatches increased 18.2% to 14.8m tons from 12.5m tons in FY'04 whereas exports also showed a growth of 40.0% to 1.6m tons in FY'05 from 1.1m tons in FY'04. In 9mths'06, domestic demand and exports maintained the momentum, grew 14.6% and 6.6% respectively.The upward trend in the cement demand is likely to continue in the next 3-4 years due to the better expected performance of the housing sector and the GoP's focus on infrastructure development- National Program for watercourses, construction of dams etc.

According to the “Medium Term Development Framework”, the government will gradually increase its allocation for the Public Sector Development Program from Rs272b in FY'05 to Rs597b in FY'10, which is likely to generate further demand in coming years.
During last five years, price of cement has risen at a very high pace. Cement industry faces an upward trend in prices and seldom goes down due to which high stocks may result in huge profits. Due to high demand, competition in the market is negligible

Increasing MarketDue to Governments aggressive policies regarding heavy capital expenditures for providing infrastructure and construction of dams etc. Moreover rehabilitation of cities destroyed by earthquake few years back in Pakistan, and for reliefe of victims of terrorism in Swat, Bonair, and other tribal areas, require heavy construction work to carry in near future. The client foresees drastic increase in the usage of cement products.The current government is promoting cement industry by allowing them to export cement to different countries which mainly includes:
India; China; Afghanistan; Iran; UAE, etc.

Company’s ProfileOur Vision & Mission:"Pioneer Cement Limited, is committed to make sustained efforts towards optimum utilization of its resources through good corporate governance for serving the interest of all its stakeholders."We at Pioneer Cement Limited are committed to provide our customers quality cement by producing it according to international and Pakistani standards. We have selected ISO 9002 based quality assurance system to ensure that our customers get quality cement according to their expectations.Our Philosophy:The Management of Pioneer Cement Limited are committed to maintaining this quality policy at all levels of the company. For this, as well as to achieve our corporate objectives, we all shall work as a team and pursue continuous improvement.Incorporation:Pioneer Cement Limited (PCL) was incorporated in Pakistan as a public company limited by shares on February 09, 1986. Its shares are quoted on all stock exchanges in Pakistan. The principal activity of the Company is manufacturing and sale of cementCore Objectives
Customers’ satisfaction Efficient deployment of resources Optimization of cost Research and development Maximization of profits Environmental protection
Core Values Professional ethics Respect and courtesy Recognition of human assets Teamwork Innovations and improvement
Business Ethics Transparency in transactions Sound business policies Judicious use of Company’s resources Avoidance of conflicts of interest Justice to all Integrity to all levels Compliance of laws of the land
Our Quality Policy
Pioneer Cement Plant is well managed by professionals in the cement filed. Stringent quality control procedures are applied for testing at every stage of production to achieve high quality cement.Its systems are also certified against ISO 9001:2000 QMS and ISO:14001:2004 for environmental protection.Policy StatementPioneer Cement Limited is committed to produce high quality cement as per International and Pakistan Standards. The top management will ensure that products of Pioneer Cement meet and exceed the product quality requirements to achieve customer’s satisfaction.The Company is committed to abide by all applicable legal and regulatory requirements and shall orient for continual improvement including prevention of pollution by establishing and monitoring of its Quality and Environmental objectives.The Chief Executive and management are committed to communicate and maintain this policy at all levels of the company and achieve continual improvement through teamwork.Brand of the Year 2006Pioneer Cement Limited markets its product under the brand name of “Pioneer Cement” and because of its quality which meets rather exceeds the expectations of the consumers, has been awarded as winner of the “Brand of the Year Awards 2006” in cement sector in National Category.Environmental ObligationsCement Industry is normally considered to be highly un-friendly to the Environment because of its inherent processes difficulties. However, with the development of technology, our modern plants are equipped with dust collecting equipments which help to reduce the pollution.Due to conversion from oil firing system to coal firing, there were chances that Pioneer Cement may suffer on account of pollution. The Management realized that for introducing Environmental ethics to meet the challenges, ISO 14001 is the need of the day. Therefore, the Management with the efforts of its employees succeeded in meeting the environmental objectives and targets after evaluating legal requirements, organizational aspects, technological options and other requirements.The Company acquired the services of Moody International for the assessment of audit. The audit has been carried out successfully and the auditors have recommended Pioneer Cement Ltd. for the Certification against ISO 14001 Environmental Management System. This shows the commitment of the Management of PCL towards environmental protection and prevention of pollution. PCL has been playing its role towards the development of a better society and a better future through continual improvement in the Environmental Management System.Performing Corporate Social Responsibility

Pioneer Cement Limited has been giving due importance to its social obligations particularly in areas surrounding the factory:
Primary Schools of Boys and Girls were constructed in 1995 in Chenki village and is being managed by the Company.
A dispensary was established near the factory site to cater the emergency requirements of the workers as well as villagers residing in the vicinity of the factory.
A mosque has been constructed in Chenki village and is being maintained by the Company.
Metal road of 15 km length was re-constructed, raised and widened to 30 feet for the residents of Jabbi and Chenki villages.
Donations were extended for construction of educational block in District Public School, Khushab.
Donations were made to employees living in earthquake affected areas and also to the victims of these areas.
PCL is playing an active role in Khushab District Industrial Association.
PCL is providing technical support to Vocational Training Institute, Quaidabad.
In addition to fulfilling social obligations in the adjoining areas, the Company also made donations to organizations like TB centre, Family Support Programmes, Emergency response centre and SOS schools.

Board of Directors
ChairmanMr. Manzoor Hayat Noon
Managing Director & CEOMr. Javed Ali Khan
Non-Executive DirectorsMr. K. Iqbal TalibMr. Adnan Hayat NoonMr. Salman Hayat NoonMr. Wajahat A. Baqai (NBP)Mr. Rafique Dawood (FDIB)
Independent Non-Executive DirectorsMr. Cevdet DALMr. Etrat Hussain RizviMr. Saleem Shahzada
Audit Committee
ChairmanMr. Rafique Dawood (FDIB)
MembersMr. Salman Hayat NoonMr. Adnan Hayat NoonMr. Etrat Hussain RizviMr. Wajahat A. Baqai (NBP)
Chief Financial OfficerMr. Muhammed Saleem
Company SecretarySyed Anwar Ali

STRATEGIC ANALYSISPEST analysisPolitical Factors
The government of President Asif Ali Zardari faces mounting
security, economic and political pressures that could cause it to fall
during 2009.
Zardari’s position will be weakened if the recent intensification of
US attacks into Pakistan continues under President-elect Barack
Obama.
The conditions attached to an IMF lending package will meet
fierce political resistance.
The economy will slow and unemployment will rise, potentially
bringing serious civil instability.
This will contribute to rising political opposition, which may
coalesce around the issue of deposed judges.
Economic Factors
Inflation is controlling by state bank and under strict eyes but unemployment rate is going up and up with the increase of level of poverty
Economic aspect of the crisis can’t be ignored as it is going to affect the region long after the conflict ended. IDPs had lost their crops of wheat and fruits. Plum, apricots, cherry, almond and peaches are popular fruits of North West region but they are short in the market this season, if available prices are high.
The IMF recommends that the fiscal deficit should be reduced to 4.7 percent of the GDP and electricity subsidies should be eliminated
Socio-Cultural Factors • As Pakistan is an Islamic country and people are very strict in case of Islam any thing against the philosophy of Islam on either print or electronic media are treated as against Pakistan.• Most of the people dislike anything extra-ordinary or something which sabotage their culture or subculture.

• In metropolitan cities women are doing work along with their other responsibilities but other than metropolitan cities it is difficult for women to convince their parents and spouses for work.Technological FactorsCompanies have technology with which they can compete in the Pakistan and now companies are investing in their infrastructure to not only expand but also to upgrade their existing structure.
Pakistan's economy with a GDP growth rate of 5.8% has attracted a foreign investment of US$ 5.15 billion in 2007-08.
Communications Technology sector of Pakistan has emerged as the fastest growing sector and is a major contributor to the GDP. The investor friendly policies of the Government have attracted US$ 1.63 Billion of foreign direct investment in the ICT sector.
CONNECT has established itself as an exclusive B2B event of ICT industry keeping in view the growing needs of IT and Telecom sector. CONNECT 2010 will reinforce its position as a unique opportunity for its participants to display and demonstrate wide array of latest technologies and business solutions to maximize market presence, establish new contacts and strengthen existing businesses in a highly interactive environment.

Competitive Analysis (Porter’s Five Forces) Rivalry among competing firms Strategies are successful when we have competitive advantage over the Rivals.Such as lowering prices, enhancing quality adding features, providing services & increasing advertisements.The intensity of Rivalry among competing firms increases competitionIn cement industry rivalry is high. Rivalry also increases when consumer can switch of brands easily, when barrier to leaving the market are high.Potential Entry of New CompetitorsWhenever new firms can easily entre a particular industry, the intensity of competitiveness among firms increases. Barrier to new entry are:
The lack of experience Need to gain technology & specialized know-how Strong customer loyalty Lack of access to raw material Tariffs Government regulatory policy Large capital requirements Lack of adequate distribution channel
Despite numerous barriers to new entry, new firms sometime entre industries with high quality products, lower prices & substantial marketing resources.
Substitutes availability The rate of availability of substitute of cement is very low. So lots of opportunity is there to entre into this industryBargaining power of suppliersFirm may pursue a backward integration strategy to gain control or ownership of suppliers. This strategy is effective when supplier are unavailable, too costly, or not capable of meeting a firm’s need on a consistent bases.In cement industry the supplier power is high.Bargaining power of consumersBargaining power of consumers also higher when the products being purchased are standard or undifferentiatedIncreases bargaining can be the most important force affecting competitive advantage. The power of bargaining increases:
If they can inexpensively switch to competitive brands If they are particularly important to the seller

If seller are struggling in the face of falling consumer demand for cement
If they are informed about seller’s products, prices & cost
EFA Matrix of Pioneer CementParticulars Weight Rating Weighted
ScoreOpportunities
1. Development in Real State Sector is accelerated.
.3 3 .9
2. Export opportunities in neighboring Countries e.g. Afghanistan, Iran, etc.
.3 4 1.2
3. Rebuilding of Northern Areas which are destroyed due to Earthquake & Military actions.
.08 3 .24
4. Construction of Roads .07 4 .285. Construction of Dams .06 3 .186. No Substitute is available .03 1 .03
Threats7. High Cost of Furnace Oil .4 4 .88. High Rate of Electricity .4 4 .89. High Taxes .06 3 .1810. Increase in Interest
Rates.06 3 .18
11. Import from China or India
.10 2 .2
12. Decrease in Disposable income
.08 2 .16
Total 1.00 4.11

IFE MatrixParticulars Weight Rating Weighted
ScoreStrengths
1.employee morals excellent .4 3 1.22.latest technology .08 2 .163.revenue per employee .03 3 .094.coordination among departments .04 2 .085.strong inventory management .05 1 .05
0.6Weaknesses
6.labour union problem .1 3 .37.late disbursement of salary cheques
.07 1 .07
8.low level of training department .09 3 .279.poor health facility .05 2 .1
10.discourge sexual harassment .09 2 .180.4
Total 1.0 2.5

TOS Analysis
Strengths – S Employee morals
excellent Latest
technology Revenue per
employee Coordination
among departments
Strong inventory management
Largest Financial Structure in Industry
Weaknesses – W Labor union
problem Late disbursement
of salary cheques Low level of
training department
Poor health facility Problem of sexual
harassment
Opportunities – O Development in
Real State Sector is accelerated.
Export opportunities in neighboring Countries e.g. Afghanistan, Iran, etc.
Rebuilding of Northern Areas which are destroyed due to Earthquake & Military actions.
Construction of Roads
Construction of Dams
SO StrategiesUse strengths to
take advantage of opportunities
Capturing Export Opportunity in Neighbouring
Countries through our Strengths
WO StrategiesOvercoming
weaknesses by taking advantage of opportunities
Threats – T High Cost of
Furnace Oil High Rate of
Electricity High Taxes Increase in Interest
Rates Import from China
or India
ST StrategiesUse strengths to
avoid threats
WT StrategiesMinimize weaknesses
and avoid threats

There is lots of opportunity for the expansion in cement sector. As there is much capacity to do so. We can export the cement and demand of cement is increasing gradually also. Development in real sector is also big opportunity for the expansion. If some internal weaknesses overcome by the management it will result in increase in revenues. Construction of Dams, Roads and infrastructure also push demand of cement upward.We have latest technology for the production and employees & managers working very well but we have to face some threats also like sharply increase in the cost of furnace oil & Electricity and unavailability of electricity. Some time due to shortage of cement Pakistan imports this product. So if the expansion in Pioneer cement is successfully started it will give big market share and revenues.

Space Matrix
FINANCIAL STRENGTH ( FS)RATINGS
Interpretation of rating
Debt -to-Capital ratio is low 5neither worst nor best
Return on assets is positive 5 good
Strong Net Income 4neither worst nor best
Cash Flows of Company 6 goodHigh Growth Pattern in respect of Financial Aspects 5 good Total 25INDUSTRY STRENGTH ( IS)Supportive Regulation provides freedom of expansion for Cement Industry 4 goodSupportive Regulation increases competition in Cement industry 3 NormalIndustry laws allows mergers and acquisitions 5 goodTotal 12
ENVIRONMENTAL STABILITY ( ES)(-1best and -6 worst)
Less developing country PEST unstable -5very bad to worst
Major business with few industries which are now depressed -3 badCement industry de-regulation has created instability -3 bad Total -11
COMPETITIVE ADVANTAGE ( CA)
Extensive production processing capability -1 BestSmaller companies becoming increasingly competitive -4
bad to Very Bad
The company has large martekt base -2 goodTotal -7

FS average 5more to wards best
IS average 4more towards best
ES average -3.66667more towards worst
CA average -2.33333neither worst nor best
Total of x-aixes (4+(-2.33)) = 1.67Total of y-aixes (5+(-3.67)) = 1.58

FS
+6
+1
+5
+4
+3
+2
-6
-5
-4
-3
-2
-1
-2 +1 +2 +3 +4 +5 +6
ES
CA IS
Conservative Aggressive
Defensive Competitive
-1
-6
-2
-3
-4
-5
-6 -5 -4 -3 -2 -1
ConclusionThe terminal ray of the resultant vector is in the 1st quadrant which means that Pioneer should pursue the aggressive strategies.


Quadrant IVConcentric diversificationHorizontal diversificationConglomerate diversificationJoint ventures
Quadrant IIIRetrenchmentConcentric diversificationHorizontal diversificationConglomerate diversificationLiquidation
Quadrant IMarket developmentMarket penetrationProduct developmentForward integrationBackward integrationHorizontal integrationConcentric diversification
Quadrant IIMarket developmentMarket penetrationProduct developmentHorizontal integrationDivestitureLiquidation
RAPID MARKET GROWTH
SLOW MARKET GROWTH
STRONGCOMPETITIVE
POSITION
WEAK COMPETITIVE
POSITION
Grand Strategy Matrix
Conclusion:

In Grand Strategy matrix the firm is in high growth market and in a good competitive position so the firm will pursue the strategies of Quadrant I as results are drawn by the Space Matrix.
1) Market development2) Market penetration3) Product development4) Forward integration5) Backward integration6) Horizontal integration7) Concentric diversification
Recommended StrategiesThe strategies recommended to Pioneer are:
1) Market Development2) Market Penetration in newly developed market
The Pioneer Cement can grow outside the border as the company has the required resources in bulk and have required competencies. The Pioneer Cement can enter the market by having the minimum charges as compare to new rivals and can penetrate into market by giving the supreme Quality cement.The markets available for entrance are Middle East, China, Iran and India. The further work is done by the help of Quantitative Strategic Planning Matrix to evaluate the best market to enter.

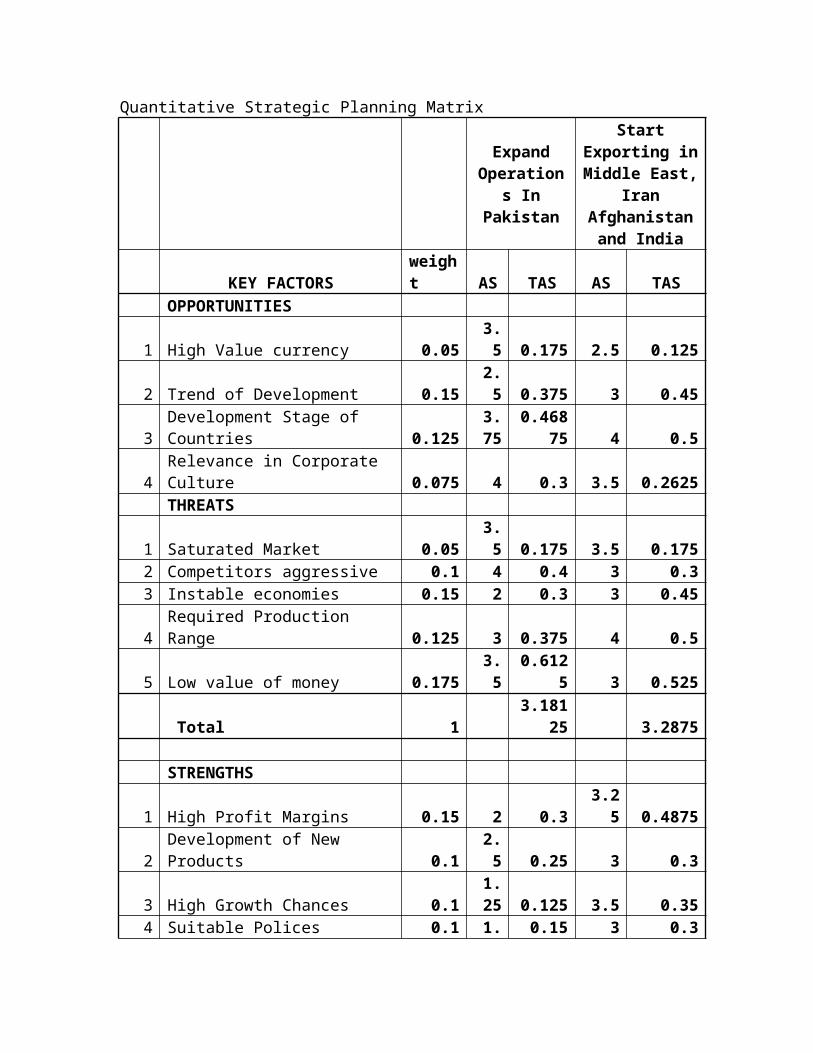
Quantitative Strategic Planning Matrix
Expand Operation
s In Pakistan
Start Exporting in Middle East,
Iran Afghanistan
and India
KEY FACTORSweight AS TAS AS TAS
OPPORTUNITIES
1 High Value currency 0.053.5 0.175 2.5 0.125
2 Trend of Development 0.152.5 0.375 3 0.45
3Development Stage of Countries 0.125
3.75
0.46875 4 0.5
4Relevance in Corporate Culture 0.075 4 0.3 3.5 0.2625
THREATS
1 Saturated Market 0.053.5 0.175 3.5 0.175
2 Competitors aggressive 0.1 4 0.4 3 0.33 Instable economies 0.15 2 0.3 3 0.454 Required Production Range 0.125 3 0.375 4 0.5
5 Low value of money 0.1753.5
0.6125 3 0.525
Total 1 3.181
25 3.2875 STRENGTHS
1 High Profit Margins 0.15 2 0.33.2
5 0.4875
2Development of New Products 0.1
2.5 0.25 3 0.3
3 High Growth Chances 0.11.25 0.125 3.5 0.35
4 Suitable Polices 0.11.5 0.15 3 0.3
5Pretax Profit is higher than Industry 0.15
2.25
0.3375 3 0.45
WEAKNESSES
1 Restructuring cost high 0.13.75 0.375 4 0.4
2 Export operation loosing 0.15 2 0.3 3 0.45

money
3The company is slow in globalization 0.15
2.25
0.3375 4 0.6
Total 1 2.175 3.3
Conclusion:The market of Asia looks promising to enter in due to some strong reasons. In Asia there is no major difference across the culture though some countries are entirely different from each other but in starting Pioneer should enter in countries like India which is a big market and there are no major corporate differences.In exporting there are many options. The Company may exploit great opportunities in Asia Pacific. The India, Iran and China may be good markets to explore.Summing Up the Report:ImplementationThe Pioneer cement company must re-structure the organization to enter into new markets. The structure of organization must be similar to the multi national companies to survive in the new market.The company has the adequate resources to enter into the international market. company has strong financial backup and having enough resources to enter into a new market with all new structure and culture.New standard of operations are required to enter into to new market.Evaluation and Control:The evaluation and control system required to be updated to implement the strategy because the firm is leaving its home country. New standard of information must be implemented and adequate measures must be applied to evaluate the strategies

MARKET RESEARCHEvent
According to the provisional numbers released by All Pakistan Cement Manufacturing Association (APCMA), cement sales remained muted to 21.8mn tons in the 9MFY09, despite 52% growth in exports, as local sales continue to disappoint declining by 17%. We strongly believe that March dispatches data will be revised upwards since it doesn’t contain the data of five plants (most notably Fauji and Mustehkam Cement).
Coal prices are down 27% QoQ in 3QFY09, while cement price are still buoyant. We expect margins of sector to improve substantially in 2HFY09.
Impact Local sales show growth of 11% MoM: For the month of
March, local sales increased by 11% MoM because of start of summer season in which local sales remain high due to increase in construction activities. Because of increase in capacities in North, utilization is low there when compared to South, where proximity to port is another reason for higher utilization.
Exports still growing: March exports increased by 9% MoM, to reach the 1mn tons mark for the second time in history. Looking at the trend exports are expected to remain steady atleast till FY09 end.
Pioneer Cement leads in QoQ sales comparison: In our FSL cement universe, Pioneer cement has registered a growth of 25% QoQ in 3QFY09 while Pioneer cement lags showing a decline of 25%. Lucky and D.G. Khan Cement have also shown good growth of 14% and 20%, respectively.
Coal prices show decline while cement prices remain steady: Coal prices on South Africa’s Richards Bay and Australia’s Newcastle in 3QFY09 are down by 27% QoQ & 21% QoQ, respectively. Currently coal price in RB index stands at $63/ton (-43% YoY). Currently cement prices are still in the range of Rs330-350/bag, which is very high considering that production costs are coming down and utilization level is below 80%.
Outlook & recommendation Local sales peak in summer season while exports are expected
to remain steady atleast till FY09 end. Looking at the decline in coal prices trend and buoyant cement prices, we expect 2HFY09 results to be exceptional.
From FY10 onwards, exports are projected to decrease which will lead to competition in local market amid increased plant capacities (especially in North). Local sales post FY09 are projected to show some improvement but the size of growth depends a lot on the size of PSDP in the FY10 budget.

Since most of the additional capacity has come in North we expect increased competition and prices cuts in that region first. However, North plants could benefit if some substantial aid is given for development spending (dams) in the upcoming Friend of Pakistan summit. Otherwise we advice investors caution on cement sector from a long term perspective because of overcapacity problems. In the sector we like Attock Cement (South location, strong brand name & low leverage) and Lucky Cement (increased presence in South, exports leader and moderate leverage).
Source: Foundation Securities
Our Internal Research And Development Department conducted a Market Research and gave us some valuable findings which are as follows:Export of Cement / ClinkerExport of cement/clinker showed a phenomenal increase of 125% to reach 450,659 tons as against 132,284 tons exported during last year. It comprised 157,228 tons cement and 293,431 tons clinker as compared with last year»s export of 130,284 tons cement and 2000 tons clinker. The Middle East has emerged as the largest potential buyer of clinker due to depleted Limestone reserves and idle installed grinding capacities. This growth was also backed by increased construction in India, Middle East and Afghanistan. India has emerged as a large potential importer of cement. Its retention price is better than other export markets which will help us improve our gross margin.We are confident that recovery phase for cement sector is just around the corner, as high demand period is about to begin. Cement dispatches for the first quarter signal strong demand growth in coming months, during 4QFY08. On the export front things are looking bright as the Company has received queries from new buyers from Russia, Central Asia, Madagascar and Nigeria, apart from strong demand from the conventional export markets. Key risks still remain such as frequent fallout and deterioration in country’s political/law and order situation, PSDP allocation and further increase in coal prices.

PROJECT INVESTMENT
Project InvestmentThis section will provide the total cost of the project;
Item Cost (PKR)
Machinery & Plant 100,000,000
Installation & Transportation 15,000,000
Factory Building Construction
35,000,000
Working Capital Requirements
38,250,000
Total 188,250,000
For the abovementioned project cost, is collected through IPO and a Syndicated loan.Fixed Cost Break-upOur fixed cost is comprises of rent of land for mill, maintenance of plant, administrative expenses, and other factory overheads.
Variable Cost Break-upOur variable cost is comprises of raw material, energy, and factory labor, and other cost concerned to the factory.
General Terms & Conditions Order to be booked at least one month before the supply. Irrevocable Letter of Credit will need to be opened by the
Importer’s Bank. 40% advance of contract value will be charged at the time of
booking the order, 30% at the time of delivering the order and the remaining 30% after 15 days of delivery.
50% of the payment to creditor will be made when the material received and remaining 50% will be paid through two post dated cheques of equal amounts after one month and second month respectively

Factory Area RequirementThe floor space needs to be carefully allocated to allow for maximum storage space for finished goods and equipment also allowing for easy handling. The allocation of space between the two sections would be as follows:
Details Area (Kanal)Storage of raw material
5.0
Storage of finished goods
3.0
Equipment 5.0Management Offices 1.0Total 14.0
Main OfficeEport division plant of Pioneer Cement Plant will be installed at Chenki at a distance of 40 Km from Khushab and 34 Km from Jauharabad where Pioneer has already has its factory. Its privileged location at central Punjab allows easy and fast Supply of raw material.
Human Resource RequirementThe human resource requirement for the factory and main office are as follows:
Designation /Type NumberExport Division Managers 2Accountant 3Asst. Accountant 5Supervisor 3Trained Factory Workers 50Helper to factory Workers 100Loader 50Office boy 5Driver 10

FINANCIAL ANALYSIS & KEY ASSUMPTIONS
The project cost estimates for the proposed export division setup have been formulated on the basis of discussions with relevant stakeholders and experts. The cost projections cover the cost of land, building, inventory, equipment including office furniture etc. The specific assumptions relating to individual cost components are given as under:
Revenue & Cost ProjectionsThe Sales are expected to increase by 10% every year while the cost of raw materials is assumed to increase due to inflation which is expected to be 5%. The annual increase in revenue is expected to result from a part increase in population increase and part increase in product price.
Depreciation on EquipmentDepreciation on Equipment is assumed 10% per annum based on the straight line method for the projected period.
Working CapitalIt is estimated that an additional amount of approximately PKR 38,250,000 will be required to meet the working capital requirements / contingency cash for the initial stages. The requirement is based on the rent, utilities and salaries expenses for at least four months.
TaxationThe tax rate applicable to corporate in Pakistan is 35% has been used for calculating income tax in this feasibility report.
Cost of CapitalWe gathered the information from the steel industry, and obtained industry beta-β, risk free rate and other relevant information. Considering all this, by using WACC, we calculate our cost of capital 15%.

PROJECT FINANCIAL ANALYSIS
Key Assumptions:
Initial Investment PKR 150,000,000Economic Life 10 yearsTax Rate 35%Cost of Capital 15%
Projected Sales (50kg Bag) 1,00
0,000
Dollar Price USD
4.50
Conversion Rate (Avg) Rs. Per $
85
Sales Price Per Unit PKR
383
Variable Cost Per Bag PKR
235 Fixed Cost PKR 100,000,000 Inflation rate 7%Inventory/sales 10%Growth in sales/year 10%
Moreover on the basis of these assumptions we can calculated the following factors:
Year 1 Year 2 Year 3 Year 4 Year 5PKR PKR PKR PKR PKR
Units 1,000,000 1,100,000 1,210,0001,331,00
01,464,10
0Unit price 382.50 409.28 437.92 468.58 501.38Unit cost 235.00 251.45 269.05 287.89 308.04

Pro-Forma Income StatementThis is the statement in which we measure performance over some period of time, usually a year. The general equation of income statement is given below.
Revenues – Expenses = Income
Now we are making our forecasting income statement on the basis of our project. And this income statement is for 5 years. Because our forecasting business is for five years so the income statement is given below.
Year 1 Year 2 Year 3 Year 4 Year 5 PKR PKR PKR PKR PKR
Sales382,500,00
0450,202,50
0 529,888,3
43 623,678,5
79 734,069,
688
Variable Cost235,000,00
0 276,595,00
0325,552,3
15 383,175,0
75 450,997,
063
Fixed Cost100,000,00
0 107,000,00
0 114,490,0
00 122,504,3
00 131,079,
601
Gross Profit47,500,000 66,607,500
89,846,028
117,999,204
151,993,024
Depreciation 15,000,000 15,000,000 15,000,00
0 15,000,00
0 15,000,0
00
EBIT32,500,00
0 51,607,50
0 74,846,0
28 102,999,
204 136,993,
024
Interest 14.5%6,452,175 7,984,762
11,028,400
12,972,702
-------------
Taxable Income 26,047,825 43,622,738 63,817,62
7 90,026,50
2 136,993,
024
Tax 35% 9,116,739 15,267,958 22,336,17
0 31,509,27
6 47,947,5
58
Net Income16,931,08
6 28,354,78
0 41,481,4
58 58,517,2
26 89,045,4
65

Pro-Forma Cash Flows
Operating Cash Flows: Operating Cash Flows are equal to:
Operating Cash Flows = EBIT + depreciation - Taxes
Now our operating cash flows are:
Year 1 Year 2 Year 3 Year 4 Year 5 PKR PKR PKR PKR PKR
Operating Cash Flows
38,383,261
51,339,542
67,509,858
86,489,929
104,045,465
Change in Net Working Capital:Our change in Net Working Capital is as Follows:
Year 0 Year 1 Year 2 Year 3 Year 4 Year 5
PKR PKR PKR PKR PKR PKRSales 382,500,
000450,202,50
0529,888,34
3623,678,5
79734,069,6
88NOWC (10% of sales)
38,250,000
45,020,250
52,988,834 62,367,858 73,406,969
--------
CF due to investment in NOWC)
(38,250,000)
(6,770,250) (7,968,584) (9,379,024)
(11,039,111)
73,406,969

Change in Net Capital SpendingThere is there is only one value of capital spending in 0 year.
So, our net cash flow will be
Net Cash Flow, 2009-2014
Year Net Cash Flows 2009 (188,250,000)2010 31,613,011 2011 43,370,958 2012 58,130,834 2013 75,450,818 2014 177,452,434
In this case we are investing PKR 188,250,000 today. And against it we are expecting to get five payments in next five years. And the payments will be PKR 31,613,011 in 2010, PKR 43,370,958 in 2011, PKR 58,130,834 in 2012, PKR 75,450,818 in 2013 and last payment will be PKR 177,452,434 in 2014. And for this we will calculate the net present value. Because if our net present value of our project is positive then this project will be acceptable otherwise it will be rejected. Here we are using 15% required rate of return.

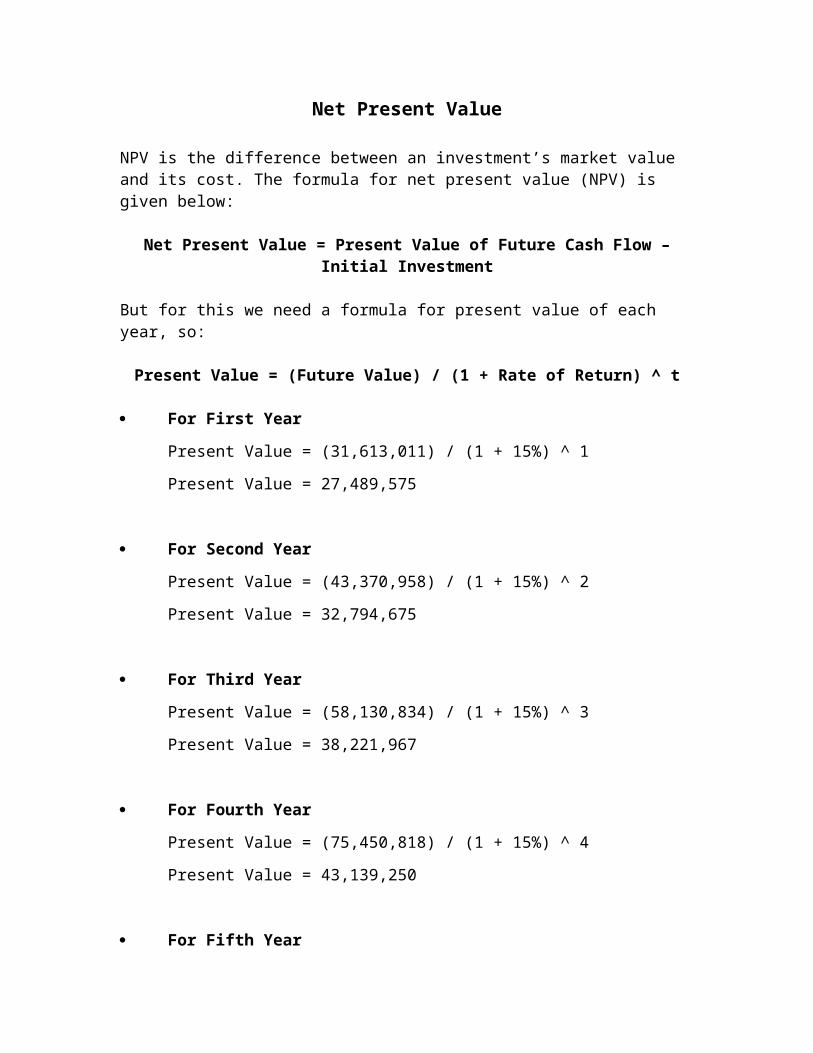
Net Present Value
NPV is the difference between an investment’s market value and its cost. The formula for net present value (NPV) is given below:
Net Present Value = Present Value of Future Cash Flow – Initial Investment
But for this we need a formula for present value of each year, so:
Present Value = (Future Value) / (1 + Rate of Return) ^ t
For First Year
Present Value = (31,613,011) / (1 + 15%) ^ 1
Present Value = 27,489,575
For Second Year
Present Value = (43,370,958) / (1 + 15%) ^ 2
Present Value = 32,794,675
For Third Year
Present Value = (58,130,834) / (1 + 15%) ^ 3
Present Value = 38,221,967
For Fourth Year
Present Value = (75,450,818) / (1 + 15%) ^ 4
Present Value = 43,139,250
For Fifth Year
Present Value = (177,452,434) / (1 + 15%) ^ 5
Present Value = 88,225,222
Years Present Values

‘PKR’
2010 27,489,575
2011 32,794,675
2012 38,221,967
2013 43,139,250
2014 88,225,222
Total 229,870,689
Now we able to find out the NPV, so
Net Present Value = 229,870,689 – 188,250,000
Net Present Value = 41,620,689 PKR
As we have mentioned that our initial cost is 188,250,000 so with the help of this we can see that our NPV is positive. So we can say that this project is acceptable.

Internal Rate of Return (IRR)
The internal rate of return means that the discount rate that makes the NPV of an investment zero.
For internal rate of return (IRR) it is necessary that NPV must be zero. So for IRR 0 = Present Value – Initial Investment
IRR can be calculated by using Spreadsheet Formula, or by using Financial Calculator, or by hit and trail method. We use the Spreadsheet Formula and calculate the IRR which is;
Rate of Return = 21.72%
This rate of return is internal rate of return (IRR). So this rate makes NPV is equal to zero. Now based on IRR rule, an investment is acceptable if the IRR exceeds the required return. It should be rejected otherwise. But in this project we can see that our IRR is 21.72% and our required rate of return is 15%. So we can say that this project is acceptable on the base of IRR rule, because our IRR is greater than our rate of return.
IRR > Required Return
21.72% > 15%

Payback Period
This method tells us that the amount that we have invested on our project, how many periods required to covering this amount. As we know that our initial cost is PKR 188,250,000. After the third year, the cash flows total PKR 133,114,803, so the project pays back between somewhere in fourth year. Because the accumulated cash flow for the fourth year is PKR 208,565,621, we need to recover PKR 55,135,197 in the fourth year. The fourth year cash flow is PKR 75,450,818, so we will have to wait 0.73 year to do this.
(55,135,197) / (75,450,818) = 0.73
So the payback period is thus 3.73 years. But on the payback rule, an investment is acceptable if its calculated payback period is less than some pre-specified number of years. And also we can say that this project is acceptable for us because our payback period is only 3.73 years. And we can cover our initial investment only in three years, eight months and twenty three days.
Discounted Payback Period
This method tells us that the amount that we have invested on our project, and how many periods required to covering this amount by discounting as the value of rupees fall. As we know that our initial cost is PKR 188,250,000. After the four years, the discounted cash flow is total PKR 141,645,467, so the project pays back between somewhere in fifth year. Because the accumulated cash flow for the fourth year is PKR 88,225,222 , we need to recover PKR 46,604,533 in the fifth year. The fifth year discounted cash flow is PKR 88,225,222 , so we will have to wait ..53 year to do this.
(46,604,533) / (88,225,222) = 0.53
So the payback period is thus 4.53 years. But on the payback rule, an investment is acceptable if its calculated discounted payback period is less than some pre-specified number of years. And also we can say that this project is acceptable for us because our discounted payback period is 4.53 years. And we can cover our initial investment only in four years six months and ten days.

Average Accounting Return
Another approach to making capital budgeting technique involves the average accounting return(AAR).The basic formula for calculating AAR is
Average Accounting Return = Average Net IncomeAverage book Value
= _46,866,003_ 188,250,000
ARR =49.79%
Based on the average accounting return, a project is acceptable it its average accounting return exceeds targeted average accounting return.
Profitability Index
Another tool used to evaluate project is called the profitability index (PI), or benefit cost ratio. This index is defined as the present value of the future cash flows divided by the initial investment.More generally, if a project has a positive NPV, then the present value of the future cash flows must be bigger than the initial investment. The profitability index would thus be bigger than 1 for a positive NPV investment and less than 1 for a negative NPV investment. The formula for calculating profitability index is given below.
Profitability Index = (Present Value of Future Cash Flow) / (Initial Investment)
So;
Profitability Index = (229,870,689 ) / (188,250,000)
Profitability Index = 1.22
Now we can see that our profitability index is 1.22 which is greater than 1. So this project is acceptable for us on the basis of profitability index.
Profitability Index > 11.22 > 1

Break Even Analysis
For thorough analysis of break even, we have calculated accounting break-even, cash break-even and financial break-even. Following table shows break-evens for all years at price PKR 383.00 per 50 kg Bag, with PKR 235.00 variable cost per 50 kg Bag and fixed cost PKR 100,000,000 (Inflation 7%) So:
Years1
(Bags)
2 (Bags
)
3 (Bags
)
4 (Bags
)
5 (Bags
)Accounting Break-Even
(FC+D)/(P-VC) 779661
773008
766790
760979
755549
Financial Break-Even
(FC)/(P-VC) 677966
677966
677966
677966
677966
Cash Break-Even (FC+OCF)/(P-VC) 938192
1003260
1077734
1156621
1216107
ExplanationAccounting break-even gives the sales level that result in zero project net income. This means that it gives that level of sale where EBIT will be zero. So it is calculated for every year as we can calculate EBIT for every year. It is very obvious from the figures that break-even occurs quite in time with respect to sales in units.Cash break-even gives the sales level that result in zero operating cash flows. This means that for calculating this break-even have to take OCF equal to zero. As this break-even depends only on the price, variable costs and fixed costs, so it can be calculated for each year. Same is true for cash break-even as it also occurs quite in time with respect to sales in units.Financial break-even is the sales level that results in zero NPV. This break-even is one for the whole project. Reason for this is we have different total project cash flows for our five year project. In order to get this break-even we must calculate OCF in calculating this break-even. It is very obvious from the table that break-even also occurs at a suitable position.
Operating LeverageOperating cost basically the degree to which firm or project relies on fixed assets. A firm with low operating leverage will have low fixed costs compared to a firm with high operating leverage. Generally speaking, projects with a relatively heavy investment in plant and equipment will have a relatively high degree of operating leverage. Such projects are said to be capital intensive.
Years 1 2 3 4 5Degree of Operating Leverage
1 + (FC) / (OCF)
3.61 3.08 2.70 2.42 2.26
So degree of operating leverage is given on above table. And All these calculations is find out with the help of following formula.
Degree of Operating leverage = 1 + (FC) / (OCF)

Pro-Forma Balance Sheet
year 1 year 2 year 3 year 4 year 5 PKR PKR PKR PKR PKR
Assets
Fixed Assets
20,000,000
20,000,000
20,000,000
20,000,000
20,000,000
Accumulated Depreciation
(2,000,000)
(4,000,000)
(6,000,000)
(8,000,000)
(10,000,000)
Net Fixed Assets
18,000,000
16,000,000
14,000,000
12,000,000
10,000,000
Current Assets
Cash
47,983,050
57,538,573
77,960,402
89,986,214
165,143,451
Inventory
18,660,075
22,376,112
30,317,934
34,994,639
-
Receivables
22,214,375
26,638,228
36,092,779
41,660,284
-
Other Assets
3,500,000
3,500,000
3,500,000
3,500,000
-
110,357,500
126,052,913
161,871,114
182,141,137
246,810,226
Liabilities & Equity Current liabilities
payables
27,343,000
32,821,165
46,348,446
53,656,455
-
short term loan
43,014,500
53,231,748
75,522,668
88,484,682
-
Equity

Owner's Equity
40,000,000
40,000,000
40,000,000
40,000,000
40,000,000
Retained Earning
16,931,086
28,354,780
41,286,458
58,322,226
206,810,226
110,357,500
126,052,913
161,871,114
182,141,137
246,810,226
Explanation
In this balance sheet we have forecasted this for five years. In which we have assets side as well as liabilities and owner’s equity side. And in assets side we have current side and net fixed assets. And net fixed assets we have depreciated the amount of net a fixed asset which has PKR 2,000,000. But in liabilities side we see that the total liabilities vary each year. And in owner’s equity will be PKR 40,000,000 each year.
Total Assets – Total Liabilities = Owner’s Equity

CONCLUSION
As we have mentioned that Pioneer opting for an entirely new
project and the are establishing export division. And we have
calculated all those calculations which can be helpful for company
which is entering in the new market. So we can say that this project is
acceptable on the basis of NPV, IRR, Payback Period, and Profitability
Index.
Also Strategic Analysis, Industrial analysis, and Market Research
support our decisions which describe that in current situations
prevailing in pakistan it is better to go for exploring the new markets.
So, we will be more oriented towards new strategic objective.