500µm edited version of conference ppt
TRANSCRIPT
500µm
Edited version of conference ppt
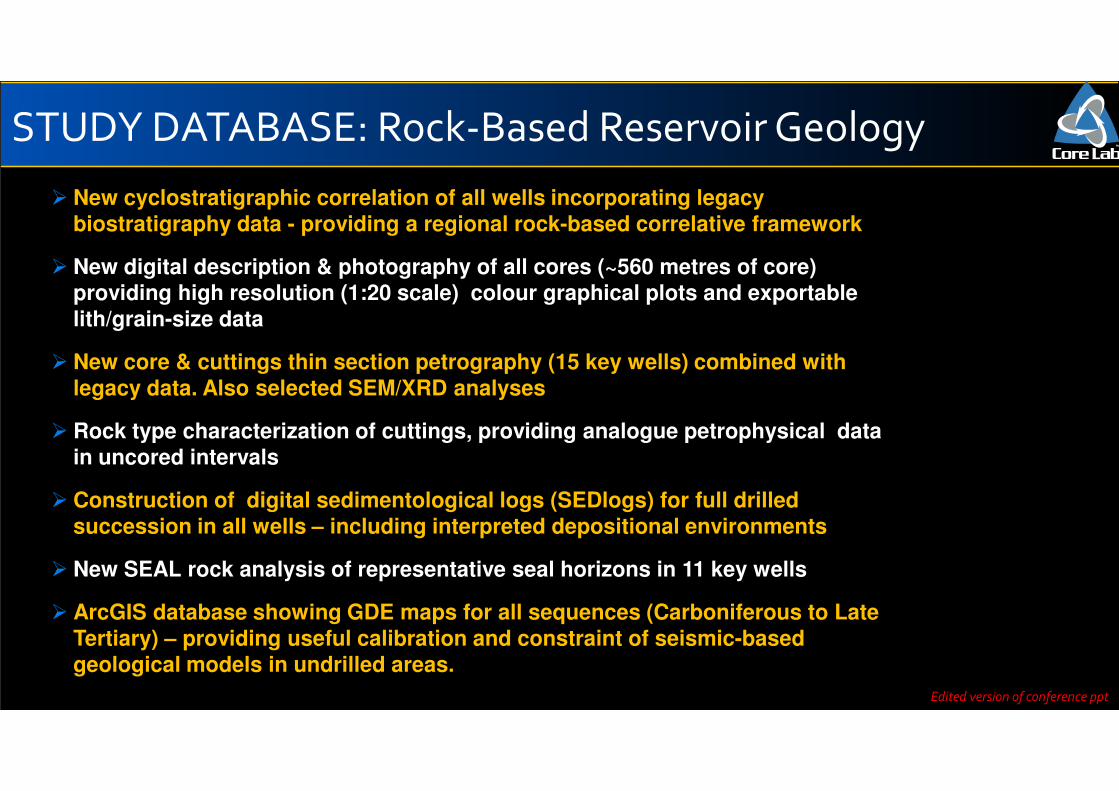
STUDY DATABASE: Rock-Based Reservoir Geology
� New cyclostratigraphic correlation of all wells incorporating legacy
biostratigraphy data - providing a regional rock-based correlative framework
� New digital description & photography of all cores (~560 metres of core) providing high resolution (1:20 scale) colour graphical plots and exportable
lith/grain-size data
� New core & cuttings thin section petrography (15 key wells) combined with
legacy data. Also selected SEM/XRD analyseslegacy data. Also selected SEM/XRD analyses
� Rock type characterization of cuttings, providing analogue petrophysical data
in uncored intervals
� Construction of digital sedimentological logs (SEDlogs) for full drilled
succession in all wells – including interpreted depositional environments
� New SEAL rock analysis of representative seal horizons in 11 key wells
� ArcGIS database showing GDE maps for all sequences (Carboniferous to Late
Tertiary) – providing useful calibration and constraint of seismic-based
geological models in undrilled areas.
Edited version of conference ppt
Seismic Line PW93-311 across the
northern boundary of Finnian’s Spur
SENW
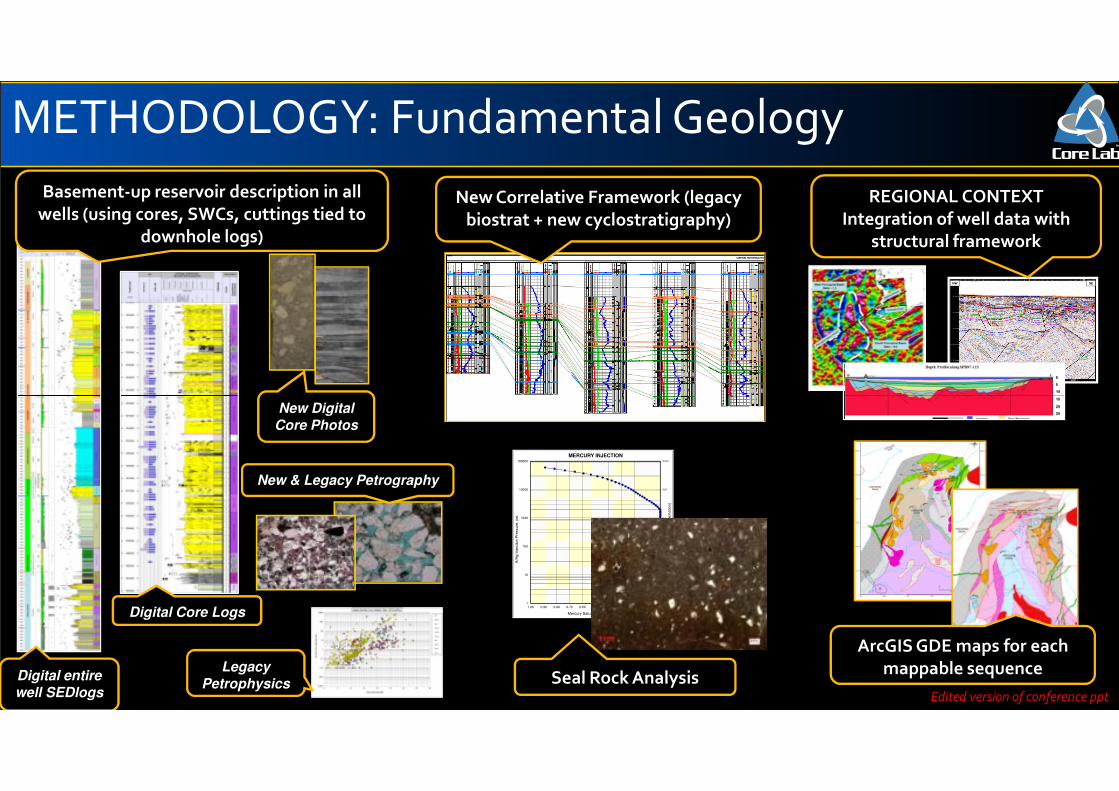
REGIONAL CONTEXT
Integration of well data with structural framework
Basement-up reservoir description in all
wells (using cores, SWCs, cuttings tied to downhole logs)
METHODOLOGY: Fundamental Geology
New Correlative Framework (legacy
biostrat + new cyclostratigraphy)
0.001
0.01
0.1
1
10
1001
10
100
1000
10000
100000
0.000.100.200.300.400.500.600.700.800.901.00
Po
re T
hro
at R
ad
ius, m
icro
ns (
clo
se
appro
xim
ation
)
A/H
g I
nje
ctio
n P
ressure
, p
si
Mercury Saturation, fraction of pore space
MERCURY INJECTION
ArcGIS GDE maps for each
mappable sequenceDigital entire
well SEDlogsSeal Rock Analysis
Digital Core Logs
New Digital
Core Photos
New & Legacy Petrography
Legacy
PetrophysicsEdited version of conference ppt
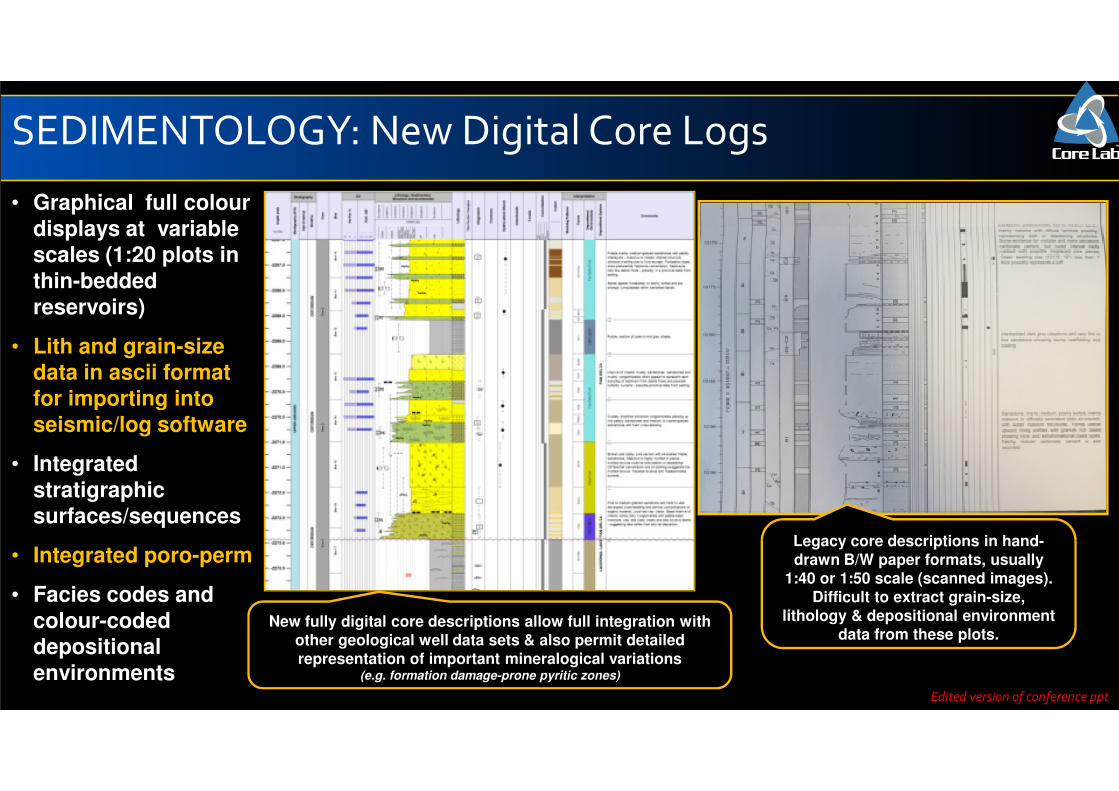
• Graphical full colour
displays at variable scales (1:20 plots in
thin-bedded
reservoirs)
• Lith and grain-size data in ascii format
for importing into
SEDIMENTOLOGY: New Digital Core Logs
for importing into
seismic/log software
• Integrated
stratigraphic surfaces/sequences
• Integrated poro-perm
• Facies codes and
colour-coded depositional
environments
Legacy core descriptions in hand-
drawn B/W paper formats, usually
1:40 or 1:50 scale (scanned images).
Difficult to extract grain-size,
lithology & depositional environment
data from these plots.New fully digital core descriptions allow full integration with
other geological well data sets & also permit detailed
representation of important mineralogical variations (e.g. formation damage-prone pyritic zones)
Edited version of conference ppt
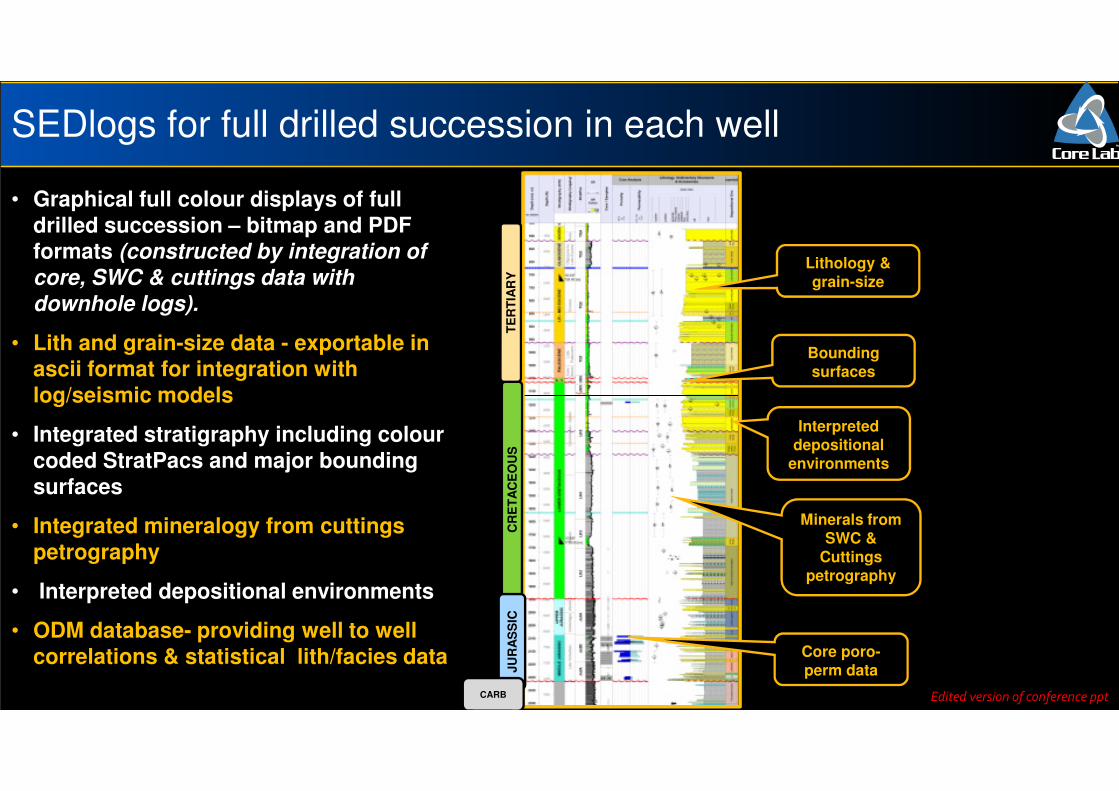
• Graphical full colour displays of full
drilled succession – bitmap and PDF formats (constructed by integration of
core, SWC & cuttings data with
downhole logs).
• Lith and grain-size data - exportable in ascii format for integration with
log/seismic models
SEDlogs for full drilled succession in each well
TE
RT
IAR
Y
Lithology &
grain-size
Bounding
surfaces
log/seismic models
• Integrated stratigraphy including colour
coded StratPacs and major bounding
surfaces
• Integrated mineralogy from cuttings
petrography
• Interpreted depositional environments
• ODM database- providing well to well
correlations & statistical lith/facies data
CR
ET
AC
EO
US
JU
RA
SS
IC
CARB
Interpreted
depositional
environments
Minerals from
SWC &
Cuttings
petrography
Core poro-
perm data
Edited version of conference ppt
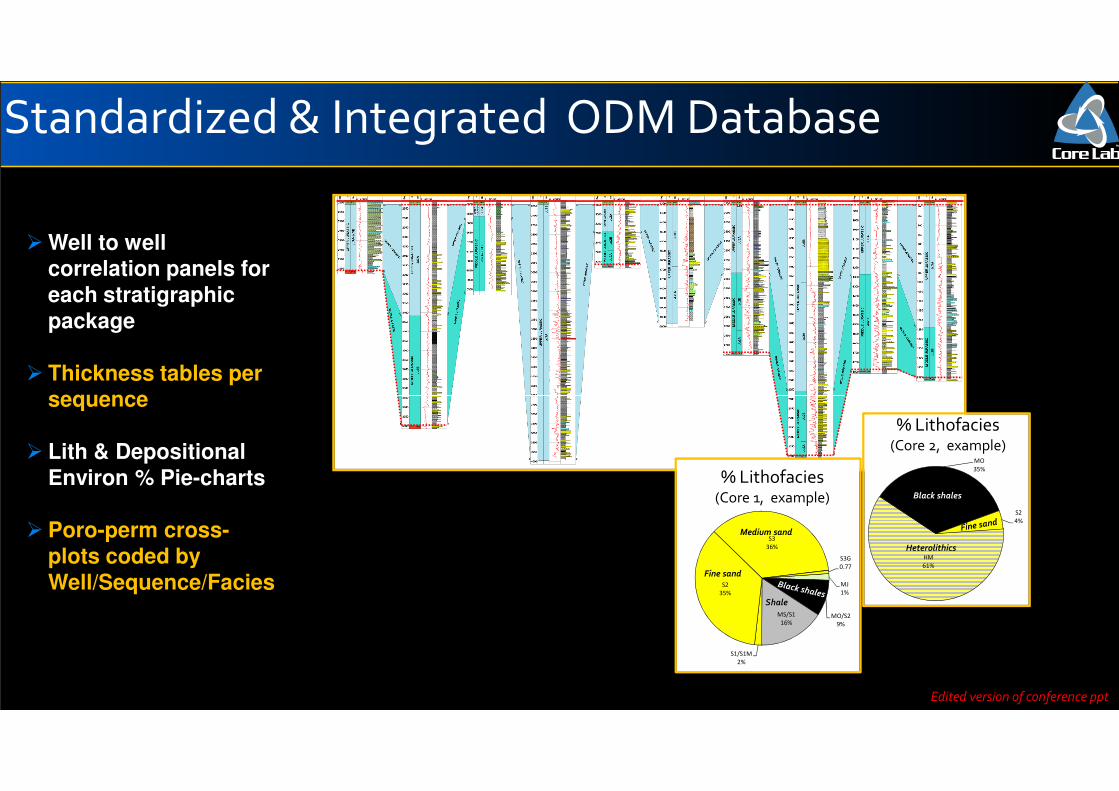
Standardized & Integrated ODM Database
CARBONIFEROUS –
� Well to well correlation panels for
each stratigraphic
package
� Thickness tables per sequenceCARBONIFEROUS –
LR JURASSIC
LOWER
CRETACEOUSUPPER
CRETACEOUS
sequence
� Lith & Depositional
Environ % Pie-charts
� Poro-perm cross-
plots coded by
Well/Sequence/Facies
HM
61%
MO
35%
S2
4%
Distribution of Lithofacies
in 35/8-1 Core 1
% Lithofacies(Core 2, example)
MJ
1%
MO/S2
9%
MS/S1
16%
S1/S1M
2%
S2
35%
S3
36%
S3G
0.77
Distribution of Lithofacies
in 35/18-1 Core 1% Lithofacies
(Core 1, example)
Edited version of conference ppt
Black shales
Heterolithics
Medium sand
Fine sand
Shale
Access to legacy data and sample material was provided by the DCENR
Particular thanks is due to Michael Hanrahan for all his efforts in
providing well datasets and also access to the core and cuttings material.
Thanks also to Core Lab colleagues:
ALICE ROOKS, JOSEPH WHITING, LAURA STEEL,
SIMON GREENFIELD, STEPHEN POOLE, SABAT PRASETYO,
GUY COMFORT, CORNEL COSOVANU, MARTIN BARON