5 safety - fmtn.org
TRANSCRIPT
Page | 62
5 SAFETY
5.1 OVERVIEW
Ensuring that roadways are safe and comfortable for all
users is an important part of local quality of life and
requires actions at the statewide, regional, and local
levels. The 2045 MTP considers locations with high
numbers and rates of crashes and proposes general
strategies to reduce traffic fatalities and serious injuries.
This MTP also considers severity of crashes, which is
an important supplemental factor to the rate of
crashes—in some cases interventions may seek to
reduce the severity of crashes but may not necessarily
reduce the number of crashes.
The intent of this analysis is to identify priorities and
inform investments across the FMPO region.
Across the US there is increasing awareness of the
issue of roadway safety, yet outcomes are worsening.
As VMT has risen nationally and statewide in recent
years, so too have the number of crashes and
transportation-related fatalities. According to the World
Health Organization, approximately 1.35 million people
die each year due to traffic crashes.10 In the US, almost
40,000 people lost their lives and an estimated 4.4
million people were seriously injured due to car-related
crashes in 2019.11 Traffic fatalities take a toll on
individuals and entire communities and there are
serious health-care costs and health consequences;
billions of dollars are spent each year due to health
costs from traffic crashes, air pollution, and physical
inactivity.12
Safety goals can be addressed through programs and
infrastructure design techniques that alter behavior in
positive ways. Many locations with high crash rates are
the result of roadway designs where travels speeds are
contextually incompatible with adjacent land use.
NMDOT and FMPO have both taken steps to address
this dynamic through design manuals that encourage
10 WHO Road Traffic Injuries. https://www.who.int/news-room/fact-sheets/detail/road-traffic-injuries. 11 NSC Fatality Estimates. https://www.nsc.org/road-safety/safety-topics/fatality-estimates 12 RWJF How Does Transportation Impact Health? https://www.rwjf.org/en/library/research/2012/10/how-does-transportation-impact-health-.html
Transportation and Public
Health
Our transportation systems play a
vital role in encouraging or
discouraging healthy behaviors
and the overall health of
communities. How we design our
streets matter. Traditionally,
streets were designed using a
vehicle-centric approach, resulting
in unsafe places to walk, bike, roll,
or cross the street and placing
bicyclists and pedestrians at
greater risk. However, designing
streets with people in mind
provides everyone the opportunity
to move safely and freely
throughout a community
regardless of mode, helps prevent
the incidence of motor vehicle
crashes, and supports healthier
communities.
In other words, transportation is a
social determinant of health. The
conditions in the environments in
which people live, learn, work, and
play that affect a wide range of
health and quality-of-life outcomes
(Healthy People 2020). Creating
safer transportation systems in
FMPO areas will help foster a
healthier population, society, and
workforce.
Page | 63
designs and vehicle travel speeds more appropriate for the roadway users and surrounding land
uses. These include the FMPO Complete Streets Design Guide and the NMDOT Road Diet
Design Guide.
5.2 FEDERAL AND STATEWIDE POLICIES AND INITIATIVES
5.2.1 Performance Targets Safety is a central goal among national and statewide transportation legislation and policy
initiatives. The MAP-21 federal transportation legislation established safety as one of its seven
National Goal Area while the FAST Act requires that performance targets be set at the
statewide and MPO levels in the more recent FAST Act.
In January 2020, the FMPO adopted a resolution to embrace the state established performance
measures, the NMDOT Safety Targets for 2020, as their commitment to improve transportation
safety. These annual targets are required by 23 CFR 490 and must be in accordance with the
final rule on the Highway Safety Improvement Program.13 It should be noted that the
performance targets were developed at a time when VMT and crash rates were expected to
increase annually. The NMDOT targets adopted by the FMPO are related to the following
measures:
• Number of Total Fatalities
• Number of Serious Injuries
• Fatalities per 100 million VMT
• Serious Injuries per 100 million VMT
• Number of Non-motorized Fatalities and Serious Injuries
5.2.2 Statewide Safety Programs and Initiatives NMDOT engages in various state-level planning and policy initiatives that coordinate safety
strategies. These programs also help NMDOT and agencies across the state access federal
funding for safety initiatives. In addition, NMDOT has developed new guidelines for roadway
design and project development that emphasize safety. This includes the NMDOT Road Diet
Design Guide, which encourages the reconfiguration of certain roadways to provide on-street
bikeways and reduce risks of rear-end collisions.
Strategic Highway Safety Plan (2016) The Strategic Highway Safety Plan (SHSP) coordinates safety-related programs and strategies
for reducing fatal and serious injury crashes on New Mexico roads. Highway Safety Improvement
Program (HSIP) funds may be used for projects that address needs and issues identified in the
SHSP. General priority areas include reducing unsafe driving behaviors including distracted and
13 23 CFR Part 490 Safety Performance Measurement Final Rule. https://safety.fhwa.dot.gov/hsip/rulemaking/
Page | 64
impaired driving and addressing locations with high numbers of crashes through design. The
SHSP is a requirement for the use of HSIP funding and is updated regularly.
Highway Safety Plan (2017) The Highway Safety Plan (HSP) reviews safety conditions and crash data across New Mexico
and provides data-driven strategies to address the safety issues on NM highways for motorists,
bicyclists, and pedestrians, and to reduce crashes resulting in fatalities of those users. The HSP
is required by the National Highway Traffic Safety Administration (NHTSA) and enables NMDOT
to access funds for safety-related programs. Strategies in the HSP for increasing safety include
educational efforts to increase safe driving habits and create awareness of the presence of non-
motorists. Notable among NMDOT programs and campaigns are the ENDWI and DNTXT
initiatives and the Look for Me campaign to raise motorist awareness of pedestrians and bicyclists.
Pedestrian Safety Action Plan NMDOT is currently developing a Pedestrian Safety Action Plan that identifies policies and
strategies at the statewide level to address the high pedestrian fatality rates and create safer
conditions along roadways across New Mexico. Outreach and plan development are expected
to take place over the course of 2020 and early 2021.
5.3 CRASH ANALYSIS
5.3.1 Statewide and Regional Conditions Safety strategies and policy initiatives should respond to identified safety concerns. Crash rates
in combination with crash severity data are commonly used to assess roadway safety and
determine locations with the greatest safety concerns. This plan considers summary data
provided by NMDOT and analyzes individual crash locations across the FMPO region from
2013 to 2017 to gain an understanding of safety issues and to help identify policy priorities and
potential transportation investments.
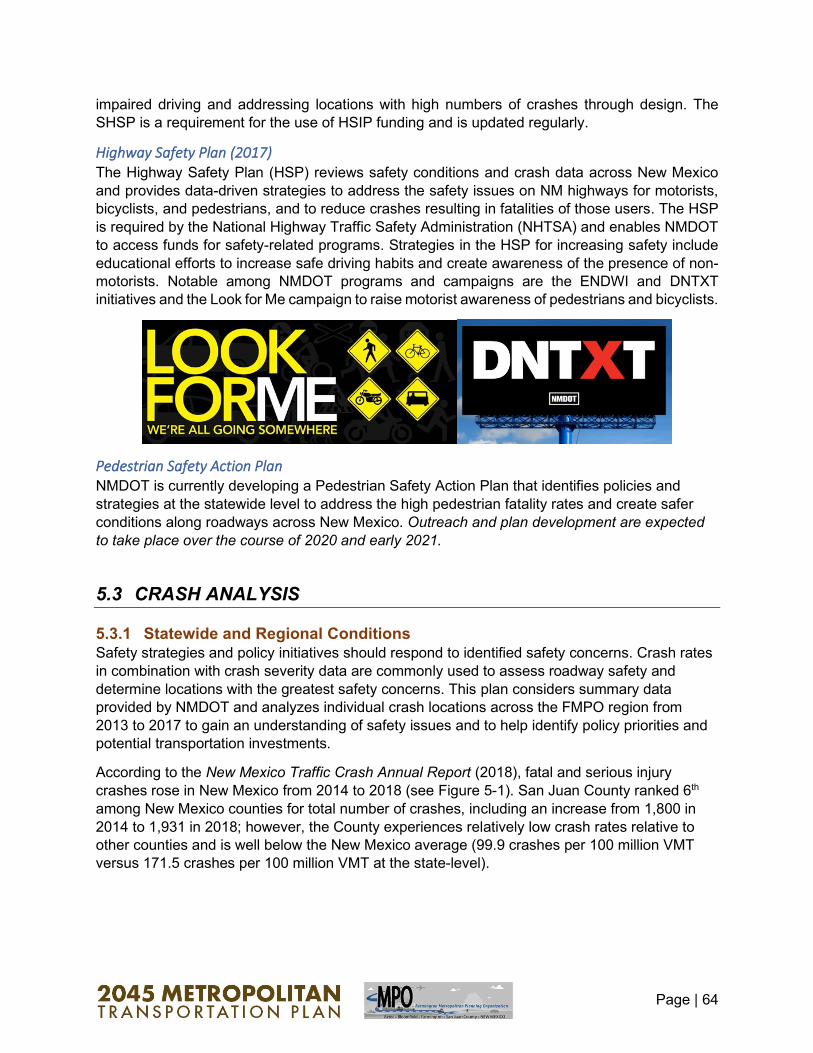
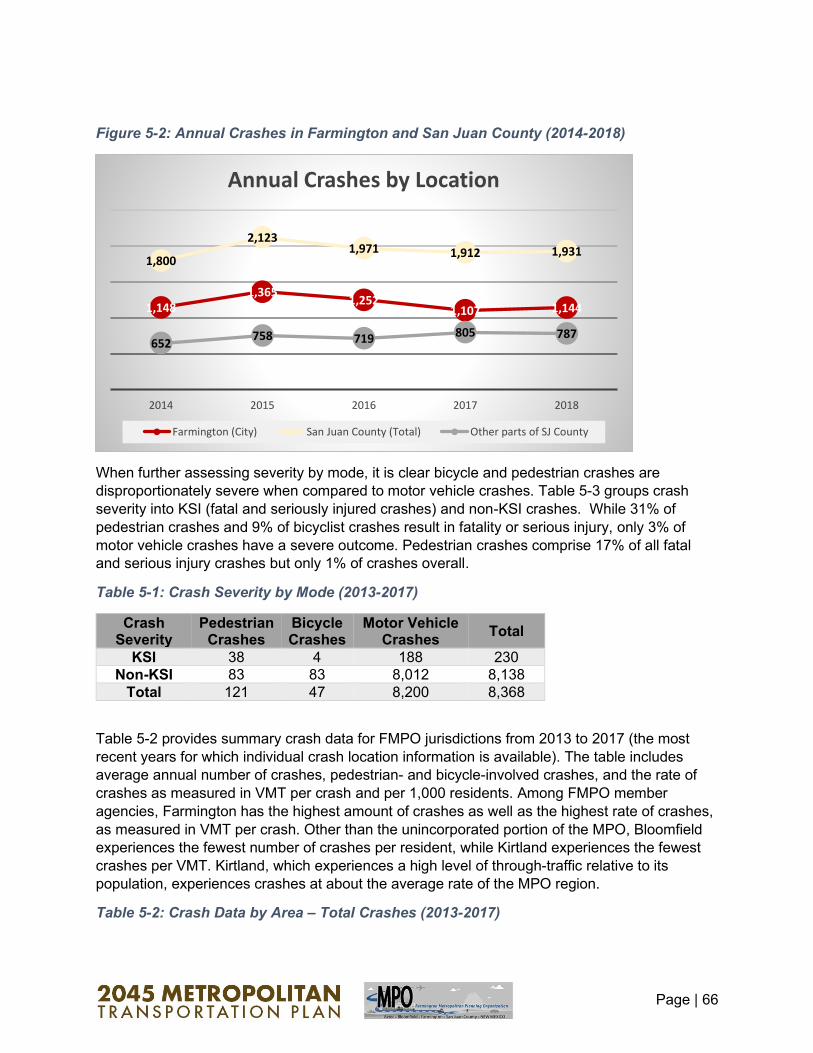
According to the New Mexico Traffic Crash Annual Report (2018), fatal and serious injury
crashes rose in New Mexico from 2014 to 2018 (see Figure 5-1). San Juan County ranked 6th
among New Mexico counties for total number of crashes, including an increase from 1,800 in
2014 to 1,931 in 2018; however, the County experiences relatively low crash rates relative to
other counties and is well below the New Mexico average (99.9 crashes per 100 million VMT
versus 171.5 crashes per 100 million VMT at the state-level).
Page | 65
Figure 5-1: Statewide Crash Data (2014-2018)
Due to its high concentration of economic activity and population, the majority of crashes in the
FMPO region take place in the City of Farmington. Crashes occur in the City of Farmington at
rates above the statewide average (about 26 crashes per 1,000 residents in Farmington versus
22.3 crashes per 1,000 residents statewide), although Farmington does have a rate below most
peer cities.14 Among the cities in New Mexico with more than 40,000 residents, only Rio Rancho
had lower crash rates, while Albuquerque (34.4 crashes per 1,000 residents) and Las Cruces
(34.5 crashes per 1,000 residents) featured rates well above the Farmington average.
14 Farmington has a higher rate compared to the state (about 35 traffic fatalities per 100,000 residents in Farmington compared to 17.8 traffic fatalities per 100,000 residents statewide). This is notable given that New Mexico is among the top five states with the highest fatality rates in the country. IIHS, Fatality Statistics by State; https://www.iihs.org/topics/fatality-statistics/detail/state-by-state
340
269
361341 351
2014 2015 2016 2017 2018
Fatalities by Year
40,690
45,308 45,071 45,906
46,786
2014 2015 2016 2017 2018
Total Crashes by Year
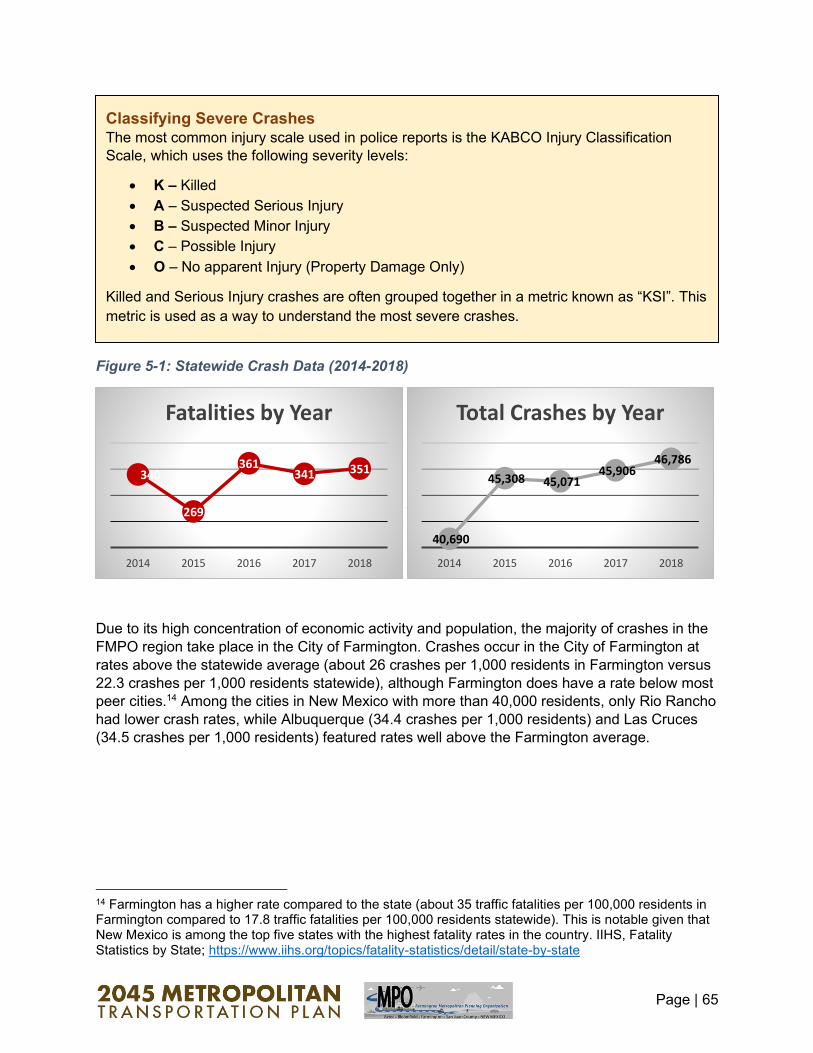
Classifying Severe Crashes The most common injury scale used in police reports is the KABCO Injury Classification
Scale, which uses the following severity levels:
• K – Killed
• A – Suspected Serious Injury
• B – Suspected Minor Injury
• C – Possible Injury
• O – No apparent Injury (Property Damage Only)
Killed and Serious Injury crashes are often grouped together in a metric known as “KSI”. This
metric is used as a way to understand the most severe crashes.
Page | 66
Figure 5-2: Annual Crashes in Farmington and San Juan County (2014-2018)
When further assessing severity by mode, it is clear bicycle and pedestrian crashes are
disproportionately severe when compared to motor vehicle crashes. Table 5-3 groups crash
severity into KSI (fatal and seriously injured crashes) and non-KSI crashes. While 31% of
pedestrian crashes and 9% of bicyclist crashes result in fatality or serious injury, only 3% of
motor vehicle crashes have a severe outcome. Pedestrian crashes comprise 17% of all fatal
and serious injury crashes but only 1% of crashes overall.
Table 5-1: Crash Severity by Mode (2013-2017)
Crash Severity
Pedestrian Crashes
Bicycle Crashes
Motor Vehicle Crashes
Total
KSI 38 4 188 230
Non-KSI 83 83 8,012 8,138
Total 121 47 8,200 8,368
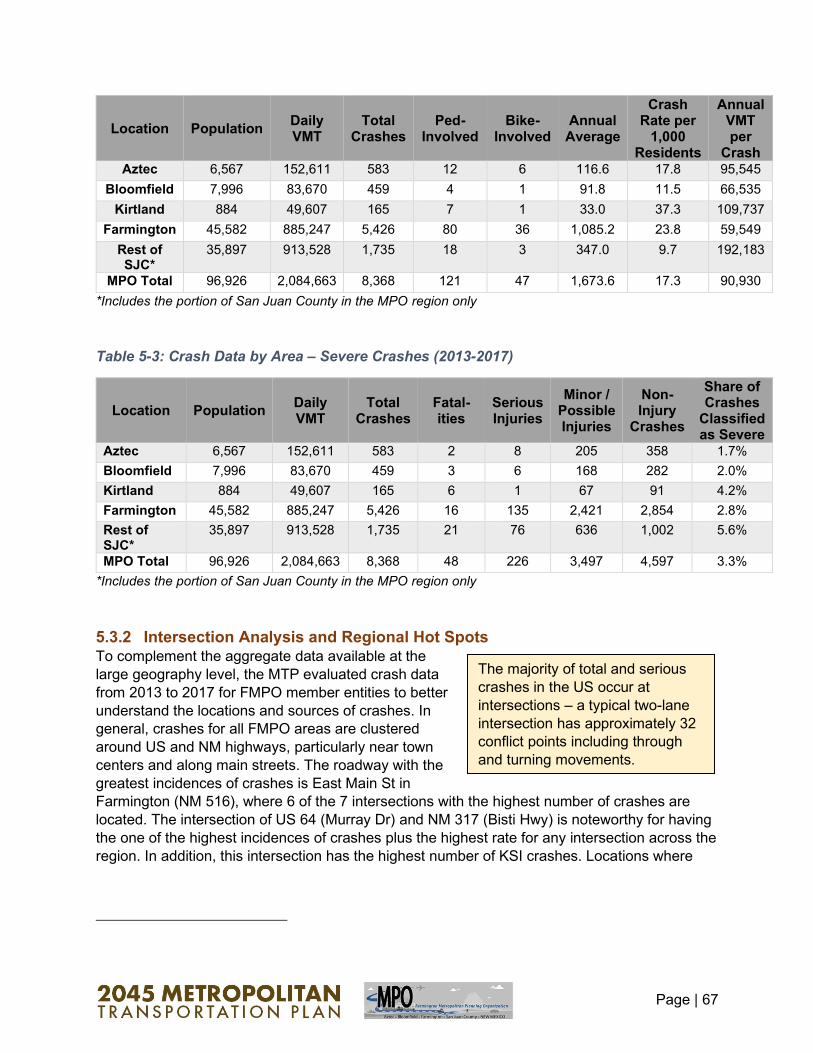
Table 5-2 provides summary crash data for FMPO jurisdictions from 2013 to 2017 (the most
recent years for which individual crash location information is available). The table includes
average annual number of crashes, pedestrian- and bicycle-involved crashes, and the rate of
crashes as measured in VMT per crash and per 1,000 residents. Among FMPO member
agencies, Farmington has the highest amount of crashes as well as the highest rate of crashes,
as measured in VMT per crash. Other than the unincorporated portion of the MPO, Bloomfield
experiences the fewest number of crashes per resident, while Kirtland experiences the fewest
crashes per VMT. Kirtland, which experiences a high level of through-traffic relative to its
population, experiences crashes at about the average rate of the MPO region.
Table 5-2: Crash Data by Area – Total Crashes (2013-2017)
1,1481,365
1,2521,107 1,144
1,800
2,1231,971 1,912 1,931
652758 719 805 787
2014 2015 2016 2017 2018
Annual Crashes by Location
Farmington (City) San Juan County (Total) Other parts of SJ County
Page | 67
Location Population Daily VMT
Total Crashes
Ped-Involved
Bike-Involved
Annual Average
Crash Rate per
1,000 Residents
Annual VMT per
Crash Aztec 6,567 152,611 583 12 6 116.6 17.8 95,545
Bloomfield 7,996 83,670 459 4 1 91.8 11.5 66,535
Kirtland 884 49,607 165 7 1 33.0 37.3 109,737
Farmington 45,582 885,247 5,426 80 36 1,085.2 23.8 59,549
Rest of SJC*
35,897 913,528 1,735 18 3 347.0 9.7 192,183
MPO Total 96,926 2,084,663 8,368 121 47 1,673.6 17.3 90,930
*Includes the portion of San Juan County in the MPO region only
Table 5-3: Crash Data by Area – Severe Crashes (2013-2017)
Location Population Daily VMT
Total Crashes
Fatal-ities
Serious Injuries
Minor / Possible Injuries
Non-Injury
Crashes
Share of Crashes
Classified as Severe
Aztec 6,567 152,611 583 2 8 205 358 1.7%
Bloomfield 7,996 83,670 459 3 6 168 282 2.0%
Kirtland 884 49,607 165 6 1 67 91 4.2%
Farmington 45,582 885,247 5,426 16 135 2,421 2,854 2.8%
Rest of SJC*
35,897 913,528 1,735 21 76 636 1,002 5.6%
MPO Total 96,926 2,084,663 8,368 48 226 3,497 4,597 3.3%
*Includes the portion of San Juan County in the MPO region only
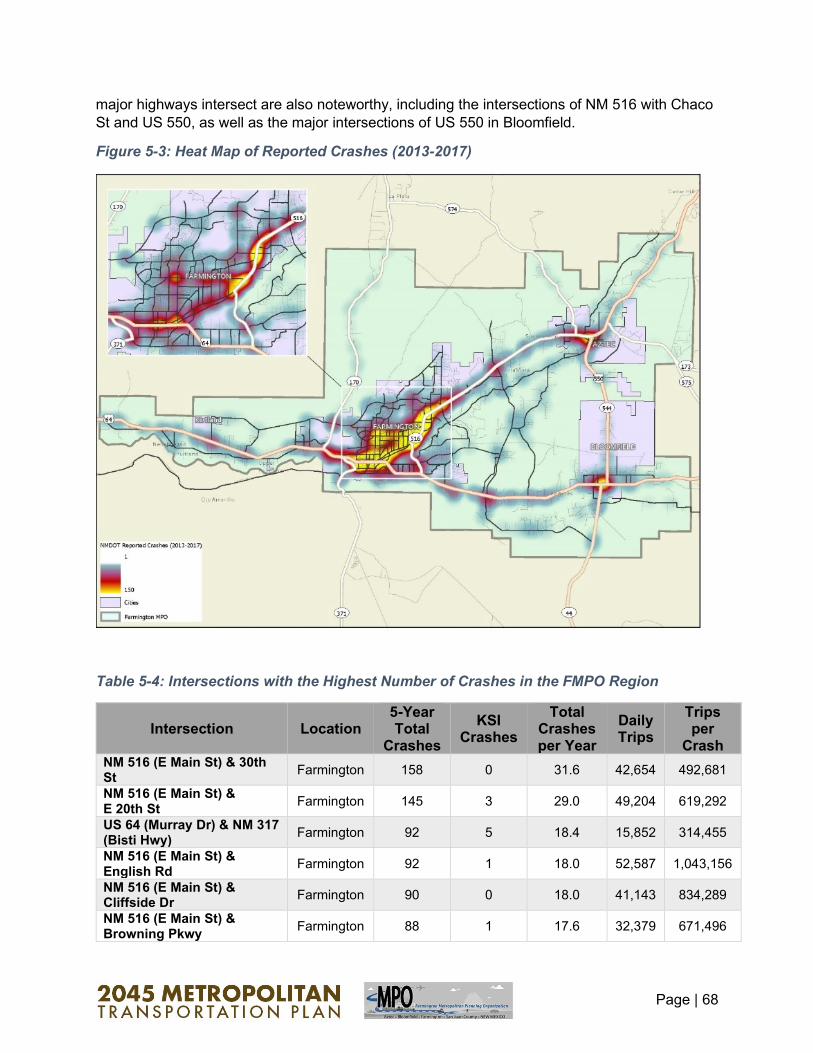
5.3.2 Intersection Analysis and Regional Hot Spots To complement the aggregate data available at the
large geography level, the MTP evaluated crash data
from 2013 to 2017 for FMPO member entities to better
understand the locations and sources of crashes. In
general, crashes for all FMPO areas are clustered
around US and NM highways, particularly near town
centers and along main streets. The roadway with the
greatest incidences of crashes is East Main St in
Farmington (NM 516), where 6 of the 7 intersections with the highest number of crashes are
located. The intersection of US 64 (Murray Dr) and NM 317 (Bisti Hwy) is noteworthy for having
the one of the highest incidences of crashes plus the highest rate for any intersection across the
region. In addition, this intersection has the highest number of KSI crashes. Locations where
The majority of total and serious
crashes in the US occur at
intersections – a typical two-lane
intersection has approximately 32
conflict points including through
and turning movements.
Page | 68
major highways intersect are also noteworthy, including the intersections of NM 516 with Chaco
St and US 550, as well as the major intersections of US 550 in Bloomfield.
Figure 5-3: Heat Map of Reported Crashes (2013-2017)
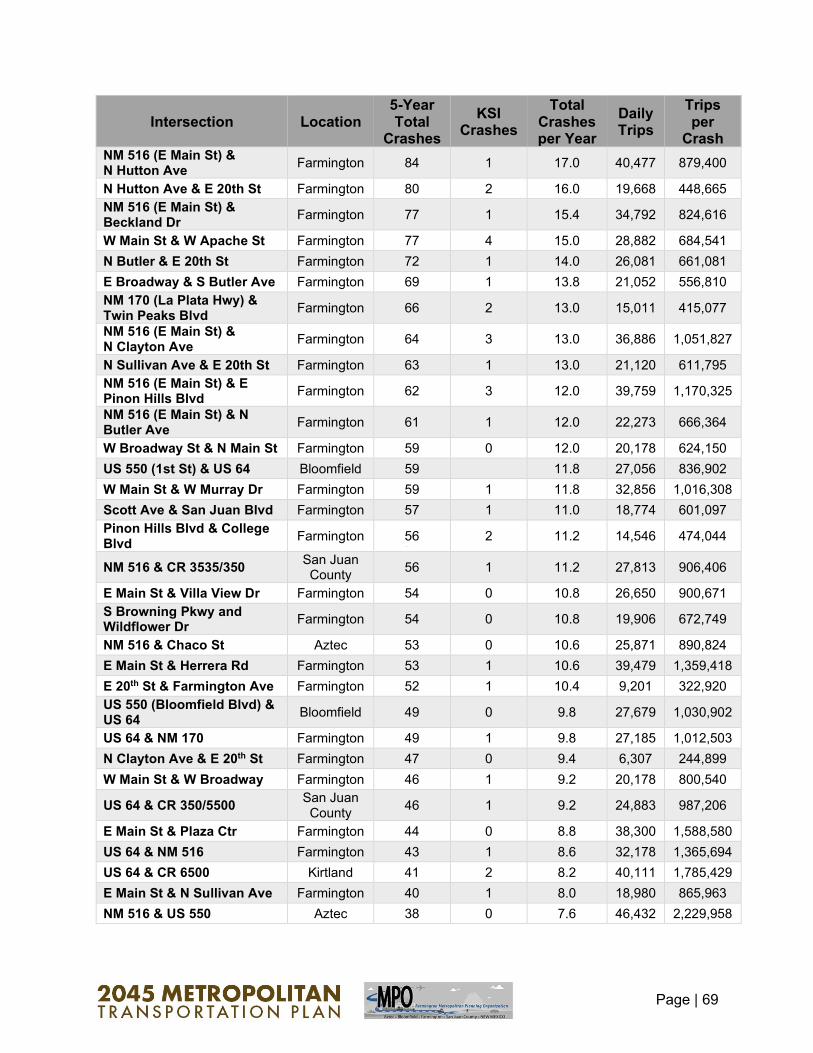
Table 5-4: Intersections with the Highest Number of Crashes in the FMPO Region
Intersection Location 5-Year Total
Crashes
KSI Crashes
Total Crashes per Year
Daily Trips
Trips per
Crash NM 516 (E Main St) & 30th St
Farmington 158 0 31.6 42,654 492,681
NM 516 (E Main St) & E 20th St
Farmington 145 3 29.0 49,204 619,292
US 64 (Murray Dr) & NM 317 (Bisti Hwy)
Farmington 92 5 18.4 15,852 314,455
NM 516 (E Main St) & English Rd
Farmington 92 1 18.0 52,587 1,043,156
NM 516 (E Main St) & Cliffside Dr
Farmington 90 0 18.0 41,143 834,289
NM 516 (E Main St) & Browning Pkwy
Farmington 88 1 17.6 32,379 671,496
Page | 69
Intersection Location 5-Year Total
Crashes
KSI Crashes
Total Crashes per Year
Daily Trips
Trips per
Crash NM 516 (E Main St) & N Hutton Ave
Farmington 84 1 17.0 40,477 879,400
N Hutton Ave & E 20th St Farmington 80 2 16.0 19,668 448,665
NM 516 (E Main St) & Beckland Dr
Farmington 77 1 15.4 34,792 824,616
W Main St & W Apache St Farmington 77 4 15.0 28,882 684,541
N Butler & E 20th St Farmington 72 1 14.0 26,081 661,081
E Broadway & S Butler Ave Farmington 69 1 13.8 21,052 556,810
NM 170 (La Plata Hwy) & Twin Peaks Blvd
Farmington 66 2 13.0 15,011 415,077
NM 516 (E Main St) & N Clayton Ave
Farmington 64 3 13.0 36,886 1,051,827
N Sullivan Ave & E 20th St Farmington 63 1 13.0 21,120 611,795
NM 516 (E Main St) & E Pinon Hills Blvd
Farmington 62 3 12.0 39,759 1,170,325
NM 516 (E Main St) & N Butler Ave
Farmington 61 1 12.0 22,273 666,364
W Broadway St & N Main St Farmington 59 0 12.0 20,178 624,150
US 550 (1st St) & US 64 Bloomfield 59 11.8 27,056 836,902
W Main St & W Murray Dr Farmington 59 1 11.8 32,856 1,016,308
Scott Ave & San Juan Blvd Farmington 57 1 11.0 18,774 601,097
Pinon Hills Blvd & College Blvd
Farmington 56 2 11.2 14,546 474,044
NM 516 & CR 3535/350 San Juan County
56 1 11.2 27,813 906,406
E Main St & Villa View Dr Farmington 54 0 10.8 26,650 900,671
S Browning Pkwy and Wildflower Dr
Farmington 54 0 10.8 19,906 672,749
NM 516 & Chaco St Aztec 53 0 10.6 25,871 890,824
E Main St & Herrera Rd Farmington 53 1 10.6 39,479 1,359,418
E 20th St & Farmington Ave Farmington 52 1 10.4 9,201 322,920
US 550 (Bloomfield Blvd) & US 64
Bloomfield 49 0 9.8 27,679 1,030,902
US 64 & NM 170 Farmington 49 1 9.8 27,185 1,012,503
N Clayton Ave & E 20th St Farmington 47 0 9.4 6,307 244,899
W Main St & W Broadway Farmington 46 1 9.2 20,178 800,540
US 64 & CR 350/5500 San Juan County
46 1 9.2 24,883 987,206
E Main St & Plaza Ctr Farmington 44 0 8.8 38,300 1,588,580
US 64 & NM 516 Farmington 43 1 8.6 32,178 1,365,694
US 64 & CR 6500 Kirtland 41 2 8.2 40,111 1,785,429
E Main St & N Sullivan Ave Farmington 40 1 8.0 18,980 865,963
NM 516 & US 550 Aztec 38 0 7.6 46,432 2,229,958
Page | 70
5.3.3 Kirtland
Although there are no intersections in the Town of Kirtland among the region’s hot spots for
crashes, the US 64 corridor was identified by stakeholders as an area of concern. Specifically,
US 64 serves as the community’s main street and bisects the business district. Primary safety
strategies along the corridor include sidewalks and additional designated crossings, as well as
access management efforts that consolidate turning movement locations and reduce the
potential conflicts in the continuous center turn lane. To provide safer conditions for pedestrians
and bicyclists, the Town of Kirtland and San Juan County have pursued a series of multi-use
trails along major roads with connections to area schools.
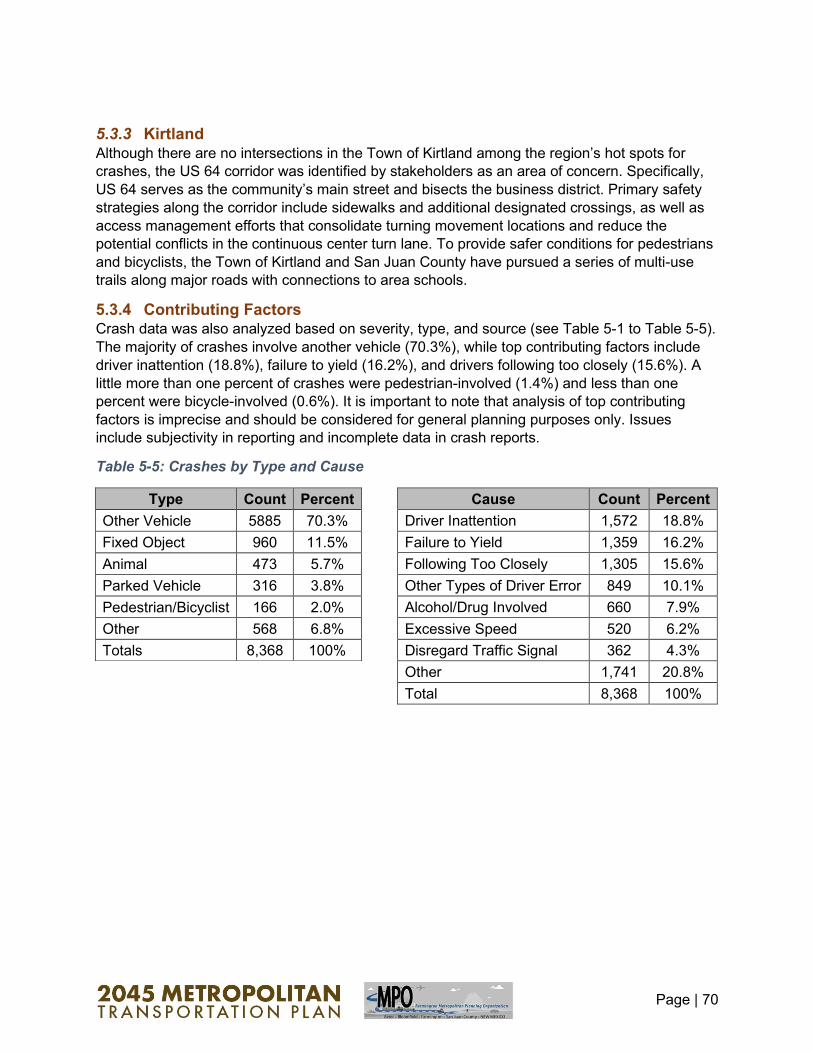
5.3.4 Contributing Factors Crash data was also analyzed based on severity, type, and source (see Table 5-1 to Table 5-5).
The majority of crashes involve another vehicle (70.3%), while top contributing factors include
driver inattention (18.8%), failure to yield (16.2%), and drivers following too closely (15.6%). A
little more than one percent of crashes were pedestrian-involved (1.4%) and less than one
percent were bicycle-involved (0.6%). It is important to note that analysis of top contributing
factors is imprecise and should be considered for general planning purposes only. Issues
include subjectivity in reporting and incomplete data in crash reports.
Table 5-5: Crashes by Type and Cause
Cause Count Percent
Driver Inattention 1,572 18.8%
Failure to Yield 1,359 16.2%
Following Too Closely 1,305 15.6%
Other Types of Driver Error 849 10.1%
Alcohol/Drug Involved 660 7.9%
Excessive Speed 520 6.2%
Disregard Traffic Signal 362 4.3%
Other 1,741 20.8%
Total 8,368 100%
Type Count Percent
Other Vehicle 5885 70.3%
Fixed Object 960 11.5%
Animal 473 5.7%
Parked Vehicle 316 3.8%
Pedestrian/Bicyclist 166 2.0%
Other 568 6.8%
Totals 8,368 100%

Page | 71
5.4 RECOMMENDATIONS AND ACTION ITEMS
Roadway safety is a priority shared by all member agencies; however, the appropriate
countermeasures vary by location. Collaboration with NMDOT is also imperative to address the
noteworthy amount of crashes found along state-owned highways and county roads. This
section outlines safety-related action items that FMPO member agencies may pursue.
5.4.1 Infrastructure Design that Support Complete Streets and Address Crash
Issues To encourage safe design for bicyclists and pedestrians in locations where they are allowed to
travel, FMPO agencies may consider traffic calming techniques, including road diets where
there is excess roadway capacity. Design improvements that support Complete Streets and
reduce motor vehicle speeds include the installation of pedestrian countdown signals, Leading
Pedestrian Intervals (LPI), raised intersections/crosswalks, protected intersections, pavement
flashers that are actively or passively actuated by pedestrians, and marked crosswalks.
• Increase funding, advance implementation, and improve maintenance activities for bike
lanes, sidewalks, and trails across the region. Utilize bike buffers and landscape buffers
to separate bicyclists and pedestrians from motorists and to increase user safety and
comfort.
• Support the development of local Complete Streets policies, plans, guidelines, and
standards.
• Update FMPO scoring criteria for statewide and federal funding to ensure inclusion of
safety and Complete Streets metrics.
• Update road specifications to ensure that new bicycle and pedestrian facilities are
designed with sufficient width and utilize buffers, when appropriate.
• If not addressed in a systemic safety analysis (recommended below as part of the
regional safety action plan), fund and prepare safety studies for high-crash corridors and
intersections to identify risk factors and countermeasures to reduce the number of
crashes, with a focus on reducing fatal and severe injury crashes.
• Support implementation of evidence-based countermeasures in high-crash or high-risk
locations. Table 5-6 includes countermeasures that are applicable to various risk factors.
Resources available to assist in the identification of countermeasures include:
o FHWA’s Crash Modification Factors Clearinghouse – A searchable, online
database of countermeasures with associated Crash Modification Factors and
related details.
o FHWA Proven Safety Countermeasures – A compilation of 20 research-proven
countermeasures.
o NHTSA’s Countermeasures That Work – A reference guide geared towards
State Highway Safety Offices
o NCHRP 15-63 – Guidance on Improving Pedestrian and Bicyclist Safety at
Intersections
o FHWA’s PED/BIKESAFE – Guidance and countermeasures selection system
geared towards improving bicycle and pedestrian safety

Page | 72
Table 5-6: Countermeasure Toolkit
5.4.2 Roadway Design/Access Management Access management and other roadway design measures can reduce the risks of crashes by
minimizing conflict points and reducing opportunities for user error.
• Fund and prepare corridor access management studies that reduce conflict points and
control turning movements. Desired locations for access management include US 64 in
the Kirtland area and NM 516 in east Farmington and unincorporated areas between
Aztec and Farmington.
• Update local development standards to reduce the number of driveways, encourage
shared parking, increase cross-parcel access, and improve pedestrian and bicycle
access.
5.4.3 Enforcement
Enforcement can play a role in roadway and public safety. A data driven approach to
enforcement can help to focus efforts on the violations that most contribute to fatal and serious

Page | 73
crashes. Relying on data in this way also offers an opportunity to improve the equity of
enforcement efforts. Transportation-related enforcement measures include:
• Assessing traffic violations to ascertain which violations are the biggest contributors to
fatal or severe injury crashes. Prioritize enforcement efforts on these violations.
Compiling a regional inventory of traffic violations by location and referring to locations
with high numbers of serious crashes and/or risk factors can also help guide
enforcement efforts.
• Prioritizing enforcement efforts in locations with high levels of pedestrian activity,
particularly on driver violations that may put pedestrians at risk such as failure to yield
and speeding.
• Installing red light cameras to reduce signal running violations.
• Closely tracking and reporting all enforcement efforts to ensure they do not
disproportionately impact low-income communities or communities of color.
5.4.4 Education Programs Education programs help increase knowledge, skills, and behaviors specific to safely operating
a motor vehicle or bicycle to reduce the risk of injuries and fatalities. These programs vary in
content, format, and duration based on needs and resources, and are frequently developed
through local schools and in partnership with Safe Routes to Schools Programs. Specific
actions include:
• Motorist education programs, including media and advertising such as promotional
videos, pamphlets, and billboards to encourage safer driver behavior.
• Driver training courses, including government agency programs for employees and
information about sharing the road with bicyclists and pedestrians.
• Information published on social media by member agencies and FMPO that outlines
safety tips to educate motorists about the rights of different roadway users, including
pedestrians and bicyclists.
5.4.5 Regional Safety Action Plan & Commitment to Zero Deaths With initial performance targets in place, FMPO is positioned to take additional steps to improve
safety outcomes. A high priority effort to address transportation safety in the region is the
development of a regional safety action plan. Safety action planning uses a data-driven,
comprehensive approach to reduce fatalities and serious injuries on all roadways and aids in
institutionalizing safety in transportation programs and projects. For FMPO, a safety plan would
provide an opportunity to focus on objectives such as:
• Embracing a safe systems approach
• Identifying risk factors and high-risk corridors
• Determining policy and funding priorities
• Championing implementation of transformative complete streets projects
The regional safety action plan would provide the framework to support evaluation of progress
over time. Often, regional safety action plans will incorporate systemic safety analyses
(described below).
Page | 74
The regional safety action plan could build on current efforts by NMDOT to consider bicycle and
pedestrian-specific safety measures as part of the Pedestrian Statewide Action Plan. This may
include additional performance measures beyond crash rates, including the share of project
funding dedicated to safety improvements and bicycle and pedestrian facilities, and connectivity,
as measured by the number of crossing opportunities. Many states and local jurisdictions also
participate in the Vision Zero movement and Toward Zero Deaths (TZD) initiatives that call for
zero deaths as the only acceptable safety target. These efforts rely on a data-driven approach
to eliminating fatal and severe injury crashes. Refer to the Transportation Safety Planning and
the Zero Deaths Vision: A Guide for Metropolitan Planning Organizations and Local
Communities for additional information and guidance on potential scope and best practices.
Setting a target by making a formal commitment to a Toward Zero Deaths initiative is an
important next step to guide transportation safety efforts moving forward. This commitment
could be an overarching goal of a regional safety action plan.
5.4.6 Systemic Safety Analysis
While a high-level crash analysis is included in this chapter, conducting a full systemic safety
analysis can provide a nuanced understanding of risk factors and enable a proactive focus on
crash severity. Methods for conducting this analysis could include the Equivalent Property
Damage Only (EPDO) method. In this method, dollar values are assigned to crashes based on
severity and value of a statistical life. This ensures the crash analysis is focused towards human
lives instead of the number of crashes without regard to their severity. A systemic analysis can
also help identify nuanced crash types and risk factors that can inform actionable
countermeasures. In addition, screening the roadway network using these risk factors can apply
a proactive focus on locations where crashes are likely to occur, rather than where they have
already happened. This type of crash analysis can be incorporated into the regional safety
action plan, described above.