5. blast design management - efee
TRANSCRIPT

- 239 -
5. Blast design management

- 240 -

- 241 -
1 INTRODUCTION
The capacity of a structure to resist a variety of
extreme events without being damaged to an
extent disproportionate to the original cause is
called robustness and is required by design codes
and standards. Raising awareness concerning these
risks requires adequate measures during the design
and construction of building structures. Explicit
analysis and design that accounts for the
possibility of an explosion can pose difficulties
(compared to other types of design), both in terms
of load assessment (i.e. the maximum value of the
resultant pressure, or its variation, on elements or
structures) and the effects on materials and
elements, such as the effect of the loading rate on
the mechanical characteristics of steel or
explosion–structure interaction. As the stand-off
Influence of the loading and support conditions on the ultimate
capacity of columns to resist the effects of near - field explosions
F. Dinu Department of Steel Structures and Structural Mechanics, Politehnica University Timisoara, Romania
Laboratory of Steel Structures, Romanian Academy, Timisoara Branch, Romania
I. Marginean Department of Steel Structures and Structural Mechanics, Politehnica University Timisoara, Romania
R. Laszlo, E. Ghicioi & A. Kovacs Department Safety of Explosives and Pyrotechnical Articles, National Institute for Research and Development
in Mine Safety and Protection to Explosion – INSEMEX Petroşani, Romania
ABSTRACT: Explosions may have severe consequences on the integrity of structural or non-structural
elements of a building. Being considered events with a low probability of occurrence, they are not
considered directly in the design, except in certain special situations (accidental design situations). In the
case of deliberate attacks, placing explosive devices at short distances or even attached to building
elements can cause major local failures. Local failure and potential loss of load carrying capacity are
dependent on local conditions in the structural elements (load and end support conditions, mechanical
properties of material). The paper presents the results of recent research carried out on the response of
steel building frames under blast loading. The data of the experimental testing, combined with the
numerical modelling, allowed to investigate the local failure mechanism in the elements and the global
response of the structure to the applied blast load.
Helsinki Conference Proceedings 2019, R. Holmberg et al © 2019 European Federation of Explosives Engineers, ISBN 978-0-9550290-6-6

- 242 -
Figure 1a. Overview of the steel frame specimen - 3D geometry, with the position of pressure sensors S1-S4.
distance from the explosion decreases, the effects
on the building become more complex. In such a
case, the use of numerical analysis may lead to
more accurate results, especially when results are
validated by experimental data. As very few
experimental studies have been carried out on the
resistance to blast of framed buildings, there is a
high interest in such investigations. A more
convenient approach is the Alternate load path
method (APM), where for simplicity it is assumed
that one column is lost due to explosion, then the
capacity for carrying the redistributed loads is
checked. However, it is not yet well established if
APM is representative of all types of explosive
threats.
The paper presents the results of recent
research carried out in the FRAMEBLAST project
(2017-2018) on the safety of building structures
under extreme actions. A two-bay, two-span, and
two-story steel frame building was tested for
different blast loading conditions to evaluate the
consequences of near field explosions on the
structural elements. The experimental data were
combined with the numerical modelling to
investigate the residual capacity of steel columns
and the potential for progressive collapse resulting
from such extreme loading. Numerical modelling
was done with Extreme Loading for Structures
ELS.
2 EXPERIMENTAL BLAST TESTING
The steel frame building model has been
constructed in an explosive testing site. The steel
frame building has two bays, two spans, and two
stories (Figure 1). The bays and spans measure 4.5
m and 3.0 m, respectively, while stories are 2.5 m
high each. The structural system is made of
moment resisting frames on the x-direction
(transversal direction), while on the y-direction
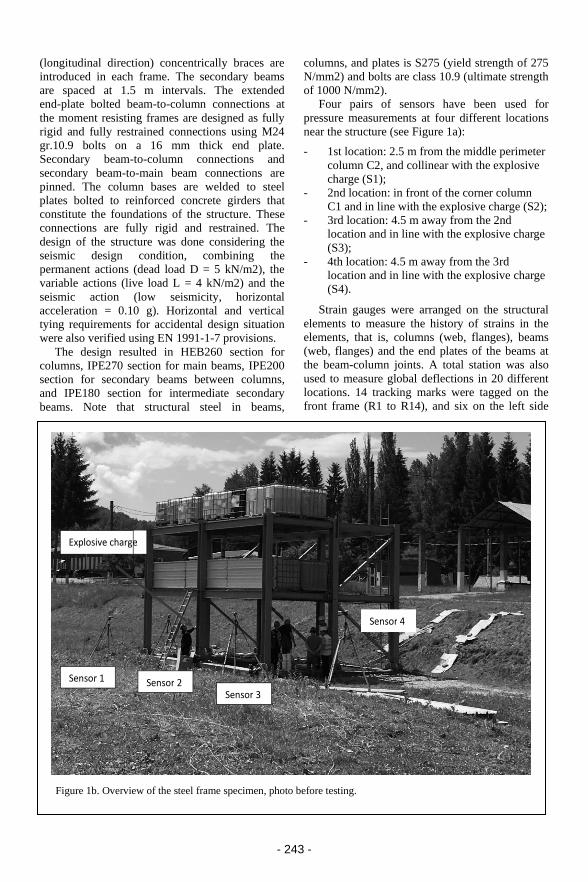
- 243 -
Figure 1b. Overview of the steel frame specimen, photo before testing.
(longitudinal direction) concentrically braces are
introduced in each frame. The secondary beams
are spaced at 1.5 m intervals. The extended
end-plate bolted beam-to-column connections at
the moment resisting frames are designed as fully
rigid and fully restrained connections using M24
gr.10.9 bolts on a 16 mm thick end plate.
Secondary beam-to-column connections and
secondary beam-to-main beam connections are
pinned. The column bases are welded to steel
plates bolted to reinforced concrete girders that
constitute the foundations of the structure. These
connections are fully rigid and restrained. The
design of the structure was done considering the
seismic design condition, combining the
permanent actions (dead load D = 5 kN/m2), the
variable actions (live load L = 4 kN/m2) and the
seismic action (low seismicity, horizontal
acceleration = 0.10 g). Horizontal and vertical
tying requirements for accidental design situation
were also verified using EN 1991-1-7 provisions.
The design resulted in HEB260 section for
columns, IPE270 section for main beams, IPE200
section for secondary beams between columns,
and IPE180 section for intermediate secondary
beams. Note that structural steel in beams,
columns, and plates is S275 (yield strength of 275
N/mm2) and bolts are class 10.9 (ultimate strength
of 1000 N/mm2).
Four pairs of sensors have been used for
pressure measurements at four different locations
near the structure (see Figure 1a):
- 1st location: 2.5 m from the middle perimeter
column C2, and collinear with the explosive
charge (S1);
- 2nd location: in front of the corner column
C1 and in line with the explosive charge (S2);
- 3rd location: 4.5 m away from the 2nd
location and in line with the explosive charge
(S3);
- 4th location: 4.5 m away from the 3rd
location and in line with the explosive charge
(S4).
Strain gauges were arranged on the structural
elements to measure the history of strains in the
elements, that is, columns (web, flanges), beams
(web, flanges) and the end plates of the beams at
the beam-column joints. A total station was also
used to measure global deflections in 20 different
locations. 14 tracking marks were tagged on the
front frame (R1 to R14), and six on the left side
Sensor 1 Sensor 3
Sensor 4
Sensor 2
Explosive charge

- 244 -
Table 1. Blast testing, with mass and position for
charges E1 to E6.
Test
name
Charge
mass [g]
Distance, D
[mm]
Height, H
[mm]
E1 286 500 1750
E2 572 500 1750
E3 1144 500 1750
E4 2288 500 1750
E5 2288 200 1750
E6 2574 200 1750 Note:
- Distance D is measured from the front face of
the central perimeter column C2
- Height H is measured from the column base
plate
Figure 2a. Central column after test E5, front
view.
Figure 2b. Central column after test E5, side
view.
frame (L1 to L6). Two high-speed cameras were
used to record and analyse the blasting events.
Before testing, gravity loads with an equivalent
load of 7.5 kN / m2 were placed on the floors.
Note that the loads were added only on the first
bay (B-C/1-3). During the loading process, strains
and deflections were measured in the points
indicated in the previous section. With the
structure loaded, eight blast tests were performed
on the structure, but only the first 6 tests are
reported here. The details are given in Table 1.
Tests E1 and E2 did not produce any plastic
deformations in the steel members (column,
beams). Following the E3 test, residual
deformations were measured at the level of the
column web and flanges. Test E5 produced the
first fracture in the column web (Figure 2a).
Residual out of plane deformations were also
recorded (Figure 2b). Test E6 completely removed
a large part of the column web and caused large
distortions of the section and continuity plates in
the beam-column joint above the point of
detonation (Figure 2c). Figure 3 presents the wave
propagation around the structure for tests E6.
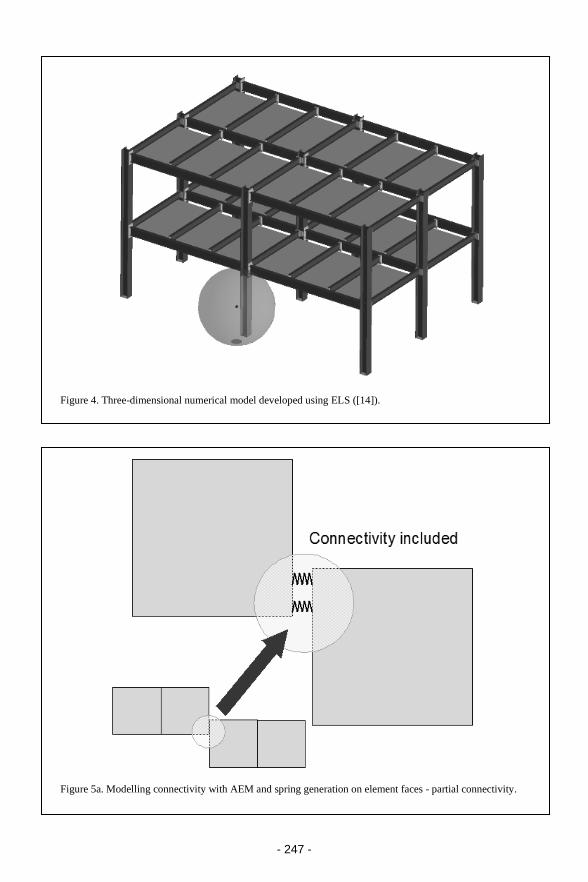
3 NUMERICAL MODELLING OF SITE
EXPLOSION
The numerical analyses were performed using
Extreme Loading for Structures (ELS) software.
The experimental data obtained from the blast tests
were used to calibrate the numerical model, see
Figure 4. ELS uses a non-linear solver based on
AEM and allows the automatic detection and
computation of yielding, hardening, failure of
materials, separation of elements, contact at

- 245 -
Figure 2c. Central column after test E6, front
view.
impact, buckling / post-buckling, crack
propagation, membrane action, and P-Δ effect. In
the AEM modelling technique, the structural
elements are modelled as small solid elements
connected by normal and shear springs that follow
the constitutive law of the corresponding material
(Figure 5a, & 5b). These elements are considered
rigid and the displacement one to the other is
expressed through the springs, which will generate
stresses and strains. The material volume property
of these springs is represented by the interface
spring tributary surface and distance between the
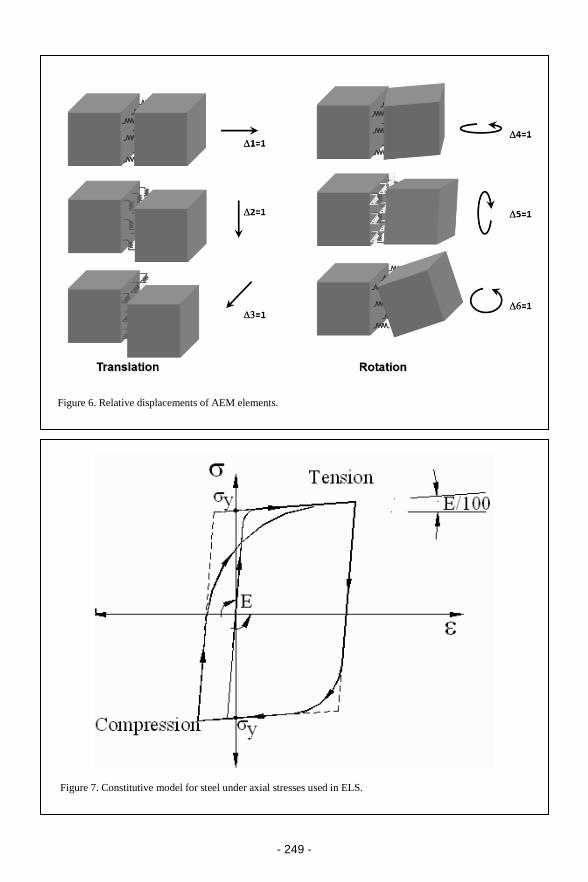
centroids of the elements (Figure 5c). The rigid
AEM elements have six degrees of freedom (three
for translations and three for rotations), and no
simplification are made on their possible
displacements and consequently on springs
deformations, see Figure 6. Two neighbouring
elements can be separated once the springs
connecting them are ruptured. Fully nonlinear
path-dependent constitutive models were used for
materials, see Figure 7. Structural steel S275 was
assigned for all steel elements (beams, columns,
plates) and class 10.9 bolts were used for
connections. The dynamic effects in the material
were modelled based on the maximum strain rates
derived from the numerical simulation, that is,
300 s-1. Figure 8 shows a detailed view of the
Figure 3a. Shock wave propagation E6.

- 246 -
Figure 3c. Shock wave propagation, test E6.
AEM model, with the position of small elements
(1 to 9) located in the column fracture zone. The
elevation of the blast charge is also indicated in the
figure.
The pressure histories measured at the four
points indicated in Figure 1b were used for the
calibration of the pressure load in the numerical
model. Figure 9 shows the pressure histories,
Figure 3b. Shock wave propagation, test E6.
- 247 -
Figure 4. Three-dimensional numerical model developed using ELS ([14]).
Figure 5a. Modelling connectivity with AEM and spring generation on element faces - partial connectivity.
- 248 -
Figure 5b. Modelling connectivity with AEM and spring generation on element faces - connectivity
matrix spring.
Figure 5c. Modelling connectivity with AEM and spring generation on element faces - spring distribution
and tributary area.
- 249 -
Figure 6. Relative displacements of AEM elements.
Figure 7. Constitutive model for steel under axial stresses used in ELS.

- 250 -
Figure 9a. Pressure history at points S1 to S4,
experimental (E) vs numerical (N), test E5.
S1-E
S1-N
S2-E
S2N
-1
0
1
2
3
4
5
6
7
0 0.005 0.01 0.015 0.02
Pre
ssu
re, b
ar
Time, ms
Figure 9b. Pressure history at points S1 to S4,
experimental (E) vs numerical (N), test E5.
S3-E
S3-N
S4-E
S4-N
-0.1
-0.05
0
0.05
0.1
0.15
0.2
0.25
0.3
0.35
0.4
0.015 0.02 0.025 0.03 0.035 0.04 0.045 0.05
Pre
ssu
re, b
ar
Time, ms
experimental vs. numerical, for test E5. For clarity,
pressures S1, S2 and S3, S4 are presented on
separate graphs. It may be seen the pressure is well
approximated at points 2, 3, and 4, the only
significant difference is at point 1, possibly due to
some local effects or sampling rate in the data
acquisition system. Note that only the positive
phase is modelled in ELS.
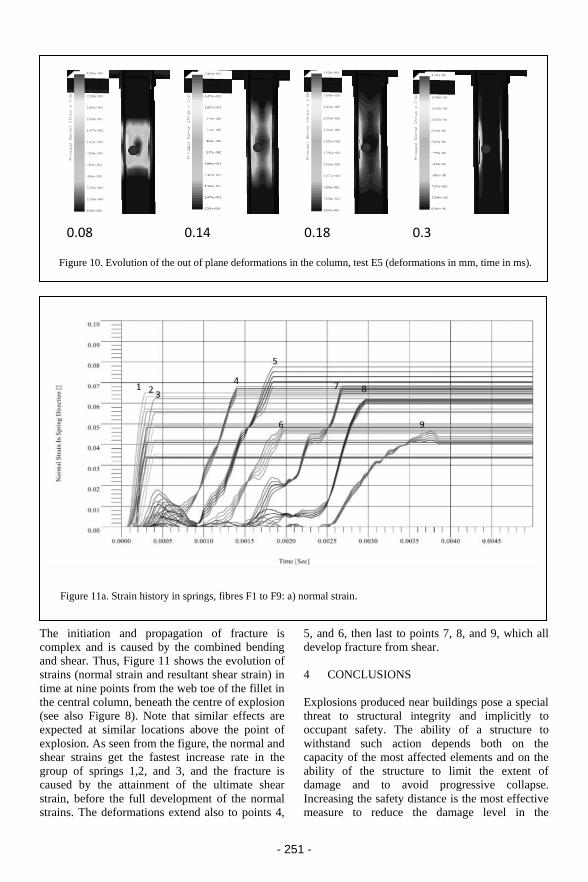
Figure 10 shows the main phases of
deformation in the column. As seen, the strains are
highly localized in the web toe of the fillet,
symmetrically above and below the centre of the
explosion. The partial fracture of the web is
initiated at 0.3 ms from start and extends over a
length nearly double the height of the column.
Figure 8. Detailed view with AEM model, with the position of small elements (1 to 9) and elevation of the blast charge.
- 251 -
0.08 0.14 0.18 0.3
Figure 10. Evolution of the out of plane deformations in the column, test E5 (deformations in mm, time in ms).
Figure 11a. Strain history in springs, fibres F1 to F9: a) normal strain.
The initiation and propagation of fracture is
complex and is caused by the combined bending
and shear. Thus, Figure 11 shows the evolution of
strains (normal strain and resultant shear strain) in
time at nine points from the web toe of the fillet in
the central column, beneath the centre of explosion
(see also Figure 8). Note that similar effects are
expected at similar locations above the point of
explosion. As seen from the figure, the normal and
shear strains get the fastest increase rate in the
group of springs 1,2, and 3, and the fracture is
caused by the attainment of the ultimate shear
strain, before the full development of the normal
strains. The deformations extend also to points 4,
5, and 6, then last to points 7, 8, and 9, which all
develop fracture from shear.
4 CONCLUSIONS
Explosions produced near buildings pose a special
threat to structural integrity and implicitly to
occupant safety. The ability of a structure to
withstand such action depends both on the
capacity of the most affected elements and on the
ability of the structure to limit the extent of
damage and to avoid progressive collapse.
Increasing the safety distance is the most effective
measure to reduce the damage level in the

- 252 -
Figure 11b. Strain history in springs, fibres F1 to F9: b) resultant shear strain.
structure. The interaction between the shock wave
and the structure results in a significant increase in
the maximum pressure and implicitly in the state
of strains in the structure. For this reason, a
two-bay, two-span, and two-story steel frame
building model was tested for different blast
loading conditions to evaluate the consequences of
near-field explosions on the structural elements.
The results of the blast tests showed that the
interaction between the shock wave and the
structure may result in a significant increase in the
maximum pressure and implicitly in the level of
deformations in the structure. Also, increasing the
safety distance is the most effective measure of
damage reduction in the structure. The specific
instrumentation (pressure, strains, video) provided
extensive data that allowed to calibrate the
numerical models and to go deeper into the
blast-structure interaction process and sequences
of failure.
REFERENCES
Adam J. M., Parisi F., Sagaseta J. & Lu X. 2018.
Research and practice on progressive collapse
and robustness of building structures in the 21st
century. Eng. Struct., vol. 173, Oct. 2018, pp.
122–149.
Applied Science International 2018. Extreme
loading for structures theoretical manual,
Version 6. 2018.
Chen, C.H., Zhu Y.F., Yao, Y., Huang, Y. & Long X.
2016. An evaluation method to predict
progressive collapse resistance of steel frame
structures. J. Constr. Steel. Res., vol. 122, Jul.
2016, pp. 238–250.
Dinu F., Dubina D. & Marginean I. 2015, Improving
the structural robustness of multi-story
steel-frame buildings. Structure and
Infrastructure Engineering, vol. 11, no. 8, Aug.
2015, pp. 1028–1041.
Dinu F., Marginean I., Dubina D. & Petran I. 2016,
Experimental testing and numerical analysis of
3D steel frame system under column loss. Eng.
Struct., vol. 113, Apr. 2016 pp. 59–70.
Dinu F., Marginean I., Dubina D., Kovacs A. &
Ghicioi E. 2017, Experimental testing and
numerical modelling of steel frames under
close-in detonations. Procedia Engineering, vol.
210, Jan. 2017 pp. 377–385.
Dinu F., Marginean I. & Dubina D. 2017.
Experimental testing and numerical modelling
of steel moment-frame connections under column
loss. Eng. Struct., vol. 151, Nov. 2017,
pp. 861–878.
Dinu F., Marginean I., Dubina D. Khalil A. & De
Iuliis E. 2018. Factors affecting the response of
steel columns to close-in detonations. 12th
International Conference on Advances in
Steel-Concrete Composite Structures (ASCCS

- 253 -
2018), Universitat Politècnica de València,
València, Spain, June 27-29, 2018.
EN 1991-1-7 2006. Eurocode 1 - Actions on
structures - Part 1-7 : General actions -
Accidental actions. European Committee for
Standardisation CEN, 2006.
El-Tawil S., Li H., & Kunnath S. 2014,
Computational simulation of gravity-induced
progressive collapse of steel-frame buildings:
current trends and future research needs. J.
Struct. Eng., vol. 140, Aug. 2014, no. 8.
Experimental validation of the response of a
full-scale frame building subjected to blast load
frameblast. UEFISCDI, Executive Agency for
Higher Education, Research, Development and
Innovation Funding, 2018.
Mazurkiewicz L., Malachowski J. & Baranowski P.
2015. Blast loading influence on load carrying
capacity of I-column. Engineering Structures,
vol. 104, Dec. 2015. pp. 107–115.
Tagel-Din H.S. & Meguro K. 2000. Applied element
method for dynamic large deformation analysis
of structures. JSCE, vol. 661, pp. 1–10.
Tagel-Din H.S. & Meguro K. 2000. Applied element
method for simulation of nonlinear materials:
theory and application for RC structures. JSCE,
vol. 17, pp. 137–148.
UFC 4-023-03 2016. Design of buildings to resist
progressive collapse. Department of Defense
DoD.
Zhang J., Jiang J., Xu S. & Wang Z. 2018. An
investigation of the effect of semi-rigid
connections on sudden column removal in steel
frames. Structures, vol. 13, pp. 166–177.

- 254 -

- 255 -
1 INTRODUCTION
Bench blasting is a common method for open pit
mining and large-scale earthwork excavation. Its
blasting quality and blasting construction safety
are closely related to blasting parameters. The
present bench blasting design has several main
technical limitations. The method of blasting
design based on experience and engineering
analogy cannot meet the requirements of blasting
refinement. The existing computer-aided blasting
design software and blasting parameter
optimisation method can only complete a certain
part of blasting design, but penetrate the whole
process of blasting design, parameter optimisation
and effect evaluation. For a given blasting design,
there is a lack of easy applied software for
evaluating and predicting the harmful effects of
blasting vibration. And it lacks of effective
comprehensive evaluation system for blasting
Intelligent design software for open bench blasting
M.S. Zhao, H.B. Yu, Q. Liu & X.G. He Poly Xinlian Blasting Engineering Co., Ltd., Guiyang, Guizhou, China
G.X. Zhang Poly Explosive Hami Co., Ltd., Hami, Xinjiang, China
J. Liu Institute of Safety and Disaster Prevention Engineering, Hohai University, Nanjing, Jiangsu, China
ABSTRACT: With the increasing demand for safety and environmental protection, intelligent bench
blasting design is urgently needed in the field of blasting engineering. Based on the Voronoi grid
technology, the designs of blast hole layout and initiation sequence are proposed, and the corresponding
software modules are developed to improve the accuracy of blasting hole layout and the energy efficiency
of explosives. Based on the plane image processing technology, the algorithm of the size distribution on
the muck pile surface is proposed, and the module for boulder yield analytic statistics is developed
through the image binary conversion and the outline recognition technique. Based on the combination of
optimisation theory, linear programming and fuzzy mathematics, the blasting effect comprehensive
evaluation module is developed. The design software is developed by using VC platform, STL template
library and OpenGL graphic library. The on-site evaluation results of the software show that it is of high
evaluation accuracy and high evaluation efficiency, which can realise the automotive hole layout and
network design, effectively reducing the harmful effects of blasting vibration, and providing the technical
support for blasting parameter optimisation.
Helsinki Conference Proceedings 2019, R. Holmberg et al © 2019 European Federation of Explosives Engineers, ISBN 978-0-9550290-6-6

- 256 -
Figure 1. The identification method of free
boundary and infinite boundary.
Figure 2. The back-pushing method of free
boundary.
effect, so it cannot quantitatively evaluate the
effect of blasting engineering, which does not
meet the requirements of blasting refinement. The
orderly advancement of intelligent, digital and
scientific blasting construction has become
inevitable. This blasting design software is
developed for on-site application. It takes the
adaptive blasthole arrangement of hole-by-hole
blasting, automatic determination of detonation
sequence and calculation of charge amount as the
main objectives. It develops the explosion block
size distribution statistical module and the
vibration waveform prediction module, and use
optimisation model to analyse the blasting effect
of hole-by-hole blasting.
2 DEVELOPMENT OF THE DESIGN
SOFTWARE FOR OPEN-PIT BLASTING
2.1 Design method of blasthole layout and
initiation sequence
2.1.1 Blasthole self-adaptive layout
The adaptive blasthole layout algorithm rules are
as follows: (a) Measure the coordinates of the top
line and the corresponding bottom line, calibrate
the free boundary by the two lines, i.e. the free
face of the bench blasting. The free boundary can
be regarded as one free boundary or two free
boundaries according to the angle between the two
line segments corresponding to the measuring
point. That is, if the angle between the two line
segments connected to a measuring point in the
blasting area is less than or equal to 90o, it would
be considered as two free boundaries, which are
identified by 1 and 2 respectively. Or it would be
considered as one free boundary, identified by 1.
The purpose of dividing the free boundary into
two is to facilitate the search for the first detonated
blasthole; when there is only one free boundary,
the first detonated blasthole is randomly
formulated. (b) Since the scale of each blasting is
determined according to the production task and
the capacity of the shovel, it can only be part of a
bench. Therefore, in the adaptive blasthole layout
algorithm, the boundary line of the rock mass
needing to be blasted and that needing to be
retained should also be made out, which is referred
to herein as the infinite boundary, identified by -1
(see Figure 1).
After the free boundary and the infinite
boundary are marked, the blasting parameters are
entered, including the hole pattern, the hole
diameter, the step height, the explosive unit
consumption, the charge density, and the rock
density. The hole pattern can be square or
triangular, the hole diameter is determined by the
site rock drilling equipment, the step height is
determined by the mining design plan, the
explosive unit consumption is selected according
to the experience and adjusted based on the field
test blast, and the charge density is determined by
the explosive properties, and the rock density is
determined by field mechanics tests. Based on the
blasting parameters, the resistance line distance,
hole spacing and ultra-deep in the blasting design
can be calculated. Push back the free boundary at
the specified row spacing to obtain a series of
contours for arranging the blastholes. The
back-pushing method for the free boundary is:
Calculate the normal vector of the two line
segments connected to each measuring point
(pointing to the inner side of the explosion zone),
move each line segment back to the distance of the
row spacing according to the direction of the
normal vector, and then calculate the intersection
of each line segment after the backward
movement. The contour lines of the free boundary
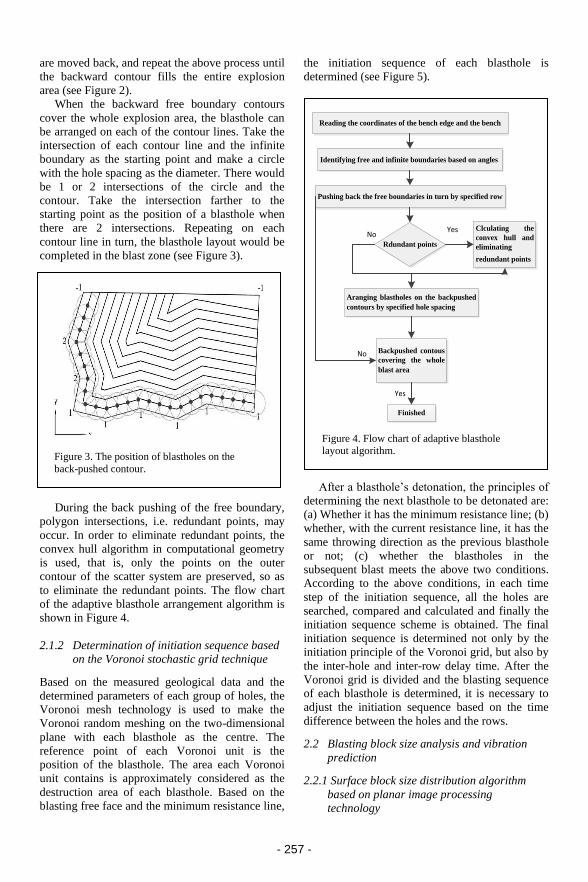
- 257 -
Figure 3. The position of blastholes on the
back-pushed contour.
Figure 4. Flow chart of adaptive blasthole layout algorithm.
are moved back, and repeat the above process until
the backward contour fills the entire explosion
area (see Figure 2).
When the backward free boundary contours
cover the whole explosion area, the blasthole can
be arranged on each of the contour lines. Take the
intersection of each contour line and the infinite
boundary as the starting point and make a circle
with the hole spacing as the diameter. There would
be 1 or 2 intersections of the circle and the
contour. Take the intersection farther to the
starting point as the position of a blasthole when
there are 2 intersections. Repeating on each
contour line in turn, the blasthole layout would be
completed in the blast zone (see Figure 3).
During the back pushing of the free boundary,
polygon intersections, i.e. redundant points, may
occur. In order to eliminate redundant points, the
convex hull algorithm in computational geometry
is used, that is, only the points on the outer
contour of the scatter system are preserved, so as
to eliminate the redundant points. The flow chart
of the adaptive blasthole arrangement algorithm is
shown in Figure 4.
2.1.2 Determination of initiation sequence based
on the Voronoi stochastic grid technique
Based on the measured geological data and the
determined parameters of each group of holes, the
Voronoi mesh technology is used to make the
Voronoi random meshing on the two-dimensional
plane with each blasthole as the centre. The
reference point of each Voronoi unit is the
position of the blasthole. The area each Voronoi
unit contains is approximately considered as the
destruction area of each blasthole. Based on the
blasting free face and the minimum resistance line,
the initiation sequence of each blasthole is
determined (see Figure 5).
Reading the coordinates of the bench edge and the bench
Identifying free and infinite boundaries based on angles
Pushing back the free boundaries in turn by specified row
Rdundant points
Clculating the
convex hull and
eliminating
redundant points
Aranging blastholes on the backpushed
contours by specified hole spacing
Backpushed contous
covering the whole
blast area
Finished
NoYes
No
Yes
After a blasthole’s detonation, the principles of
determining the next blasthole to be detonated are:
(a) Whether it has the minimum resistance line; (b)
whether, with the current resistance line, it has the
same throwing direction as the previous blasthole
or not; (c) whether the blastholes in the
subsequent blast meets the above two conditions.
According to the above conditions, in each time
step of the initiation sequence, all the holes are
searched, compared and calculated and finally the
initiation sequence scheme is obtained. The final
initiation sequence is determined not only by the
initiation principle of the Voronoi grid, but also by
the inter-hole and inter-row delay time. After the
Voronoi grid is divided and the blasting sequence
of each blasthole is determined, it is necessary to
adjust the initiation sequence based on the time
difference between the holes and the rows.
2.2 Blasting block size analysis and vibration
prediction
2.2.1 Surface block size distribution algorithm
based on planar image processing
technology

- 258 -
Measuring geological
materialsMeshing by Voronoi
Determining the destruction area of
each blasthole
Determining the blastholes meet the blasting principle
Sort each holeAchieving improved
blasting result
Figure 5. Flow chart of VORONOI grids determining initiation sequence.
Ruler scaling Area Selection Size choosing Bar graph of size distribution
Grading figure
of size
Figure 6. Statistical steps of block distribution.
Based on the Image processing technology, like
image digitisation, image coding, image
compression, image enhancement and restoration,
image enhancement, image restoration, and image
analysis, a large two-dimensional array could be
received by the set of a more rationalised threshold
and the local adaptive binarisation of images.
Extract the details in the binarised image, and
finally identify the features of the target shape by
contour recognition. Statistical steps are shown in
Figure 6.
2.2.2 Blasting Vibration Prediction Based on
Anderson Model
The simulation and prediction of seismic waves is
a very complicated task. At present, various
models proposed by scholars at home and abroad
focus on some aspect of blasting vibration, like the
maximum amplitude of vibration, or a single
parameter such as the main frequency of vibration.
There are certain limitations in using numerical
methods such as finite element, prediction
methods based on statistics models, complete time
history models, etc. It is urgent to establish a
comprehensive, accurate and convenient vibration
prediction model.
According to the characteristics of bench
blasting, the Anderson prediction model based on
superposition time domain waveform is improved
by using the nonlinear prediction method of step
blasting vibration effect of Volterra functional
series. The Anderson model is improved based on
the seismic scale factor of the bench blasting. The
Volterra nonlinear system model, the improved
Anderson model and the calculation program for
structural response prediction are developed.
According to the improved Anderson model and
the vibration waveform predicted by the nonlinear
Volterra functional series model, the vibration

- 259 -
Table 1. The evaluation system of weight.
Evaluation
index
(large item)
Weight
Evaluation
index
(small item)
Weight
Safety and
reliability 0.4
Effect 0.4
Flyrock 0.3
Vibration 0.2
Dust 0.1
Technical
Rationality 0.4
Bulk 0.4
Root 0.4
Forward and
backward 0.1
Operation
difficulty 0.1
Economic
benefit 0.2
Explosive
unit
consumption
0.5
Blasting
output per
meter hole
0.2
supporting
materials 0.1
Blasting
materials 0.2
mode decomposition response spectrum method,
time history analysis method and transfer function
method are developed to predict the change rules
with time of vibration effect like internal force,
shear force and displacement of the building
structure.
2.3 Determination of blasting effect evaluation
system based on optimisation theory
2.3.1 Analysis of factors influencing blasting
effect
Both bulk rate and looseness affect the efficiency
and cost of subsequent mining operations. The
main indicators of blasting quality evaluation are
bulk rate and pile looseness. The factors affecting
the blasting pile size are: a) geological structure,
like joint fissures, number of faults, degree of
fracture, etc.; b) blasting parameters: blasthole
spacing, minimum resistance line, explosive unit
consumption, etc.; c) charging method: charging
structure, charge density, charge amount, clogging
method, etc.; d) detonation method: detonation
type, initiation sequence and delay time; e)
explosive performance: detonation pressure,
explosion pressure, etc. Looseness is the
proportion of the void volume of the explosive
pile to the total volume of the pile. The looseness
being too small will affect the efficiency of the
shovel and directly increase the cost of mining.
The blasting block rate is the result of the
comprehensive influence of various factors.
Among them, the blasthole spacing, the minimum
resistance line, and the explosive unit
consumption takes a large proportion in
accounting for the bulk rate. Therefore, find the
connection between these aspects and the block
rate and finally determine the optimal value of
each factor.
2.3.2 Determination of evaluation system based
on optimisation theory
In the aspect of the characteristics of blasting, it is
necessary first to ensure the safety of the blasting,
and secondly to make the blasting achieve the
optimal effect and feasible in economy. In the
evaluation index of the blasting effect, what the
engineers concern most are the indicators such as
the block rate and the root rate.
It is feasible to comprehensively judge the
merits and demerits of the blasting parameter
system from the three aspects of rationality, safety
and economy. The importance of each item is
determined in the form of weight. In the actual
evaluation, safety, technicality and economy are
taken as constraints, and the blasting effect is used
as the evaluation target. Based on this, the
evaluation system of Table 1 is proposed. The
constraint and objective function are described by
linguistic variables, and according to the actual
experience and reasoning, plus the principle of
highlighting the advantages and disadvantages of
the scheme, the linguistic variables are
transformed into corresponding membership
degrees, as shown in Table 2.
It can be seen from Table 2 that the evaluation
of the parameter system is a decision with multiple
objectives, levels and constrains. The evaluation
value of each test is calculated by the convex
fuzzy programming principle, and finally the
parameters corresponding to the optimal blasting
scheme are obtained.
2.3.3 Optimisation of blasting design parameters
In practice, the main indexes to evaluate the
blasting effect are block rate, root rate, block
evenness rate and pile looseness. In the case
that the type of explosive, the inclination

- 260 -
Table 2 Constraint and target language variables and corresponding membership.
Extremely
poor
Very
poor
Poor Fair Good Very
good
Excellent
Safety and reliability
membership
0 0.1 0.2 0.5 0.6 0.8 1
Technical Rationality
membership
0 0.1 0.2 0.5 0.6 0.8 1
Economic benefit
membership
0 0.1 0.2 0.5 0.6 0.8 1
Investigation of original blasting
parameters
Hole spacing, row spacing, charging structure, unit explosive consumption, delay time
Establishment of blasting effect
model
Technically reasonable, safe and reliable, economy
Optimization theory
Quantitative evaluation of the effect of original
blasting parameters
Fragment size distribution
Field statistical analysis
Selection of parameters for low
cost and good blasting effect
Comparison of size distribution curves
Analysis program of size distribution
Industrial test of new blasting parameters
Measurement of fragment sizes
Field statistics and program analysis
Optimized combination of
delay time and unit explosive
consumption
Measurement of muck piles and fragment sizes
Simulation of initiation sequence
and design of initiation plan
Figure 7. Optimisation flow chart of blasting parameters.
- 261 -
Figure 9. Exported table of parameter list.
Figure 8. Software interface.
of the blasthole, the height of the step, the depth
of the single blasting, and the diameter of the
blasthole have been clearly determined in the
actual production design, the main factors
affecting the blasting effect are the blasthole
pattern parameters, the initiation sequence, the
delay interval, and the explosive unit
consumption. The blasthole pattern parameters are
determined by the program, and the field test is
carried out to optimize the blasting parameters.
The optimisation process is shown in Figure 7.
3 SOFTWARE INTRODUCTION
According to the requirements of digitalisation,
informationisation and intelligence of blasting
design, based on VC++ platform, the program
code and interface integrating blasting design,
optimisation and effect evaluation are developed.
Based on the visualisation module of development
design software of the OpenGL graphics library,
the modules for the storage and output of design
and evaluation results are developed. In the
software development, the STL standard template
library, WildMagic math function library,
quaternion and other technical and theoretical
methods are comprehensively applied to realize
the digitisation, informationisation and
intelligence of blasting design and effect
evaluation.
3.1 Interface
The upper bar of the window is the menu bar,
including File, Module, Edit, View, and Help. The
left column of the window is the working area of
the module, including the input and output of
related data, parameter settings, and so on. In the
middle is the effect display area of the module and
at the bottom is the software status message bar.
The entire interface is simple and clear, and
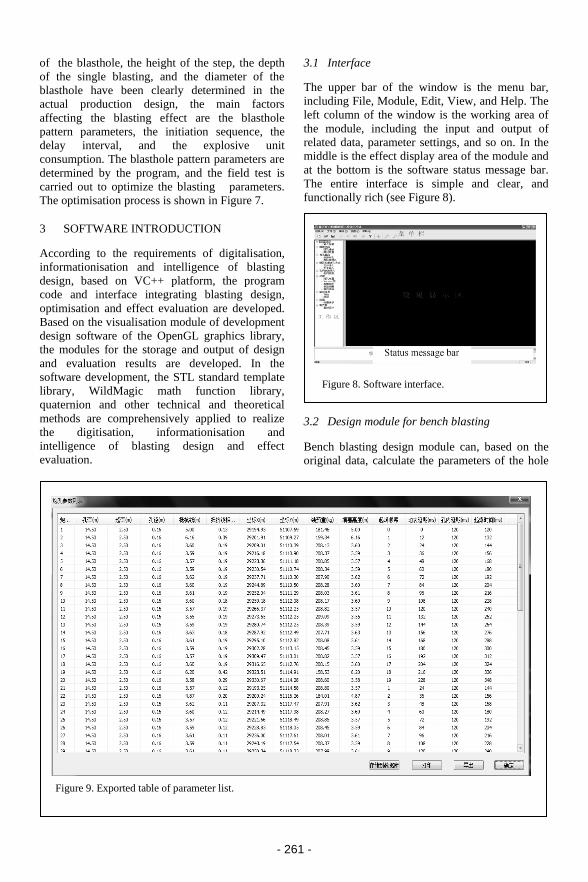
functionally rich (see Figure 8).
3.2 Design module for bench blasting
Bench blasting design module can, based on the
original data, calculate the parameters of the hole

- 262 -
Figure 10. Distribution curve.
pattern, like the hole spacing, the row spacing, the
minimum resistance line, etc., and select the
appropriate value for the blasthole adaptive
algorithm.
The blasting sequence diagram is determined
based on Voronoi grid technology, so the blasting
sequence of the holes can be clearly seen. The
output of the parameter list can be exported in an
Excel file (see Figure 9), and the data collection
will provide an important basis for the actual
blasting layout.
3.3 Blasting effect statistics module
Statistical module of blasting effect can, based
on the blasting pile, carry out the statistical
analysis of lumpiness distribution by using the
photographic method, which provides necessary
data for the combination analysis of blasting effect
evaluation and optimisation. The module mainly
collects the blasting effect after processing the
image of the blasting stone block. The specific
operation steps are as follows:
− Image reading: By analysing the image taken
on site after the explosion. Select the image to
be analysed for size analysis
− Select area: Hold down the left mouse button
in the display area and pull the mouse to
select the area to be counted
− Image processing: Threshold segmentation of
the selected region image. Click the “Size
Extraction” button to display the effect of
image processing
− Distribution curve: Click “Size Distribution
Curve” to get the distribution curve (see
Figure 10).
3.4 Blasting effect evaluation module
Blasting effect evaluation module gives out
comprehensive evaluations to the blasting
construction based on the size distribution and
other indicators from the perspectives of safety,
reliability, technically reasonability and economy.
The evaluation of blasting effect is determined
by weight. It can make a relatively accurate
evaluation of each indicator according to the
evaluation system of weight in Table 1 and
constraint and target linguistic variables and their
corresponding membership in Table 2, thus
providing a scientific basis for the correct
evaluation of the entire blasting scheme. Each item
for evaluation is set through the drop-down menu.
Click "ok" after setting up each item, and the
evaluation output results include safety and
reliability evaluation, technical rationality
evaluation, economy evaluation and
comprehensive evaluation. The corresponding
histogram of various analyses will be generated in
the middle display area, so as to see the evaluation
results more intuitively.
3.5 Comparison of similar products at home and
abroad
At present, the most widely used blasting software
are the Shot Plus blasting design software and the
- 263 -
Table 3. Comparison of research results with similar technologies at home and abroad.
Comparison content Research results of this
project
Similar technologies at home and abroad
ShotPlus Blast-Code Huayisoft Blast
Blast design
software
Analytical calculation method
of hole pattern
parameters
Analytical calculation
method for deriving optimal hole pattern
parameters based on
maximum utilisation
of blastholes
Determined by
experience
Determined by
experience
Determined by
experience
Calculation method
of blasthole position
Calculation by
constructing a
reference line
Manual
calculation
Manual
calculation and
comprehensive adjustment
Manual
calculation
Method for
identifying charge
amount and hole- by-hole blasting
initiation sequence
The identification
method is proposed
Based on the construction of the
Voronoi diagram of the
blasting area
Backstepping method
Backstepping method
Backstepping method
Blast effect
evaluation
software
Predictive evaluation model
and software for
blasting vibration
Improved Anderson
model and nonlinear
Volterra functional
series model; full-time
prediction of particle vibration
Predicting PPV
value
Predicting PPV
value
Predicting PPV
value
Multi-dimensional
muck pile size
distribution
algorithm and
software
Automatically
completing the statistics
of muck pile size
distribution based on the
image processing
technology and realising
the multi-dimensional size statistics through
different interface
photo analysis
Image recognition
and manual
correction
None None
Comprehensive
evaluation model and software for
blasting effect
Conducting the refined
evaluation of post-
explosion blasting
effect based on optimisation theory,
linear programming and
fuzzy mathematics
Numerical simulation
None None
Software
integrating
blasting
design, optimisation
and effect
evaluation
Visualisation
Visualization module of design software
based on OpenGL
graphics library
Yes Yes Yes
Software operation
efficiency and
interface
Comprehensive
application of STL
standard template
library, WildMagic
math function library, quaternion etc. efficient
and user-friendly
Low efficiency Low efficiency Low efficiency
Storage and output
of results
Complete storage,
output and print
capabilities
Yes Yes Yes
- 264 -
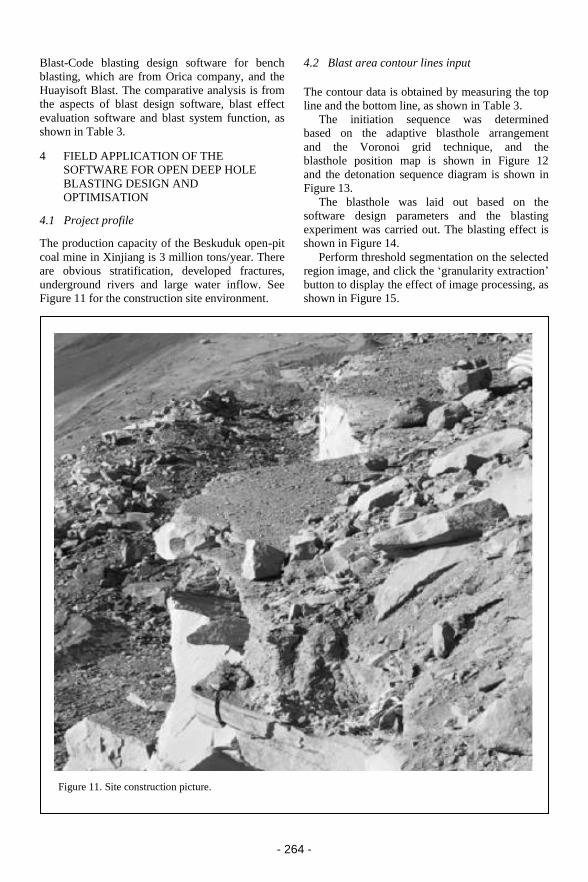
Figure 11. Site construction picture.
Blast-Code blasting design software for bench
blasting, which are from Orica company, and the
Huayisoft Blast. The comparative analysis is from
the aspects of blast design software, blast effect
evaluation software and blast system function, as
shown in Table 3.
4 FIELD APPLICATION OF THE
SOFTWARE FOR OPEN DEEP HOLE
BLASTING DESIGN AND
OPTIMISATION
4.1 Project profile
The production capacity of the Beskuduk open-pit
coal mine in Xinjiang is 3 million tons/year. There
are obvious stratification, developed fractures,
underground rivers and large water inflow. See
Figure 11 for the construction site environment.
4.2 Blast area contour lines input
The contour data is obtained by measuring the top
line and the bottom line, as shown in Table 3.
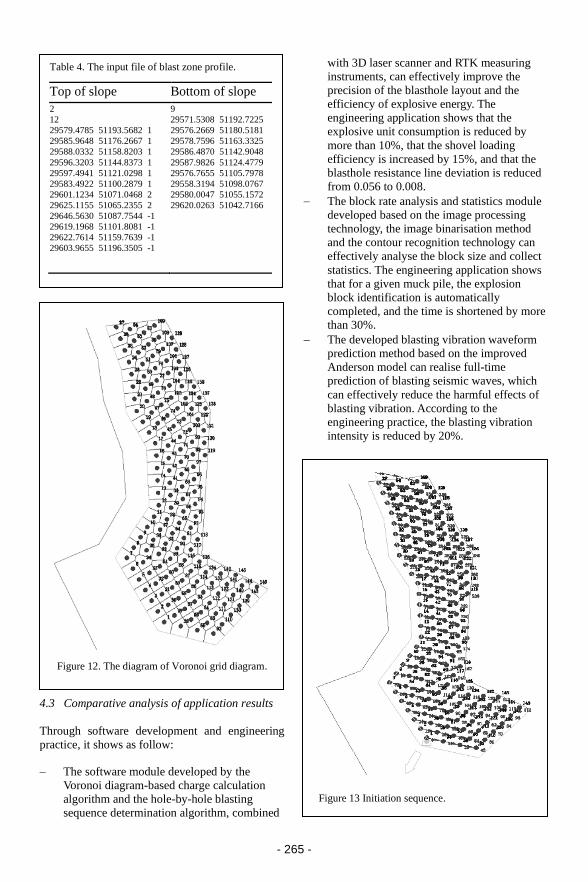
The initiation sequence was determined
based on the adaptive blasthole arrangement
and the Voronoi grid technique, and the
blasthole position map is shown in Figure 12
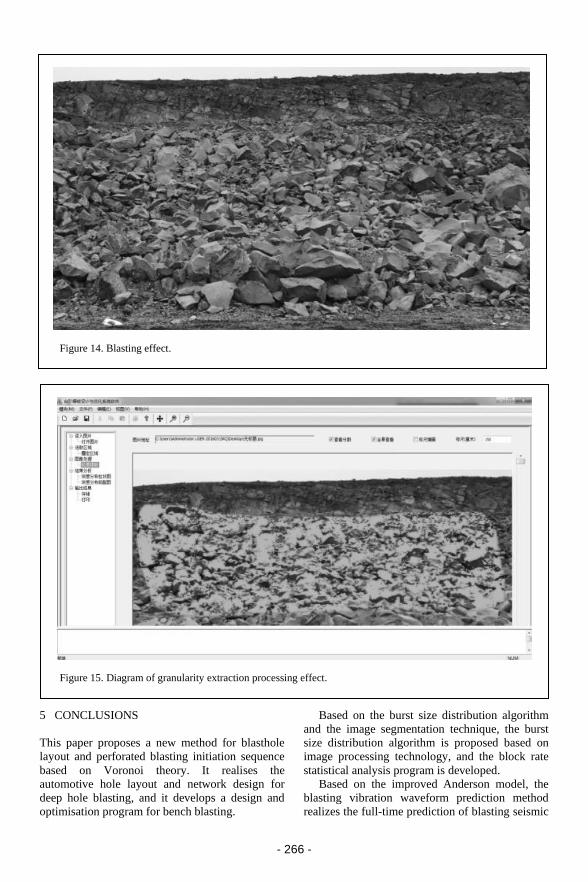
and the detonation sequence diagram is shown in
Figure 13.
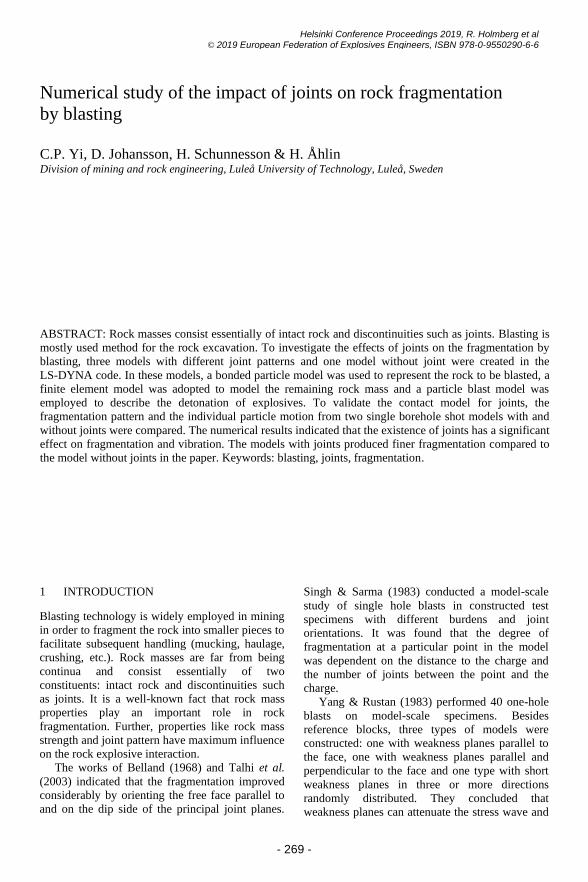
The blasthole was laid out based on the
software design parameters and the blasting
experiment was carried out. The blasting effect is
shown in Figure 14.
Perform threshold segmentation on the selected
region image, and click the ‘granularity extraction’
button to display the effect of image processing, as
shown in Figure 15.
- 265 -
Table 4. The input file of blast zone profile.
Top of slope Bottom of slope
2
12
29579.4785 51193.5682 1
29585.9648 51176.2667 1
29588.0332 51158.8203 1
29596.3203 51144.8373 1
29597.4941 51121.0298 1
29583.4922 51100.2879 1
29601.1234 51071.0468 2
29625.1155 51065.2355 2
29646.5630 51087.7544 -1
29619.1968 51101.8081 -1
29622.7614 51159.7639 -1
29603.9655 51196.3505 -1
9
29571.5308 51192.7225
29576.2669 51180.5181
29578.7596 51163.3325
29586.4870 51142.9048
29587.9826 51124.4779
29576.7655 51105.7978
29558.3194 51098.0767
29580.0047 51055.1572
29620.0263 51042.7166
Figure 12. The diagram of Voronoi grid diagram.
Figure 13 Initiation sequence.
4.3 Comparative analysis of application results
Through software development and engineering
practice, it shows as follow:
− The software module developed by the
Voronoi diagram-based charge calculation
algorithm and the hole-by-hole blasting
sequence determination algorithm, combined
with 3D laser scanner and RTK measuring
instruments, can effectively improve the
precision of the blasthole layout and the
efficiency of explosive energy. The
engineering application shows that the
explosive unit consumption is reduced by
more than 10%, that the shovel loading
efficiency is increased by 15%, and that the
blasthole resistance line deviation is reduced
from 0.056 to 0.008.
− The block rate analysis and statistics module
developed based on the image processing
technology, the image binarisation method
and the contour recognition technology can
effectively analyse the block size and collect
statistics. The engineering application shows
that for a given muck pile, the explosion
block identification is automatically
completed, and the time is shortened by more
than 30%.
− The developed blasting vibration waveform
prediction method based on the improved
Anderson model can realise full-time
prediction of blasting seismic waves, which
can effectively reduce the harmful effects of
blasting vibration. According to the
engineering practice, the blasting vibration
intensity is reduced by 20%.
- 266 -
Figure 14. Blasting effect.
Figure 15. Diagram of granularity extraction processing effect.
5 CONCLUSIONS
This paper proposes a new method for blasthole
layout and perforated blasting initiation sequence
based on Voronoi theory. It realises the
automotive hole layout and network design for
deep hole blasting, and it develops a design and
optimisation program for bench blasting.
Based on the burst size distribution algorithm
and the image segmentation technique, the burst
size distribution algorithm is proposed based on
image processing technology, and the block rate
statistical analysis program is developed.
Based on the improved Anderson model, the
blasting vibration waveform prediction method
realizes the full-time prediction of blasting seismic

- 267 -
waves, which effectively reduces the harmful
effects of blasting vibration.
A comprehensive evaluation module for
blasting effect is developed. It, with the
combination the optimisation theory, the linear
programming and the fuzzy mathematics, can
accurately and effectively predict blasting effects,
which can provide a decision-making basis for
blasting parameter optimisation.
REFERENCES
Chen, Q.S., Zhang, Q.L., Chen, X., Xiao C.C. &
Jiang Q. 2016. Prediction of blasting-vibration-
peak-speed based on GRA−GEP. Journal of
central South University (Natural Science
Edition), 47(07): 2441-2447.
Duan, Y., Xiong, D.Y. & Xu, G.Q. 2015. A new
technology for digital drilling and automatic
lithology identification. Metal Mine, (10): 125-
129.
Fei, H.L. & Guo, L.J. 2015. Digitization of blasting
construction. Proceedings of the eighth annual
conference of engineering and demolition
Specialised Committee of China mechanics
society and academic exchange conference,
Engineering blasting Specialised Committee of
China mechanics Society: Chinese Society of
Theoretical and Applied Mechanics,.
Guo, J.P., Wang, J. & Li, J.Q. 2017. Study on
optimum design of blasting hole arrangement in
medium-length hole blasting. Blasting, 34(03):
79-84+89.
Guo, L. et al. 2011. CAD secondary development of
medium-depth hole blasting design system based
on object/ARX. Applied Mechanics and
Materials, Vol. 65, pp. 285-290.
Hu, X.L., Qu, S.J., Jiang, W.L., Li, H., Yang, W.,
Huang, H.B. & Hu, G.Q. 2017. Attenuation law
of blasting induced ground vibrations based on
equivalent path. Explosion and Shock Waves,
37(06): 966-975.
Lei, Z., Yang, R.S., & Tao, T.J. 2015.
Comprehensive evaluation of bench blasting
effect based on uncertainty measurement theory.
Journal of China Coal Society, 40(02): 353-359.
Liu, B. & Wang, M.L. 2015. Overview of theory
maturity and feasibility application in digital
blasting. Proceedings of the eighth annual
conference of engineering and demolition
Specialised Committee of China mechanics
society and academic exchange conference,
Engineering blasting Specialised Committee of
China mechanics Society: Chinese Society of
Theoretical and Applied Mechanics.
Liu, J., Wu, M., Yun, B., Zhao, C.B. & Li, T.T. 2010.
Prediction of structure vibration induced by
potential ambient excitation. Chinese Journal of
Solid Mechanics, 31(S1): 143-151.
Liu, J., Zhang, Y. & Yun, B. 2012. A new method for
predicting nonlinear structural vibrations induced
by ground impact loading. Journal of Sound and
Vibration. 331: 2129-2140.
Qiu, X.Y., Shi, X.Z., Zhou, J., Huang, D. & Chen, X.
2017. On vibration reduction effect of short
millisecond blasting by high-precision detonator
based on HHT energy spectrum. Explosion and
Shock Waves, 37(01): 107-113.
Shen, S.W., Xu, J.C., Dai, S.L. & Xu, Y. 2013.
Extenics evaluation of joint rock tunnel blasting
quality based on entropy weighting method.
China Civil Engineering Journal, 46(12):
118-126.
Shi, J.J., Li, Q.Y., Zhang, Q., Wei, X. & Wang, H..
Forecast system for blasting vibration velocity
peak based on Matlab and BP neural network.
Explosion and Shock Waves, 37(06): 1087-1092.
Wang, M.Z., Shi, X.Z., Zhou, J. & Qiu, X.Y. 2018.
Multi-planar detection optimisation algorithm for
the interval charging structure of large-diameter
longhole blasting design based on rock
fragmentation aspects. Taylor and Francis Ltd.
Writing group of ‘Coal mining design manual’. 1987.
Mining design manual (2). Mineral exploration
roll (top). Beijing: China Architecture &
Building Press.
Xie, F., Han, L., Liu, D.S. & Li, C. 2018. Vibration
law analysis for a tunnel’s field near blasting
based on waveform superposition theory.
Vibration and Shock Waves, 37(02): 182-188.
Yu, D.X., Zhang Z.W., Zhou, X.D., Xiao, F., Tan Y.
& Zhao R.Q. 2010. Software development of
design and optimisation for hole-by-hole bench
blasting. Blasting, 27(01): 37-40.
Zhang, D.B., Chen, Z.Q., Yi, L.L. & Xu, H.X. 2018.
Binarisation representation of image
microstructure and the application of object
recognition. Journal of Electronics and
Information Technology, (03): 633-640.
Zhou, K.P., Shi, W.C., Wang, M.Z. & Ke, B. 2017.
Intelligent identification and auxiliary design for
blasting parameters of large diameter deep hole.
Blasting, 34(04): 73-79.

- 268 -
- 269 -
1 INTRODUCTION
Blasting technology is widely employed in mining
in order to fragment the rock into smaller pieces to
facilitate subsequent handling (mucking, haulage,
crushing, etc.). Rock masses are far from being
continua and consist essentially of two
constituents: intact rock and discontinuities such
as joints. It is a well-known fact that rock mass
properties play an important role in rock
fragmentation. Further, properties like rock mass
strength and joint pattern have maximum influence
on the rock explosive interaction.
The works of Belland (1968) and Talhi et al.
(2003) indicated that the fragmentation improved
considerably by orienting the free face parallel to
and on the dip side of the principal joint planes.
Singh & Sarma (1983) conducted a model-scale
study of single hole blasts in constructed test
specimens with different burdens and joint
orientations. It was found that the degree of
fragmentation at a particular point in the model
was dependent on the distance to the charge and
the number of joints between the point and the
charge.
Yang & Rustan (1983) performed 40 one-hole
blasts on model-scale specimens. Besides
reference blocks, three types of models were
constructed: one with weakness planes parallel to
the face, one with weakness planes parallel and
perpendicular to the face and one type with short
weakness planes in three or more directions
randomly distributed. They concluded that
weakness planes can attenuate the stress wave and
Numerical study of the impact of joints on rock fragmentation
by blasting
C.P. Yi, D. Johansson, H. Schunnesson & H. Åhlin Division of mining and rock engineering, Luleå University of Technology, Luleå, Sweden
ABSTRACT: Rock masses consist essentially of intact rock and discontinuities such as joints. Blasting is
mostly used method for the rock excavation. To investigate the effects of joints on the fragmentation by
blasting, three models with different joint patterns and one model without joint were created in the
LS-DYNA code. In these models, a bonded particle model was used to represent the rock to be blasted, a
finite element model was adopted to model the remaining rock mass and a particle blast model was
employed to describe the detonation of explosives. To validate the contact model for joints, the
fragmentation pattern and the individual particle motion from two single borehole shot models with and
without joints were compared. The numerical results indicated that the existence of joints has a significant
effect on fragmentation and vibration. The models with joints produced finer fragmentation compared to
the model without joints in the paper. Keywords: blasting, joints, fragmentation.
Helsinki Conference Proceedings 2019, R. Holmberg et al © 2019 European Federation of Explosives Engineers, ISBN 978-0-9550290-6-6
- 270 -
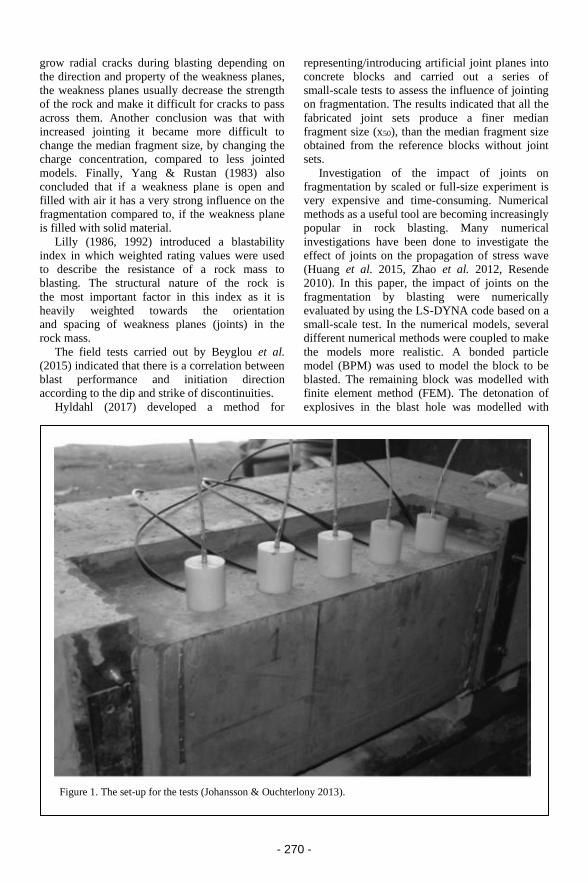
Figure 1. The set-up for the tests (Johansson & Ouchterlony 2013).
grow radial cracks during blasting depending on
the direction and property of the weakness planes,
the weakness planes usually decrease the strength
of the rock and make it difficult for cracks to pass
across them. Another conclusion was that with
increased jointing it became more difficult to
change the median fragment size, by changing the
charge concentration, compared to less jointed
models. Finally, Yang & Rustan (1983) also
concluded that if a weakness plane is open and
filled with air it has a very strong influence on the
fragmentation compared to, if the weakness plane
is filled with solid material.
Lilly (1986, 1992) introduced a blastability
index in which weighted rating values were used
to describe the resistance of a rock mass to
blasting. The structural nature of the rock is
the most important factor in this index as it is
heavily weighted towards the orientation
and spacing of weakness planes (joints) in the
rock mass.
The field tests carried out by Beyglou et al.
(2015) indicated that there is a correlation between
blast performance and initiation direction
according to the dip and strike of discontinuities.
Hyldahl (2017) developed a method for
representing/introducing artificial joint planes into
concrete blocks and carried out a series of
small-scale tests to assess the influence of jointing
on fragmentation. The results indicated that all the
fabricated joint sets produce a finer median
fragment size (x50), than the median fragment size
obtained from the reference blocks without joint
sets.
Investigation of the impact of joints on
fragmentation by scaled or full-size experiment is
very expensive and time-consuming. Numerical
methods as a useful tool are becoming increasingly
popular in rock blasting. Many numerical
investigations have been done to investigate the
effect of joints on the propagation of stress wave
(Huang et al. 2015, Zhao et al. 2012, Resende
2010). In this paper, the impact of joints on the
fragmentation by blasting were numerically
evaluated by using the LS-DYNA code based on a
small-scale test. In the numerical models, several
different numerical methods were coupled to make
the models more realistic. A bonded particle
model (BPM) was used to model the block to be
blasted. The remaining block was modelled with
finite element method (FEM). The detonation of
explosives in the blast hole was modelled with
- 271 -
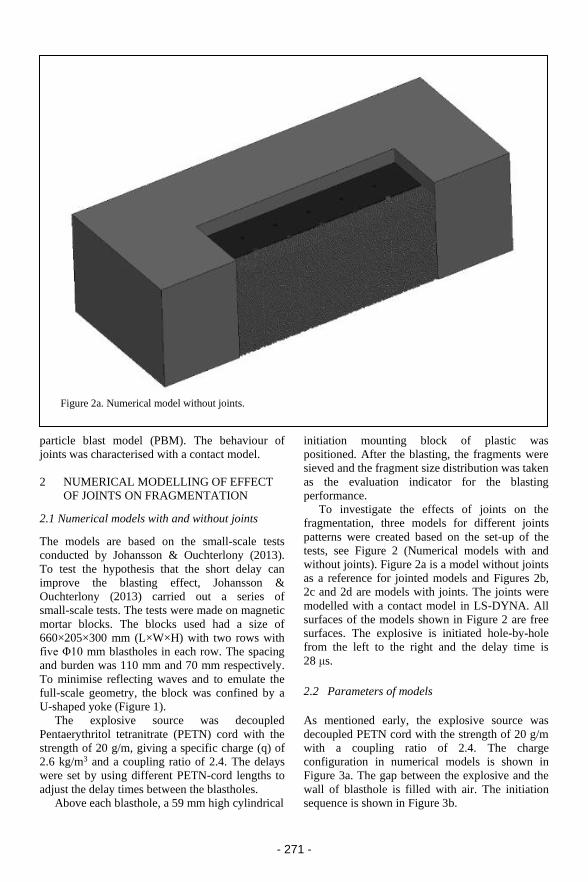
Figure 2a. Numerical model without joints.
particle blast model (PBM). The behaviour of
joints was characterised with a contact model.
2 NUMERICAL MODELLING OF EFFECT
OF JOINTS ON FRAGMENTATION
2.1 Numerical models with and without joints
The models are based on the small-scale tests
conducted by Johansson & Ouchterlony (2013).
To test the hypothesis that the short delay can
improve the blasting effect, Johansson &
Ouchterlony (2013) carried out a series of
small-scale tests. The tests were made on magnetic
mortar blocks. The blocks used had a size of
660×205×300 mm (L×W×H) with two rows with
five Φ10 mm blastholes in each row. The spacing
and burden was 110 mm and 70 mm respectively.
To minimise reflecting waves and to emulate the
full-scale geometry, the block was confined by a
U-shaped yoke (Figure 1).
The explosive source was decoupled
Pentaerythritol tetranitrate (PETN) cord with the
strength of 20 g/m, giving a specific charge (q) of
2.6 kg/m3 and a coupling ratio of 2.4. The delays
were set by using different PETN-cord lengths to
adjust the delay times between the blastholes.
Above each blasthole, a 59 mm high cylindrical
initiation mounting block of plastic was
positioned. After the blasting, the fragments were
sieved and the fragment size distribution was taken
as the evaluation indicator for the blasting
performance.
To investigate the effects of joints on the
fragmentation, three models for different joints
patterns were created based on the set-up of the
tests, see Figure 2 (Numerical models with and
without joints). Figure 2a is a model without joints
as a reference for jointed models and Figures 2b,
2c and 2d are models with joints. The joints were
modelled with a contact model in LS-DYNA. All
surfaces of the models shown in Figure 2 are free
surfaces. The explosive is initiated hole-by-hole
from the left to the right and the delay time is
28 μs.
2.2 Parameters of models
As mentioned early, the explosive source was
decoupled PETN cord with the strength of 20 g/m
with a coupling ratio of 2.4. The charge
configuration in numerical models is shown in
Figure 3a. The gap between the explosive and the
wall of blasthole is filled with air. The initiation
sequence is shown in Figure 3b.

- 272 -
Figure 2b. Joint set I, Strike/dip = 0°/90°.
Figure 2c. Joint set II, Strike/dip = 15°/90°.
The detonation of explosives is described with
the particle blast method. A co-volume effect has
been introduced in this method to better represent
gas behaviour at extreme pressure. For an efficient
contact treatment, the particles are given a
spherical shape. The particle-structure interactions
are purely elastic collision. Each particle contains
translational energy and spin energy. The balance
between translational energy and spin energy is
determined directly from the heat capacities.
By grouping many molecules as one particle,
the particle blast method reduces the degree of

- 273 -
Figure 2d. Joint set III, Strike/dip = 0°/75°.
Figure 3a. Charge configuration.
freedom of the system by several orders of
magnitude. The parameters used in the particle
blast method of the PETN explosive are shown in
Table 1.
The detonation velocity D, internal energy E,
and density were taken from the Jones-Wilkins-
Lee (JWL) (Lee et al. 1968) equation of state
parameters of PETN explosive (Dobratz &
Crawford 1985). The heat capacity ratio γ
was also derived from the JWL equation of
state parameter ω as γ =1+ ω. Co-volume
coefficient b is from similar explosives. The
built-in parameters of air in LS-DYNA is shown in
Table 2.

- 274 -
Figure 3b. Initiation sequence with delay time of 28 μs.
Table 1. Parameters of PETN.
D (m/s) γ 𝜌
(Kg/m3) E (J/m3) b
7450 1.28 1500 8.56E9 0.35
Table 2. Parameters of air (Teng, personal communication).
𝜌
(Kg/m3)
E
(J/m3)
Heat capacity
ratio
1.27 2.53 1.4
Bond particle models to ‘bond’ the particles
have been developed in the LS-DYNA code,
which originated the work of Potyondy & Cundall
(2004). This makes modelling of a continuum
possible. The bond models can be used to simulate
the mechanical behaviour of an elastic solid as
well as brittle fracture analysis (Karajan et al.
2013). Herein, all spherical particles are linked to
their neighbouring particles using bonds which
represent the complete mechanical behaviour of
solid mechanics, see Figure 4. Bonds are
independent of the DEM. Each bond is subjected
to tension, bending, twisting and shearing. Bonds
are calculated from the bulk and shear modulus of
materials. Rock rupture is represented explicitly as
broken bonds.
In the model, there are 77,550 spherical
particles with 3 mm radius. The parameters of the
bonded particles are listed in Table 3.
The yoke is represented with FEM and the rigid
body material is used for the yoke because the
strength of yoke is much higher than that of the
blasted block. The remaining part is represented
with FEM and the Riedel-Hiermaier-Thoma
(RHT) (Riedel et al. 1999) material is used to
describe the dynamic response of the remaining
part. The RHT material model in the LS-DYNA
code is an advanced damage plasticity model for
brittle materials such as concrete and rock. The
material model involves three limit surfaces which

- 275 -
Figure 4b. Bonded particle model and possible
force and moment transmission modes between
two bonded particles (Karajan, et al. 2013).
Table 3. Parameters of bonded particles.
Particle properties:
- Particle contact modulus (GPa) 21.9
- Scale factor of normal spring
constant
0.01
- Scale factor of shear spring
constant
0.00286
- Static coefficient of friction 0.51
- Rolling friction coefficient 0.1
Parallel-bond properties:
- Shear stiffness/normal stiffness 0.5
- Parallel-bond modulus (GPa) 31.9
- Parallel-bond normal strength
(MPa)
60.0
- Parallel-bond shear strength
(MPa)
100.0
describe the strength of the material shown in
Figure 5. The first surface is the yield surface
which is limited by a cap surface. Beyond this
surface, the material starts to deform plastically
with a linear hardening description. When the
material reaches the failure surface, the damage of
the material starts to evolve until the damage is
equal to one. When the residual surface is reached,
the material is considered to be fully damaged and
the strength is determined by a residual surface.
The strain rate effect is also included in this
model.
In this model, the damage level is defined using
, where is the accumulated plastic
strain and is the failure strain. D=1 means fully
damaged while D=0 means undamaged. The main
parameters of the RHT material model are listed in
Table 4. In Table 4, 𝜌 is the density and G is the
shear modulus, σc is the uniaxial compressive
strength and σt is the uniaxial tensile strength.
Figure 4a. Bonded particle model and possible
force and moment transmission modes between two bonded particles (Karajan, et al. 2013).
Figure 4c. Bonded particle model and possible
force and moment transmission modes between
two bonded particles (Karajan, et al. 2013).

- 276 -
Table 4. Parameters of mortar.
𝜌
(kg/m3)
G
(GPa)
σc
(MPa)
σt
(MPa)
2511 8.98 50.7 5.22
Table 5. Percentile sizes X30, X50 and X80 for four
cases.
Size No
joint
Joint
set I
Joint
set II
Joint
set
III
Fraction
(mm)
X30 10.41 8.15 9.4 10.52
X50 43.98 38.88 34.47 35.59
X80 69.24 49.11 54.25 51.6
2.3 Fragmentation analysis
The fragmentation patterns of the models with and
without joints are shown in Figure 6. It can be
seen from Figure 6 that many particles gather
together still after blasting and form a lot of
fragments which consist of different numbers of
particles. In order to evaluate the fragment size
distribution of each case after blasting, a code
combining Fortran and Perl programming
languages was developed. In the code, a collection
of particles in which the distances between two
adjacent particles are equal to the diameter of
particles are treated as a fragment. The size of the
fragments is the cube root of the volume of a
fragment. The volume of a fragment is the sum of
volumes of the particles that make up the
fragment. It can be seen from Figure 6 that some
particles at the corners do not move during the
blasting. Similar phenomena can be found in
small-scale tests, see Figure 6. Particles with
displacement less than 2 mm are removed from the
fragments in the code.
The fragment size distribution for four cases is
shown in Figure 7. Figure 7 indicates that the
existence of joints in the investigated cases
improves the fragmentation compared to the
reference case. For the fine fragment part, all cases
have the similar size distribution. For the big
fragment part, the models with joints give finer
fragments compared to the reference case, which
means the existence of joints benefits to reduce the
boulder in the cases.
Table 5 shows the percentile sizes X30, X50
and X80. The values correspond to the cumulative
mass passing 30 %, 50 % and 80 %, respectively,
based on linear interpolation between the two
nearest fragment sizes in the size distribution
graph.
If X50 is taken as the evaluation indicator for
fragmentation, the improvement of X50 is 11.6%,
21.6% and 19.2% for the cases of Joint set I, Joint
set II and Joint set III, respectively, which means
the joint pattern can affect the fragmentation. A
careful adaptation of blast design to existing
discontinuities can yield significant improvement
in fragmentation and therefore save the cost of
production. However, the potential improvements
are directly linked to the actual joint sets
in the rock mass to be blasted and must be
Figure 5. Stress limit surfaces and loading scenario in the RHT model (Yi et al. 2017).

- 277 -
Figure 6b. Fragmentation pattern of the model with joint set I.
Figure 6a. Fragmentation pattern of the model without joints.

- 278 -
Figure 6c. Fragmentation pattern of the model with joint set II.
Figure 6d. Fragmentation pattern of the models with joint set III.
- 279 -
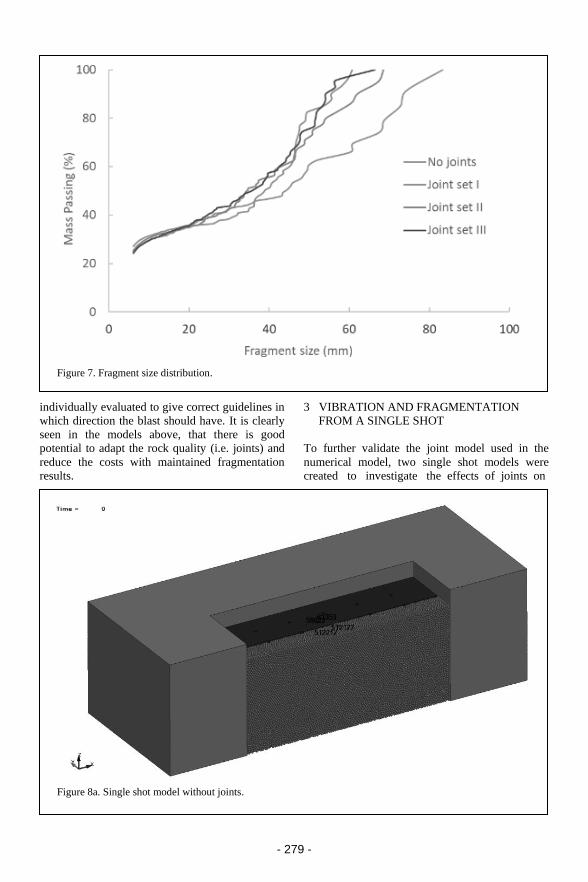
Figure 7. Fragment size distribution.
Figure 8a. Single shot model without joints.
individually evaluated to give correct guidelines in
which direction the blast should have. It is clearly
seen in the models above, that there is good
potential to adapt the rock quality (i.e. joints) and
reduce the costs with maintained fragmentation
results.
3 VIBRATION AND FRAGMENTATION
FROM A SINGLE SHOT
To further validate the joint model used in the
numerical model, two single shot models were
created to investigate the effects of joints on
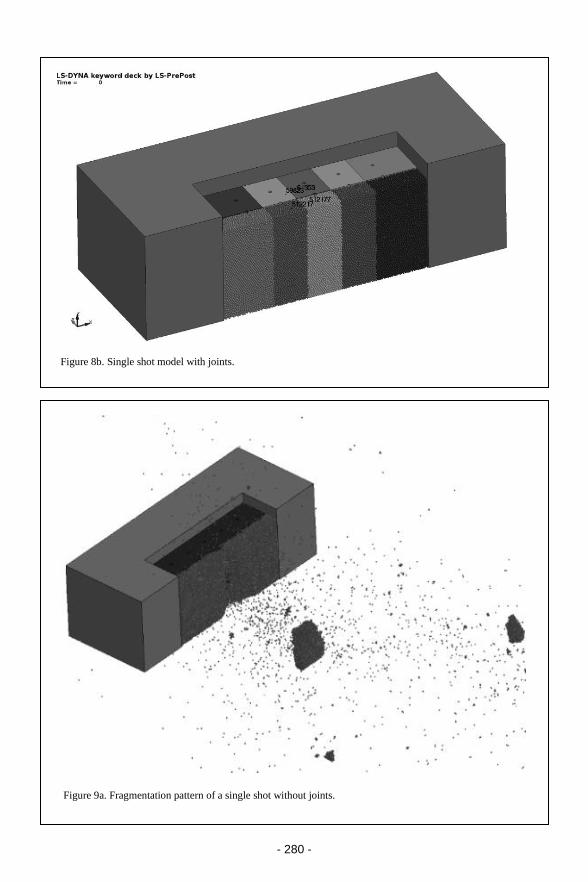
- 280 -
Figure 8b. Single shot model with joints.
Figure 9a. Fragmentation pattern of a single shot without joints.
- 281 -
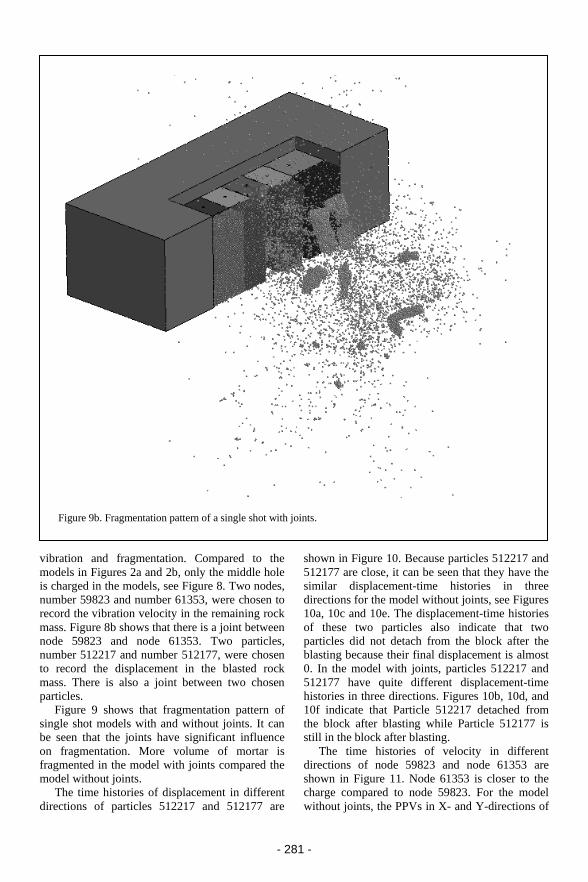
Figure 9b. Fragmentation pattern of a single shot with joints.
vibration and fragmentation. Compared to the
models in Figures 2a and 2b, only the middle hole
is charged in the models, see Figure 8. Two nodes,
number 59823 and number 61353, were chosen to
record the vibration velocity in the remaining rock
mass. Figure 8b shows that there is a joint between
node 59823 and node 61353. Two particles,
number 512217 and number 512177, were chosen
to record the displacement in the blasted rock
mass. There is also a joint between two chosen
particles.
Figure 9 shows that fragmentation pattern of
single shot models with and without joints. It can
be seen that the joints have significant influence
on fragmentation. More volume of mortar is
fragmented in the model with joints compared the
model without joints.
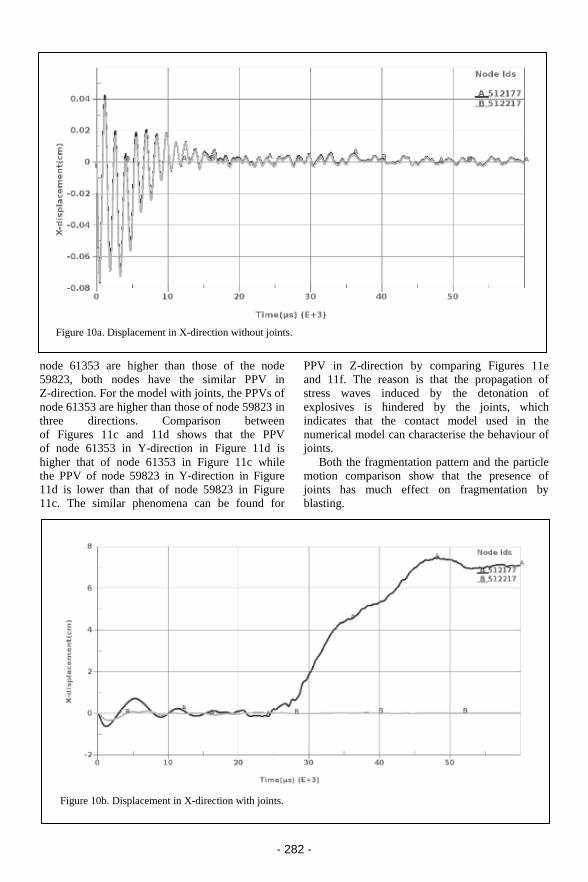
The time histories of displacement in different
directions of particles 512217 and 512177 are
shown in Figure 10. Because particles 512217 and
512177 are close, it can be seen that they have the
similar displacement-time histories in three
directions for the model without joints, see Figures
10a, 10c and 10e. The displacement-time histories
of these two particles also indicate that two
particles did not detach from the block after the
blasting because their final displacement is almost
0. In the model with joints, particles 512217 and
512177 have quite different displacement-time
histories in three directions. Figures 10b, 10d, and
10f indicate that Particle 512217 detached from
the block after blasting while Particle 512177 is
still in the block after blasting.
The time histories of velocity in different
directions of node 59823 and node 61353 are
shown in Figure 11. Node 61353 is closer to the
charge compared to node 59823. For the model
without joints, the PPVs in X- and Y-directions of
- 282 -
Figure 10a. Displacement in X-direction without joints.
Figure 10b. Displacement in X-direction with joints.
node 61353 are higher than those of the node
59823, both nodes have the similar PPV in
Z-direction. For the model with joints, the PPVs of
node 61353 are higher than those of node 59823 in
three directions. Comparison between
of Figures 11c and 11d shows that the PPV
of node 61353 in Y-direction in Figure 11d is
higher that of node 61353 in Figure 11c while
the PPV of node 59823 in Y-direction in Figure
11d is lower than that of node 59823 in Figure
11c. The similar phenomena can be found for
PPV in Z-direction by comparing Figures 11e
and 11f. The reason is that the propagation of
stress waves induced by the detonation of
explosives is hindered by the joints, which
indicates that the contact model used in the
numerical model can characterise the behaviour of
joints.
Both the fragmentation pattern and the particle
motion comparison show that the presence of
joints has much effect on fragmentation by
blasting.

- 283 -
Figure 10c. Displacement in Y-direction without joints.
Figure 10d. Displacement in Y-direction with joints.
Figure 10e. Displacement in Z-direction without joints.

- 284 -
Figure 11a. Velocity in X-direction without joints.
Figure 11b. Velocity in X-direction with joints.
Figure 10f. Displacement in Z-direction with joints.
- 285 -
Figure 11d. Velocity in Y-direction with joints.
Figure 11e. Velocity in Z-direction without joints.
Figure 11c. Velocity in Y-direction without joints.

- 286 -
Figure 11f. Velocity in Z-direction with joints.
4 CONCLUSION
A coupled FEM-PBM-BPM model was used to
investigate the effects of joints on fragmentation
and vibration. The behaviour of joints was
characterised with a contact model. The
preliminary results indicate that the existence of
joints has much effect on fragmentation and
vibration. A careful adaptation of blast design to
existing discontinuities could yield significant
improvement in fragmentation and therefore save
the cost of production.
In the research, some simple joint patterns
were used. In practice, the patterns of joints in
rock mass could be complicated. The orientation
of the joint planes depends on two characteristic
attributes of strike and dip. The effects of
orientation of the joint planes, the contact stiffness
of joint planes and the spacing of joints on
fragmentation and vibration will be studied in the
future.
5 ACKNOWLEDGEMENTS
The authors would like to thank the support from
the project of SLIM funded by the European
Union’s Horizon 2020 research and innovation
program under grant agreement nº 730294,
VINNOVA and Centre of Advanced Mining &
Metallurgy (CAMM2) at LTU which are
gratefully acknowledged.
REFERENCES
Belland, J.M. 1968. Structure as a control in rock
fragmentation Coal Lake iron ore deposit. The
Canadian Mining and Metallurgical Bulletin,
59:323-328.
Byglou, A., Schunnesson, H., Johansson, D.,
Johansson N. 2015. Adjusting initiation direction
to domains of rock mass discontinuities in Aitik
open pit mine. Proceedings of the 11th
International symposium on rock fragmentation
by blasting: Fragblast 11, Sydney, AusIMM, pp.
385–391.
Dobratz, B.M. & Crawford, P.C, 1985. LLNL
Explosives Handbook: Properties of chemical
explosives and explosive simulants. Livermore,
CA, USA.
Fourney, W.L., Barker, D.B. & Holloway, D.C. 1983.
Fragmentation in jointed rock material.
Proceedings 1st International symposium on rock
fragmentation by blasting, Luleå, Sweden.
Huang, X., Qi, S., Williams, A., Zou Y. & Zheng B.
2015. Numerical simulation of stress wave
propagating through filled joints by particle
model. International journal of solids and
structures, 70:23-33.
Hyldahl, J. 2018. Effects of jointing on
fragmentation--design and influence of joints in
small scale testing. Master thesis, Luleå
University of Technology: Luleå.
Johansson, D. & Ouchterlony, F. 2013. Shock wave
interactions in rock blasting – the use of short
delays to improve frag-mentation in model-scale.
Rock mechanics and rock engineering, 46:1-18.
Karajan, N., Han, Z., Teng, H. & Wang, J. 2013.
Interaction possibilities of bonded and loose
particles in LS-DYNA [online]. Available from:

- 287 -
<https://www.dynamore.de/en/downloads/infoda
ys/dokumente/2013-multiphysik > [Accessed 18
July 2019].
Lee, E.L., Horning, H.C. & Kury, J.W. 1968.
Adiabatic expansion of high explosives
detonation products, Lawrence Livermore
National Laboratory, University of California,
Livermore, TID 4500-UCRL50422.
Lilly, P A, 1986. An empirical method of assessing
rock mass blastability. Proceedings large open
pit mining conference, pp 89–92.
Lilly, P A, 1992. The use of the blastability index in
the design of blasts for open pit mines.
Proceedings West Australian conference on
mining geomechanics.
Nur K., Hareyani Z., Kamar A. & Mohd M.H. 2016.
Effect of geological condition on degree of
fragmentation in a Simpang Pulai Marble quarry.
Procedia Chemistry 19: 694-701.
Potyondy, D.O. & Cundall, P.A. 2004. A bonded-
particle model for rock. International journal of
rock mechanics and mining sciences, 41 (8):
1329-1364.
Riedel, W., Thoma, K., Hiermaier, S. & Schmolinske,
E. 1999. Penetration of reinforced concrete by
BETA-B-500, numerical analysis using a new
macroscopic concrete model for hydrocodes. In
SKA(ed.), Proceedings of the 9th International
symposium on interaction of the effects of
munitions with structures: 315-322, Berlin.
Resende, R. 2010. An investigation of stress wave
propagation through rock joints and rock masses.
Doctoral thesis. Porto University, Portugal.
Singh, D.P. & Sarma, K.S. 1983. Influence of joints
on rock blasting – a model scale study.
Proceedings 1st International symposium on rock
fragmentation by blasting, volume 2, Luleå,
Sweden.
Talhi, K. & Bensaker, B. 2003. Design of a model
blasting system to measure peak p-wave stress.
Soil dynamics and earthquake engineering,
23(6): 513-519.
Yang, Z.G. & Rustan, A. 1983. The influence from
primary structure on fragmentation. Proceedings
1st International symposium on rock
fragmentation by blasting, Luleå, Sweden.
Yi, C., Sjöberg, J., Johansson, D. & Petropoulos, N.
2017. A numerical study of the impact of short
delays on rock fragmentation. International
journal of rock mechanics and mining sciences,
100: 250-254.
Zhao, J., Sun, L. & Zhu, J. 2012. Modelling P-wave
transmission across rock fractures by particle
manifold method (PMM). Geomech. geoeng. 7,
175-181.

- 288 -
- 289 -
1 INTRODUCTION
Remote-controlled camera drones have reached a
level of maturity which allow their routine
application in surface mining and quarrying for
acquiring aerial imagery at high quality and
resolution. Ongoing development in digital
photogrammetry allows for a rapid and consistent
processing of large sets of overlapping photos to
registered 3D models. By using such 3D models
several surveying and assessment tasks in surface
mining are addressed such as stockpile
measurements, mine planning, or stability
assessments. This contribution deals with the
design of surface blasts based on 3D models.
Pro-active blast design includes the adaptation
of the borehole locations according the actual
shape of the bench face (Moser et al. 2007). By
doing so blasting results are improved, flyrock is
omitted, and production costs may be significantly
lowered (Stewart 2017).
A new approach for placing boreholes under
special consideration of geometric constraints is
used to provide an automatic pro-active blast
design pattern. It uses the novel concept of
so-called minimum burden surfaces, i.e. the sum
of locations where the minimum burden constraint
is fulfilled.
The presented procedure shall not replace the
responsibility and the experience of the shotfirer
but rather support tedious adaptation work when
having complex blast sites.
2 3D MODEL GENERATION
2.1 Structure from Motion
Photogrammetry enables to generate three-
dimensional models from a series of overlapping
photographs. The introduction of the Structure
from Motion concept (Snavely et al. 2014) as well
the broad availability of drones brought a
Optimising blast layouts by aerial imagery and automatic
placement of boreholes
A. Gaich, M. Pötsch & P. Hergan 3GSM GmbH, Graz, Austria
ABSTRACT: The paper presents a new concept for designing surface blasts. It is a pure geometric
approach relying on comprehensive and accurate 3D surface models of the entire area to blast.
Photogrammetric 3D models from aerial imagery are used as for that purpose. The new approach uses the
minimum burden concept and extends it with so-called minimum burden surfaces that form the basis for
an automatic placement of the boreholes. The concept is especially useful at more complex or irregularly
shaped blast sites as shown in the contribution.
Helsinki Conference Proceedings 2019, R. Holmberg et al © 2019 European Federation of Explosives Engineers, ISBN 978-0-9550290-6-6
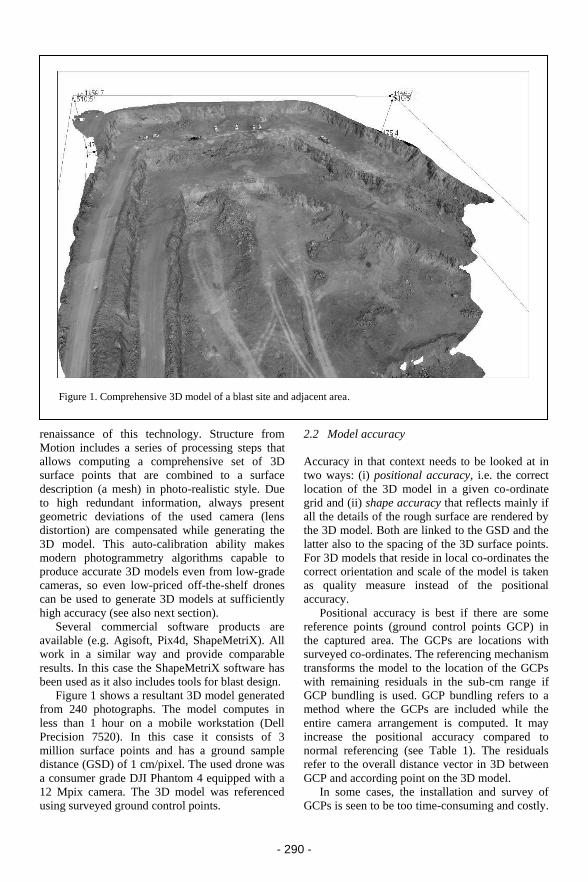
- 290 -
Figure 1. Comprehensive 3D model of a blast site and adjacent area.
renaissance of this technology. Structure from
Motion includes a series of processing steps that
allows computing a comprehensive set of 3D
surface points that are combined to a surface
description (a mesh) in photo-realistic style. Due
to high redundant information, always present
geometric deviations of the used camera (lens
distortion) are compensated while generating the
3D model. This auto-calibration ability makes
modern photogrammetry algorithms capable to
produce accurate 3D models even from low-grade
cameras, so even low-priced off-the-shelf drones
can be used to generate 3D models at sufficiently
high accuracy (see also next section).
Several commercial software products are
available (e.g. Agisoft, Pix4d, ShapeMetriX). All
work in a similar way and provide comparable
results. In this case the ShapeMetriX software has
been used as it also includes tools for blast design.
Figure 1 shows a resultant 3D model generated
from 240 photographs. The model computes in
less than 1 hour on a mobile workstation (Dell
Precision 7520). In this case it consists of 3
million surface points and has a ground sample
distance (GSD) of 1 cm/pixel. The used drone was
a consumer grade DJI Phantom 4 equipped with a
12 Mpix camera. The 3D model was referenced
using surveyed ground control points.
2.2 Model accuracy
Accuracy in that context needs to be looked at in
two ways: (i) positional accuracy, i.e. the correct
location of the 3D model in a given co-ordinate
grid and (ii) shape accuracy that reflects mainly if
all the details of the rough surface are rendered by
the 3D model. Both are linked to the GSD and the
latter also to the spacing of the 3D surface points.
For 3D models that reside in local co-ordinates the
correct orientation and scale of the model is taken
as quality measure instead of the positional
accuracy.
Positional accuracy is best if there are some
reference points (ground control points GCP) in
the captured area. The GCPs are locations with
surveyed co-ordinates. The referencing mechanism
transforms the model to the location of the GCPs
with remaining residuals in the sub-cm range if
GCP bundling is used. GCP bundling refers to a
method where the GCPs are included while the
entire camera arrangement is computed. It may
increase the positional accuracy compared to
normal referencing (see Table 1). The residuals
refer to the overall distance vector in 3D between
GCP and according point on the 3D model.
In some cases, the installation and survey of
GCPs is seen to be too time-consuming and costly.
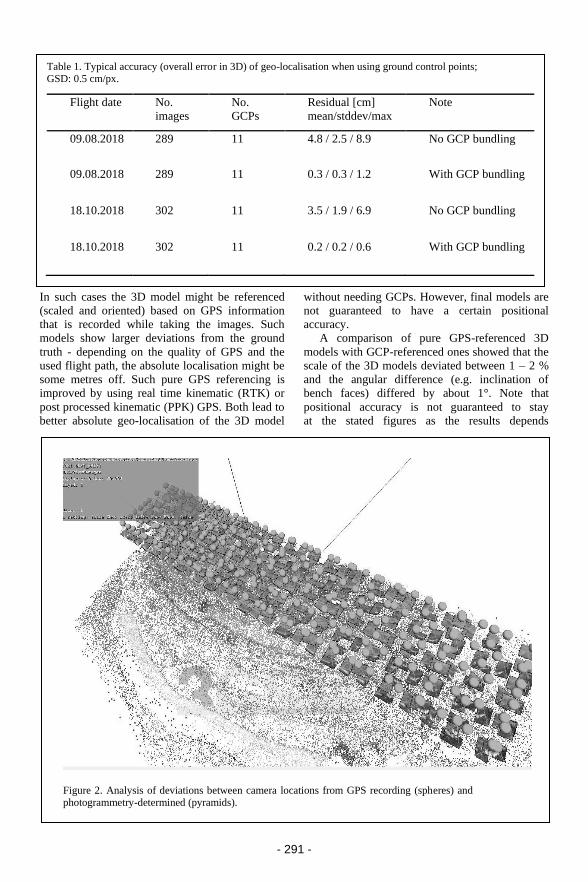
- 291 -
Table 1. Typical accuracy (overall error in 3D) of geo-localisation when using ground control points; GSD: 0.5 cm/px.
Flight date No.
images
No.
GCPs
Residual [cm]
mean/stddev/max
Note
09.08.2018 289 11 4.8 / 2.5 / 8.9 No GCP bundling
09.08.2018 289 11 0.3 / 0.3 / 1.2 With GCP bundling
18.10.2018 302 11 3.5 / 1.9 / 6.9 No GCP bundling
18.10.2018 302 11 0.2 / 0.2 / 0.6 With GCP bundling
Figure 2. Analysis of deviations between camera locations from GPS recording (spheres) and photogrammetry-determined (pyramids).
In such cases the 3D model might be referenced
(scaled and oriented) based on GPS information
that is recorded while taking the images. Such
models show larger deviations from the ground
truth - depending on the quality of GPS and the
used flight path, the absolute localisation might be
some metres off. Such pure GPS referencing is
improved by using real time kinematic (RTK) or
post processed kinematic (PPK) GPS. Both lead to
better absolute geo-localisation of the 3D model
without needing GCPs. However, final models are
not guaranteed to have a certain positional
accuracy.
A comparison of pure GPS-referenced 3D
models with GCP-referenced ones showed that the
scale of the 3D models deviated between 1 – 2 %
and the angular difference (e.g. inclination of
bench faces) differed by about 1°. Note that
positional accuracy is not guaranteed to stay
at the stated figures as the results depends
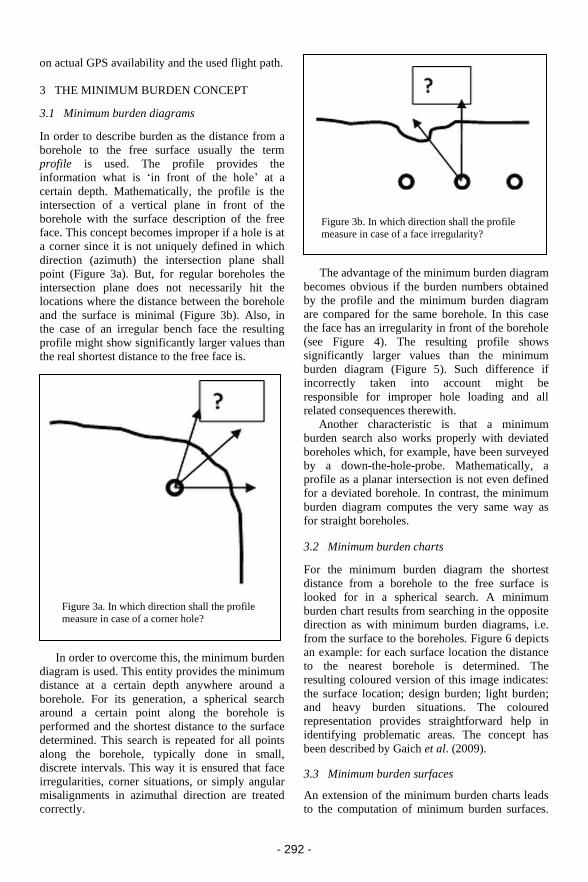
- 292 -
Figure 3a. In which direction shall the profile
measure in case of a corner hole?
Figure 3b. In which direction shall the profile
measure in case of a face irregularity?
on actual GPS availability and the used flight path.
3 THE MINIMUM BURDEN CONCEPT
3.1 Minimum burden diagrams
In order to describe burden as the distance from a
borehole to the free surface usually the term
profile is used. The profile provides the
information what is ‘in front of the hole’ at a
certain depth. Mathematically, the profile is the
intersection of a vertical plane in front of the
borehole with the surface description of the free
face. This concept becomes improper if a hole is at
a corner since it is not uniquely defined in which
direction (azimuth) the intersection plane shall
point (Figure 3a). But, for regular boreholes the
intersection plane does not necessarily hit the
locations where the distance between the borehole
and the surface is minimal (Figure 3b). Also, in
the case of an irregular bench face the resulting
profile might show significantly larger values than
the real shortest distance to the free face is.
In order to overcome this, the minimum burden
diagram is used. This entity provides the minimum
distance at a certain depth anywhere around a
borehole. For its generation, a spherical search
around a certain point along the borehole is
performed and the shortest distance to the surface
determined. This search is repeated for all points
along the borehole, typically done in small,
discrete intervals. This way it is ensured that face
irregularities, corner situations, or simply angular
misalignments in azimuthal direction are treated
correctly.
The advantage of the minimum burden diagram
becomes obvious if the burden numbers obtained
by the profile and the minimum burden diagram
are compared for the same borehole. In this case
the face has an irregularity in front of the borehole
(see Figure 4). The resulting profile shows
significantly larger values than the minimum
burden diagram (Figure 5). Such difference if
incorrectly taken into account might be
responsible for improper hole loading and all
related consequences therewith. Another characteristic is that a minimum
burden search also works properly with deviated
boreholes which, for example, have been surveyed
by a down-the-hole-probe. Mathematically, a
profile as a planar intersection is not even defined
for a deviated borehole. In contrast, the minimum
burden diagram computes the very same way as
for straight boreholes.
3.2 Minimum burden charts
For the minimum burden diagram the shortest
distance from a borehole to the free surface is
looked for in a spherical search. A minimum
burden chart results from searching in the opposite
direction as with minimum burden diagrams, i.e.
from the surface to the boreholes. Figure 6 depicts
an example: for each surface location the distance
to the nearest borehole is determined. The
resulting coloured version of this image indicates:
the surface location; design burden; light burden;
and heavy burden situations. The coloured
representation provides straightforward help in
identifying problematic areas. The concept has
been described by Gaich et al. (2009).
3.3 Minimum burden surfaces
An extension of the minimum burden charts leads
to the computation of minimum burden surfaces.

- 293 -
Figure 4. 3D model with a single profile; circle marks an irregularity (remainder of a detached block).
The minimum burden surface is a geometric entity
that consists of those locations where a borehole
should be in order to fulfil the minimum burden
criterion. So, any borehole that is placed on the
minimum burden surface therefore leads to a best
possible minimum burden diagram.
The minimum burden surface is computed
starting from the free face and identifying
locations that are at design burden away from it.
This is done for several sample point over the
free face (see Figure 7). The sample points define
the basis for the according minimum burden
surface.
A minimum burden surface turns out to be a
kind of smoothed copy of the free surface it
belongs to. It is a general surface, i.e. it is not
necessarily flat.
The whole process is applied repeatedly if
several rows are sought. The minimum burden
surface on the first row serves then as the free
surface for the second row and so on.
4 AUTOMATIC BOREHOLE PLACEMENT
The components as described in the sections
before, i.e. a comprehensive 3D model and
minimum burden surfaces are the elements for the
automatic borehole placement routine. Boreholes
are arranged along the minimum burden surface
for the first row. Several boundary conditions resp.
degrees of freedom are possible during this
process which influence the final output including:
− inclination: fixed value or variable
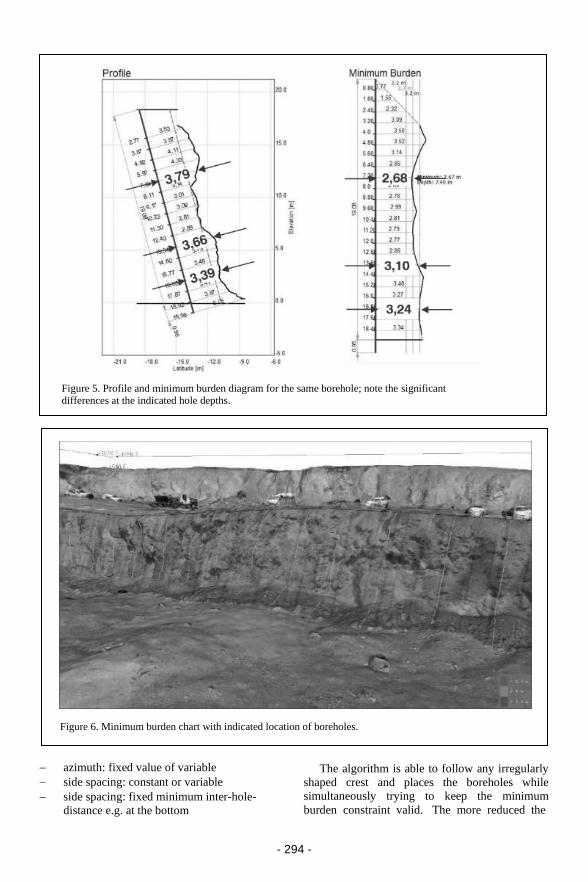
- 294 -
Figure 5. Profile and minimum burden diagram for the same borehole; note the significant differences at the indicated hole depths.
Figure 6. Minimum burden chart with indicated location of boreholes.
− azimuth: fixed value of variable
− side spacing: constant or variable
− side spacing: fixed minimum inter-hole-
distance e.g. at the bottom
The algorithm is able to follow any irregularly
shaped crest and places the boreholes while
simultaneously trying to keep the minimum
burden constraint valid. The more reduced the
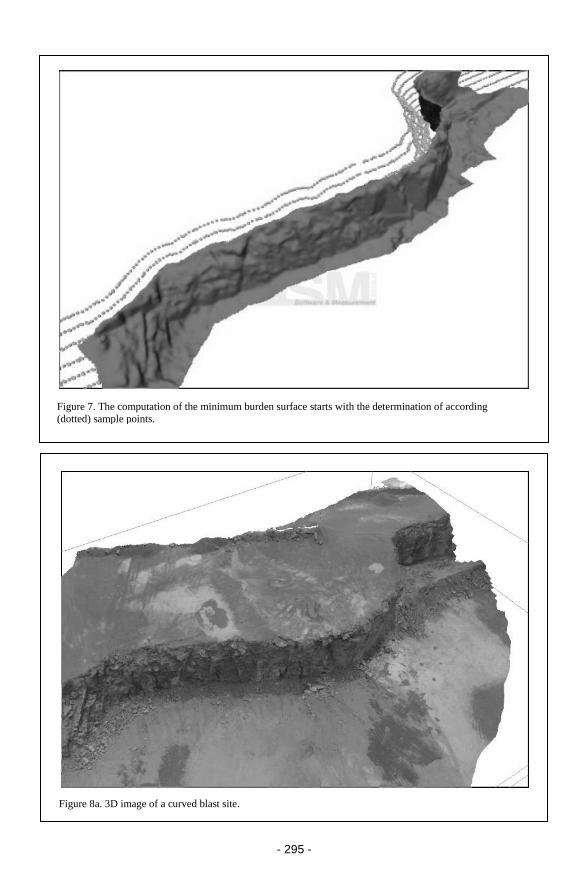
- 295 -
Figure 7. The computation of the minimum burden surface starts with the determination of according
(dotted) sample points.
Figure 8a. 3D image of a curved blast site.
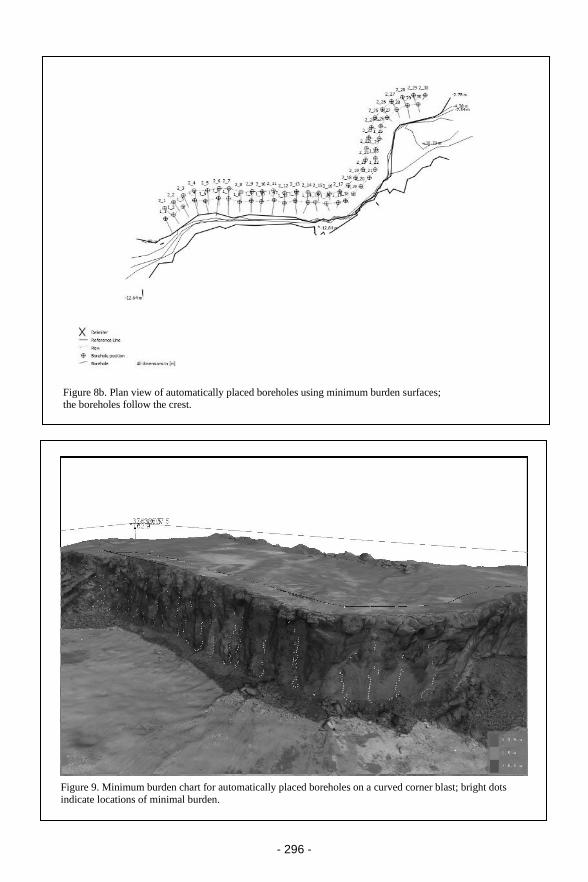
- 296 -
Figure 8b. Plan view of automatically placed boreholes using minimum burden surfaces; the boreholes follow the crest.
Figure 9. Minimum burden chart for automatically placed boreholes on a curved corner blast; bright dots
indicate locations of minimal burden.
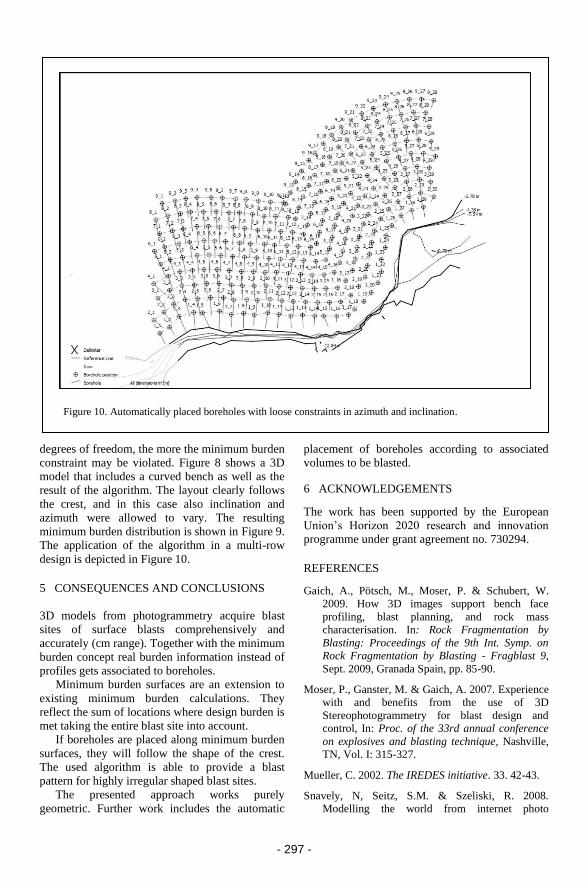
- 297 -
Figure 10. Automatically placed boreholes with loose constraints in azimuth and inclination.
degrees of freedom, the more the minimum burden
constraint may be violated. Figure 8 shows a 3D
model that includes a curved bench as well as the
result of the algorithm. The layout clearly follows
the crest, and in this case also inclination and
azimuth were allowed to vary. The resulting
minimum burden distribution is shown in Figure 9.
The application of the algorithm in a multi-row
design is depicted in Figure 10.
5 CONSEQUENCES AND CONCLUSIONS
3D models from photogrammetry acquire blast
sites of surface blasts comprehensively and
accurately (cm range). Together with the minimum
burden concept real burden information instead of
profiles gets associated to boreholes.
Minimum burden surfaces are an extension to
existing minimum burden calculations. They
reflect the sum of locations where design burden is
met taking the entire blast site into account.
If boreholes are placed along minimum burden
surfaces, they will follow the shape of the crest.
The used algorithm is able to provide a blast
pattern for highly irregular shaped blast sites.
The presented approach works purely
geometric. Further work includes the automatic
placement of boreholes according to associated
volumes to be blasted.
6 ACKNOWLEDGEMENTS
The work has been supported by the European
Union’s Horizon 2020 research and innovation
programme under grant agreement no. 730294.
REFERENCES
Gaich, A., Pötsch, M., Moser, P. & Schubert, W.
2009. How 3D images support bench face
profiling, blast planning, and rock mass
characterisation. In: Rock Fragmentation by
Blasting: Proceedings of the 9th Int. Symp. on
Rock Fragmentation by Blasting - Fragblast 9,
Sept. 2009, Granada Spain, pp. 85-90.
Moser, P., Ganster, M. & Gaich, A. 2007. Experience
with and benefits from the use of 3D
Stereophotogrammetry for blast design and
control, In: Proc. of the 33rd annual conference
on explosives and blasting technique, Nashville,
TN, Vol. I: 315-327.
Mueller, C. 2002. The IREDES initiative. 33. 42-43.
Snavely, N, Seitz, S.M. & Szeliski, R. 2008.
Modelling the world from internet photo

- 298 -
collections. International Journal of Computer
Vision: 80(2):189-210.
Stewart, D. 2017. Drill and blast improvement
project using photogrammetry, GPS and drill
navigation systems. In: Proceedings of 43rd
Annual Conference on Explosives and Blasting
Technique, Orlando, FL.
Website: Agisoft. https://www.agisoft.com/ Accessed
25 July 2019.
Website: Pix4D. https://www.pix4d.com/ Accessed
25 July 2019.
Website ShapeMetriX. https://3gsm.at/ Accessed 25
July 2019.

- 299 -
1 INTRODUCTION
The analysis of the rock movement with video
recording is a useful tool in blast design. It can be
used as a check of the explosive effect on the rock;
inefficiencies in loading, stemming, geometry,
timing, etc. are made apparent from the inspection
of the recorded images (Chiappetta & Mammele
1987, Pérreault & Morin 2000). The videos
provide the necessary data to estimate the
trajectory, size and velocity of fragments framed
within a specific plane with known coordinates
during the movement of the blasted rock
(Chiappetta et al. 1983). High-speed video
recording has been used in this work to record the
rock movement, tracking the motion of fragments
coming from different height levels on the
highwall. From this, the initial velocity of the
fragments and the response time, i.e. time between
the detonation and the first instance of movement
of the bench face, are determined.
Field measurements have been compared
with the results of a 2D smoothed particle
hydrodynamics model of the rock bench and a
blasthole. The model is able to simulate the crack
propagation from a blasthole, not easy to achieve
with the classical explicit finite element method.
This particle method can also simulate with
accuracy the detonation in the explosive, and the
pressure wave transmitted to the rock.
2 HIGH SPEED VIDEO RECORDING AND
DATA ANALYSIS
2.1 Field measurements
The rock movement has been analysed
SPH modelling of rock blasting: calibration from bench face
movement data
M. Bermejo, J. Navarro, J.A. Sanchidrián, P. Segarra & R. Castedo Universidad Politécnica de Madrid, Madrid, Spain
ABSTRACT: A smoothed particle hydrodynamics (SPH) model has been developed in LS-DYNA for the
simulation of the movement of the rock burden. The model is validated with experimental full-scale
quarry tests performed within the EU project SLIM. The explosive employed in the tests, an emulsion,
has been modelled with the JWL equation of state. The rock was modelled with the RHT constitutive
material model. The interaction between explosive and rock is modelled with a node-to-node penalty-
based contact. The fracture in the burden and the movement of the rock were monitored by high-speed
video recording, with which the initial velocity of the rock face, and the time from the detonation to the
onset of the face movement were obtained. These data have been used to calibrate the SPH model.
A thorough comparison of the results of tests and simulation are shown.
Helsinki Conference Proceedings 2019, R. Holmberg et al © 2019 European Federation of Explosives Engineers, ISBN 978-0-9550290-6-6
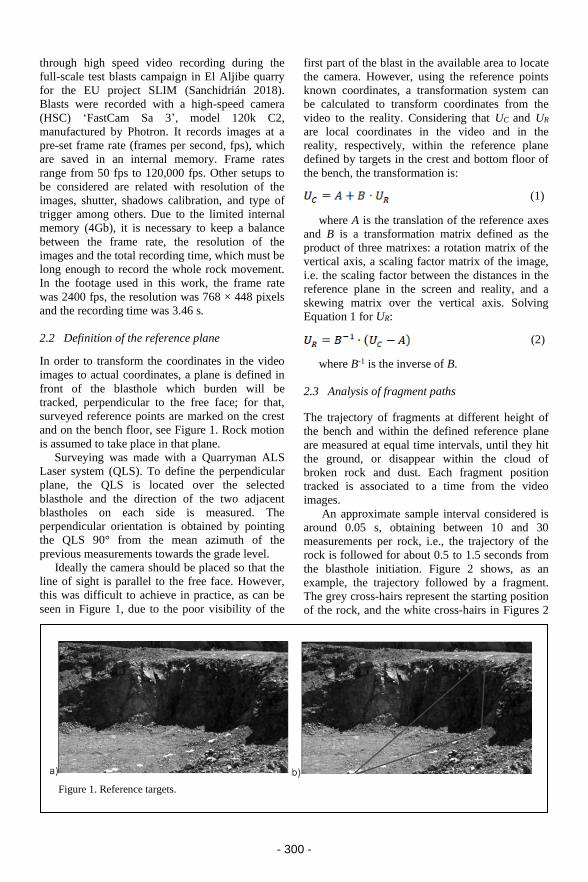
- 300 -
Figure 1. Reference targets.
through high speed video recording during the
full-scale test blasts campaign in El Aljibe quarry
for the EU project SLIM (Sanchidrián 2018).
Blasts were recorded with a high-speed camera
(HSC) ‘FastCam Sa 3’, model 120k C2,
manufactured by Photron. It records images at a
pre-set frame rate (frames per second, fps), which
are saved in an internal memory. Frame rates
range from 50 fps to 120,000 fps. Other setups to
be considered are related with resolution of the
images, shutter, shadows calibration, and type of
trigger among others. Due to the limited internal
memory (4Gb), it is necessary to keep a balance
between the frame rate, the resolution of the
images and the total recording time, which must be
long enough to record the whole rock movement.
In the footage used in this work, the frame rate
was 2400 fps, the resolution was 768 × 448 pixels
and the recording time was 3.46 s.
2.2 Definition of the reference plane
In order to transform the coordinates in the video
images to actual coordinates, a plane is defined in
front of the blasthole which burden will be
tracked, perpendicular to the free face; for that,
surveyed reference points are marked on the crest
and on the bench floor, see Figure 1. Rock motion
is assumed to take place in that plane.
Surveying was made with a Quarryman ALS
Laser system (QLS). To define the perpendicular
plane, the QLS is located over the selected
blasthole and the direction of the two adjacent
blastholes on each side is measured. The
perpendicular orientation is obtained by pointing
the QLS 90° from the mean azimuth of the
previous measurements towards the grade level.
Ideally the camera should be placed so that the
line of sight is parallel to the free face. However,
this was difficult to achieve in practice, as can be
seen in Figure 1, due to the poor visibility of the
first part of the blast in the available area to locate
the camera. However, using the reference points
known coordinates, a transformation system can
be calculated to transform coordinates from the
video to the reality. Considering that UC and UR
are local coordinates in the video and in the
reality, respectively, within the reference plane
defined by targets in the crest and bottom floor of
the bench, the transformation is:
(1) 1(1)
where A is the translation of the reference axes
and B is a transformation matrix defined as the
product of three matrixes: a rotation matrix of the
vertical axis, a scaling factor matrix of the image,
i.e. the scaling factor between the distances in the
reference plane in the screen and reality, and a
skewing matrix over the vertical axis. Solving
Equation 1 for UR:
(2) 2
where B-1 is the inverse of B.
2.3 Analysis of fragment paths
The trajectory of fragments at different height of
the bench and within the defined reference plane
are measured at equal time intervals, until they hit
the ground, or disappear within the cloud of
broken rock and dust. Each fragment position
tracked is associated to a time from the video
images.
An approximate sample interval considered is
around 0.05 s, obtaining between 10 and 30
measurements per rock, i.e., the trajectory of the
rock is followed for about 0.5 to 1.5 seconds from
the blasthole initiation. Figure 2 shows, as an
example, the trajectory followed by a fragment.
The grey cross-hairs represent the starting position
of the rock, and the white cross-hairs in Figures 2
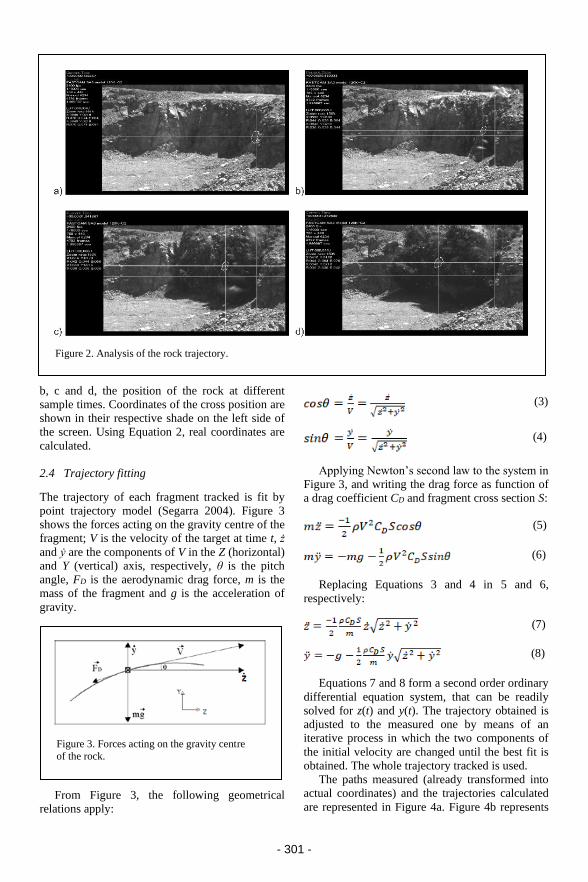
- 301 -
Figure 2. Analysis of the rock trajectory.
Figure 3. Forces acting on the gravity centre
of the rock.
b, c and d, the position of the rock at different
sample times. Coordinates of the cross position are
shown in their respective shade on the left side of
the screen. Using Equation 2, real coordinates are
calculated.
2.4 Trajectory fitting
The trajectory of each fragment tracked is fit by
point trajectory model (Segarra 2004). Figure 3
shows the forces acting on the gravity centre of the
fragment; V is the velocity of the target at time t, ż
and ẏ are the components of V in the Z (horizontal)
and Y (vertical) axis, respectively, θ is the pitch
angle, FD is the aerodynamic drag force, m is the
mass of the fragment and g is the acceleration of
gravity.
From Figure 3, the following geometrical
relations apply:
(3) 3
(4) 4
Applying Newton’s second law to the system in
Figure 3, and writing the drag force as function of
a drag coefficient CD and fragment cross section S:
(5) 5
(6) 6
Replacing Equations 3 and 4 in 5 and 6,
respectively:
(7) 7
(8) 8
Equations 7 and 8 form a second order ordinary
differential equation system, that can be readily
solved for z(t) and y(t). The trajectory obtained is
adjusted to the measured one by means of an
iterative process in which the two components of
the initial velocity are changed until the best fit is
obtained. The whole trajectory tracked is used.
The paths measured (already transformed into
actual coordinates) and the trajectories calculated
are represented in Figure 4a. Figure 4b represents

- 302 -
Figure 4. a) Trajectories adjustment; b) Face profiles.
Table 1. Height and burden of fragments tracked,
velocity and response time.
Fragment Height
rock
Burden Initial
velocity
Response
time
m m m/s ms
1 9.72 2.47 14.03 23.10
2 7.56 3.30 18.24 23.60
3 6.52 3.40 18.61 23.80
4 4.97 3.83 17.14 24.10
5 3.02 4.10 16.51 24.50
the free face profiles at several times. These
profiles are formed by connecting the rock
trajectory points (circles) measured at the same
time.
2.5 Determination of the response time
Downhole initiation with electronic detonators
was employed. To measure the response time of
the rock, i.e. time between the detonator firing to
the first movement of the rock, it is necessary to
record with the camera the precise moment at
which the explosive is detonated. For that, a
detonator was located outside the blasthole with
the same time that the initiator, so that the
initiation time was recorded by the HSC. Since the
scatter of this type of detonators is minimal
(around 0.1 ms as measured in the tests), both the
initiator and the external detonators fire, for all
purposes, at the same time.
The initiation of the detonator outside the
blasthole generates a flash. Rock trajectories in
Figure 4 are measured from the time of this flash
or initiation of the explosive. Between the
blasthole initiation flash time to the onset of
movement of a given spot on the face, there is a
short time interval where the rock remains still.
The time at which there is a first evidence of
movement is visually observed in the video
recording, and the time read.
2.6. Results
The height, actual burden from the blasthole at that
height, and the initial velocity and response times
for five fragments are listed in Table 1.
3 NUMERICAL MODELLING WITH
SMOOTHED PARTICLE
HYDRODYNAMICS (SPH)
A 2D model with SPH formulation and plane-
strain conditions has been used. All SPH particles
have approximately equal inter-particle distance of
15 mm in both directions. In the SPH model, the
repulsive contact force acting on each particle
depends on the linear-spring constant or stiffness.
All the SPH interpolations (density, stresses) are
carried out inside the local domains of each SPH
part. For the interactions between explosive and
rock, a node-to-node penalty-based contact is
used; this is needed especially when the materials
have significantly different densities such as the
detonation products and the rock.
A “*DEFINE_SPH_TO_SPH_COUPLING” LS-
DYNA keyword (Hallquist 2006) is used for the
explosive to rock contact.
Tensile (Ganzenmüller et al. 2016) and rank-
deficient (Dyka et al. 1997) instabilities, two
problems related to SPH method, are solved
through the hourglass control schemes. The tensile
instability appears by nonphysical clumping of
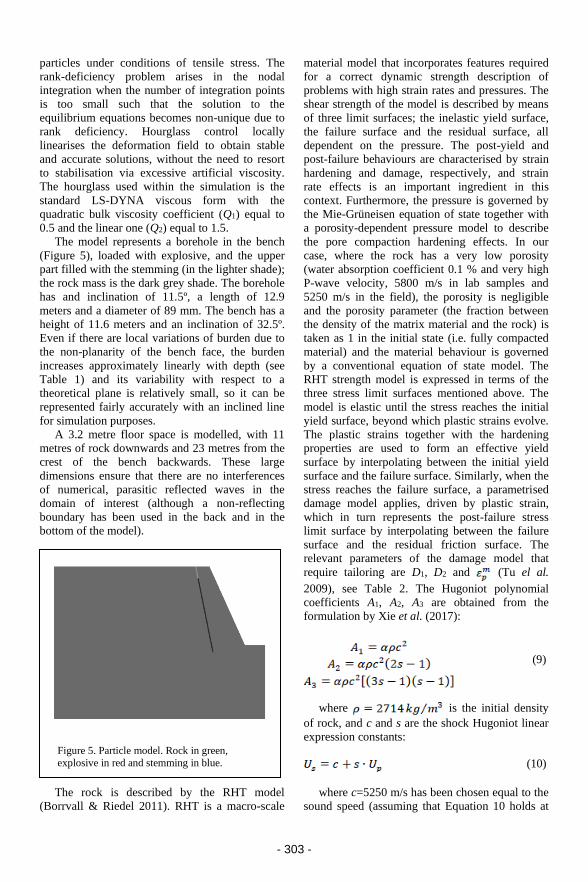
- 303 -
Figure 5. Particle model. Rock in green,
explosive in red and stemming in blue.
particles under conditions of tensile stress. The
rank-deficiency problem arises in the nodal
integration when the number of integration points
is too small such that the solution to the
equilibrium equations becomes non-unique due to
rank deficiency. Hourglass control locally
linearises the deformation field to obtain stable
and accurate solutions, without the need to resort
to stabilisation via excessive artificial viscosity.
The hourglass used within the simulation is the
standard LS-DYNA viscous form with the
quadratic bulk viscosity coefficient (Q1) equal to
0.5 and the linear one (Q2) equal to 1.5.
The model represents a borehole in the bench
(Figure 5), loaded with explosive, and the upper
part filled with the stemming (in the lighter shade);
the rock mass is the dark grey shade. The borehole
has and inclination of 11.5º, a length of 12.9
meters and a diameter of 89 mm. The bench has a
height of 11.6 meters and an inclination of 32.5º.
Even if there are local variations of burden due to
the non-planarity of the bench face, the burden
increases approximately linearly with depth (see
Table 1) and its variability with respect to a
theoretical plane is relatively small, so it can be
represented fairly accurately with an inclined line
for simulation purposes.
A 3.2 metre floor space is modelled, with 11
metres of rock downwards and 23 metres from the
crest of the bench backwards. These large
dimensions ensure that there are no interferences
of numerical, parasitic reflected waves in the
domain of interest (although a non-reflecting
boundary has been used in the back and in the
bottom of the model).
The rock is described by the RHT model
(Borrvall & Riedel 2011). RHT is a macro-scale
material model that incorporates features required
for a correct dynamic strength description of
problems with high strain rates and pressures. The
shear strength of the model is described by means
of three limit surfaces; the inelastic yield surface,
the failure surface and the residual surface, all
dependent on the pressure. The post-yield and
post-failure behaviours are characterised by strain
hardening and damage, respectively, and strain
rate effects is an important ingredient in this
context. Furthermore, the pressure is governed by
the Mie-Grüneisen equation of state together with
a porosity-dependent pressure model to describe
the pore compaction hardening effects. In our
case, where the rock has a very low porosity
(water absorption coefficient 0.1 % and very high
P-wave velocity, 5800 m/s in lab samples and
5250 m/s in the field), the porosity is negligible
and the porosity parameter (the fraction between
the density of the matrix material and the rock) is
taken as 1 in the initial state (i.e. fully compacted
material) and the material behaviour is governed
by a conventional equation of state model. The
RHT strength model is expressed in terms of the
three stress limit surfaces mentioned above. The
model is elastic until the stress reaches the initial
yield surface, beyond which plastic strains evolve.
The plastic strains together with the hardening
properties are used to form an effective yield
surface by interpolating between the initial yield
surface and the failure surface. Similarly, when the
stress reaches the failure surface, a parametrised
damage model applies, driven by plastic strain,
which in turn represents the post-failure stress
limit surface by interpolating between the failure
surface and the residual friction surface. The
relevant parameters of the damage model that
require tailoring are D1, D2 and (Tu el al.
2009), see Table 2. The Hugoniot polynomial
coefficients A1, A2, A3 are obtained from the
formulation by Xie et al. (2017):
(9) 9
where is the initial density
of rock, and c and s are the shock Hugoniot linear
expression constants:
(10) 10
where c=5250 m/s has been chosen equal to the
sound speed (assuming that Equation 10 holds at

- 304 -
Table 2. Parameters for the RHT material model.
Parameter Value Remarks
Density 2714 kg/ Lab measured
Shear Modulus 41.6 GPa Lab and field data; elastic relations
Pore crush (B0) 1.2 Equal to the Grüneisen coefficient(1)
Pore crush (B1) 1.2 Equal to the Grüneisen coefficient(1)
Bulk Modulus (T1) 75 GPa Lab and field data; elastic relations
Bulk Modulus (T2) 0.0 GPa Ding et al. (2013)
Hugoniot parameter (A1) 75 GPa Eqs. 1
Hugoniot parameter (A2) 90 GPa Eqs. 1
Hugoniot parameter (A2) 15.5 GPa Eqs. 1
Failure surface parameter (Af) 1.6 Tu & Lu 2009
Failure surface exponent (nf) 0.61 Tu & Lu 2009
Compressive strength (fc) 182 MPa Lab tests
Relative shear strength (fs*) 0.18 MPa Lab(2)
Relative tensile strength (ft*) 0.1 MPa Lab(2)
Lode Angle (Q0) 0.68 Tu & Lu 2009(3)
Lode Angle (B) 0.0105 Tu & Lu 2009(3)
Compressive reference strain rate 3×10⁻⁵ s-1 Ding et al. 2013
Compressive break strain rate 3×1025 s-1 Borrvall & Riedel 2011
Tensile reference strain rate 3×10⁻⁶ s-1 Ding et al. 2013
Yield surface parameter (gc*) 0.53 Borrvall & Riedel 2011
Yield surface parameter (gt*) 0.7 Borrvall & Riedel 2011
Damage parameter (D1) 0.015 Tu & Lu 2009
Damage parameter (D2) 1.0 Tu & Lu 2009
Residual damaged strain ( ) 8.0×10⁻⁴ Tu & Lu 2009
Crush Pressure 182 MPa (4)
Initial porosity parameter 1.0 Non-porous material
1 The Grüneisen coefficient is approximated as (Ding et al. 2013).
2 Shear and tensile strengths normalised with compressive strength; the von Mises criterion for shear
strength is used.
3 Strength-reduction parameters.
4 Equal to the compressive strength (fc) since the initial porosity parameter is 1.
low particle velocities). The slope s varies for
strong rocks (e.g. granite) from about 0.6 to 1.5
depending on the shock range (Sekine et al. 1995);
we as been chosen s=1.1.
Table 2 summarises the parameters used for the
RHT model. The basic elastic parameters used are
field-measured P-wave velocity and dynamic
Poisson ratio, the latter obtained from laboratory
values of P- and S-wave velocities (no S- wave
velocity is available from the field tests). Other
parameters such as shear modulus or bulk modulus
are derived from them. Compressive and tensile
strength are obtained from laboratory tests.
The stemming was modelled with material
‘*Mat_Soil_And_Foam’. The density, shear
modulus and bulk modulus used are 1650 kg/m3,
10 MPa and 13.6 GPa respectively.
The explosive is an emulsion with density
1177.5 kg/m3, velocity of detonation 5448 m/s and
detonation pressure calculated at 7.94 GPa. The
material “*Mat_High_Explosive_Burn” is used.
This material model must be used in combination

- 305 -
Table 3. Parameters for the JWL equation of state.
A (GPa) B (GPa) C (GPa) R1 R2 ω E0 (GPa)
35.243 4.163 0.406 5.612 1.185 0.37 2.757
Figure 6. Initial state of the model and map of velocity at 30 ms from initiation.
with an equation of state to define the detonation
products pressure-volume-energy relation. The
equation of state used is the Jones-Wilkins-Lee
(JWL):
where A, B, R1, R2 and ω are parameters for a
given explosive in a given detonation condition
(e.g. density, diameter, etc.), P is pressure, E is
internal energy per unit initial volume and V is
relative volume. The constants have been
determined from cylinder test data (Sanchidrián et
al. 2015, López et al. 2018, Castedo et al. 2018)
where explosive density and velocity of detonation
were measured at the values given above. The
JWL parameters are reported in Table 3. E0 is the
initial energy available. A single ignition point at
the bottom of the blasthole has been used.
4 RESULTS AND DISCUSSION
Figure 6 shows the initial state of the model,
together with the map of velocity 30 ms from the
initiation of the detonation. No reflected waves
from the back or the bottom boundaries are
formed, which confirms that the dimensions of the
model are sufficient. The free face reflected wave
is simulated correctly. A positive velocity gradient
from the blasthole to the free face is obtained,
whereas velocity decreases steadily backwards and
downwards.
The velocity and response time of five
fragments formed in the bench face at the same
height levels in Table 1 have been calculated from
the model results. Clusters of particles moving
together have been selected as ‘fragments’. These
are shown in black with its respective number in
Figure 7. The histories of velocity of the particles
in each cluster are obtained from the model and
the average computed. Figure 8 shows an example
of velocity history of a particle and the average
velocity of the cluster. There is an initial phase
with zero velocity until the P-wave reaches the
cluster position, then the velocity ramps up until a
steady value is attained; the initial velocity refers
to this value. Calculated and test-measured values
are given in Table 4. The agreement is quite
acceptable and validates the SPH model
developed.
In figure 9, the initial velocity of the target
fragments is plotted against the ratio of the target
height to the bench height, both measured and
calculated. Lines are quadratic fits, similar to those
shown by Sanchidrián et al. (2005).
The response time is taken as the time at which
99 % of the steady velocity (see Figure 8) of the
cluster mean velocity is attained. Table 5 shows
the comparison between test and model. The
model results fall slightly below the measured,
though no attempt has been done to tailor the
model parameters to match the test data more
(11)
- 306 -
Figure 7. The model 60 ms from initiation. Left: the five fragments selected, Right: detail of the bottom of the
borehole; particles ejected and patterns of fractures.
Table 4. Initial velocity. - measured and calculated values.
Fragment Height of
fragment
(m)
Burden (m)
Initial
velocity, test (m/s)
Initial velocity,
model (m/s) Difference
between model
and test (%)
1 9.72 2.47 14.03 17.50 24.7
2 7.56 3.30 18.24 18.22 0.11
3 6.52 3.40 18.61 22.00 18.2
4 4.97 3.83 17.14 17.90 4.4
5 3.02 4.10 16.51 17.23 4.3
Table 5. Response time - measured and calculated values.
Fragment Height of
fragment (m)
Burden
(m)
Response
time, test (ms)
Response time,
model (ms)
Error between
model and test (%)
1 9.72 2.47 23.1 20.7 -10.5%
2 7.56 3.30 23.6 20.9 -11.4%
3 6.52 3.40 23.8 23.1 -2.9%
4 4.97 3.83 24.1 23.1 -4.1%
5 3.02 4.10 24.5 21.3 -12.9%
accurately. The response time shows a slight direct
relation with burden, see Figure 10.
5 CONCLUSIONS
Numerical results indicate that the explosive-to-
rock coupled SPH-SPH model can be applied to
predict the rock movement, and to calculate the
initial velocity of the rock and the response time.
The model is validated with data obtained from a
full scale quarry test blast. Conclusions on the
modelling are:
− 2D SPH models with plane-strain conditions
and node-to-node penalty-based contact are
useful to simulate the explosive to rock

- 307 -
interaction and the fragments ejection.
− The equal inter-particle distance of 15 mm is
appropriate to obtain valid results.
From the analysis of the results, it follows that:
− The face velocity follows a convex function
of the target height, being maximum at about
mid-height, decreasing towards the top and
the floor of the bench. The initial velocity
values measured are in the range 15-20 m/s.
− The face response time measured is 23-25 ms
from the hole initiation. The response time
seems to have a slight direct dependent with
burden.
Wave interactions between holes obviously
require a 3D model; the 2D model shown in this
work is a preparatory exercise for a full 3D SPH-
SPH explosive-to-rock interaction model.
6 ACKNOWLEDGEMENTS
This work is part of the SLIM project, funded by
the European Union's Horizon 2020 research and
innovation program under Grant agreement no.
730294.
REFERENCES
Borrvall, T. & Riedel, W. 2011. The RHT concrete
model in LS-DYNA. In Proceedings of the 8th
European LS-DYNA users conference, May,
Strasbourg - May 2011.
Castedo, R., Natale, M., López, L.M., Sanchidrián,
J.A., Santos, A.P., Navarro, J. & Segarra, P.
2018. Estimation of Jones-Wilkins-Lee
parameters of emulsion explosives using cylinder
tests and their numerical validation. International
Journal of Rock Mechanics and Mining
Sciences, 112: 290-301.
Chiappetta, R.F., Bauer, A., Dailey, P.J. & Burchell,
S.L. 1983. The use of high speed motion picture
photography in blast evaluation and design. In
Proceedings of the Ninth Conference on
explosives and blasting technique, January 31-
February 4, Dallas, Texas. Society of Explosives
Engineers.
Chiappetta, R.F. & Mammele, M.E. 1987. Analytical
high-speed photography to evaluate air decks,
stemming retention and gas confinement in
presplitting, reclamation and gross motion
applications. In W.L. Fourney & R.D. Dick,
Proc. 2nd Int. Symp. on rock fragmentation by
blasting, Keystone, CO, 23–26 August. Bethel,
CT: Society for Experimental Mechanics.
Ding, Y.Q., Tang, W.H., Zhang, R.Q. & Ran, X.W.
2013. Determination and validation of parameters
Figure 8. History of velocity, cluster no. 3 in Figure 7. Example of one particle and average
of the cluster (smoothed).
Figure 9. Fragments initial velocity as function of normalised height.
Figure 10. Response time versus burden.
- 308 -
for Riedel-Hiermaier-Thoma concrete model.
Defence Science Journal 63(5): 524-530.
Dyka, C.T., Randles, P.W. & Ingel, R.P. 1997. Stress
points for tension instability in SPH.
International Journal for Numerical Methods in
Engineering 40(13): 2325-2341.
Ganzenmüller, G.C., Sauer, M., May, M. &
Hiermaier, S. 2016. Hourglass control for smooth
particle hydrodynamics removes tensile and rank-
deficiency instabilities. The European Physical
Journal Special Topics 225(2): 385-395.
Hallquist, J.O. 2006. LS-DYNA theory manual.
Livermore Software Technology Corporation,
Livermore, CA.
López, L.M., Castedo, R., Sanchidrián, J.A., Natale,
M., Santos, A.P., Navarro, J. & Chiquito, M.
2018. Emulsion characterisation with cylinder
test and JWL parameters determination. In H.
Schunnesson & D. Johansson (eds.) Proc. 12th
Int. Symp. on Rock Fragmentation by Blasting
(Fragblast 12), 11-13 June, Luleå, Sweden, pp.
431-439.
Pérreault, J.F. & Morin, A. 2000. Optimisation des
paramètres de sautage à la Compagnie Minière
Québac Cartier. In 23e Session détude sur les
techniques de sautage, Département de mines et
métallurgie, 2-3 November 2000, Québec,
Canada. Université Laval.
Sanchidrián, J.A. 2018. SLIM: Technology for
blasting to improve mining. In H. Schunnesson &
D. Johansson (eds.) Proc. 12th Int. Symp. on Rock
Fragmentation by Blasting (Fragblast 12), 11-13
June, Luleå, Sweden, pp. 783-793.
Sanchidrián, J.A., Castedo, R., López, L.M., Segarra,
P. & Santos, A.P. 2015. Determination of the
JWL constants for ANFO and emulsion
explosives from cylinder test data. Central
European Journal of Energetic Materials 12(2):
177-194.
Sanchidrián, J.A., Segarra, P. & López, L.M. 2005.
On the relation of rock face response time and
initial velocity with blasting parameters. In Proc.
3rd World Conf. on Explosives and Blasting,
September, Brighton, UK, European Federation
of Explosives Engineers, pp. 375-389.
Segarra, P. 2004. Experimental analysis of
fragmentation, vibration and rock movement in
open pit blasting. Doctoral Thesis, Universidad
Politécnica de Madrid.
Sekine, T., Duffy, T.S., Rubin, A.M., Anderson,
W.W. & Ahrens, T.J. 1995. Shock compression
and isentropic release of granite, Geophys. J. Int.
120: 247-261.
Tu, Z. & Lu, Y. 2009. Evaluation of typical concrete
material models used in hydrocodes for high
dynamic response simulations. International
Journal of Impact Engineering 36(1): 132-146.
Xie, L.X., Lu, W.B., Zhang, Q.B., Jiang, Q.H., Chen,
M. & Zhao, J. 2017. Analysis of damage
mechanisms and optimisation of cut blasting
design under high in-situ stresses. Tunnelling and
Underground Space Technology 66: 19-33.
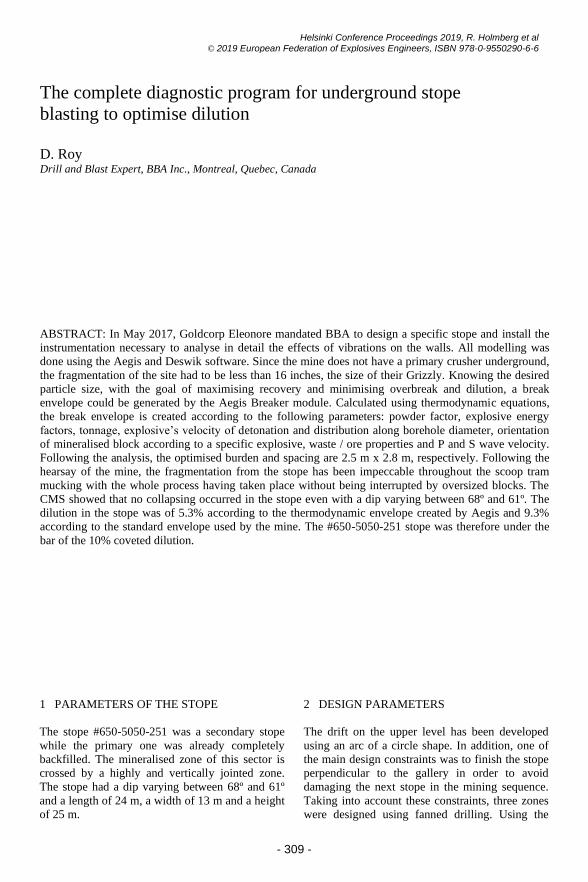
- 309 -
1 PARAMETERS OF THE STOPE
The stope #650-5050-251 was a secondary stope
while the primary one was already completely
backfilled. The mineralised zone of this sector is
crossed by a highly and vertically jointed zone.
The stope had a dip varying between 68º and 61º
and a length of 24 m, a width of 13 m and a height
of 25 m.
2 DESIGN PARAMETERS
The drift on the upper level has been developed
using an arc of a circle shape. In addition, one of
the main design constraints was to finish the stope
perpendicular to the gallery in order to avoid
damaging the next stope in the mining sequence.
Taking into account these constraints, three zones
were designed using fanned drilling. Using the
The complete diagnostic program for underground stope
blasting to optimise dilution
D. Roy Drill and Blast Expert, BBA Inc., Montreal, Quebec, Canada
ABSTRACT: In May 2017, Goldcorp Eleonore mandated BBA to design a specific stope and install the
instrumentation necessary to analyse in detail the effects of vibrations on the walls. All modelling was
done using the Aegis and Deswik software. Since the mine does not have a primary crusher underground,
the fragmentation of the site had to be less than 16 inches, the size of their Grizzly. Knowing the desired
particle size, with the goal of maximising recovery and minimising overbreak and dilution, a break
envelope could be generated by the Aegis Breaker module. Calculated using thermodynamic equations,
the break envelope is created according to the following parameters: powder factor, explosive energy
factors, tonnage, explosive’s velocity of detonation and distribution along borehole diameter, orientation
of mineralised block according to a specific explosive, waste / ore properties and P and S wave velocity.
Following the analysis, the optimised burden and spacing are 2.5 m x 2.8 m, respectively. Following the
hearsay of the mine, the fragmentation from the stope has been impeccable throughout the scoop tram
mucking with the whole process having taken place without being interrupted by oversized blocks. The
CMS showed that no collapsing occurred in the stope even with a dip varying between 68º and 61º. The
dilution in the stope was of 5.3% according to the thermodynamic envelope created by Aegis and 9.3%
according to the standard envelope used by the mine. The #650-5050-251 stope was therefore under the
bar of the 10% coveted dilution.
Helsinki Conference Proceedings 2019, R. Holmberg et al
© 2019 European Federation of Explosives Engineers, ISBN 978-0-9550290-6-6

- 310 -
Breaker module of the Aegis software made it
possible to establish the optimal blast pattern while
taking into account the geomechanical
parameters of the rock as well as the types of
explosives present on site. The software calculated
a burden of 2.5 m, a spacing of 2.8 m and a break
radius of 1.3 m for the Subtek product and 0.7 m
for the Senatel Powersplit product. The three fan
zones, i.e. Section 2, Section 7 and Section 10,
were drawn as a stagger pattern to respect as much
as possible the calculated burden. In the widest
part of the fans, i.e. at the hanging wall, holes have
been added to compensate for the staggered zone
and thus trimming the wall as straight as possible.
These three extra boreholes were loaded with
Senatel Powersplit.
3 DIFFERENT TESTS PERFORMED
3.1 Flexit
A survey with a Flexit probe, from the company
Reflex, was performed to demonstrate the
effectiveness of the product and to validate the
deviation of the boreholes. The hanging wall holes
were prioritised over the short holes of the foot
wall. Some boreholes could not be surveyed with
the probe due to areas restricted by a metal
barricade and the Simba drill. The Flexit survey
result versus the CMS results can be found in
Appendix A. In these sections and in the plan
view, it is possible to see the extent of the
deviation of the boreholes surveyed by the Flexit
probe as well as the surveying of the BT holes at
the total station. Furthermore, the collars of the
holes were surveyed to position the Flexit probe in
space. In the section views, it is obvious that the
collars of some holes have been moved. The drill
probably did not have enough space to drill and
had to be moved. It is possible to see that this
displacement caused a loss in the hanging wall ore
recovery, see the final CMS. Thereby, the spacing
between the holes has been drastically reduced.
These changes may cause damages to adjacent
holes and create charges deconfinement. With the
theoretical VOD of the Subtek Intense, being of 5
800 m/s, it will take 2.6 m/s for a 15 m column of
charge to detonate and 4.3 m/s for a 25 m column.
In this case, the delay between the hanging wall
holes and their neighbour was of 34 m/s, leaving
about 30 m/s between the two blastholes to create
damage and deconfinement. It must be understood
that deviation plays a very important role both in
the fragmentation and in the control of the walls.
After analysing the seismographs, it seems that all
the hanging wall blastholes have detonated
properly with respect to the number of kilograms
of explosives present in each of them.
3.2 High frequency geophones
3.2.1 Primary blasting
During the loading of the primary blast, two
boreholes were cancelled. The first, because it
intercepted an adjacent borehole and the second
one because it was blocked at 9 m. A good
practice from the drillers would be to take note of
all situations where they intercept any cavities or
irregularities while drilling. No drill log mentioned
such details. During the final blast, the blasthole
containing 3 electronic detonators programmed at
the delay of 6063 m/s did not respond when all
personnel had evacuated the mine. Different
causes may be involved; the most likely one is
related to the working method used by some
blasters. When the loading of a borehole is
completed the operator twists the detonators’ wires
with the ‘carry strap’ preventing them from
being free and/or in the way. In the event
that the emulsion column descends due to
a non-effective wooden borehole plug at the
bottom or other reasons, the detonator wires
will stretch and could possibly break at some
point.
Figure 1 and Figure 2 show the readings from
the high frequency geophones G-03 and HF 02,
installed near the primary blast. These two figures
show a plan view of the blasthole collars with their
respective theoretical delay. The different shaded
pellets show the amplitude ranges of vibration, in
mm/sec, developed for the Eleonore Mine in a
previous study. The dark shade, ranging from 0 to
300 mm/sec, indicates that the associated blasthole
did not force excessively to break and move the
ore tonnage proportional to its burden. Therefore,
the charge’s level of confinement, its delay and the
angle of attack were all appropriate. The medium
shade, ranging from 300 to 500 mm/sec, indicates
that the associated blasthole has forced more to
break and move its burden, without creating too
much damage to its surrounding. The lighter
shade, ranging from 500 to 1000 mm/sec,
indicates that the blasthole has created damage to
nearby walls. In such case, most probably, the
level of confinement of the charge has been altered
prior to its detonation. The blasthole either had an
excessive burden to push or the explosive could
not produce enough detonation pressure due to
lack of confinement (reduced burden). It could
also be explained by a non-adequate burden relief
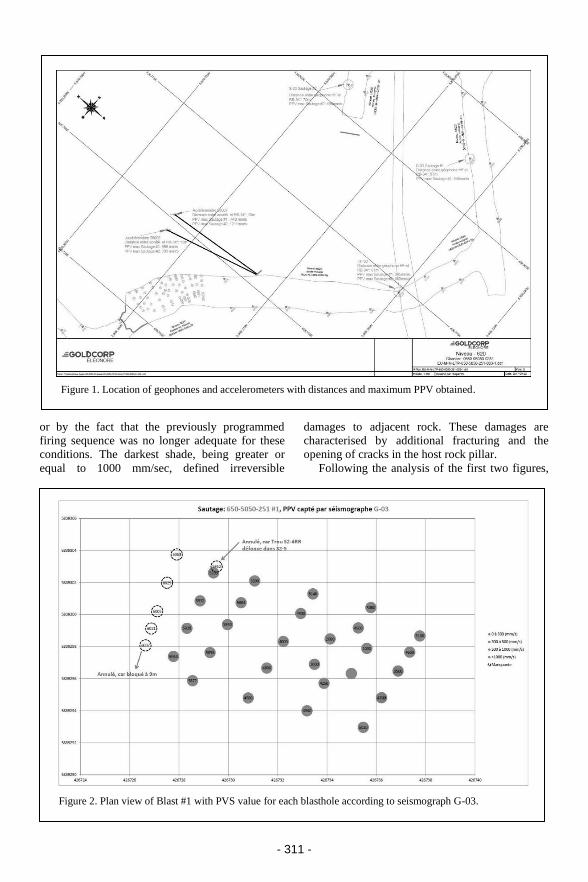
- 311 -
Figure 1. Location of geophones and accelerometers with distances and maximum PPV obtained.
Figure 2. Plan view of Blast #1 with PVS value for each blasthole according to seismograph G-03.
or by the fact that the previously programmed
firing sequence was no longer adequate for these
conditions. The darkest shade, being greater or
equal to 1000 mm/sec, defined irreversible
damages to adjacent rock. These damages are
characterised by additional fracturing and the
opening of cracks in the host rock pillar.
Following the analysis of the first two figures,

- 312 -
Figure 3. Plan view of Blast #1 with PVS value for each blasthole according to seismograph HF-02.
Figure 4. Plan view of Blast #2 with PVS value for each blasthole according to seismograph G-03.
it is possible to say that the primary blast remained
in a fairly low vibration range. The blastholes in
the 0 m/s – 3000 m/s interval show no excessive
vibration suggesting adequate relief of the mass in
the void of the 34'' primary slot borehole. Towards
the end of the blast, some seismic data is missing.
The reason is that when delays are so close to each
other it becomes very difficult to isolate the pulse
of each blasthole on the entire seismic trace.
Figures 3 and 4, in relation with the final blast,
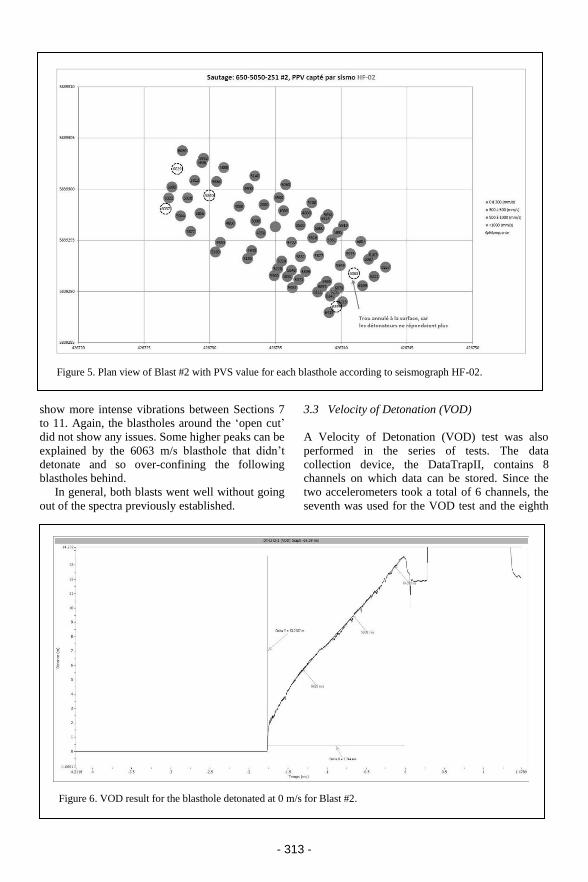
- 313 -
Figure 5. Plan view of Blast #2 with PVS value for each blasthole according to seismograph HF-02.
Figure 6. VOD result for the blasthole detonated at 0 m/s for Blast #2.
show more intense vibrations between Sections 7
to 11. Again, the blastholes around the ‘open cut’
did not show any issues. Some higher peaks can be
explained by the 6063 m/s blasthole that didn’t
detonate and so over-confining the following
blastholes behind.
In general, both blasts went well without going
out of the spectra previously established.
3.3 Velocity of Detonation (VOD)
A Velocity of Detonation (VOD) test was also
performed in the series of tests. The data
collection device, the DataTrapII, contains 8
channels on which data can be stored. Since the
two accelerometers took a total of 6 channels, the
seventh was used for the VOD test and the eighth
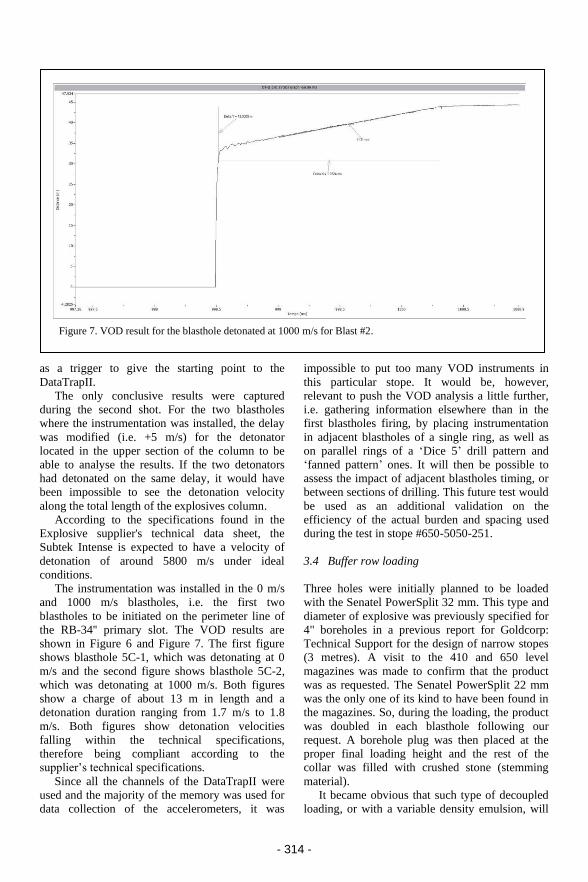
- 314 -
Figure 7. VOD result for the blasthole detonated at 1000 m/s for Blast #2.
as a trigger to give the starting point to the
DataTrapII.
The only conclusive results were captured
during the second shot. For the two blastholes
where the instrumentation was installed, the delay
was modified (i.e. +5 m/s) for the detonator
located in the upper section of the column to be
able to analyse the results. If the two detonators
had detonated on the same delay, it would have
been impossible to see the detonation velocity
along the total length of the explosives column.
According to the specifications found in the
Explosive supplier's technical data sheet, the
Subtek Intense is expected to have a velocity of
detonation of around 5800 m/s under ideal
conditions.
The instrumentation was installed in the 0 m/s
and 1000 m/s blastholes, i.e. the first two
blastholes to be initiated on the perimeter line of
the RB-34'' primary slot. The VOD results are
shown in Figure 6 and Figure 7. The first figure
shows blasthole 5C-1, which was detonating at 0
m/s and the second figure shows blasthole 5C-2,
which was detonating at 1000 m/s. Both figures
show a charge of about 13 m in length and a
detonation duration ranging from 1.7 m/s to 1.8
m/s. Both figures show detonation velocities
falling within the technical specifications,
therefore being compliant according to the
supplier’s technical specifications.
Since all the channels of the DataTrapII were
used and the majority of the memory was used for
data collection of the accelerometers, it was
impossible to put too many VOD instruments in
this particular stope. It would be, however,
relevant to push the VOD analysis a little further,
i.e. gathering information elsewhere than in the
first blastholes firing, by placing instrumentation
in adjacent blastholes of a single ring, as well as
on parallel rings of a ‘Dice 5’ drill pattern and
‘fanned pattern’ ones. It will then be possible to
assess the impact of adjacent blastholes timing, or
between sections of drilling. This future test would
be used as an additional validation on the
efficiency of the actual burden and spacing used
during the test in stope #650-5050-251.
3.4 Buffer row loading
Three holes were initially planned to be loaded
with the Senatel PowerSplit 32 mm. This type and
diameter of explosive was previously specified for
4" boreholes in a previous report for Goldcorp:
Technical Support for the design of narrow stopes
(3 metres). A visit to the 410 and 650 level
magazines was made to confirm that the product
was as requested. The Senatel PowerSplit 22 mm
was the only one of its kind to have been found in
the magazines. So, during the loading, the product
was doubled in each blasthole following our
request. A borehole plug was then placed at the
proper final loading height and the rest of the
collar was filled with crushed stone (stemming
material).
It became obvious that such type of decoupled
loading, or with a variable density emulsion, will
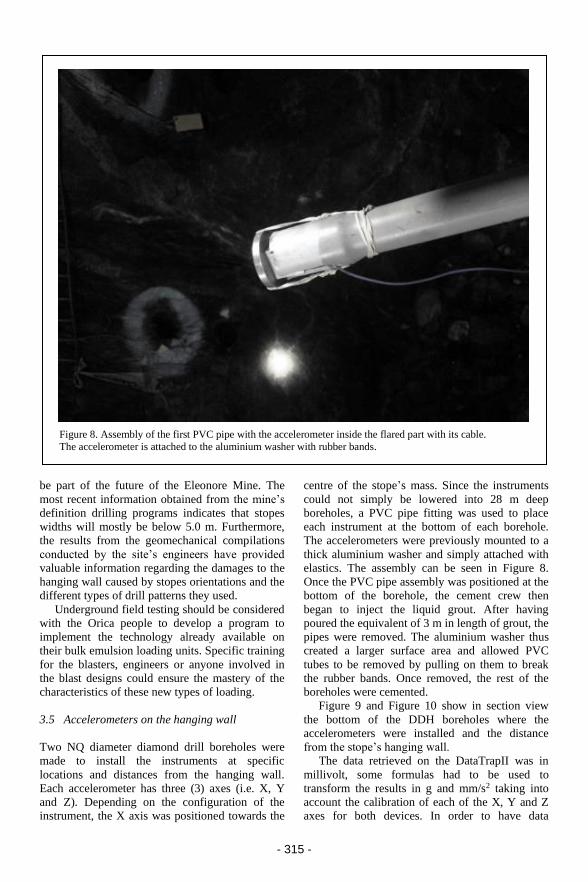
- 315 -
Figure 8. Assembly of the first PVC pipe with the accelerometer inside the flared part with its cable.
The accelerometer is attached to the aluminium washer with rubber bands.
be part of the future of the Eleonore Mine. The
most recent information obtained from the mine’s
definition drilling programs indicates that stopes
widths will mostly be below 5.0 m. Furthermore,
the results from the geomechanical compilations
conducted by the site’s engineers have provided
valuable information regarding the damages to the
hanging wall caused by stopes orientations and the
different types of drill patterns they used.
Underground field testing should be considered
with the Orica people to develop a program to
implement the technology already available on
their bulk emulsion loading units. Specific training
for the blasters, engineers or anyone involved in
the blast designs could ensure the mastery of the
characteristics of these new types of loading.
3.5 Accelerometers on the hanging wall
Two NQ diameter diamond drill boreholes were
made to install the instruments at specific
locations and distances from the hanging wall.
Each accelerometer has three (3) axes (i.e. X, Y
and Z). Depending on the configuration of the
instrument, the X axis was positioned towards the
centre of the stope’s mass. Since the instruments
could not simply be lowered into 28 m deep
boreholes, a PVC pipe fitting was used to place
each instrument at the bottom of each borehole.
The accelerometers were previously mounted to a
thick aluminium washer and simply attached with
elastics. The assembly can be seen in Figure 8.
Once the PVC pipe assembly was positioned at the
bottom of the borehole, the cement crew then
began to inject the liquid grout. After having
poured the equivalent of 3 m in length of grout, the
pipes were removed. The aluminium washer thus
created a larger surface area and allowed PVC
tubes to be removed by pulling on them to break
the rubber bands. Once removed, the rest of the
boreholes were cemented.
Figure 9 and Figure 10 show in section view
the bottom of the DDH boreholes where the
accelerometers were installed and the distance
from the stope’s hanging wall.
The data retrieved on the DataTrapII was in
millivolt, some formulas had to be used to
transform the results in g and mm/s2 taking into
account the calibration of each of the X, Y and Z
axes for both devices. In order to have data
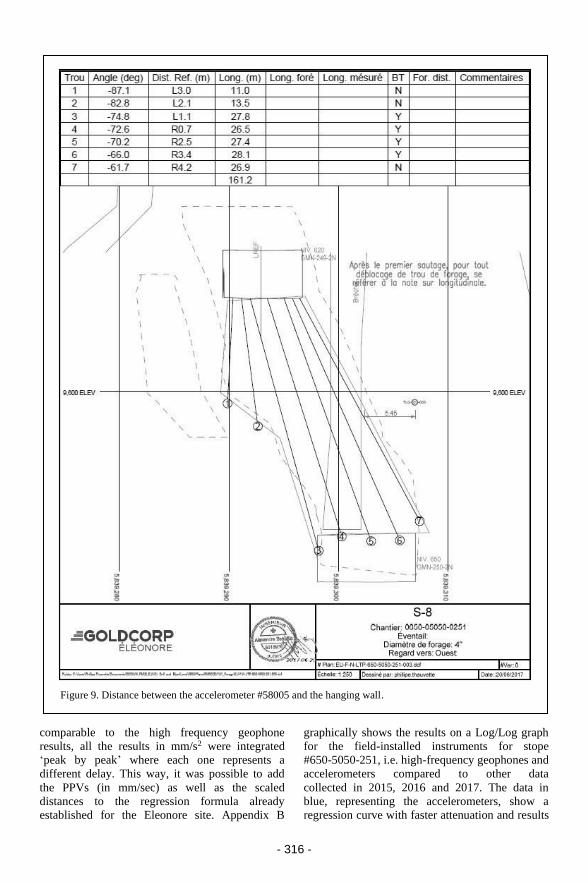
- 316 -
Figure 9. Distance between the accelerometer #58005 and the hanging wall.
comparable to the high frequency geophone
results, all the results in mm/s2 were integrated
‘peak by peak’ where each one represents a
different delay. This way, it was possible to add
the PPVs (in mm/sec) as well as the scaled
distances to the regression formula already
established for the Eleonore site. Appendix B
graphically shows the results on a Log/Log graph
for the field-installed instruments for stope
#650-5050-251, i.e. high-frequency geophones and
accelerometers compared to other data
collected in 2015, 2016 and 2017. The data in
blue, representing the accelerometers, show a
regression curve with faster attenuation and results
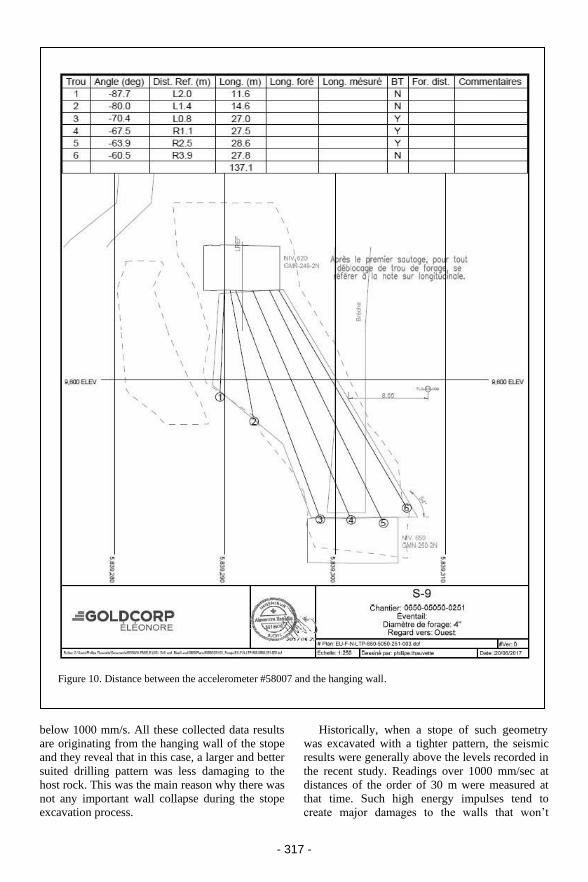
- 317 -
Figure 10. Distance between the accelerometer #58007 and the hanging wall.
below 1000 mm/s. All these collected data results
are originating from the hanging wall of the stope
and they reveal that in this case, a larger and better
suited drilling pattern was less damaging to the
host rock. This was the main reason why there was
not any important wall collapse during the stope
excavation process.
Historically, when a stope of such geometry
was excavated with a tighter pattern, the seismic
results were generally above the levels recorded in
the recent study. Readings over 1000 mm/sec at
distances of the order of 30 m were measured at
that time. Such high energy impulses tend to
create major damages to the walls that won’t
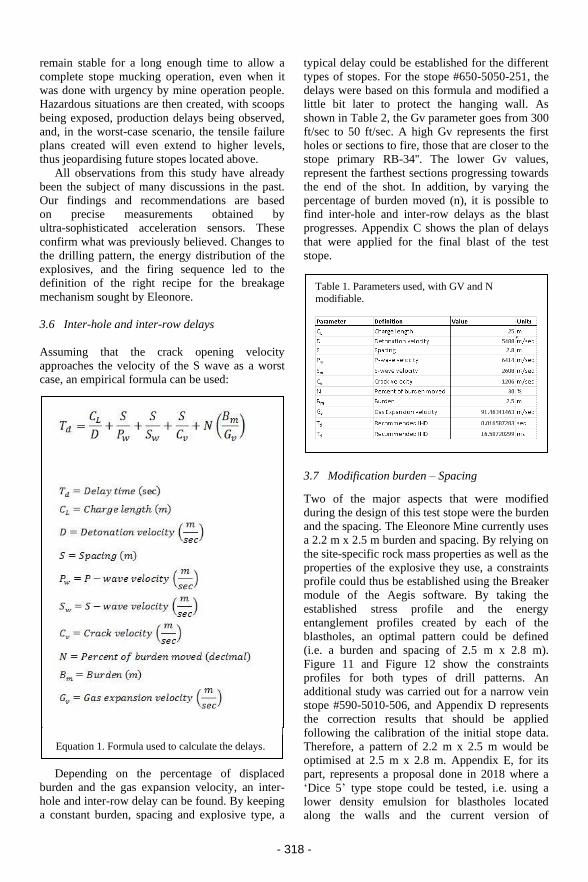
- 318 -
Table 1. Parameters used, with GV and N
modifiable.
remain stable for a long enough time to allow a
complete stope mucking operation, even when it
was done with urgency by mine operation people.
Hazardous situations are then created, with scoops
being exposed, production delays being observed,
and, in the worst-case scenario, the tensile failure
plans created will even extend to higher levels,
thus jeopardising future stopes located above.
All observations from this study have already
been the subject of many discussions in the past.
Our findings and recommendations are based
on precise measurements obtained by
ultra-sophisticated acceleration sensors. These
confirm what was previously believed. Changes to
the drilling pattern, the energy distribution of the
explosives, and the firing sequence led to the
definition of the right recipe for the breakage
mechanism sought by Eleonore.
3.6 Inter-hole and inter-row delays
Assuming that the crack opening velocity
approaches the velocity of the S wave as a worst
case, an empirical formula can be used:
Equation 1. Formula used to calculate the delays.
Depending on the percentage of displaced
burden and the gas expansion velocity, an inter-
hole and inter-row delay can be found. By keeping
a constant burden, spacing and explosive type, a
typical delay could be established for the different
types of stopes. For the stope #650-5050-251, the
delays were based on this formula and modified a
little bit later to protect the hanging wall. As
shown in Table 2, the Gv parameter goes from 300
ft/sec to 50 ft/sec. A high Gv represents the first
holes or sections to fire, those that are closer to the
stope primary RB-34''. The lower Gv values,
represent the farthest sections progressing towards
the end of the shot. In addition, by varying the
percentage of burden moved (n), it is possible to
find inter-hole and inter-row delays as the blast
progresses. Appendix C shows the plan of delays
that were applied for the final blast of the test
stope.
3.7 Modification burden – Spacing
Two of the major aspects that were modified
during the design of this test stope were the burden
and the spacing. The Eleonore Mine currently uses
a 2.2 m x 2.5 m burden and spacing. By relying on
the site-specific rock mass properties as well as the
properties of the explosive they use, a constraints
profile could thus be established using the Breaker
module of the Aegis software. By taking the
established stress profile and the energy
entanglement profiles created by each of the
blastholes, an optimal pattern could be defined
(i.e. a burden and spacing of 2.5 m x 2.8 m).
Figure 11 and Figure 12 show the constraints
profiles for both types of drill patterns. An
additional study was carried out for a narrow vein
stope #590-5010-506, and Appendix D represents
the correction results that should be applied
following the calibration of the initial stope data.
Therefore, a pattern of 2.2 m x 2.5 m would be
optimised at 2.5 m x 2.8 m. Appendix E, for its
part, represents a proposal done in 2018 where a
‘Dice 5’ type stope could be tested, i.e. using a
lower density emulsion for blastholes located
along the walls and the current version of
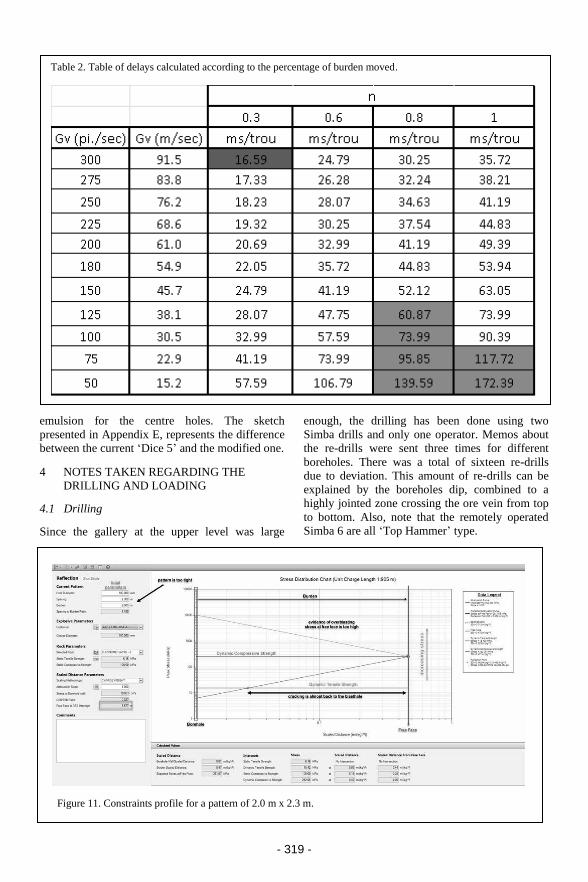
- 319 -
Table 2. Table of delays calculated according to the percentage of burden moved.
Figure 11. Constraints profile for a pattern of 2.0 m x 2.3 m.
emulsion for the centre holes. The sketch
presented in Appendix E, represents the difference
between the current ‘Dice 5’ and the modified one.
4 NOTES TAKEN REGARDING THE
DRILLING AND LOADING
4.1 Drilling
Since the gallery at the upper level was large
enough, the drilling has been done using two
Simba drills and only one operator. Memos about
the re-drills were sent three times for different
boreholes. There was a total of sixteen re-drills
due to deviation. This amount of re-drills can be
explained by the boreholes dip, combined to a
highly jointed zone crossing the ore vein from top
to bottom. Also, note that the remotely operated
Simba 6 are all ‘Top Hammer’ type.
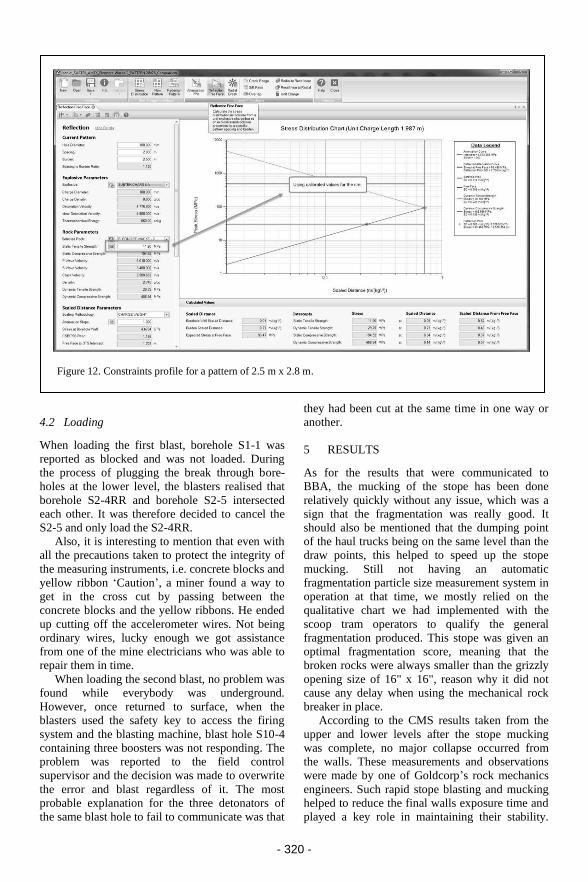
- 320 -
Figure 12. Constraints profile for a pattern of 2.5 m x 2.8 m.
4.2 Loading
When loading the first blast, borehole S1-1 was
reported as blocked and was not loaded. During
the process of plugging the break through bore-
holes at the lower level, the blasters realised that
borehole S2-4RR and borehole S2-5 intersected
each other. It was therefore decided to cancel the
S2-5 and only load the S2-4RR.
Also, it is interesting to mention that even with
all the precautions taken to protect the integrity of
the measuring instruments, i.e. concrete blocks and
yellow ribbon ‘Caution’, a miner found a way to
get in the cross cut by passing between the
concrete blocks and the yellow ribbons. He ended
up cutting off the accelerometer wires. Not being
ordinary wires, lucky enough we got assistance
from one of the mine electricians who was able to
repair them in time.
When loading the second blast, no problem was
found while everybody was underground.
However, once returned to surface, when the
blasters used the safety key to access the firing
system and the blasting machine, blast hole S10-4
containing three boosters was not responding. The
problem was reported to the field control
supervisor and the decision was made to overwrite
the error and blast regardless of it. The most
probable explanation for the three detonators of
the same blast hole to fail to communicate was that
they had been cut at the same time in one way or
another.
5 RESULTS
As for the results that were communicated to
BBA, the mucking of the stope has been done
relatively quickly without any issue, which was a
sign that the fragmentation was really good. It
should also be mentioned that the dumping point
of the haul trucks being on the same level than the
draw points, this helped to speed up the stope
mucking. Still not having an automatic
fragmentation particle size measurement system in
operation at that time, we mostly relied on the
qualitative chart we had implemented with the
scoop tram operators to qualify the general
fragmentation produced. This stope was given an
optimal fragmentation score, meaning that the
broken rocks were always smaller than the grizzly
opening size of 16" x 16", reason why it did not
cause any delay when using the mechanical rock
breaker in place.
According to the CMS results taken from the
upper and lower levels after the stope mucking
was complete, no major collapse occurred from
the walls. These measurements and observations
were made by one of Goldcorp’s rock mechanics
engineers. Such rapid stope blasting and mucking
helped to reduce the final walls exposure time and
played a key role in maintaining their stability.
- 321 -
The same expectations should be applied toward
other test with new drill patterns.
After reconciliation, the dilution of the stope
was 5.3% according to the Aegis software
predicted break envelope and 9.3% according to
the standard dilution calculation methodology used
by the mine. Stope #650-5050-251 was therefore
able to remain under the barrier of the 10%
coveted dilution.
6 RECOMMENDATIONS
− maintain drilling patterns of 2.5 m of burden
by 2.8 m of spacing for stopes of similar
width and geometry
− avoid recreating situations where the
explosive charges are too close to the free
faces, which have the effect of generating a
series of adverse propagation of the waves
towards the back of the blast or to the
adjacent blast holes
− adjust the delays between the rows according
to the burdens displacement velocities
established during different field studies
− always take Flexit measurements in boreholes
that do not break through on the lower level;
the options offered by the device’s software
make it possible to identify and reject the
magnetically affected values; this tool, when
combined with the simple and practical use of
an inverted flashlight down into the bore-
holes, will minimise the impacts of boreholes
having deviated too much
− conduct velocity of detonation measurements
periodically (every three months) in order to
validate the quality of the loading methods
− introduce the concept of loading with variable
density emulsions to mitigate the effects of
100 mm diameter boreholes for stopes of
narrower geometry
− thoroughly proceed with seismic
measurement and data collections in near
field from the stopes to validate and comply
with the pre-established damage limits
− complete the search for the best suited
fragmentation measuring system for
underground mine operation
7 CONCLUSIONS
Increasing the 100 mm borehole drilling pattern to
2.5 m by 2.8 m significantly contributed to the
success of this project. The energy distributions of
the bulk emulsion explosive charges with a density
of 1.25 gr/cc were also optimised. This element,
combined with appropriate confinement levels,
allowed for better control of the effective burden
of each charge, maximising their performance in
terms of breakage instead of vibration generation
toward the walls. Moreover, the electronic
detonators sequence used was derived from
estimated broken rock mass displacement
velocities applicable to underground mines
blasting’s powder factors.
All of these factors helped producing vibration
levels that were well below what the mine used to
measure. Maximum amplitudes of 1,000 mm/sec
were detected by the accelerometer located at 5.0
m in the hanging wall (see Appendix B).
Historically, the high frequency geophone’s
readings were taken at distances of about 30.0 m
from the stope. This is a significant reduction and
it explains why no oversize block was reported
during mucking operations. In addition, no major
rock fall occurred from the walls during the same
period. The measurements taken by the CMS
confirmed that both the hanging wall and foot wall
were able to withstand the impacts of multiple
charges detonating in very short delays.
The dilution ratio, less than 10%, is a milestone
for a gold mine producing a high daily tonnage of
more than 5,000 metric tons. The knowledge gains
made during this project must be transposed to the
future stopes. Additional improvements could
even be considered by introducing variable density
emulsions in the blast holes located close along the
hanging wall of narrower veins (< 5.0 m).
Pre-established vibration control limit and
criteria remain a key performance indicator (KPI)
of underground production blasting and the data
collection activities still have to be supported and
reinforced. The challenges associated to
conducting frequent underground vibration
measurements should be resolved by the
implementation of telemetry allowing a much
easier communication with the instruments located
underground.
The different programming options of
electronic detonator systems offer a multitude of
possibilities, but it is imperative that they always
be determined according to surveyed borehole
locations (not just theoretical) and the resulting
effective burdens displacement velocities, as it was
systematically done during this exercise. Thus,
new borehole deviation survey instrumentations
and burden velocity measurements tools are being
developed in order to validate the values that were
used during this project.
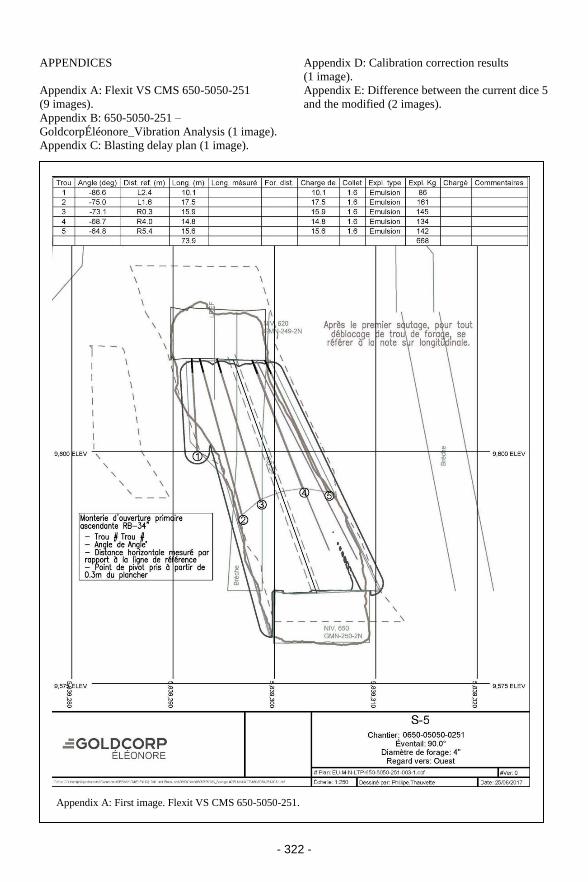
- 322 -
Appendix A: First image. Flexit VS CMS 650-5050-251.
APPENDICES
Appendix A: Flexit VS CMS 650-5050-251
(9 images).
Appendix B: 650-5050-251 –
GoldcorpÉléonore_Vibration Analysis (1 image).
Appendix C: Blasting delay plan (1 image).
Appendix D: Calibration correction results
(1 image).
Appendix E: Difference between the current dice 5
and the modified (2 images).

- 323 -
Appendix A: Second image. Flexit VS CMS 650-5050-251.
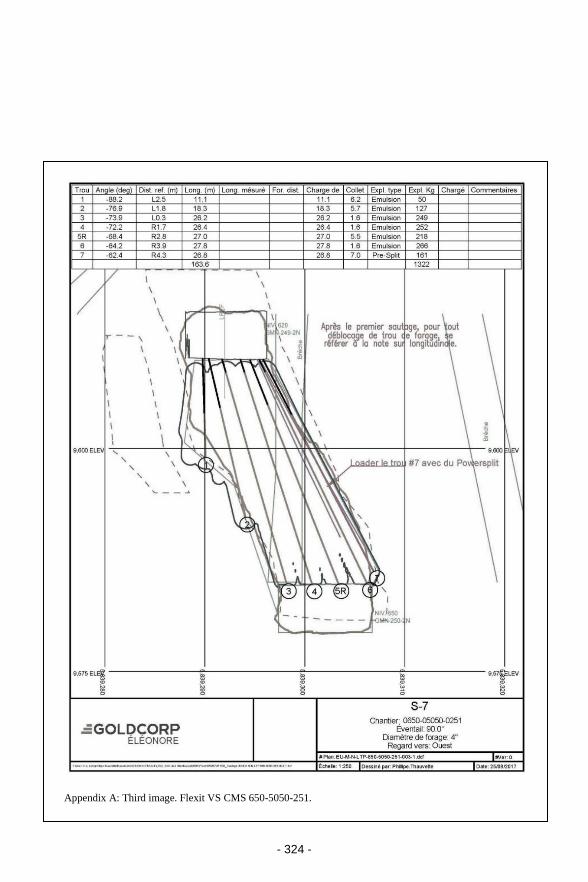
- 324 -
Appendix A: Third image. Flexit VS CMS 650-5050-251.
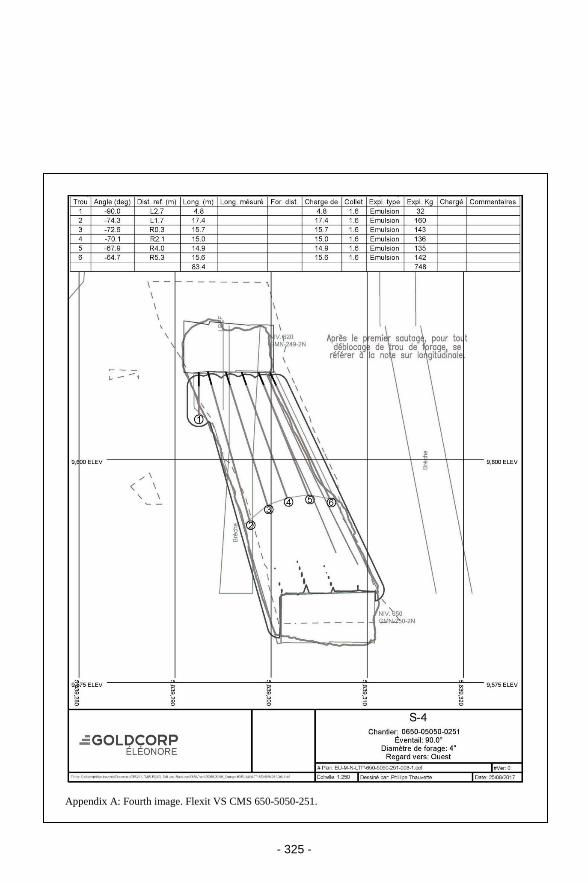
- 325 -
Appendix A: Fourth image. Flexit VS CMS 650-5050-251.
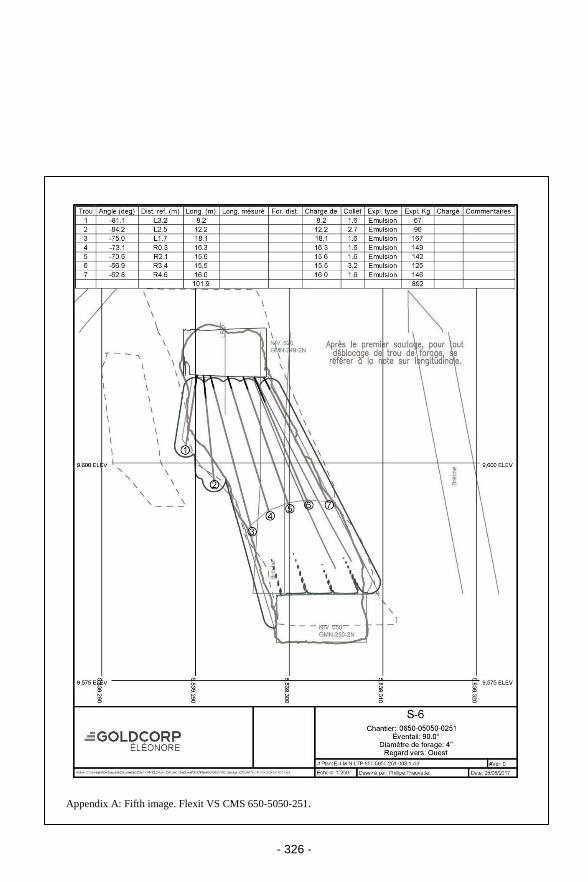
- 326 -
Appendix A: Fifth image. Flexit VS CMS 650-5050-251.
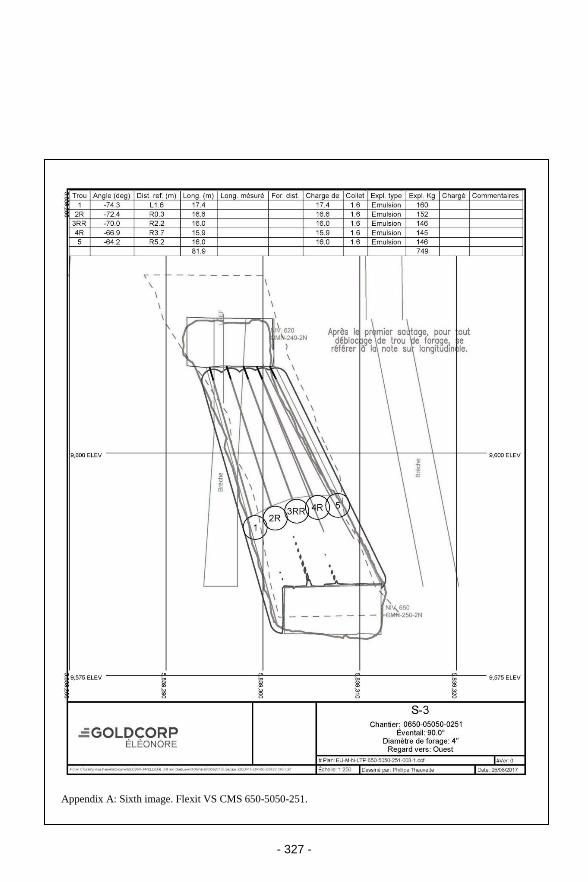
- 327 -
Appendix A: Sixth image. Flexit VS CMS 650-5050-251.
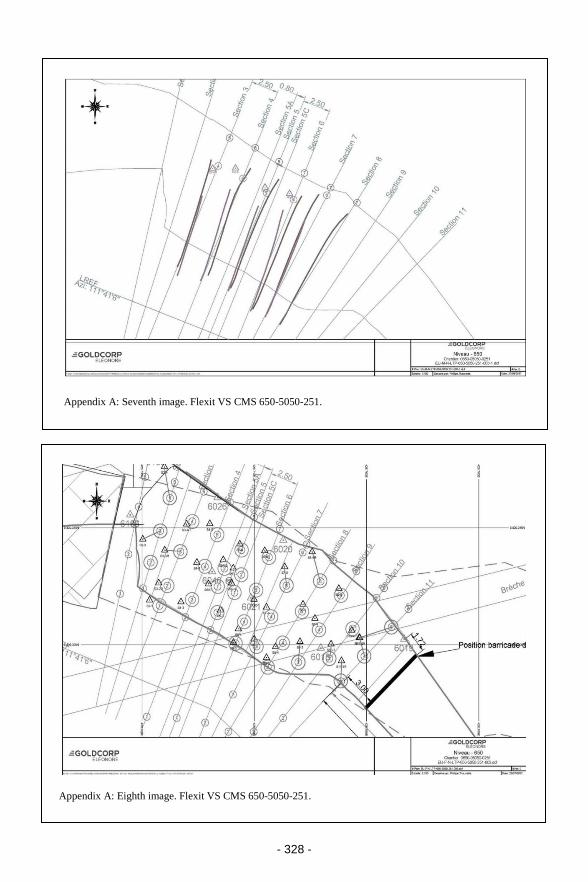
- 328 -
Appendix A: Seventh image. Flexit VS CMS 650-5050-251.
Appendix A: Eighth image. Flexit VS CMS 650-5050-251.

- 329 -
Appendix A: Ninth image. Flexit VS CMS 650-5050-251.
Appendix B: 650-5050-251 - GoldcorpÉléonore_Vibration Analysis.
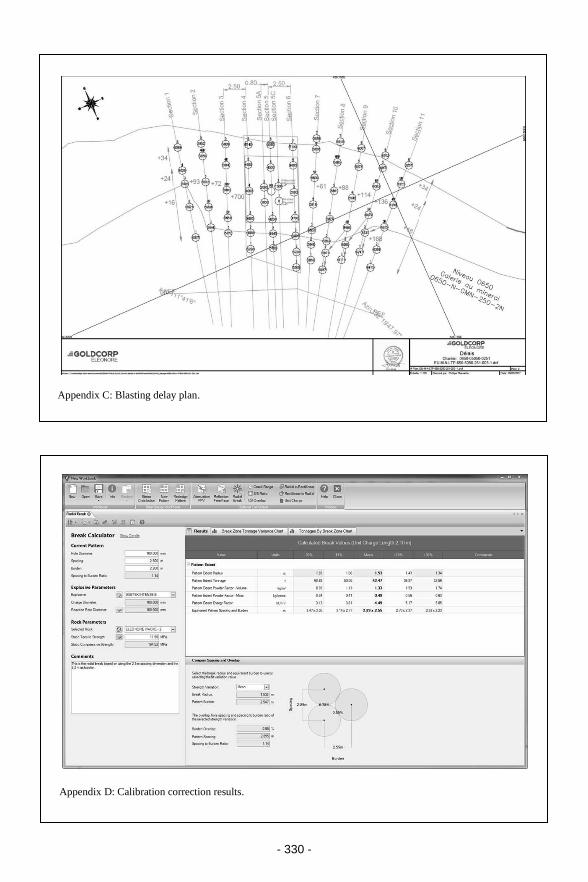
- 330 -
Appendix C: Blasting delay plan.
Appendix D: Calibration correction results.
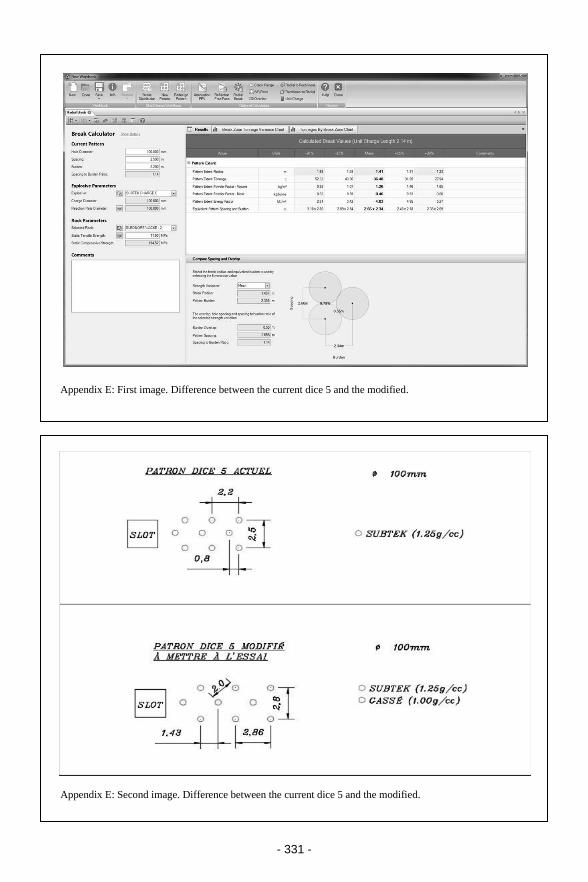
- 331 -
Appendix E: First image. Difference between the current dice 5 and the modified.
Appendix E: Second image. Difference between the current dice 5 and the modified.

- 332 -
- 333 -
1 RESEARCH OBJECTIVE
The ability for a mining or construction project to
generate smooth walls through the use of
explosives is paramount to the operation being
economically effective and safe for employees.
The use of proper presplitting can reduce the
amount of scaling required to 1/10 of that required
when traditional blasting is utilised (Paine, Holmes
& Clark 1961). This has large economic savings in
reduction of manpower ad equipment required and
increased excavation capacity. This also leads to a
safer project as less rockfalls occur during the
scaling process when men and equipment are near
the highwall. The minimisation of back-break is
not only seen on the face of the excavation, but the
reduction in blast damage is metres thick where
proper presplits show no degradation of the rock
beyond the presplit line (Matheson & Swindells
1981).
While traditional presplit methods can be
utilised in hard rock types, they encounter
problems when they are applied to weaker rocks.
This has led to a false concept that weaker
sandstones, shales, mudstones, and siltstones
cannot be presplit. However, the method of
precision presplitting has been applied to all of
these conditions effectively and shown presplits
with near perfect walls in full-scale construction
projects (Spagna, Konya & Smith 2005).
Traditional presplit methods often caused
problems with this type of rock as the explosive
load was too great and crushing or cratering
around the borehole would cause overbreak.
Oftentimes, the structural properties of the
geology being blasted also cause back-break
The development of pressure to Young’s modulus models for
precision presplit blasting
A.J. Konya & C.J. Konya Precision Blasting Services, Montville, Ohio, USA
ABSTRACT: Precision presplitting has been defined as a new method of presplitting which utilises light
explosive loads of less than 0.15 kg/m (0.1 lbs/ft) of borehole and a close spacing of 0.61 m (2 ft) or less.
This new method of presplitting has been used on hundreds of construction projects to control overbreak
in weak and heavily jointed rock, specifically in construction projects. This paper will look at the
mechanisms of how this presplit forms under these light loads and present new models which relate
borehole pressure to the rock characteristics, specifically the Young’s Modulus with multiple variations in
spacing. This gives explosives engineers a new tool to help design this presplit through various borehole
diameters, spacing distances, rock types, and structural environments while assuring a smooth neat line is
developed with a minimal slow zone.
Helsinki Conference Proceedings 2019, R. Holmberg et al © 2019 European Federation of Explosives Engineers, ISBN 978-0-9550290-6-6
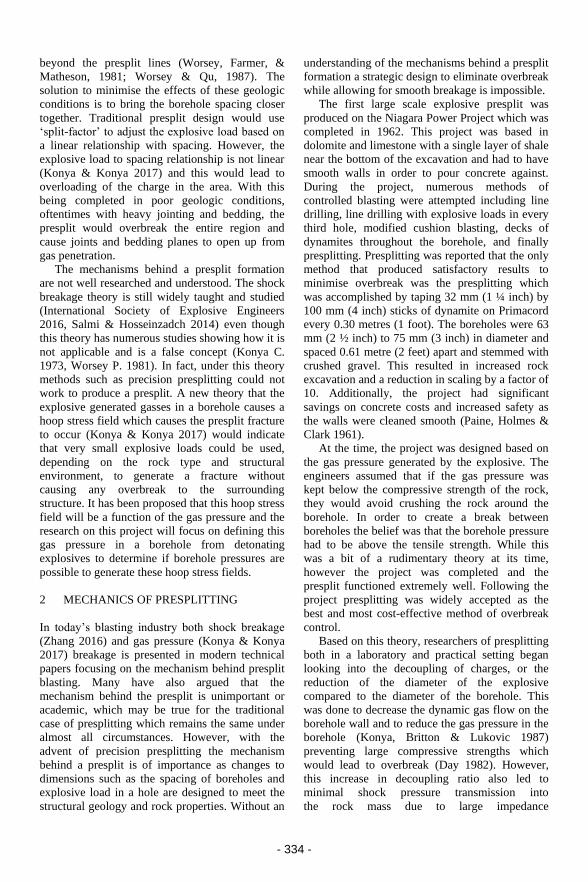
- 334 -
beyond the presplit lines (Worsey, Farmer, &
Matheson, 1981; Worsey & Qu, 1987). The
solution to minimise the effects of these geologic
conditions is to bring the borehole spacing closer
together. Traditional presplit design would use
‘split-factor’ to adjust the explosive load based on
a linear relationship with spacing. However, the
explosive load to spacing relationship is not linear
(Konya & Konya 2017) and this would lead to
overloading of the charge in the area. With this
being completed in poor geologic conditions,
oftentimes with heavy jointing and bedding, the
presplit would overbreak the entire region and
cause joints and bedding planes to open up from
gas penetration.
The mechanisms behind a presplit formation
are not well researched and understood. The shock
breakage theory is still widely taught and studied
(International Society of Explosive Engineers
2016, Salmi & Hosseinzadch 2014) even though
this theory has numerous studies showing how it is
not applicable and is a false concept (Konya C.
1973, Worsey P. 1981). In fact, under this theory
methods such as precision presplitting could not
work to produce a presplit. A new theory that the
explosive generated gasses in a borehole causes a
hoop stress field which causes the presplit fracture
to occur (Konya & Konya 2017) would indicate
that very small explosive loads could be used,
depending on the rock type and structural
environment, to generate a fracture without
causing any overbreak to the surrounding
structure. It has been proposed that this hoop stress
field will be a function of the gas pressure and the
research on this project will focus on defining this
gas pressure in a borehole from detonating
explosives to determine if borehole pressures are
possible to generate these hoop stress fields.
2 MECHANICS OF PRESPLITTING
In today’s blasting industry both shock breakage
(Zhang 2016) and gas pressure (Konya & Konya
2017) breakage is presented in modern technical
papers focusing on the mechanism behind presplit
blasting. Many have also argued that the
mechanism behind the presplit is unimportant or
academic, which may be true for the traditional
case of presplitting which remains the same under
almost all circumstances. However, with the
advent of precision presplitting the mechanism
behind a presplit is of importance as changes to
dimensions such as the spacing of boreholes and
explosive load in a hole are designed to meet the
structural geology and rock properties. Without an
understanding of the mechanisms behind a presplit
formation a strategic design to eliminate overbreak
while allowing for smooth breakage is impossible.
The first large scale explosive presplit was
produced on the Niagara Power Project which was
completed in 1962. This project was based in
dolomite and limestone with a single layer of shale
near the bottom of the excavation and had to have
smooth walls in order to pour concrete against.
During the project, numerous methods of
controlled blasting were attempted including line
drilling, line drilling with explosive loads in every
third hole, modified cushion blasting, decks of
dynamites throughout the borehole, and finally
presplitting. Presplitting was reported that the only
method that produced satisfactory results to
minimise overbreak was the presplitting which
was accomplished by taping 32 mm (1 ¼ inch) by
100 mm (4 inch) sticks of dynamite on Primacord
every 0.30 metres (1 foot). The boreholes were 63
mm (2 ½ inch) to 75 mm (3 inch) in diameter and
spaced 0.61 metre (2 feet) apart and stemmed with
crushed gravel. This resulted in increased rock
excavation and a reduction in scaling by a factor of
10. Additionally, the project had significant
savings on concrete costs and increased safety as
the walls were cleaned smooth (Paine, Holmes &
Clark 1961).
At the time, the project was designed based on
the gas pressure generated by the explosive. The
engineers assumed that if the gas pressure was
kept below the compressive strength of the rock,
they would avoid crushing the rock around the
borehole. In order to create a break between
boreholes the belief was that the borehole pressure
had to be above the tensile strength. While this
was a bit of a rudimentary theory at its time,
however the project was completed and the
presplit functioned extremely well. Following the
project presplitting was widely accepted as the
best and most cost-effective method of overbreak
control.
Based on this theory, researchers of presplitting
both in a laboratory and practical setting began
looking into the decoupling of charges, or the
reduction of the diameter of the explosive
compared to the diameter of the borehole. This
was done to decrease the dynamic gas flow on the
borehole wall and to reduce the gas pressure in the
borehole (Konya, Britton & Lukovic 1987)
preventing large compressive strengths which
would lead to overbreak (Day 1982). However,
this increase in decoupling ratio also led to
minimal shock pressure transmission into
the rock mass due to large impedance

- 335 -
mismatches between explosives and air, then air
and rock.
With the large increase in research of shock
breakage in rock blasting, many authors began to
investigate possible effects of shockwave collision
between boreholes to develop tensile zones and
causing presplit formation (DuPont 1975, Crosby
& Bauer 1982). This theory was widespread due to
the popularity of the DuPont Blasters Handbook
and it is still circulated amongst many leading
organisations today (International Society of
Explosive Engineers 2016) and researchers (Salmi
& Hosseinzadch 2014). This theory was heavily
disputed and shown in numerous studies of the day
and it was shown that the shockwave has almost
no correlation between the dynamic shockwave
and the presplit formation, with numerous studies
showing that the quasi-static gas pressure in the
borehole was responsible for presplit formation
(Konya C 1973, Worsey P 1981, Worsey, Farmer
& Matheson 1981, Daehnke, Rossmanith &
Kouzniak 1996). Additional studies were
conducted utilising a propellant charge, Pyrodex,
to fire a presplit blast. These propellant charges
produced no shockwave as they deflagrate, not
detonate, (Akhavan 2011) which completed
isolated the gas pressure as the only working
energy. Using the same principles as in traditional
presplit design (Konya C 1980), the propellant
charges produced the exact same results as a
presplit blast that was fired with detonating
explosives (Konya, Barret & Smith 1986). This
proved that presplit mechanisms on a full-scale
blast had no reliance on the shockwave generated
by detonating explosives.
This led to the development of a precision
presplit style of blasting, where extremely light
loads of detonating cord are utilised to prevent all
breakage except for the breakage between
boreholes (Konya C 1982). This design utilised
closely spaced borehole of 0.61 metre (2 feet) or
less, to minimise the impacts of rock structure on
the presplit (Worsey P 1984, Worsey & Qu 1987,
Tariq & Worsey 1996). As this design
methodology has begun widespread use, new
empirical research into the explosive loading
based on the rock properties has been developed
(Konya & Konya 2015, Konya & Konya 2016,
Konya & Konya 2017).
This method of precision presplitting has
effectively zero shock energy to form a fracture
after accounting for impedance mismatches
(Cooper 1996), non-ideal detonation (Cook 1974),
and attenuation of the shockwave in the rock mass
(Spathis & Wheatley 2016). It has then been
theorised that the mechanism behind the presplit
formation is due to large hoop stresses which are
generated between the boreholes causing a
fracture, with no advancement of the fracture from
gas penetration (Konya & Konya 2017).
3 PRECISION PRESPLITTING
Precision presplitting is a presplit design technique
which was first applied in the 1982 (Konya C
1982) and utilised extremely light loads in closely
spaced boreholes to form a presplit with no
overbreak in weaker rocks. As it developed, the
rock type was considered which dictated variations
in the explosive load, with granites requiring a
much higher load than a sandstone or siltstone.
Those with experience in this method began to
have a feel for general ranges that each rock type
required based on a 0.61 metre (2 foot) spacing
between boreholes, and in a test blast could
identify the required load in most rock types.
These empirical methods were the basis behind
precision presplit design originally, just as they are
on traditional presplit design, and relied on the
engineer’s experience.
The borehole loads were typically so light that
no commercially sold presplit powder was
available for the application of precision
presplitting. The use of dynamite charges on
detonating cord was also not applicable as the
areas of dynamite would cause significant
overbreak. The only available choice to keep the
borehole loading light and consistent was
detonating cord which in weak rocks, such as
mudstones and siltstones, which may be kept
under 64 g/m (300 grains/ft). In 2015 the authors
began analysing this empirical data from
numerous construction projects around the United
States to develop equations to estimate the
explosive load for a precision presplit based on a
rock’s Young’s Modulus (Konya & Konya 2016).
The authors found this to have a good correlation
and Figure 1 shows the linear relationship between
the explosive load (g/m) and the Young’s Modulus
(GPa).
The Young’s modulus was chosen as the major
parameter for this work as it is normally readily
available on major construction projects in the
United States. Other parameters such as tensile
strength would also be of importance, however
these are typically not included in most geological
reports for contractors on construction projects or
in mines. If the Young’s modulus of the rock is not
known, it can easily be found for a majority of
rock types through a literature review as well and

- 336 -
Figure 1. Explosive load to Young’s modulus comparison with a 0.61 metre (2 foot)
spacing between boreholes.
the Young’s modulus does not vary as much as
tensile strength. The equation to estimate the
explosive load for a 0.61 metre spacing is shown
below in Equation 1:
(1)
Where: EL = Explosive Load (g/m) and E =
Young’s modulus (GPa)
The next step of the research was to develop a
method to design the explosive load at any
distance borehole spacing (Konya & Konya 2017).
The first step of this was the development of a
presplit factor which could be scaled using the
Young’s modulus of a rock. The Konya Presplit
Factor was developed and is shown by Equation 2:
(2)
Where: K = Konya Presplit Factor
This could then be used in Equation 3 to
determine the explosive load for a rock
considering any variations in spacing:
(3)
Where: S = Spacing (metres)
The chart of various rock types explosive load
(g/m) versus spacing (metres) is shown in
Figure 2.
4 BOREHOLE PRESSURE
The mechanism of breakage being analysed for the
precision presplitting is the effect of gas
pressurisation of the borehole generating hoop
stress fields between boreholes leading to fracture
formation. This relies on the proper pressurisation
on the borehole and an accurate determination of
the inter-borehole pressure. The authors have
relied upon stemming studies utilising borehole
simulation equipment which could accurately
measure the inter-borehole pressure from
decoupled charges (Otuonye 1981). The table of
pressures has been recreated in Table 1. This
pressure data was developed using decoupled
PETN charges which were highly decoupled. In
addition, this data includes holes that where
stemmed and all stemming was retained and holes
which had the stemming ejected at some point
during the detonation.
The authors have utilised this data to create
Equation 4, which can be used to estimate the
pressure in a borehole (GPa) based on the
explosive load (g/m). This equation has a R2 value
for the data of 0.9696 showing excellent fit even
with various stemming ejection conditions. This
equation is specifically applicable as a basic
equation for precision presplitting and has not
been evaluated in various other applications. The
authors do not recommend using this as an
all-encompassing borehole pressure equation for
other charge configurations and methods of
- 337 -
Figure 2. Explosive load variations based on spacing for multiple rock types.
Table 1. Recreation of borehole pressure based on charge weight (Otuonye 1981).
Weight
of
Charge
(Grams)
Pressure
(PSI)
Weight
of
Charge
(Grams)
Pressure
(PSI)
10 9,000 30 27,000
10 11,000 30 28,000
10 10,000 30 27,000
10 10,000 30 26,000
20 19,500 30 27,000
20 17,000 30 25,000
20 18,000 30 30,000
20 15,000 40 37,000
20 19,500 40 37,000
20 19,500 40 36,000
20 19,500 50 50,000
20 13,500 50 51,000
blasting as this equation is based on extreme
decoupling with PETN charges and would be
unrepresentative of other situations.
(4)
Where: P = Borehole Pressure (GPa)
This equation 4 will then be utilised in
accordance with Equation 3 to develop an equation
determining the total pressure required for
fracturing of various rock types. This will result in
Equation 5, which can be utilised to determine the
borehole pressure required for a presplit to form
based on the spacing of the presplit boreholes.
(5)
Where: P = Pressure (GPa); S = Spacing (m); K
= Konya Presplit Factor
This equation has then been used to develop
Figure 3 which shows the inter-borehole pressure
required to cause a presplit to form in various rock
types.
This model gives engineers the ability to
change numerous parameters in a presplit blast,
such as the stemming length and stemming type in
accordance with the retention and ejection
borehole pressure models; the explosive type; the
decoupling ratio; the loading parameters; etc. in
order to obtain proper borehole pressures for
fractures to form. This can be considered a low

- 338 -
Figure 3. Borehole spacing to borehole pressure based on Equation 5 for various rock types.
level of required pressure to obtain fracture which
is slightly above the minimum. The model does
slightly overestimate the pressure required for a
presplit at close spacings, especially for weak
rock, and it is advised that this be utilised for
spacings above 0.61 metrE (2 feet).
The authors are currently conducting research
using a borehole simulation pressure cannon to
further develop the pressure to presplit
relationship, particularly at close spacings for
weak rock types.
5 CONCLUSION
In this paper a model has been presented to
determine a low-level required borehole pressure
to cause a fracture to form from a presplit blast.
This was completed using previous research
projects the authors had completed using empirical
data to define explosive loading versus Young’
modulus and spacing equations along with
research completed collecting data on borehole
pressure from extremely decoupled PETN charges
in a borehole simulation device.
This indicated that two main parameters are
important to determine the pressure required in a
presplit; the rock type and the spacing that is
between boreholes. The rock type is characterised
by the Konya Presplit Factor, which is based on
the rock’s Young’s modulus. Equation 5 can then
be utilised to obtain a low-level inter-borehole
pressure required for a presplit to form. This can
then be utilised by engineers with other
inter-borehole pressure models to develop presplit
blasts in various rock and hole alignment
conditions.
REFERENCES
Akhavan, J. 2011. The Chemistry of Explosives.
Cambridge: RSC Publishing.
Cook, M.A. 1974. The Science of Industrial
Explosives. Salt Lake City: IRECO Chemicals.
Cooper, P. 1996. Explosive Engineering. New York,
New York: VCH Publishers Inc.
Crosby, W. & Bauer, A. 1982. Wall control blasting
in open pits. Mining Engineering, 34(2), 155-158.
Daehnke, A., Rossmanith, H. & Kouzniak, N. 1996).
Dynamic fracture propagation due to blast
induced high pressure gas loading. 2nd North
American Rock Mechanics Symposium.

- 339 -
Day, P. 1982. Controlled blasting to minimise
overbreak with big boreholes underground.
Proceedings of the Eighth Conference on
Explosives and Blasting Technique, 264-274.
DuPont 1975. DuPont Blasters Handbook. DuPont.
International Society of Explosive Engineers 2016.
Blasters Handbook 18th Edition. International
Society of Explosive Engineers.
Konya, A.J. & Konya, C.J. 2017. Precision
presplitting. Proceedings of the Society for
Mining, Metallurgy, and Exploration.
Konya, A. & Konya, C. 2016. Precision presplitting
optimisation. Proceedings of the 42nd
International Conference on Blasting and
Explosive Technique.
Konya, A. & Konya, C. 2017. Precision presplitting.
Proceedings of the Society for Mining,
Metallurgy, and Exploration.
Konya, A. & Konya, C. 2017. Precision presplitting -
explosive variations with spacing. Proceedings of
the 43rd International Conference on Explosive
and Blasting Technique.
Konya, C. 1973. High speed photographic analysis of
the mechanics of presplit blasting. Proceedings of
Sprengtechnick International.
Konya, C. 1980. Pre-split blasting: theory and
practice. Preprint AIME, 80-97.
Konya, C. 1982. Seminar on blasting to the Ohio
Laborers Union. Mont Vernon, Ohio.
Konya, C. & Konya, A. 2015. Precision presplitting
optimisation. 8th Drilling-Blasting Symposium,
(pp. 1-10). Istanbul, Turkey.
Konya, C., Barret, D. & Smith, J.E. 1986. Presplitting
granite using Pyrodex, a propellant. Proceedings
of the Twelfth Conference on Explosive and
Blasting Technique, 159-166.
Konya, C., Britton, R. & Lukovic, S. 1987. Charge
decoupling and its effect on energy release and
transmission for one dynamite and water gel
explosive. Proceedings of the Thirteenth
Conference on Explosives and Blasting
Technique.
Matheson, G. & Swindells, C. 1981. Seismic
detection and measurement of blast disturbances.
Transport and Road Resarch Laboratoy.
Otuonye, F. 1981. Effective blasthole stemming.
Department of Civil Engineering. Columbus: The
Ohio State University.
Paine, R., Holmes, D. & Clark, H. 1961. Presplit
blasting at the Niagara power project. The
Explosives Engineer, 72-91.
Salmi, E. & Hosseinzadch, S. 2014. A further study
on the mechanisms of pre-splitting in mining
engineering. App Mech Mater, 553, 476-481.
Spagna, S., Konya, C. & Smith, E. 2005. Utilisation
of detonation cord to presplit Pennsylvanian aged
sandstone and shale, Grundy, Virginia.
Proceedings of the International Conference on
Explosives and Blasting Technique.
Spathis, A. & Wheatley, M. 2016. Dynamic pressure
measured in a water-filled hole adjacent to a short
explosive charge detonated in rock. Blasting and
Fragmentation Journal, 10(1), 33-42.
Tariq, S. & Worsey, P. 1996. An investigation into
the effects of some aspects of jointing and single
decoupled blast holes on pre-splitting and boulder
blasting. Rock Fragmentation by Blasting -
Fragblast 5, 438.
Worsey, P. 1981. Geotechnical factors affecting the
application of presplit blasting to rock slopes.
University of Newcastle Upon Tyne.
Worsey, P. 1984. The effect of discontinuity
orientation on the success of presplit blasting.
10th Annual Society of Explosive Engineers
Conference on Explosives and Blasting
Technique, 197-217.
Worsey, P. & Qu, S. 1987. Effect of joint separation
and filling on presplit blasting. 13th Society of
Explosive Engineers Conference on Explosives
and Blasting Technique.
Worsey, P., Farmer, I. & Matheson, G. 1981. The
mechanics of presplitting in discontinuous rocks.
22nd U.S. Symposium on Rock Mechanics, 205-
210.
Zhang, Z.X. 2016. Rock fracture and blasting theory
and applications. Elsevier Inc.

- 340 -
- 341 -
1 INTRODUCTION
1.1 The blast management framework
This paper is a follow-up to the paper published in
the 9th EFEE conference held in Stockholm. In that
paper (Little 2017) the author showed how the
recently developed blast design requirements
(BDR) classification scheme could be used to
improve the blast design management process, see
Figure 1. In the current paper the second
component, blast design and analysis, is
demonstrated within a wall control blasting
context.
1.2 Further development of the BDR
classification scheme
The development of the BDR classification
scheme began by focusing on ground control
blasting (Little 2015) and was extended to all
surface blasting applications (Little 2017). The
BDR classification scheme was further developed
to cater for underground blasting operations and
the paper introduces the relatively new concept of
‘value-based ore control’ (Little & Lovitt 2018). In
this paper the author has taken the opportunity to
provide an update to the BDR classification
scheme to include ‘ground improvement’ as a
technical blasting objective. Note, the overall aim
is for the BDR classification scheme to be relevant
to all blasting operations in soil or rock on the
surface, underground and underwater.
The BDR classification system uses four
classification elements: the blast location relative
to the earth’s surface, the number of different
grades of geological materials, the orientation of
the free face relative to the blastholes, and the
number and type of primary technical blasting
objectives. The first three classification elements
Wall control blasting – design and analysis
T.N. Little Blasting Geomechanics Pty Ltd, Australia
ABSTRACT: This paper is concerned with design and analysis of Wall Control Blasts. The introduction
is used to reintroduce the blast management framework and the blast design requirements classification
system previously developed by the author. The four categories of approaches to blast design are also
outlined. The second section discusses wall control blasting objectives, in terms of profile control and
damage control, and performance evaluation. In the third section, line drilling and four wall control
blasting techniques are defined. The next section of the paper explores three wall control designs
elements: Pre-split design – it is not as easy as people think; Single hole (or row) design – trial and error
is too slow; and Blast pattern timing design – poor timing and firing direction can increase damage.
Modified production blast design can simplify mining operations and reduce operating costs; and Slope
steepening design, if it can be successfully applied, the method can increase the ore reserve and decrease
waste volume. Eight conclusions have been formulated based on the current study.
Helsinki Conference Proceedings 2019, R. Holmberg et al © 2019 European Federation of Explosives Engineers, ISBN 978-0-9550290-6-6
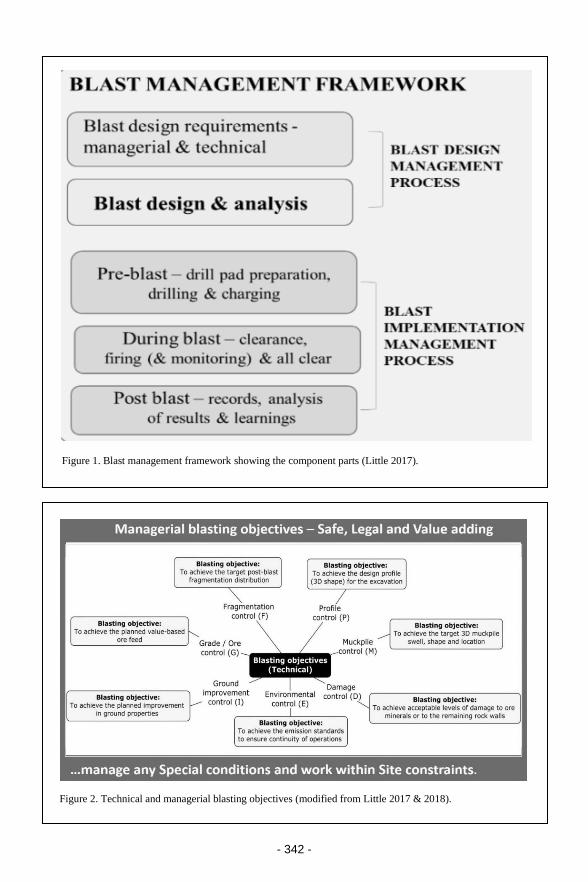
- 342 -
Figure 1. Blast management framework showing the component parts (Little 2017).
Figure 2. Technical and managerial blasting objectives (modified from Little 2017 & 2018).

- 343 -
Table 1. Technical blasting objectives.
Technical
Blasting
Objective
Interpretation in soil and
rock blasting context
G Grade /Ore
control
Reducing unplanned ore
loss and unplanned
dilution.
F Fragmentation
control
Obtaining the desired
fragment distribution.
D Damage
control
Reducing strength of the
remaining rockmass.
Reducing damage to
valuable minerals.
P Profile control Reducing overbreak,
underbreak and bridging.
M Muckpile
control
Obtaining required muck-
pile and ore flow
characteristics.
E Environmental
control
Reducing unwanted
blasting emissions e.g.
vibration, airblast, fumes,
dust, flyrock, water
pollution and asset damage.
I Ground
Improvement
control
Increase density and/or
shear strength of weak
geomaterial zones. Reduce
stress in highly stressed
rock volumes.
Figure 3. Approaches to blast design.
are objective physical properties and the fourth
relates to technical blasting design objectives.
Blasting objectives have been grouped into two
categories, managerial and technical, see Figure 2.
The premise is that all blasts must satisfy the
managerial objectives and hence have not been
included in the BDR classification scheme. That
is, all blasts must be safe, legal, add value, manage
any special conditions and work within site
constraints. Note that blast design is the
fundamental engineering control to obtain
consistent outputs that achieves all relevant
blasting objectives.
1.3 Approaches to blast design
The four main approaches to blast design are
illustrated in Figure 3.
The experiential approach may be acceptable
for one-off shot-firing tasks but is not suitable for
mine blasting. Benchmarking from similar sites
can be a good starting position.
Trial blasting is a sound approach to blast
design as feedback on the performance of the
design is rapidly received (in days). It should be
noted that design feedback for slope engineering
can takes years to decades.
Empirical methods, such as rules of thumb or
blasting indices, can be used as a first pass design
or as a broad-brush audit check. A number of
empirical fragmentation distribution models are

- 344 -
Figure 4. Profile control techniques.
available and commonly used. Customised or site-
specific blast ability indices can be developed and
used successfully.
Blast model assisted design is the approach
considered to be the ‘state of the art’ and is
demonstrated in this article.
2 WALL CONTROL OBJECTIVES
2.1 Wall control blasting objectives
Wall control blasts involve both profile control
and damage control blasting objectives. A BDR
classification for a typical wall control blast will
take the following form: S_SG_VF_PDO
Where: S – Surface blast, SG – single grade of
material (i.e. ore or waste), VF – vertical or
sub-vertical free face, and PDO – profile and
damage control technical objectives in priority
order. Note, some wall control applications may
set a priority of damage ahead of profile (DPO).
2.2 Profile control blasting objectives
Figure 4 shows the range of profile control
techniques. Pre-split, post-split, and line drilling
(and guide hole) are not - discussed here as they
are addressed in Section 3.
Fracture control aims to control the generated
fracture direction and length. It can be achieved by
modifying the- blasthole shape, charge shape or
charge configuration. The shock wave reflecting
device placed in the toe of a blasthole is a new and
novel approach used in contour (profile control)
blasting for dam engineering in China (Lu et al.
2018).
When assessing the performance of profile
control technique results, a face achievement (Df)
rating can be used. The assessment involves
evaluating: bench face angle (50% weighting),
bench width (40%) and toe position (10%). The
percentage in brackets is the weighting system
sometimes used. A more rigorous approach has
been developed (Seery et al. 2007 and Juldyz
2019) called Excavation Compliance Indicator
(ECI). Juldyz (2019) concluded that, every deposit
has its own litho‐structural characteristics and
mining practices that could directly or indirectly
affect design achievement. Design achievement
tolerances should be applied to the bench face
angle, crest and toe elements based on equipment
size and operational practices; i.e. ECI tolerances
and weightings should be deposit‐specific.
2.3 Damage control blasting objectives
Figure 5 illustrates the main damage control
blasting techniques. They work in association with
profile control techniques and it is critical they do
not compromise them. For example, if the trim
blast takes out the pre-split line the mine is
wasting money, may not achieve design and is

- 345 -
Table 2. Wall control blasting techniques.
Method and illustrative cross section Features
Method 1 Buffer (Stand-off) blasting
Buffer blasting can be used in weak rock masses and
has the following general features:
Toe standoffs is critical
Blasthole diameter can be same as production holes
Charge in buffer rows can be reduced
Excavation equipment digs to hard
BDR classification S_SG_VF_DPFO
Method 2 Pre-split blasting
Pre-split or mid-split blasting works best in massive
rock with tight joints and has the following general
features:
Smaller diameter blastholes and closely spaced
Loaded with decoupled charges to reduce blasthole
pressure
Blastholes are fired prior (milliseconds or days) to the
first hole in the adjacent pattern
Unstemmed unless mine is airblast sensitive
BDR classification: S_SG_VF_PDO
Method 3 Trim blasting
Trim blasting can be used in a wide variety of rock
masses and has the following general features:
Generally, uses smaller diameter blastholes and can be
used with or without pre-split
The balance between charge weight and standoff is
critical but the balance between charge diameter and
stand-off distance is even more critical
Can be free faced or choked or reverse fired
BDR classification: S_SG_VF_DPFO
Method 4 Post-split blasting
Post-Split blasting is not often used and has the
following general features:
Row of closely spaced holes along the final wall
Light and well distributed charges used
Blastholes drilled and fired after primary blast is
excavated (Dynamic post-split has also been used)
Critical that damage from primary blast not to extend
beyond post-split line
BDR classification: S_SG_VF_PDO
Method 5 Line drilling
Line drilling can be used in most ground and has the
following general features:
Line of closely spaced unloaded holes drilled along the
final limit
This weakened zone helps guide the excavation of the
slope
BDR classification: Not applicable
potentially creating a rockfall hazard. These
damage control techniques are all discussed and
addressed in Section 3 of this paper.
When assessing the performance of damage
control a face condition (Fc) assessment can be
used. It involves evaluating: percent of visible
half-barrels (20%), intact rock breakage
(15%), open joints (10%), loose material on
the face (10%), face profile [in section]
(20%), and crest condition (10%). For more detail
see Walliams et al. (2009) and Figure 15 in this
paper.
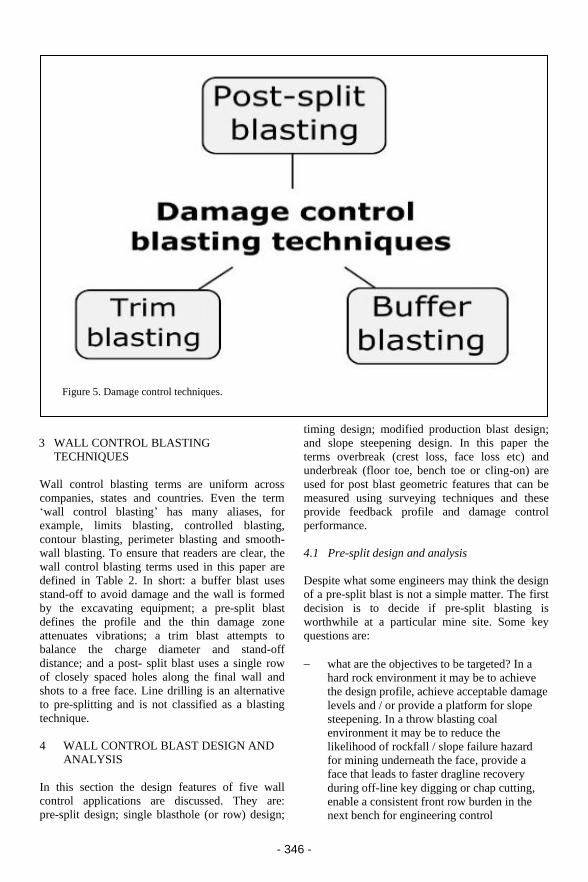
- 346 -
Figure 5. Damage control techniques.
3 WALL CONTROL BLASTING
TECHNIQUES
Wall control blasting terms are uniform across
companies, states and countries. Even the term
‘wall control blasting’ has many aliases, for
example, limits blasting, controlled blasting,
contour blasting, perimeter blasting and smooth-
wall blasting. To ensure that readers are clear, the
wall control blasting terms used in this paper are
defined in Table 2. In short: a buffer blast uses
stand-off to avoid damage and the wall is formed
by the excavating equipment; a pre-split blast
defines the profile and the thin damage zone
attenuates vibrations; a trim blast attempts to
balance the charge diameter and stand-off
distance; and a post- split blast uses a single row
of closely spaced holes along the final wall and
shots to a free face. Line drilling is an alternative
to pre-splitting and is not classified as a blasting
technique.
4 WALL CONTROL BLAST DESIGN AND
ANALYSIS
In this section the design features of five wall
control applications are discussed. They are:
pre-split design; single blasthole (or row) design;
timing design; modified production blast design;
and slope steepening design. In this paper the
terms overbreak (crest loss, face loss etc) and
underbreak (floor toe, bench toe or cling-on) are
used for post blast geometric features that can be
measured using surveying techniques and these
provide feedback profile and damage control
performance.
4.1 Pre-split design and analysis
Despite what some engineers may think the design
of a pre-split blast is not a simple matter. The first
decision is to decide if pre-split blasting is
worthwhile at a particular mine site. Some key
questions are:
− what are the objectives to be targeted? In a
hard rock environment it may be to achieve
the design profile, achieve acceptable damage
levels and / or provide a platform for slope
steepening. In a throw blasting coal
environment it may be to reduce the
likelihood of rockfall / slope failure hazard
for mining underneath the face, provide a
face that leads to faster dragline recovery
during off-line key digging or chap cutting,
enable a consistent front row burden in the
next bench for engineering control

- 347 -
Table 3. Pre-split design approaches
Design
approach
Pre-split design comments
Experience Can use experience from
similar site as a design
starting position.
Blast trials Trial and error can be used
to refine the pre-split design.
Blasting trials needed to
confirm design developed
by all other design
approaches
Empirical
methods
Rule of thumb, for example
spacing equals 8-13 hole
diameters.
Empirical equations two
dimensional static theory
only valid for static loads.
Blast
models
MC waveform superposition
- See Fig 7 for an example
output.
ELFEN/ MBM/ SoH
modelling – See Fig 8 for an
example output.
HSBM / SMB modelling –
See Fig 9 for an example
output.
Figure 6. Monte Carlo waveform superposition
modelling used to determine vibration radiation
patterns (source: Blair & Little 2019).
Figure 7. Damage patterns along pre-split blasthole from MBM model (A) 2 m collar, (B)
4 m collar (source: Battison et al. 2015).
(Lewandowski et al. 1996).
− what are the benefits expected? Improved
safety by lowering the probability of rockfall,
improved stability by reducing rock mass
damage. Blair (2015b) showed that the
vibration reduction due to pre-split formation
was statistically meaningful and a reduction
of 40 per cent was estimated.
− what is the feasibility of a pre-split being
effective? If a pre-split is considered to be a
thin damage zone then it should be possible
to create such a zone in most rock masses.
− do the benefits outweigh the additional costs?
Once a decision to employ a pre-split row has
been made a number of design elements need to be
determined. They are:
− hole diameter and spacing
− blasthole inclination and length
− timing design and firing direction
− how are tight corners to be handled?
− explosive type, configuration and coupling
Table 3 discusses pre-split design approaches.
Figure 6 illustrates the results obtained for a
100-hole pre-split line (2 m spacing) predicted
from a waveform superposition model. Initiation
point at northern-most hole. Note, VPPV is on a
log scale. The pre-split on the left was fired with
detonating cord and on the right groups of 5 holes
with 17 ms delays were modelled.
A HSBM model was set up to reproduce
the pre-split blast design. Illustrated in
Figure 8 are the results when the hole
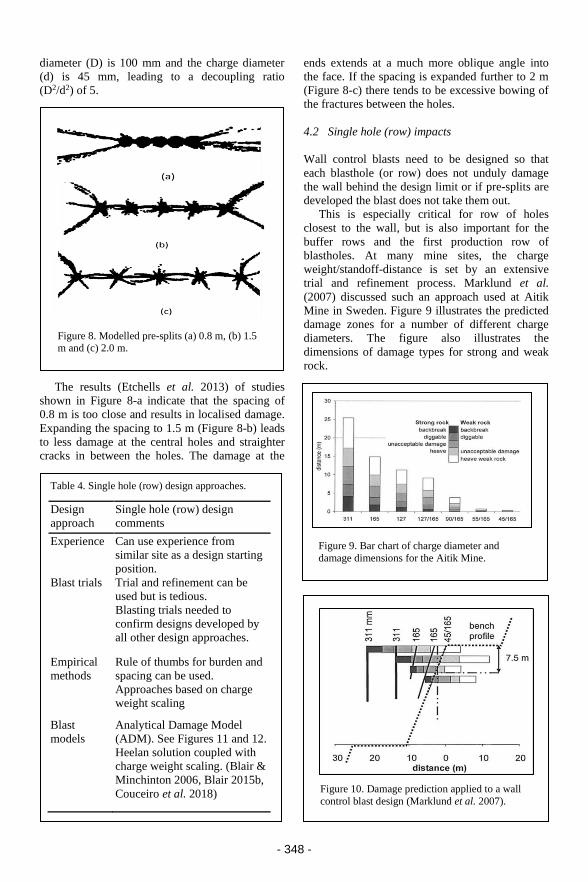
- 348 -
Figure 8. Modelled pre-splits (a) 0.8 m, (b) 1.5 m and (c) 2.0 m.
Table 4. Single hole (row) design approaches.
Design
approach
Single hole (row) design
comments
Experience Can use experience from
similar site as a design starting
position.
Blast trials Trial and refinement can be
used but is tedious.
Blasting trials needed to
confirm designs developed by
all other design approaches.
Empirical
methods
Rule of thumbs for burden and
spacing can be used.
Approaches based on charge
weight scaling
Blast
models
Analytical Damage Model
(ADM). See Figures 11 and 12.
Heelan solution coupled with
charge weight scaling. (Blair &
Minchinton 2006, Blair 2015b,
Couceiro et al. 2018)
Figure 9. Bar chart of charge diameter and
damage dimensions for the Aitik Mine.
Figure 10. Damage prediction applied to a wall
control blast design (Marklund et al. 2007).
diameter (D) is 100 mm and the charge diameter
(d) is 45 mm, leading to a decoupling ratio
(D2/d2) of 5.
The results (Etchells et al. 2013) of studies
shown in Figure 8-a indicate that the spacing of
0.8 m is too close and results in localised damage.
Expanding the spacing to 1.5 m (Figure 8-b) leads
to less damage at the central holes and straighter
cracks in between the holes. The damage at the
ends extends at a much more oblique angle into
the face. If the spacing is expanded further to 2 m
(Figure 8-c) there tends to be excessive bowing of
the fractures between the holes.
4.2 Single hole (row) impacts
Wall control blasts need to be designed so that
each blasthole (or row) does not unduly damage
the wall behind the design limit or if pre-splits are
developed the blast does not take them out.
This is especially critical for row of holes
closest to the wall, but is also important for the
buffer rows and the first production row of
blastholes. At many mine sites, the charge
weight/standoff-distance is set by an extensive
trial and refinement process. Marklund et al.
(2007) discussed such an approach used at Aitik
Mine in Sweden. Figure 9 illustrates the predicted
damage zones for a number of different charge
diameters. The figure also illustrates the
dimensions of damage types for strong and weak
rock.

- 349 -
Table 5. Timing design approaches.
Design
approach
Timing design comments
Experience Can use experience from
similar site as a design starting
position.
Blast trials Trial and refinement can be
used for timing but is tedious.
Blasting trials needed to
confirm designs developed by
all other design approaches.
Empirical
methods
Rule of thumbs for timing
generally focus on
fragmentation and muckpiles,
so are of limited use for wall
control blasting.
Blast
models
MC waveform superposition -
See Fig 15 for an example
output at a single monitoring
point.
An alternative dynamic stress approach was
developed and reported by Blair 2015a. That work
describes the development of an Analytical
Damage Model (ADM) based on an exact solution
under the assumption of viscoelastic material. The
model takes full account of: the rock mass
elastic/viscoelastic properties, the explosive type,
the geometry, and primer location. The output is a
prediction of dynamic stress for direct comparison
with the unconfined compressive strength of the
local rock mass. Figure 11 illustrates a detailed
dynamic stress radiation from a single blasthole.
According to the ADM, for a sufficient length
of charge column in a given surrounding rock
mass, the only way to alter the damage standoff
distance is to: alter the diameter of the charge
column; alter the explosive type; or use a pre-split
or any combination of these design elements.
The ADM modelling can be used to determine:
− toe and collar standoffs for batter, buffer and
production blasthole (rows)
− standoff distance charts for blast design
− burden and spacing distances
− investigate air decking effects
− appropriate primer location(s) to direct
dynamic stress radiation patterns
− angled blasthole radiation patterns.
4.3 Timing design
When the charge weight/distance configuration
has been determined for each blasthole (row) using
the ADM, the next step is to determine the
behaviour of a delayed sequence of such
Figure 11. Dynamic stress radiation from a
single blasthole (source: Blair & Little 2019).
Figure 12. Radiation of peak dynamic stress from
a batter blasthole with pre-split in place.
This predicts reduced damage at the wall line and beyond.
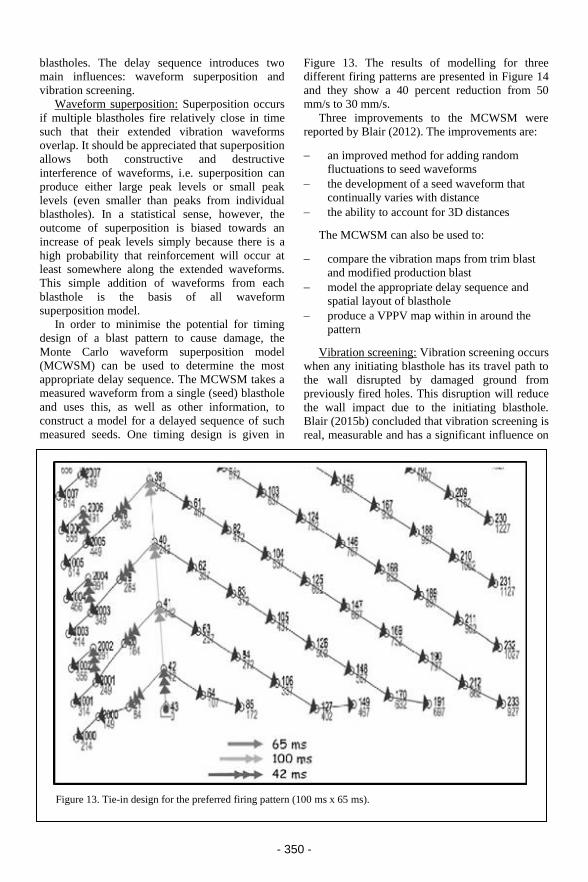
- 350 -
blastholes. The delay sequence introduces two
main influences: waveform superposition and
vibration screening.
Waveform superposition: Superposition occurs
if multiple blastholes fire relatively close in time
such that their extended vibration waveforms
overlap. It should be appreciated that superposition
allows both constructive and destructive
interference of waveforms, i.e. superposition can
produce either large peak levels or small peak
levels (even smaller than peaks from individual
blastholes). In a statistical sense, however, the
outcome of superposition is biased towards an
increase of peak levels simply because there is a
high probability that reinforcement will occur at
least somewhere along the extended waveforms.
This simple addition of waveforms from each
blasthole is the basis of all waveform
superposition model.
In order to minimise the potential for timing
design of a blast pattern to cause damage, the
Monte Carlo waveform superposition model
(MCWSM) can be used to determine the most
appropriate delay sequence. The MCWSM takes a
measured waveform from a single (seed) blasthole
and uses this, as well as other information, to
construct a model for a delayed sequence of such
measured seeds. One timing design is given in
Figure 13. The results of modelling for three
different firing patterns are presented in Figure 14
and they show a 40 percent reduction from 50
mm/s to 30 mm/s.
Three improvements to the MCWSM were
reported by Blair (2012). The improvements are:
− an improved method for adding random
fluctuations to seed waveforms
− the development of a seed waveform that
continually varies with distance
− the ability to account for 3D distances
The MCWSM can also be used to:
− compare the vibration maps from trim blast
and modified production blast
− model the appropriate delay sequence and
spatial layout of blasthole
− produce a VPPV map within in around the
pattern
Vibration screening: Vibration screening occurs
when any initiating blasthole has its travel path to
the wall disrupted by damaged ground from
previously fired holes. This disruption will reduce
the wall impact due to the initiating blasthole.
Blair (2015b) concluded that vibration screening is
real, measurable and has a significant influence on
Figure 13. Tie-in design for the preferred firing pattern (100 ms x 65 ms).

- 351 -
blast vibration. It is thus worthwhile considering
this phenomenon as a tool to reduce vibration
impact to a pit wall. To that end reverse firing is
discussed in the Section 5.2.
5 WALL CONTROL BLAST APPLICATION
5.1 Wall control blast applications
The author has identified four main application
areas for wall control blasting. From a risk
continuum perspective (Blair & Little 2019) the
first application is ‘hazard reduction’ and can be
termed ‘elimination of blast induced wall failure’.
This will necessarily involve obtaining a good
understanding of the geometry, geology and major
structures to identify vulnerable locations. Also
critical is an investment in slope monitoring
equipment and an analysis capability to provide
feedback to blasting operations.
The second application involves ‘variation
management’ and can be termed ‘wall design
Figure 14. Model predictions for averaged vector velocity waveforms at particular monitoring location.
Figure 15. Wall control blasting evaluation chart.
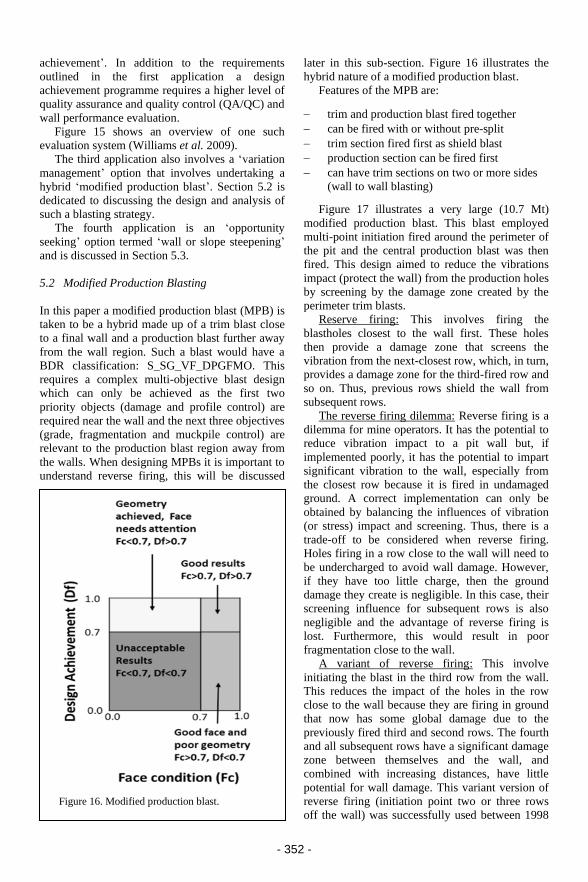
- 352 -
achievement’. In addition to the requirements
outlined in the first application a design
achievement programme requires a higher level of
quality assurance and quality control (QA/QC) and
wall performance evaluation.
Figure 15 shows an overview of one such
evaluation system (Williams et al. 2009).
The third application also involves a ‘variation
management’ option that involves undertaking a
hybrid ‘modified production blast’. Section 5.2 is
dedicated to discussing the design and analysis of
such a blasting strategy.
The fourth application is an ‘opportunity
seeking’ option termed ‘wall or slope steepening’
and is discussed in Section 5.3.
5.2 Modified Production Blasting
In this paper a modified production blast (MPB) is
taken to be a hybrid made up of a trim blast close
to a final wall and a production blast further away
from the wall region. Such a blast would have a
BDR classification: S_SG_VF_DPGFMO. This
requires a complex multi-objective blast design
which can only be achieved as the first two
priority objects (damage and profile control) are
required near the wall and the next three objectives
(grade, fragmentation and muckpile control) are
relevant to the production blast region away from
the walls. When designing MPBs it is important to
understand reverse firing, this will be discussed
later in this sub-section. Figure 16 illustrates the
hybrid nature of a modified production blast.
Features of the MPB are:
− trim and production blast fired together
− can be fired with or without pre-split
− trim section fired first as shield blast
− production section can be fired first
− can have trim sections on two or more sides
(wall to wall blasting)
Figure 17 illustrates a very large (10.7 Mt)
modified production blast. This blast employed
multi-point initiation fired around the perimeter of
the pit and the central production blast was then
fired. This design aimed to reduce the vibrations
impact (protect the wall) from the production holes
by screening by the damage zone created by the
perimeter trim blasts.
Reserve firing: This involves firing the
blastholes closest to the wall first. These holes
then provide a damage zone that screens the
vibration from the next-closest row, which, in turn,
provides a damage zone for the third-fired row and
so on. Thus, previous rows shield the wall from
subsequent rows.
The reverse firing dilemma: Reverse firing is a
dilemma for mine operators. It has the potential to
reduce vibration impact to a pit wall but, if
implemented poorly, it has the potential to impart
significant vibration to the wall, especially from
the closest row because it is fired in undamaged
ground. A correct implementation can only be
obtained by balancing the influences of vibration
(or stress) impact and screening. Thus, there is a
trade-off to be considered when reverse firing.
Holes firing in a row close to the wall will need to
be undercharged to avoid wall damage. However,
if they have too little charge, then the ground
damage they create is negligible. In this case, their
screening influence for subsequent rows is also
negligible and the advantage of reverse firing is
lost. Furthermore, this would result in poor
fragmentation close to the wall.
A variant of reverse firing: This involve
initiating the blast in the third row from the wall.
This reduces the impact of the holes in the row
close to the wall because they are firing in ground
that now has some global damage due to the
previously fired third and second rows. The fourth
and all subsequent rows have a significant damage
zone between themselves and the wall, and
combined with increasing distances, have little
potential for wall damage. This variant version of
reverse firing (initiation point two or three rows
off the wall) was successfully used between 1998
Figure 16. Modified production blast.

- 353 -
and 2010 at a large open pit mine in Western
Australia.
Some purported benefits of an MPB are:
− increase in pattern size possible (up to 5
times)
− reduce number of blasting days (up to a half)
− decrease movements of digging units
− decreased reliance on auxiliary machines for
pattern preparations
− increase in drilling and charging productivity
due to less moving of machines and work
areas
− truck / shovel productivity increased
Some checks that need to be made for MPB:
− check that the trim section is carefully
designed and monitored to ensure no
additional adverse impact on the walls
compared with a dedicated trim blast
− check that the production section is carefully
designed and monitored to ensure no adverse
impacts on value-based ore control
5.3 Slope steepening – design and analysis
Slope steepening as an application of wall control
blasting is an opportunity available to some
mining operations. The most common method of
slope steepening and is mainly done by stacking
two or three benches together and reducing the
overall berm width and increasing the inter-ramp
angles. Such an approach requires a strategic
decision to be made and this decision would be
based on an evaluation that steeper slopes will
result in significant economic benefit, and that the
organisation has the capacity to achieve a steeper
slope in a safe manner. Figure 18 illustrates the pit
and bench stack terminology useful when
describing a slope steepening programme.
Prior to embarking on a slope steepening
programme the technical teams involved should be
able to demonstrate that they have achieved the
existing design consistently over an extended
period of time. Also, that the teams have built up
reliable geological and structural databases, have
developed robust standards of QA/QC and have
invested in slope monitoring and damage
assessment technology.
Three examples are given in this sub-section.
The first example illustrates that each bench in a
double or triple bench stack can have different
operational targets. The second example illustrates
that wall control blasting involves an ongoing
extensive programme of trials and refinements
over a long period of time and can be described as
a journey. Lessons learnt over that journey are also
presented. The third example was chosen to
illustrate the significant benefits that a wall
steepening programme can deliver.
5.3.1 First example linking blasting objective and
operational targets
The first case example is from Mexico and based
on the work of Cebrian et al. (2018). This recently
published study was selected to illustrate that the
design of a wall control should be directly linked
to the blasting objective and operational targets,
Figure 19 clearly indicate this concept.
Figure 17. Shot W22A 203 fired on 20/02/2017 (from https://www.miningreview.com.au).
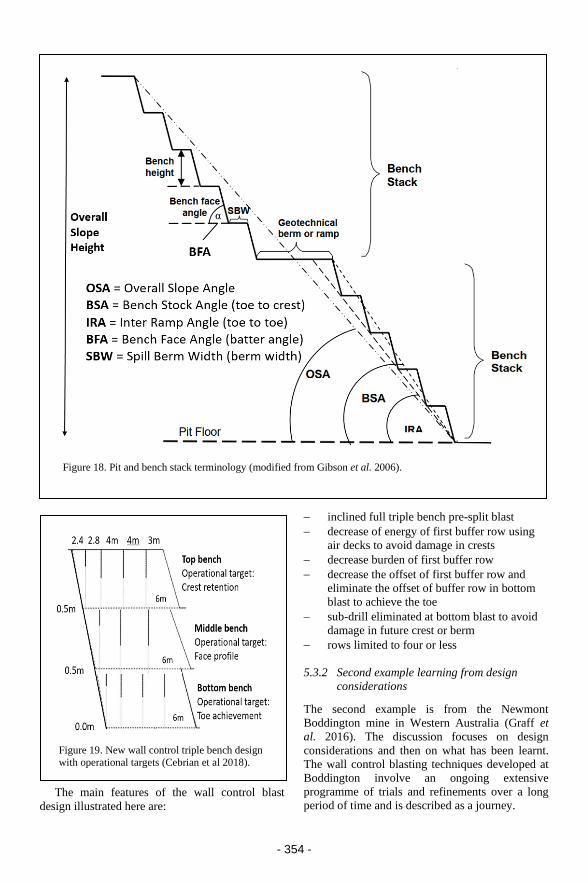
- 354 -
The main features of the wall control blast
design illustrated here are:
− inclined full triple bench pre-split blast
− decrease of energy of first buffer row using
air decks to avoid damage in crests
− decrease burden of first buffer row
− decrease the offset of first buffer row and
eliminate the offset of buffer row in bottom
blast to achieve the toe
− sub-drill eliminated at bottom blast to avoid
damage in future crest or berm
− rows limited to four or less
5.3.2 Second example learning from design
considerations
The second example is from the Newmont
Boddington mine in Western Australia (Graff et
al. 2016). The discussion focuses on design
considerations and then on what has been learnt.
The wall control blasting techniques developed at
Boddington involve an ongoing extensive
programme of trials and refinements over a long
period of time and is described as a journey.
Figure 18. Pit and bench stack terminology (modified from Gibson et al. 2006).
Figure 19. New wall control triple bench design
with operational targets (Cebrian et al 2018).
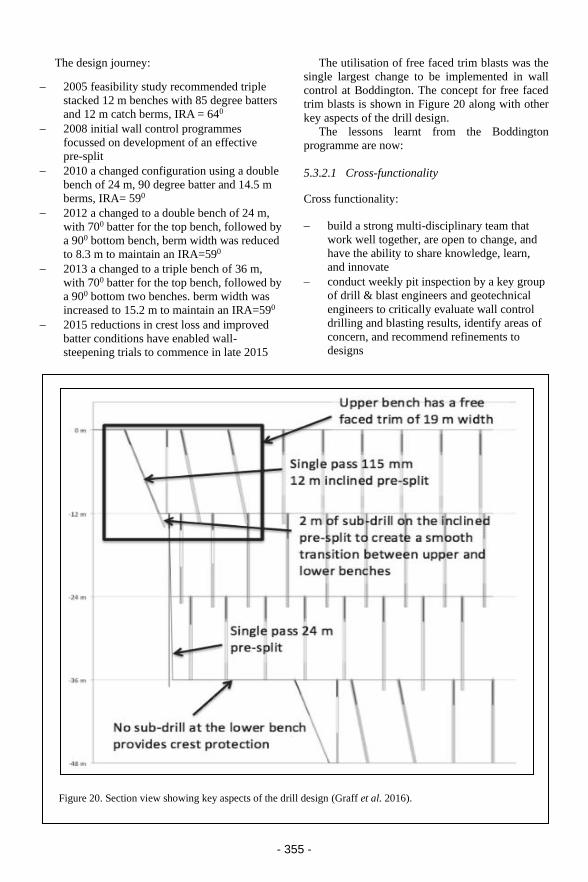
- 355 -
The design journey:
− 2005 feasibility study recommended triple
stacked 12 m benches with 85 degree batters
and 12 m catch berms, IRA = 640
− 2008 initial wall control programmes
focussed on development of an effective
pre-split
− 2010 a changed configuration using a double
bench of 24 m, 90 degree batter and 14.5 m
berms, IRA= 590
− 2012 a changed to a double bench of 24 m,
with 700 batter for the top bench, followed by
a 900 bottom bench, berm width was reduced
to 8.3 m to maintain an IRA=590
− 2013 a changed to a triple bench of 36 m,
with 700 batter for the top bench, followed by
a 900 bottom two benches. berm width was
increased to 15.2 m to maintain an IRA=590
− 2015 reductions in crest loss and improved
batter conditions have enabled wall-
steepening trials to commence in late 2015
The utilisation of free faced trim blasts was the
single largest change to be implemented in wall
control at Boddington. The concept for free faced
trim blasts is shown in Figure 20 along with other
key aspects of the drill design.
The lessons learnt from the Boddington
programme are now:
5.3.2.1 Cross-functionality
Cross functionality:
− build a strong multi-disciplinary team that
work well together, are open to change, and
have the ability to share knowledge, learn,
and innovate
− conduct weekly pit inspection by a key group
of drill & blast engineers and geotechnical
engineers to critically evaluate wall control
drilling and blasting results, identify areas of
concern, and recommend refinements to
designs
Figure 20. Section view showing key aspects of the drill design (Graff et al. 2016).

- 356 -
5.3.2.2 Overarching strategy
Overarching strategy:
− a strategy and procedure driven approach to
wall control refinement (development,
implementation, monitoring, evaluation, and
refinement) is required, and all changes
documented
− sound walls in difficult ground conditions
requires a carefully chosen set of parameters
all working well together
− implicit in the strategy is the commitment to
continuous improvement, and ongoing
internal and external peer review of the
operating considerations, this process may
take a number of years to complete
5.3.2.3 Embracing change
Embracing change:
− Efforts to move away from this accepted
method, equipment, and parameters took
time, involved careful stakeholder
engagement and a commitment to innovate.
− Design is an iterative process. As part of this
process it is important not to over-complicate,
be able to acknowledge when something is
not working, have review and stop points, and
Figure 21. Generic sloped steepening application showing potential benefits (after Williams et al. 2009).
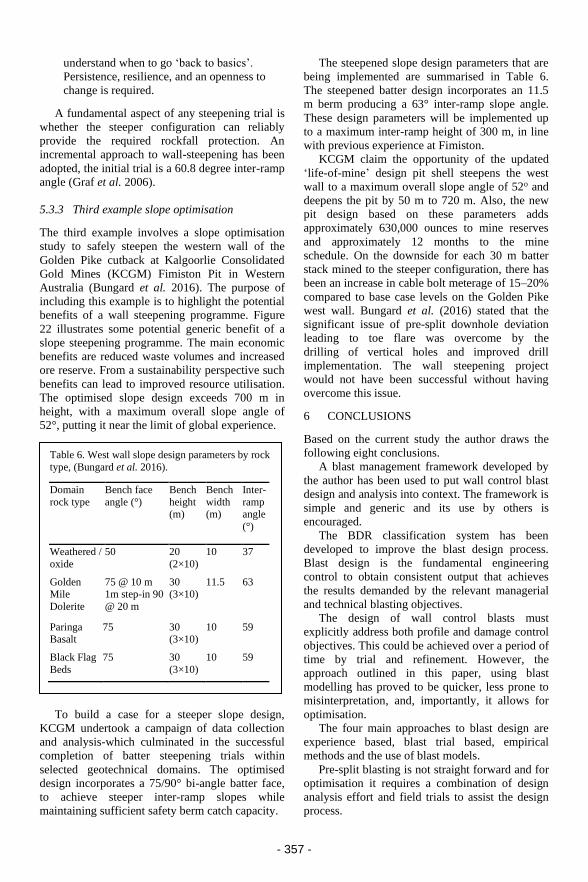
- 357 -
Table 6. West wall slope design parameters by rock
type, (Bungard et al. 2016).
Domain
rock type
Bench face
angle (°)
Bench
height (m)
Bench
width (m)
Inter-
ramp angle
(°)
Weathered /
oxide
50 20
(2×10)
10 37
Golden Mile
Dolerite
75 @ 10 m 1m step-in 90
@ 20 m
30 (3×10)
11.5 63
Paringa Basalt
75 30 (3×10)
10 59
Black Flag
Beds
75 30
(3×10)
10 59
understand when to go ‘back to basics’.
Persistence, resilience, and an openness to
change is required.
A fundamental aspect of any steepening trial is
whether the steeper configuration can reliably
provide the required rockfall protection. An
incremental approach to wall-steepening has been
adopted, the initial trial is a 60.8 degree inter-ramp
angle (Graf et al. 2006).
5.3.3 Third example slope optimisation
The third example involves a slope optimisation
study to safely steepen the western wall of the
Golden Pike cutback at Kalgoorlie Consolidated
Gold Mines (KCGM) Fimiston Pit in Western
Australia (Bungard et al. 2016). The purpose of
including this example is to highlight the potential
benefits of a wall steepening programme. Figure
22 illustrates some potential generic benefit of a
slope steepening programme. The main economic
benefits are reduced waste volumes and increased
ore reserve. From a sustainability perspective such
benefits can lead to improved resource utilisation.
The optimised slope design exceeds 700 m in
height, with a maximum overall slope angle of
52°, putting it near the limit of global experience.
To build a case for a steeper slope design,
KCGM undertook a campaign of data collection
and analysis-which culminated in the successful
completion of batter steepening trials within
selected geotechnical domains. The optimised
design incorporates a 75/90° bi-angle batter face,
to achieve steeper inter-ramp slopes while
maintaining sufficient safety berm catch capacity.
The steepened slope design parameters that are
being implemented are summarised in Table 6.
The steepened batter design incorporates an 11.5
m berm producing a 63° inter-ramp slope angle.
These design parameters will be implemented up
to a maximum inter-ramp height of 300 m, in line
with previous experience at Fimiston.
KCGM claim the opportunity of the updated
‘life-of-mine’ design pit shell steepens the west
wall to a maximum overall slope angle of 52o and
deepens the pit by 50 m to 720 m. Also, the new
pit design based on these parameters adds
approximately 630,000 ounces to mine reserves
and approximately 12 months to the mine
schedule. On the downside for each 30 m batter
stack mined to the steeper configuration, there has
been an increase in cable bolt meterage of 15–20%
compared to base case levels on the Golden Pike
west wall. Bungard et al. (2016) stated that the
significant issue of pre-split downhole deviation
leading to toe flare was overcome by the
drilling of vertical holes and improved drill
implementation. The wall steepening project
would not have been successful without having
overcome this issue.
6 CONCLUSIONS
Based on the current study the author draws the
following eight conclusions.
A blast management framework developed by
the author has been used to put wall control blast
design and analysis into context. The framework is
simple and generic and its use by others is
encouraged.
The BDR classification system has been
developed to improve the blast design process.
Blast design is the fundamental engineering
control to obtain consistent output that achieves
the results demanded by the relevant managerial
and technical blasting objectives.
The design of wall control blasts must
explicitly address both profile and damage control
objectives. This could be achieved over a period of
time by trial and refinement. However, the
approach outlined in this paper, using blast
modelling has proved to be quicker, less prone to
misinterpretation, and, importantly, it allows for
optimisation.
The four main approaches to blast design are
experience based, blast trial based, empirical
methods and the use of blast models.
Pre-split blasting is not straight forward and for
optimisation it requires a combination of design
analysis effort and field trials to assist the design
process.

- 358 -
Timing design can be used to reduce vibration
levels by preventing waveform crowding. The
delay sequence introduces two main influences:
waveform superposition and vibration screening.
Reverse firing (shield blasting) can be used when
the charge weight/distance configuration has been
determined for each blasthole (row).
Modified production blasts are hybrid blasts
consisting of a trim blast pattern close to the wall,
coupled with a production blast pattern away from
wall areas. From a design perspective they have
more complex blasting objectives, but can rely on
the spatial separation involved.
Embarking on a slope steepening programme
requires a strategic decision to be made. If the
critical success factors are in place such an
undertaking can be rewarding for the people
involved and value enhancing for the mining
company. Such a design journey may require a
number of years.
REFERENCES
Battison, R., Esen, S., Duggan, R., Henley, K. &
Dare-Bryan, P. 2015. Reducing crest loss at
Barrick Cowal Gold Mine. Proceeding of 11th
Int. Symp. on Rock Fragmentation by Blasting.
24-26 August 2015, Sydney, Australia.
Blair, D. and Minchinton, A. 2006. Near field blast
vibration models. Proc. 8th Int. Symp. on Rock
Fragmentation by Blasting, Fragblast 8,
Santiago, Chile, pp. 152-159.
Blair, D.P. 2015a. The free surface influence on blast
vibration. Int J of Rock Mechanics and Mining
Sciences, Vol 2 (77), pp. 182 - 191.
Blair, D.P. 2015b. Wall control blasting. Keynote
address in proceeding of 11th Int Symp on Rock
Fragmentation by Blasting. 24-26 August 2015,
Sydney, Australia.
Blair, D.P. 2018. Vibration modelling and
mechanisms for wall control blasting. Proceeding
of 12th Int Symp on Rock Fragmentation by
Blasting. Luleå Sweden 11-13 June 2018.
Blair, D.P. & Little, T.N. 2019. Advanced wall
control blasting short course. Version 8 April.
Published by Blast Geomechanics Pty Ltd.
Bungard, G.P., Gleeson, A. & Basson, F.R.P. 2016.
Slope steepening of the Golden Pike west wall at
Fimiston Pit. The First Asia Pacific Slope
Stability in Mining (APSSIM) Conference, held in
Brisbane, Australia, 6-8 September 2016.
Cebrian, B., Rocha, M., Morales, B., Castanon, J.L.
& Floyd, J. 2018. Full wall control blasting
optimisation. J Explosives Engineering Volume
35 Number 4. ISEE publication.
Etchells, S.J., Sellers, E.J. & Furtney J. 2013.
Understanding the blast damage mechanisms in
slopes using observations and numerical
modelling. Proceedings of the 2013 Int Symp on
Rock Slope Stability in Open Pit Mining and Civil
Engineering (Editor: Phil Dight ACG). 25-27
September, Brisbane, Australia.
Gibson, W.H., de Bruyn, I.A. & Walker, D.J.H. 2006.
Considerations in the optimisation of bench face
angle and berm width geometries for open pit
mines. Proc. South African Institute of Mining
and Metallurgy (SAIMM) Int Symp on Stability
of Rock Slopes in Open Pit Mining and Civil
Eng, 557-578.
Graf, C.C. & Sullivan, R. 2016. A journey of wall
control improvement at Boddington Gold. The
First Asia Pacific Slope Stability in Mining
(APSSIM) Conference. Held in Brisbane,
Australia, 6-8 September 2016.
Juldyz, A. 2019. Use of the excavation compliance
indicator at the Oyu Tolgoi copper–gold mine,
Mongolia. Proceeding of Mining Geomechanical
Risk conference. J Wesseloo (ed.) Australian
Centre for Geomechanics, Perth, pp 337-350.
Lewandowski, T., Luan Mai, V.K. & Danell, R.E.
1996. Influence of discontinuities on pre-splitting
effectiveness. Proceedings of 5th Int. Symp. on
Rock Fragmentation by Blasting. 25-29 August
1996, Montreal, Quebec, Canada.
Little, T.N. 2015. Classification and development in
grade current blasting for surface mines.
Proceedings of 11th Int Symp on Rock
Fragmentation by Blasting. 24-26 August 2015,
Sydney, Australia.
Little, T.N. 2017. Blast design requirements
classification system for blast purposes.
Proceedings of EFEE 9th World Conference on
Explosive and Blasting, Stockholm, Sweden.
Lu, W., Yan, P., Hu, Y., Zhang, Y., Chen, M. & Gao,
Q. 2018. A review of dam foundation excavation
techniques in China. Proceeding of 12th Int.
Symp. on Rock Fragmentation by Blasting. Luleå
Sweden 11-13 June 2018.
Marklund, P-I., Sjoberg, J., Ouchterlony, F. &
Nilsson, N. 2007. Improved blasting and bench
slope design at the Aitik Mine. Proceedings of
the 2007 Int Symp on Rock Slope Stability in

- 359 -
Open Pit Mining and Civil Engineering. 12-14
September, Perth, Australia.
Seery, J. & Lapwood, J. 2007. Use of an excavation
compliance indicator to assess conformance to
slope design. In Y Potvin (ed.), Proceedings of
the 2007 Int Sym on Rock Slope Stability in Open
Pit Mining and Civil Engineering, Australian
Centre for Geomechanics, Perth, pp. 431–437.
Williams, P., Floyd, J., Chitombo, G. & Maton, T.
2009. Design implementation. In J Read & P
Stacey (eds), Guidelines for Open Pit Slope
Design, CSIRO Publishing, Collingwood, pp
265–326.

- 360 -