5. anaerobic digestion - compost.org and... · chapter 5 anaerobic digestion solid waste management...
TRANSCRIPT
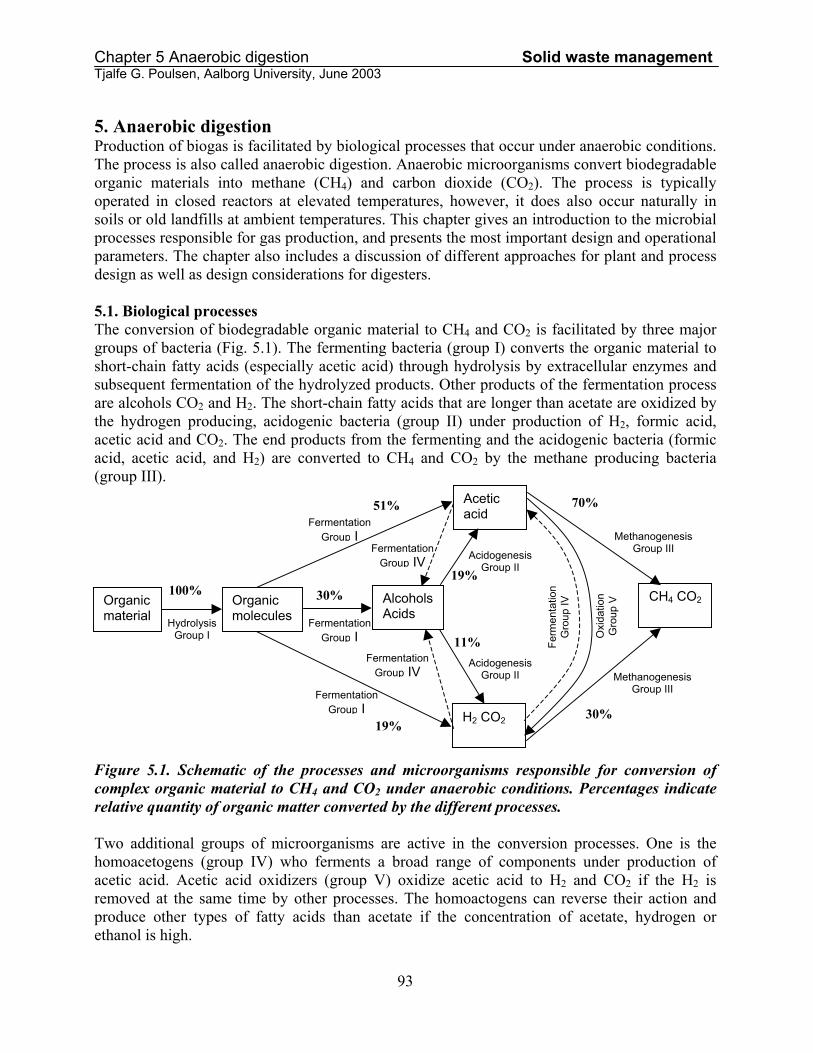
Chapter 5 Anaerobic digestion Solid waste management Tjalfe G. Poulsen, Aalborg University, June 2003 5. Anaerobic digestion Production of biogas is facilitated by biological processes that occur under anaerobic conditions. The process is also called anaerobic digestion. Anaerobic microorganisms convert biodegradable organic materials into methane (CH4) and carbon dioxide (CO2). The process is typically operated in closed reactors at elevated temperatures, however, it does also occur naturally in soils or old landfills at ambient temperatures. This chapter gives an introduction to the microbial processes responsible for gas production, and presents the most important design and operational parameters. The chapter also includes a discussion of different approaches for plant and process design as well as design considerations for digesters. 5.1. Biological processes The conversion of biodegradable organic material to CH4 and CO2 is facilitated by three major groups of bacteria (Fig. 5.1). The fermenting bacteria (group I) converts the organic material to short-chain fatty acids (especially acetic acid) through hydrolysis by extracellular enzymes and subsequent fermentation of the hydrolyzed products. Other products of the fermentation process are alcohols CO2 and H2. The short-chain fatty acids that are longer than acetate are oxidized by the hydrogen producing, acidogenic bacteria (group II) under production of H2, formic acid, acetic acid and CO2. The end products from the fermenting and the acidogenic bacteria (formic acid, acetic acid, and H2) are converted to CH4 and CO2 by the methane producing bacteria (group III).
100%
11%
51%
30%
70%
30%
FermentationGroup IV
FermentationGroup IV
Oxi
datio
n G
roup
V
FermentationGroup I
19%
AcidogenesisGroup II 19%
Ferm
enta
tion
Gro
up IV
FermentationGroup I Methanogenesis
Group III
Hydrolysis Group I
FermentationGroup I
AcidogenesisGroup II Methanogenesis
Group III
CH4 CO2Organic molecules
AlcoholsAcids
Acetic acid
H2 CO2
Organic material
Figure 5.1. Schematic of the processes and microorganisms responsible for conversion of complex organic material to CH4 and CO2 under anaerobic conditions. Percentages indicate relative quantity of organic matter converted by the different processes. Two additional groups of microorganisms are active in the conversion processes. One is the homoacetogens (group IV) who ferments a broad range of components under production of acetic acid. Acetic acid oxidizers (group V) oxidize acetic acid to H2 and CO2 if the H2 is removed at the same time by other processes. The homoactogens can reverse their action and produce other types of fatty acids than acetate if the concentration of acetate, hydrogen or ethanol is high.
93

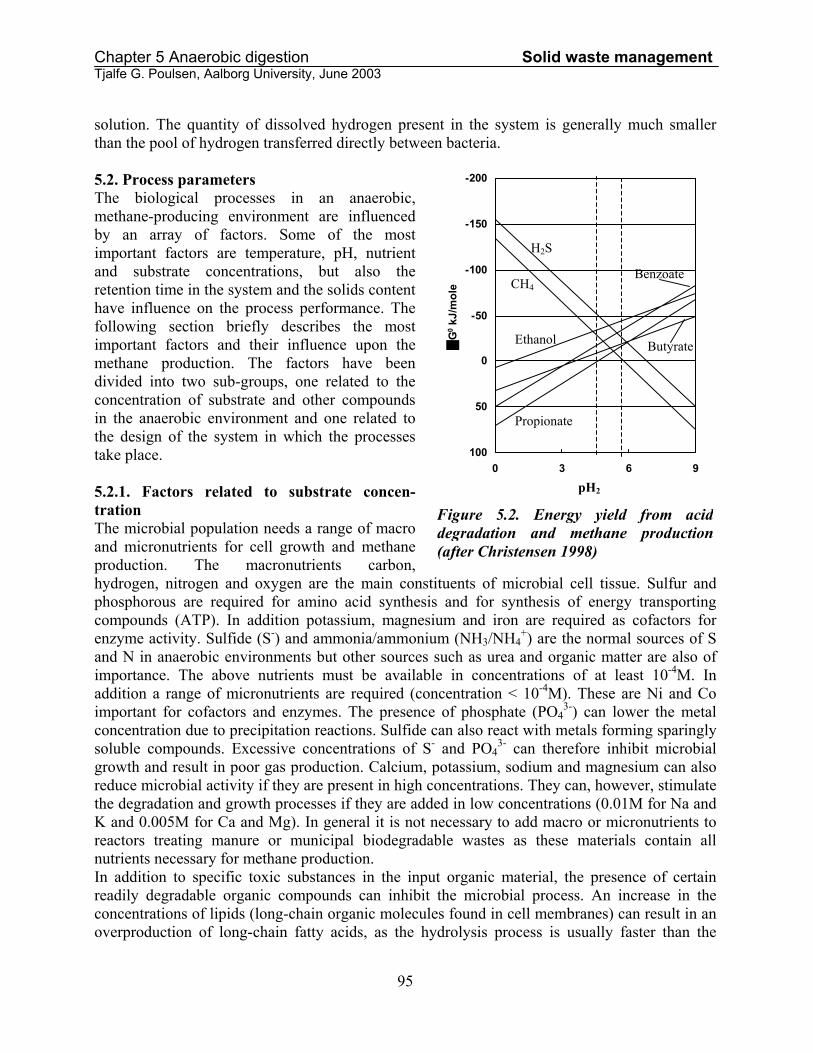
Chapter 5 Anaerobic digestion Solid waste management Tjalfe G. Poulsen, Aalborg University, June 2003 The hydrolysis step (group I) converts the organic material into components that are useful for the bacteria. Therefore hydrolysis can become potentially limiting. This is the case if the organic material contains high amounts of cellulose that are hydrolyzed slowly. Most of the hydrolyzed organic material is converted to acetic acid and subsequently to methane and carbon dioxide (Figure 5.1), the concentration of acetic acid therefore plays an important role in anaerobic conversion of organic matter. Under normal conditions most of the hydrolyzed matter will be converted by group I organisms into materials that are directly usable for methane production (CO2, H2, acetic and formic acid). If the process is out of balance and the hydrogen is not consumed fast enough the quantity of alcohols and other types of fatty acids produced will increase. Oxidation of fatty acids and alcohols into hydrogen, carbon dioxide and acetic acid by group II only yields very limited amounts of energy (Table 5.1) it is therefore important that the partial pressure of hydrogen and the concentration of hydrogen ions is low (Christensen 1998), this will help drive the process with a net energy output. Table 5.1. Energy yield from anaerobic reactions at standard state involved in the conversion of organic matter into methane and carbon dioxide. Data from Dolfing (1988) and Vogels et al. (1988). Note: Negative values of ∆Go indicating that energy is produced from the reaction whereas positive values means that energy is consumed. Reaction ∆Go (kJ/mole) CH3CH2OH + H2O → CH3COO- + H+ + 2H2 +9.6 CH3CH2COO- + 3H2O → CH3COO- + H+ + 3H2 + HCO3- +76.1 CH3CH2CH2COO- + 2H2O → 2CH3COO- + H+ + 2H2 +48.1 C7H5O2 + 7H2O → 3CH3COO- + 3H+ + 3H2 + HCO3- +53 4H2 + CO2 → CH4 + 2H2O -130.4 4HCOO- + 4H+ → CH4 + 3CO2 + 2H2O -119.5 4CO + 2H2O → CH4 + 3CO2 -185.5 4CH3OH → 3CH4 + CO2 + 2H2O -103 4CH3NH3
+ + 2H2O → 3CH4 + CO2 + 4NH4+ -74
2(CH3)2NH2+ + 2H2O → 3CH4 + CO2 + 2NH4
+ -74 4(CH3)2NH2
+ + 6H2O → 9CH4 + 3CO2 + 4NH4+ -74
CH3COO- + H+ → CH4 + CO2 -32.5 The methanogens (group III) gain much more energy from their metabolism (Table 5.1) converting acetic acid, H2 and CO2 into CH4. These bacteria gain most energy at high hydrogen concentrations. For the two groups of bacteria to function together it is therefore necessary that the concentration of dissolved hydrogen be within a very narrow interval as illustrated in Fig. 5.2. The reason it is possible to maintain such specific dissolved hydrogen concentration is that most of the hydrogen converted under well functioning anaerobic conditions never comes into solution. Instead hydrogen is transferred directly from the hydrogen producing bacteria to the hydrogen consuming bacteria by a mechanism called inter species hydrogen transfer. In methane producing ecosystems the bacteria are active in flocs or consortia consisting of the different types of bacteria presented above. Within the flocs the bacteria are in close contact. This means that hydrogen can be transferred directly between different species without ever coming into
94
Chapter 5 Anaerobic digestion Solid waste management Tjalfe G. Poulsen, Aalborg University, June 2003 solution. The quantity of dissolved hydrogen present in the system is generally much smaller than the pool of hydrogen transferred directly between bacteria. 5.2. Process parameters The biological processes in an anaerobic, methane-producing environment are influenced by an array of factors. Some of the most important factors are temperature, pH, nutrient and substrate concentrations, but also the retention time in the system and the solids content have influence on the process performance. The following section briefly describes the most important factors and their influence upon the methane production. The factors have been divided into two sub-groups, one related to the concentration of substrate and other compounds in the anaerobic environment and one related to the design of the system in which the processes take place. 5.2.1. Factors related to substrate concen-tration The microbial population needs a range of macro and micronutrients for cell growth and methane production. The macronutrients carbon, hydrogen, nitrogen and oxygen are the main constituents of microbial cell tissue. Sulfur and phosphorous are required for amino acid synthesis and for synthesis of energy transporting compounds (ATP). In addition potassium, magnesium and iron are required as cofactors for enzyme activity. Sulfide (S-) and ammonia/ammonium (NH3/NH4
+) are the normal sources of S and N in anaerobic environments but other sources such as urea and organic matter are also of importance. The above nutrients must be available in concentrations of at least 10-4M. In addition a range of micronutrients are required (concentration < 10-4M). These are Ni and Co important for cofactors and enzymes. The presence of phosphate (PO4
3-) can lower the metal concentration due to precipitation reactions. Sulfide can also react with metals forming sparingly soluble compounds. Excessive concentrations of S- and PO4
3- can therefore inhibit microbial growth and result in poor gas production. Calcium, potassium, sodium and magnesium can also reduce microbial activity if they are present in high concentrations. They can, however, stimulate the degradation and growth processes if they are added in low concentrations (0.01M for Na and K and 0.005M for Ca and Mg). In general it is not necessary to add macro or micronutrients to reactors treating manure or municipal biodegradable wastes as these materials contain all nutrients necessary for methane production.
-200
-150
-100
-50
0
50
1000 3 6 9
G0 k
J/m
ole
pH2
Figure 5.2. Energy yield from aciddegradation and methane production(after Christensen 1998)
CH4
H2S
Ethanol
Propionate
Benzoate
Butyrate
In addition to specific toxic substances in the input organic material, the presence of certain readily degradable organic compounds can inhibit the microbial process. An increase in the concentrations of lipids (long-chain organic molecules found in cell membranes) can result in an overproduction of long-chain fatty acids, as the hydrolysis process is usually faster than the
95
Chapter 5 Anaerobic digestion Solid waste management Tjalfe G. Poulsen, Aalborg University, June 2003 subsequent reactions. The fatty acids will further inhibit the acid degrading and methane producing reactions resulting in a ‘sour’ process (see later under pH). In a reactor adapted to high lipid loading the addition of lipids will result in a very high gas production because of the high energy content of the lipids. High concentrations of proteins can result in the formation of high concentrations of NH3 that is also a strong inhibitor for the anaerobic process. To avoid the problems connected with proteins a long startup period should be used for systems treating materials with high protein content. The concentrations of both lipids and proteins should therefore be monitored continuously. The composition of the input material should in general be kept as constant as possible. It is well known that ammonia/ammonium (NH3/NH4
+) can inhibit the anaerobic processes. This can especially become a problem during treatment of animal manure that contains high concentrations of urea. There are at present no guidelines for maximum concentrations of NH3/NH4
+. Often the anaerobic process can be adapted to high concentrations. It is especially the methane producing bacteria that are sensitive to high NH3/NH4
+ concentrations. The bacteria are more sensitive to NH3/NH4
+ at high temperatures. This is because the inhibiting component is NH3 and the equilibrium H+ + NH3 ↔NH4
+ will be shifted toward the left at increasing temperatures. Also an increase in pH will result in increased NH3 concentrations. This will cause increased inhibition of the methane production and an increase in the concentration of organic acids, which in turn cause the pH to drop again. This will reduce the NH3 concentration and the degree of inhibition and will result in the phenomenon ‘inhibited steady state’. The methane producing processes are as illustrated in Fig. 5.2 restricted to a narrow interval in hydrogen concentration. The same is the case with respect to pH. Most methane producers have optimum between pH 7 and 8 whereas the acid producers have lower optima. In addition to microbial growth pH can also influence the dissociation and solubility of important compounds such as sulfide. The optimum pH for a biogas reactor operating at 30-40oC is 6.7 – 7.4. The reactor will not function well if pH is less than 6 or more than 8. Because the solubility of CO2 decreases with increasing temperatures the pH in reactors operating at higher temperatures is a bit higher than the interval specified above. The pH is generally controlled by the carbonate system and will therefore depend on the amount of CO2 in the produced biogas. Production of large amounts of ammonia from proteins in the input material can, however, increase pH as this buffer system becomes controlling. 5.2.2. Factors related to system design and operation The choice and control of temperature is of major importance for the course of the digestion processes. Most of the experience with anaerobic digestion is related to mesophillic processes (30 – 40 oC) but in recent years the use of thermophillic systems (50 – 60 oC) has become more common. In rare cases biogas reactors have been operated at ambient (psychrophillic) temperatures (5 – 25 oC). The thermophillic process has certain advantages over processes run at lower temperatures:
• The retention time in the system is shorter due to faster degradation of input organics • The destruction of pathogens is better • The digested product has better separation properties • The degradation of long-chain fatty acids is better • Less biomass compared to quantity of methane produced is required
96
Chapter 5 Anaerobic digestion Solid waste management Tjalfe G. Poulsen, Aalborg University, June 2003 The most important disadvantages are:
• More energy is required to run the process • The risk of inhibition by ammonia is greater
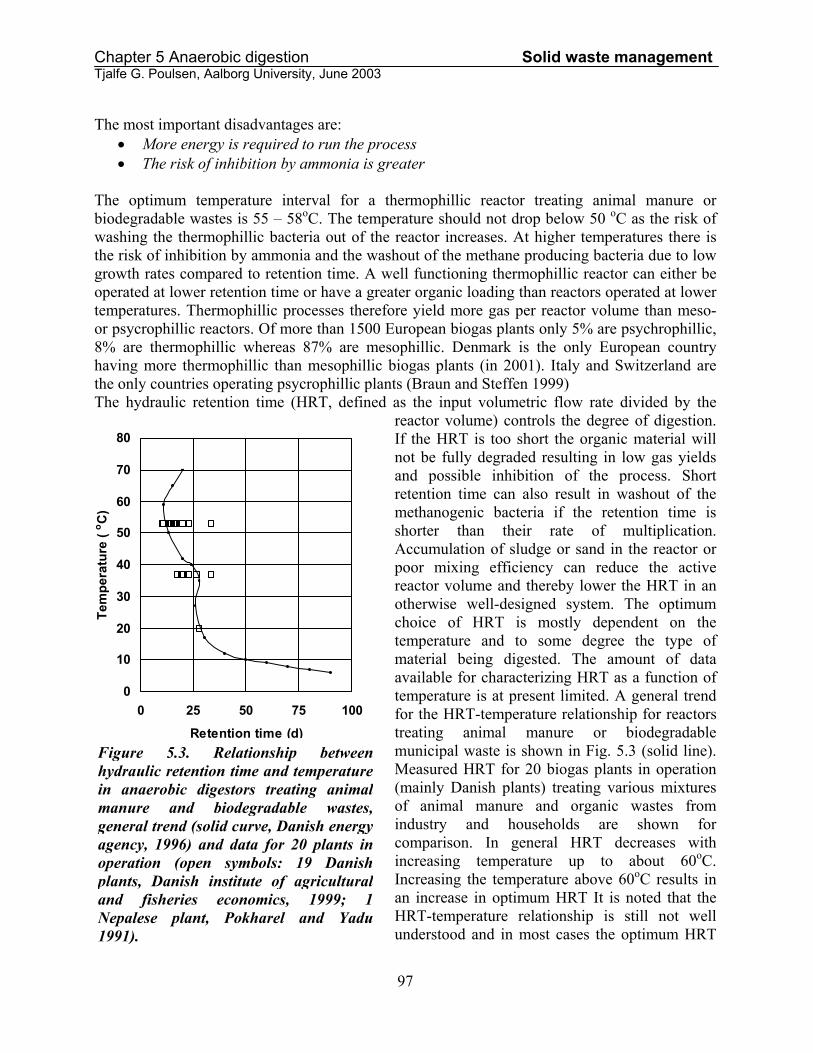
The optimum temperature interval for a thermophillic reactor treating animal manure or biodegradable wastes is 55 – 58oC. The temperature should not drop below 50 oC as the risk of washing the thermophillic bacteria out of the reactor increases. At higher temperatures there is the risk of inhibition by ammonia and the washout of the methane producing bacteria due to low growth rates compared to retention time. A well functioning thermophillic reactor can either be operated at lower retention time or have a greater organic loading than reactors operated at lower temperatures. Thermophillic processes therefore yield more gas per reactor volume than meso- or psycrophillic reactors. Of more than 1500 European biogas plants only 5% are psychrophillic, 8% are thermophillic whereas 87% are mesophillic. Denmark is the only European country having more thermophillic than mesophillic biogas plants (in 2001). Italy and Switzerland are the only countries operating psycrophillic plants (Braun and Steffen 1999) The hydraulic retention time (HRT, defined as the input volumetric flow rate divided by the
reactor volume) controls the degree of digestion. If the HRT is too short the organic material will not be fully degraded resulting in low gas yields and possible inhibition of the process. Short retention time can also result in washout of the methanogenic bacteria if the retention time is shorter than their rate of multiplication. Accumulation of sludge or sand in the reactor or poor mixing efficiency can reduce the active reactor volume and thereby lower the HRT in an otherwise well-designed system. The optimum choice of HRT is mostly dependent on the temperature and to some degree the type of material being digested. The amount of data available for characterizing HRT as a function of temperature is at present limited. A general trend for the HRT-temperature relationship for reactors treating animal manure or biodegradable municipal waste is shown in Fig. 5.3 (solid line). Measured HRT for 20 biogas plants in operation (mainly Danish plants) treating various mixtures of animal manure and organic wastes from industry and households are shown for comparison. In general HRT decreases with increasing temperature up to about 60oC. Increasing the temperature above 60oC results in an increase in optimum HRT It is noted that the HRT-temperature relationship is still not well understood and in most cases the optimum HRT
0
10
20
30
40
50
60
70
80
0 25 50 75 100
Retention time (d)
Tem
pera
ture
(o C
)
Figure 5.3. Relationship betweenhydraulic retention time and temperaturein anaerobic digestors treating animalmanure and biodegradable wastes,general trend (solid curve, Danish energyagency, 1996) and data for 20 plants inoperation (open symbols: 19 Danishplants, Danish institute of agriculturaland fisheries economics, 1999; 1Nepalese plant, Pokharel and Yadu1991).
97
Chapter 5 Anaerobic digestion Solid waste management Tjalfe G. Poulsen, Aalborg University, June 2003 is found by fine-tuning the system during the initial stages of the operation. The lowest HRT’s are associated with the thermophillic region. The thermophillic choice therefore appears to be the most efficient type of digestion process. The digestion process can be optimized to handle input material with a wide range of dry matter contents (3 - 25%). The majority of existing biogas plants treating organic wastes and animal manure are, however, operating at dry matter concentrations of 3 – 12 %. The reason is that this material can be directly pumped without any special equipment and it is easier to ensure proper mixing in the reactor. Other reactor designs capable of treating high-solids materials exist and will be discussed in more detail later. Even though the process can be optimized to a specific solids content it is important to maintain a constant solids content in the input material because variations in solids content is likely to result in fouling of the degradation process due to overproduction of organic acids. If a change in input solids content is desired it is best done by slowly changing the input over a longer period of time to acclimatize the process. 5.2.3. Indicators of process performance Several parameters have been used as indicators for process imbalance. An ideal indicator should be easy to measure, should detect the imbalance at an early stage and should reflect the metabolic state of the digester. It is also important that the relative change in the indicator is significant compared to measurement uncertainty and background fluctuations. Some of the most widely used indicators (Table 5.2) are described in the following sections. Gas production and gas composition. If the reactor is overloaded the gas production will initially increase and then suddenly decrease after a period of time due to accumulation of inhibiting products (acids). Depending on the degree of imbalance can the gas production decrease while the relative amount of CO2 increases because it is not consumed by the H2 utilizing methanogens (strong imbalance). Variations in gas composition have been observed in connection with process imbalance. Gas production and composition cannot solely be used as indicators for process imbalance as changes can simply be a result of changes in the substrate composition. It is therefore necessary to combine gas production and composition with data for substrate composition and loading. In situations where there have been no changes in substrate composition and loading a change in gas production and composition can indicate process imbalance. The actual gas production can also be compared to the expected gas yield to assess process imbalance. pH. Process imbalance in an anaerobic digester will normally lead to accumulation of volatile fatty acids (VFA) resulting in a decrease in pH. The increase in acid concentration may not register as a drop in pH immediately if the buffer capacity of the material in the reactor is high. Most organic wastes have often a high content of weak acids and bases resulting in high buffer capacity. The organic acid accumulation therefore has to reach a high level before it is detected as a drop in pH. At that point the organic acids already significantly inhibit the process. pH is therefore difficult to use as it only reacts slowly to process imbalance. It is mentioned that pH is easy and inexpensive to measure and it is therefore an effective indicator in systems with low buffer capacity. Alkalinity. For materials with high buffer capacity such as animal manure it is as mentioned above not possible detect increasing acid concentrations based on measurements of pH. Measurements of total alkalinity is a better detection method as alkalinity is consumed by the acids before a drop in pH can be detected. Alkalinity is the capacity of a solution to neutralize
98
Chapter 5 Anaerobic digestion Solid waste management Tjalfe G. Poulsen, Aalborg University, June 2003 acids and is often expressed as milliequivalents (meq) or mg of CaCO3 per liter. Similarly the capacity for a solution to neutralize bases is called acidity. The alkalinity in an anaerobic system originates primarily from bicarbonate (HCO3
-) and from fatty acids. Alkalinity is not an absolute value but depends upon the choice of pH endpoint for the titration. pH values often used are 4.2, 4.3, and 5.8. It is not possible to use alkalinity as a single indicator for process imbalance because alkalinity may vary due to variations in input material composition. Measurements of alkalinity should therefore be combined with measurements of VFA concentrations in the reactor. Rapid variations in alkalinity that cannot be related to variations in input material composition could indicate process imbalance. Table 5.2. Indicators for process imbalance in anaerobic digestion (after Christensen 1998) Indicator Principle Gas production Changes in pecific gas production Gas composition Changes in the CH4/CO2 concentration ratio PH Drop in pH due to VFA accumulation Alkalinity Detects changes in buffer capacity Total volatile fatty acids (VFA) Changes in total concentration of VFA Individual VFA Accumulation of individual VFA COD or volatile solids reduction Changes in degradation rate Volatile fatty acid (VFA) concentration. As discussed earlier the production and consumption of hydrogen must correspond in order to ensure degradation of the complex organic material into acetate and hydrogen. The hydrogen producing acetogenic bacteria have lower growth rate than the fermenters and cannot change their metabolism depending on the conditions, as can the fermenters. The methanogens are also a sensitive group and without their activity the hydrogen consuming acetogens (group IV in Fig. 5.1) cannot metabolize. The result is an accumulation of organic acids, alcohols, etc. due to either lack of degradation of these compounds or lack of degradation of their degradation products (hydrogen). This means that an accumulation of acids and alcohols indicate process imbalance but measurements at biogas facilities suggest that this accumulations is by itself not the cause of the imbalance. The most applied method to assess the status of the process is measurement of the total VFA concentration in the reactor. This method does not yield information about the concentrations of individual acids but is simple to carry out since it is simply a titration. Several different levels of VFA concentration is observed depending on the type of reactor, input material and process. It is therefore not possible to define specific concentration intervals for ‘normal’ process behavior. The relative change in VFA concentrations with time appears to be a valuable parameter for evaluation of process status. Volatile solids. The reduction in volatile solids (VS) from input to output of the reactor does not directly yield any information about the state of the biological processes but can be used as an indicator of process efficiency. A drop in VS reduction from inlet to outlet indicates a failing process. This drop, however, is seen only after the process is strongly out of balance. 5.3. Biogas and methane potential. One of the most important issues in anaerobic waste treatment is the quantity and composition of gas produced. Often the economy of the treatment facilities depends on the sales of gas or energy (heat, electricity) derived from the biogas. The biogas potential (the amount of gas that can be
99

Chapter 5 Anaerobic digestion Solid waste management Tjalfe G. Poulsen, Aalborg University, June 2003 produced from a given quantity of organic waste) is therefore an essential parameter. The following section discusses biogas potential and gas composition as related to the design and operation of the digester as well as composition of the organic material digested. Because biogas typically is a mixture of different gases and methane is the compound that is of interest (seen from an energy perspective at least) the term methane potential will be used rather than the more diffuse term biogas potential. 5.3.1. The composition of biogas Untreated biogas fresh from the reactor is a mixture of several different gases (Table 5.3). When organic matter is degraded anaerobically the result is carbon in its most oxidized form (CO2) and its most reduced form (CH4). The CH4/CO2 ratio depends on the oxidation state of the organic
material. The more reduced the carbon in the organic material is the more CH4 will be produced relative to CO2. The composition of the biogas exiting the reactor also depends upon the pH in the reactor because part of the CO2 will dissolve (CO2(aq)) or be present as HCO3- in solution. Almost all of the methane generated will be present as gas due to the low solubility of methane. This means that the methane content in the gas phase always will be larger than predicted based on the stoichiometry of
degradation. In addition to CH4 and CO2 trace amounts of other gases are generated. Hydrogen sulfide (H2S) is of most interest because this gas usually needs to be removed before the biogas can be used for energy production due to highly corrosive acids generated by oxidation of H2S.
Compound Volumetric percentage CH4 40 – 70 CO2 30 – 60 H2 0 – 1 H2S 0 – 3 Other (NH3) 0 – 2
Table 5.3. Typical composition of freshbiogas (water vapour not included)
5.3.2. Ultimate methane potential If the chemical composition of the input organic matter is known the ultimate quantity of methane that can be produced may be estimated based upon the stoichiometry of the degradation reaction using Buswells formula.
CaHbOcNd +
4a-b-2c+3d
4 H2O →
4a+b-2c-3d
8 CH4 +
4a-b+2c+3d
8 CO2 +dNH3 (5.1)
The specific theoretical methane yield (Bth) in terms of normal cubic meters, Nm3 CH4 per ton volatile solids (VS defined as ignition loss at 550oC) under standard conditions (0oC 1 atm) can be calculated from
Bth = 22400
4a+b-2c-3d
8 12a+b+16c+14d (5.2)
5.3.3. Actual methane potential The theoretical methane potential calculated from Eqs. (5.1) and (5.2) gives the maximum of methane that can possibly be generated from the given organic matter. It can therefore only be
100
Chapter 5 Anaerobic digestion Solid waste management Tjalfe G. Poulsen, Aalborg University, June 2003 used as an estimate of the possible methane production that can be achieved in a full-scale digester. The actual methane yield from digesters is always lower due to the following factors: Part of the organic input (substrate) will be used for generation of new biomass (bacteria). This fraction is typically on the order of 5-10 % of the input VS. Part of the organic matter will exit the reactor without being degraded. This fraction is typically on the order of 10%. The lignin
containing part of the organic matter cannot be degraded under anaerobic conditions. For lignin containing materials the biodegradable fraction (BF) can be estimated as BF = 0.83-0.028LC (5.3) Where LC is the lignin content as a percentage of VS (Table 5.4) Part of the organic matter is bound to inorganic particles and will not be available for microbial degradation. The degradation of the organic matter may be restricted due to lack of sufficient nutrients for microbial growth. It is therefore in general advisable to use actual measured methane potentials under the conditions that one wishes to run the digester. Such measurements
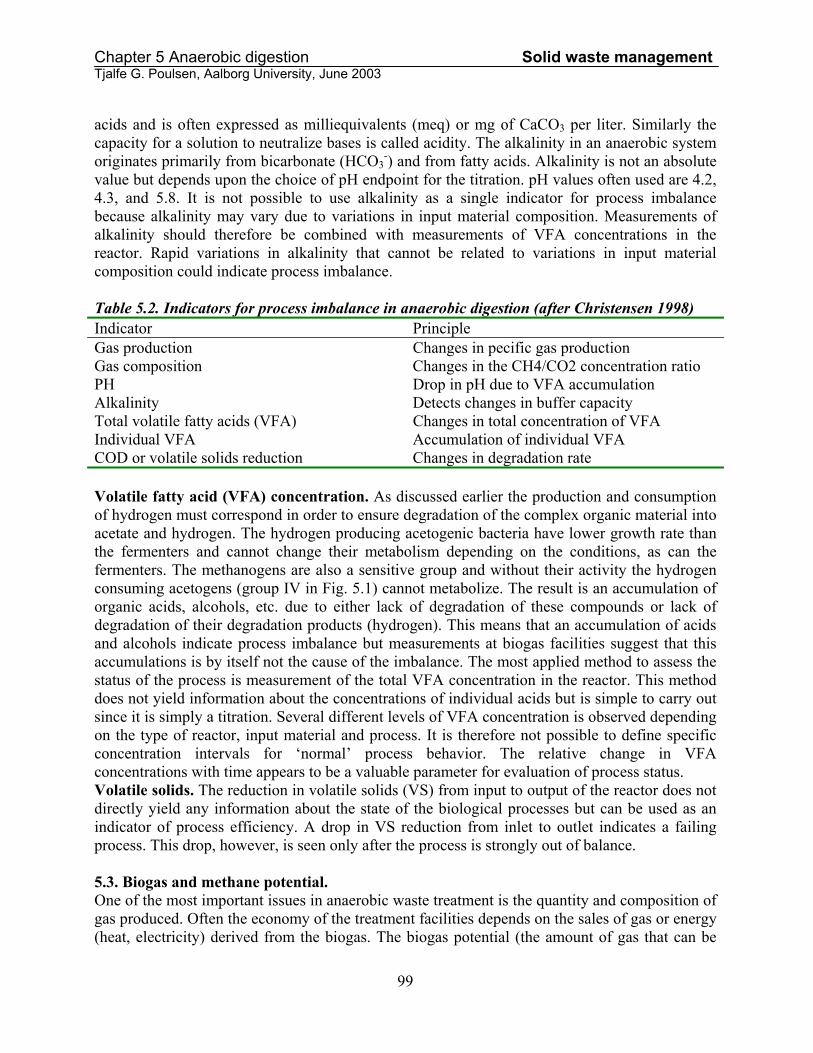
can be difficult to carry out in practice as many full-scale biogas plants are using mixtures of different organic materials as substrates. Table 5.5 presents measured values of methane potential for a thermophillic digester for a range of different organic materials from various sources.
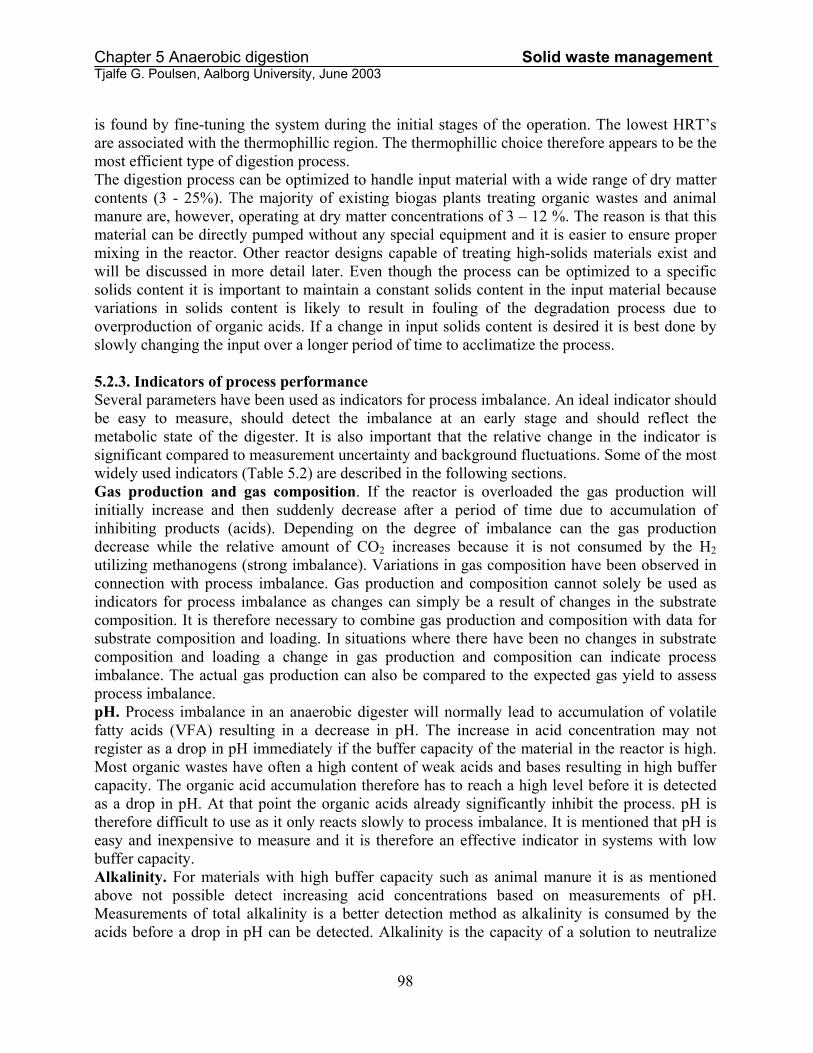
Component Lignin content % of VS Food wastes 0.4 Newspaper 21.9 Office paper 0.4 Cardboard 12.9 Yard wastes 4.1 Chicken manure 3.4 Pig manure 2.2 Cow manure 8 Wheat straw 13 Whey acid 0 Pine wood 28
Table 5.4. Lignin content of selected organic materials. (Richard 2000)
Table 5.5. Methane potentials for selected biodegradable wastes from industry, farming and households. Source: Studsgård biogas plant (Denmark) (Jensen 1998, personal communication)
Source Type of waste % dry matter VS (% of dry) Nm3 CH4 per ton VS Cosmetic prod. Fat-alcohol 95 100 685
Chewing gum prod. Talc-sugar dust mixture 95 100 137 Alcohol production Alcohol 95 100 618 Sausage production Flotation sludge 7.6 100 512 Dairy production Whey 7.5 100 694
Oil mills Bleaching soil 95 45 342 Communities Residential organic waste 35 100 279
Animal feed prod. Feed residue (grain, fat etc.) 80 100 81 Heparin prod. Mucosa 17 100 229
Restaurants etc. Fat from fat separator 50 - 52 100 124 – 130 Brewery Yeast solution 12 100 426
Dairy production Sewage sludge 2.0 100 1649 Slaughter houses Intestants 15 100 260
Bakery Bread etc. 60 100 108 Farms Manure (pigs cattle) 6.0 100 239
Oil mills Fat sludge 31 – 60 100 488 – 527
101
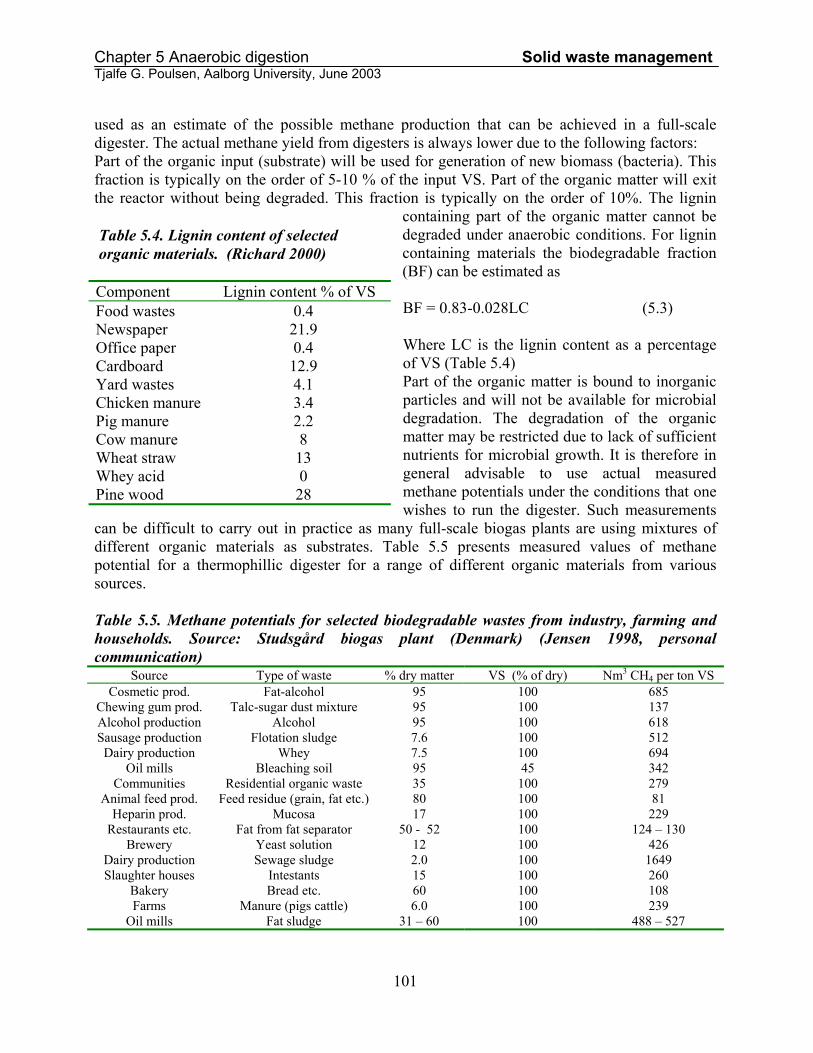
Chapter 5 Anaerobic digestion Solid waste management Tjalfe G. Poulsen, Aalborg University, June 2003 In general about 50-70% of the biodegradable materials will be converted into biogas in an average biogas reactor depending on process conditions. This interval is applicable to manure, sewage sludge, restaurant waste and household waste. Special industrial wastes consisting of easily degradable materials such as sugars, fats and proteins will normally show an even higher rate of turnover. Methane production rates from various mixtures of organic materials may be estimated using the data in Table 5.5. It is noted that the data in Table 5.5 corresponds to thermophillic treatment and
they should therefore be used for evaluation of thermophillic systems only. For mesophillic and psychrophilic systems the methane yields can be significantly lower. This is especially the case for psychrophilic systems. Temperature effects are illustrated in Figure 5.4. that shows methane yield as a function of reactor volume for 20 Danish thermophillic and mesophillic full-scale digestors. The yields are quite variable but do with some approximation follow a linear trend. The slope (the methane yield pr m3 of reactor) is clearly higher for the thermophillic systems. The methane yield can also be estimated if the reactor design and the biodegradation properties of the organic material being digested is known. Hashimoto et al. (1979) proposed the following model for methane yield (B) per mass of COD or VS input as a function of design
parameters and type of organic material.
0
1000
2000
3000
4000
5000
6000
7000
0 2000 4000 6000 8000
Reactor volume (m3)
Ann
ual m
etha
ne y
ield
(100
0 N
m3 )
Figure 5.4. Methane yield as a function ofdigester volume for 20 Danish thermophillic(open symbols) and mesophillic (closed symbols)biogas plants. Danish Institute of agriculturaland fisheries economics (1999)
B = B0 S0HRT
1-
KHRT µm -1 +K (5.4)
where B0 is the ultimate methane yield, S0 is the input biodegradable substrate concentration in terms of COD or VS concentration, µm is the maximum specific growth rate of the microorganisms in the reactor (a lumped parameter) and K is a dimensionless kinetic parameter. B0 can be found by plotting the steady-state methane production against 1/HRT for different levels of HRT for a given constant temperature and extend the plot to infinity (1/HRT = 0). For beef cattle manure B0 is approximately 0.32 Nm3 per kg VS. The maximum specific growth rate for the anaerobic microorganisms in terms of d-1 can be estimated as µm = 0.013T-0.129 where T is temperature. The expression is valid in the temperature interval 20 – 60 oC. The constant K can be found by plotting the HRT vs (S0 – Se)/Se where Se is the effluent COD or VS
102
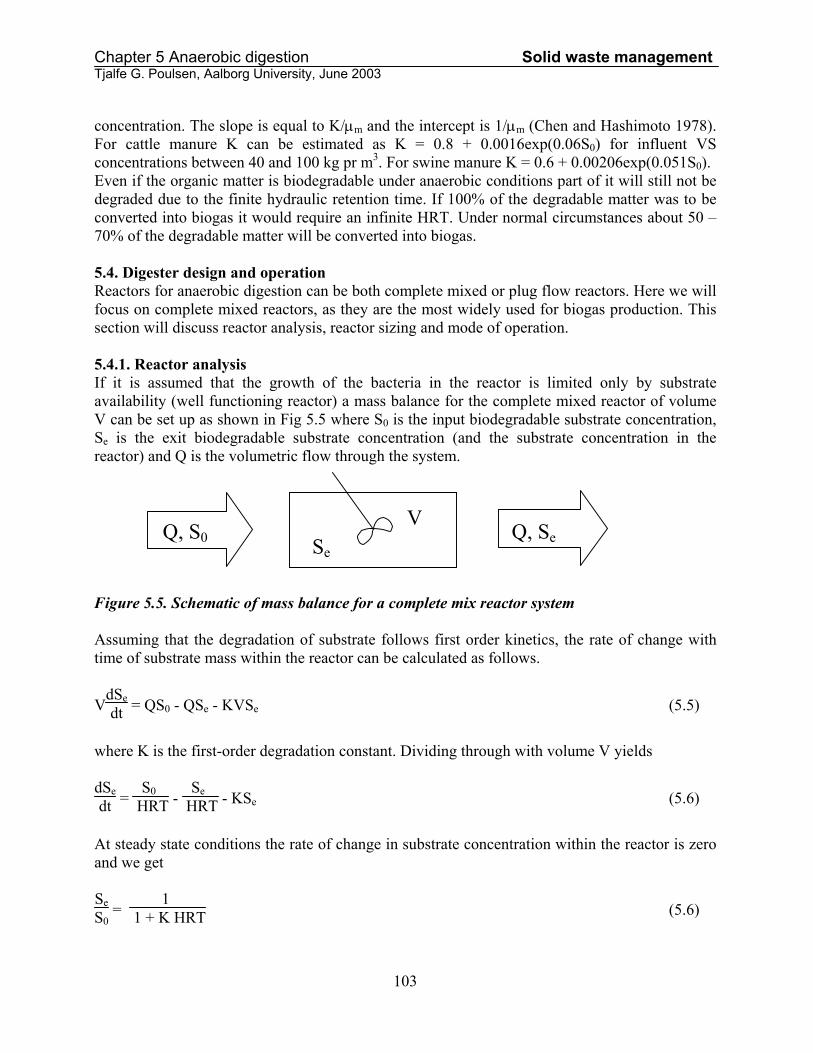
Chapter 5 Anaerobic digestion Solid waste management Tjalfe G. Poulsen, Aalborg University, June 2003 concentration. The slope is equal to K/µm and the intercept is 1/µm (Chen and Hashimoto 1978). For cattle manure K can be estimated as K = 0.8 + 0.0016exp(0.06S0) for influent VS concentrations between 40 and 100 kg pr m3. For swine manure K = 0.6 + 0.00206exp(0.051S0). Even if the organic matter is biodegradable under anaerobic conditions part of it will still not be degraded due to the finite hydraulic retention time. If 100% of the degradable matter was to be converted into biogas it would require an infinite HRT. Under normal circumstances about 50 – 70% of the degradable matter will be converted into biogas. 5.4. Digester design and operation Reactors for anaerobic digestion can be both complete mixed or plug flow reactors. Here we will focus on complete mixed reactors, as they are the most widely used for biogas production. This section will discuss reactor analysis, reactor sizing and mode of operation. 5.4.1. Reactor analysis If it is assumed that the growth of the bacteria in the reactor is limited only by substrate availability (well functioning reactor) a mass balance for the complete mixed reactor of volume V can be set up as shown in Fig 5.5 where S0 is the input biodegradable substrate concentration, Se is the exit biodegradable substrate concentration (and the substrate concentration in the reactor) and Q is the volumetric flow through the system.
e
Q, S0 Figure 5.5. Schematic of mass balance for a co Assuming that the degradation of substrate foltime of substrate mass within the reactor can be
VdSedt = QS0 - QSe - KVSe
where K is the first-order degradation constant. dSedt =
S0 HRT -
Se HRT - KSe
At steady state conditions the rate of change inand we get SeS0
= 1
1 + K HRT
1
V
e Smplete mix reac
lows first order calculated as fol
Dividing through
substrate concen
03
Q, S
tor system
kinetics, the rate of change with lows.
(5.5)
with volume V yields
(5.6)
tration within the reactor is zero
(5.6)
Chapter 5 Anaerobic digestion Solid waste management Tjalfe G. Poulsen, Aalborg University, June 2003 This can be rearranged into a linear form. S0 - Se = K Se HRT (5.7) Running a series of tests using the organic substrate that is to be digested for varying HRT and plotting S0 – Se versus Se HRT will yield a straight line with slope K if the assumption of first-order kinetics is valid. If K is known Eq. (5.7) can be used to estimate the required HRT to obtain a desired substrate removal rate in the reactor. 5.4.2. Design approach based on reactor analysis An anaerobic digester can very well be designed based on reactor analysis using a laboratory bench scale reactor digesting the organic material in question. The first step is to determine the degradation constant K based on experimental data from the lab reactor. The second step is to choose the desired substrate removal efficiency i.e. (S0 - Se)/S0. Given S0 the design HRT can be computed from Eq. (5.7). The required reactor volume can then be calculated if the volumetric flow rate Q is known as V = HRT*Q. Given the chemical composition of the biodegradable matter, the methane yield can be estimated using Eqs. (5.2) in combination with Table 5.4 and Eq. (5.3). Example: Designing a complete mixed digester for municipal food wastes. Parameters: Digester temperature is 55oC Input 5000 tons (wet weight) of food waste per year Inert solids (sand) 5% of dry weight Chemical composition 52% C, 8% H, 37% O, 3% N by weight (neglecting other species) Water content 75% Design dry matter content 10% by weight Design biodegradable VS reduction efficiency 80% First-order degradation constant K = 0.25 d-1 Calculate the necessary quantity of dilution water The dry matter mass is 0.25*5000 = 1250 tons corresponding to 10% of the total input mass including dilution water. The total amount of water necessary is then 1250/10%*90% = 11250 tons water. The amount of dilution water necessary is then 11250 tons water total - (5000 tons wet waste – 1250 tons dry matter) = 7500 tons water. The total input mass/volume is then 12500 tons/m3. Calculate the biodegradable fraction of the input material Lignin content from Table 5.4: LC = 0.4 Biodegradable fraction from Eq. (5.3): BF = 0.83-0.028*0.4 = 0.82 Calculate the input biodegradable substrate concentration S0 and design effluent biodegradable substrate concentration Se.
S0 = 1250 tons dry matter*(1-0.05)
12500 m3 input volume 0.82 biodegradable fraction = 78kg/m3
104
Chapter 5 Anaerobic digestion Solid waste management Tjalfe G. Poulsen, Aalborg University, June 2003 Se = (1-80%) * 78kg/m3 = 15.6 kg/m3 Calculate the annual loading of biodegradable volatile solids M0 = 78kg/m3*12500tons*1000m3/ton = 973.75 tons/yr Calculate the design HRT using Eq. (5.7)
HRT = S0 - SeK Se
= 78 - 15.60.25*15.6 = 16d
If K is not known HRT can be selected from Fig. 5.3 yielding 13-16d. Calculate the reactor design volume
V = HRT*Q = 16d*12500m3/yr
365d/yr = 548 m3
Calculate an approximate molecular formula for the input material. For every gram of food waste (dry matter) we have 0.45g C, 0.07g H, 0.32g O, and 0.03g N. This means that we have 0.45/12 moles of C, 0.07 moles of H, 0.32/16 moles of O, and 0.03/14 moles of N. An approximate chemical formula can therefore be expressed as C0.043H0.08O0.023N0.0021 Calculate the theoretical methane yield per ton of biodegradable volatile solids degraded in the reactor using Eq. (5.2)
Bth = 22400
4a+b-2c-3d
8 12a+b+16c+14d = 22400
4*0.043+0.08-2*0.023-3*0.0021
8 12*0.043+0.08+16*0.023+14*0.0021 = 563 Nm3
Annual methane yield = 973.75*563 = 548221 Nm3/yr Calculate the methane yield per ton of total solids entered into reactor
B = 548221Nm3/yr
1250tons/yr = 438.5 Nm3/ton
The methane yield could alternatively have been calculated using Eq.(5.4) if the parameters K and µm are known. At present the knowledge about the biodegradation parameters used in the different models is scarce. Often digester design is based on experiences from existing plants. Here we could for instance have selected the HRT based on the data in Fig 5.3. In this case we could only have obtained an estimate of the theoretical methane potential from Eq. (5.2). 5.5. Plant design and operation Biogas plants are usually equipped with reception facilities for the incoming organic materials. At plants treating different types of wastes there may be several receiving tanks assigned to the
105

Chapter 5 Anaerobic digestion Solid waste management Tjalfe G. Poulsen, Aalborg University, June 2003 different wastes. The purpose of the tanks is to provide a constant stream of materials to the digester and provide proper mixing of different wastes before the mixture is injected into the digester. Depending on legislation and waste type wastes may be treated in a pre-hygienization tank before entering the reactor. This is used for instance in connection with household and industrial food wastes at certain plants in Denmark. After treatment in the digester, the digested materials usually enter a final hygienization tank where they are treated at a high temperature for a predetermined amount of time usually specified by legislation (70oC, 1h). The organic matter is finally placed in a storage tank before being shipped back to farmers or other users. The main quantity of biogas is produced in the digester but smaller amounts are usually also recovered from hygienization and final storage tanks. The gas is placed in a gas storage tank and used to produce heat and electricity when required. At advanced biogas plants the energy conversion takes place in a combined heat and power plant (CHP plant) to maximize the energy utilization. Heat is used at the plant for digester heating and sold to nearby consumers. Electricity is sold to the grid. 5.5.1. Reactor designs Reactor design and mode of operation typically vary depending on the type and properties of the organic waste treated as well as upon requirements for hygienization of the digested materials. This section briefly describes the most widely used reactor types and options for management of the flows of water and organic material through the digester. Possibilities for gas cleaning and hygienization of the digested materials are also discussed. The most widely used reactor design is the completely mixed reactor (CMR). Out of more than 1500 European biogas plants the CMR approach is used in at least 50% of the cases (AD-Nett 1999). The main reason is the simplicity of these systems both with respect to construction and operation of the plant. The plug flow reactor design is only used in about 16% of the plants. The advantage of the CMR is that it is easier to maintain well-defined substrate concentrations in the reactor and to monitor the process parameters compared to the plugged flow reactor where the parameters depend upon the location within the reactor. It is also easier to prevent sedimentation of the suspended organic matter. Reactors are typically constructed using steel or concrete (for at least 90% of the reactors). Reactors with volumes up to 3-4000 m3 are typically constructed as welded steel tanks using coated or rust-free steel (Christensen et al. 1998). Digesters with volumes larger than about 4000 m3 are rarely found at biogas plants but are seen at large waste-water treatment plants where they are used for sludge digestion. The large tanks are normally constructed using concrete elements. Steel tanks are normally completely gas tight and are therefore typically operated at high pressures (2 – 3 kPa) whereas concrete tanks are difficult to make completely airtight. The gas pressure in concrete reactors must therefore be maintained at a minimum (0.1 – 0.5 kPa) to minimize the gas loss. The reactor should have an inspection hatch so it is possible to enter, inspect and maintain the interior surface and installations in the reactor when necessary. Mixing in the reactor is normally achieved using submerged mixing devices that are mounted through the top of the reactor with an external motor, or by blowing gas into the reactor via the bottom. In smaller reactors the usual approach is to use submerged mixing devices. Rectors with volumes of 1000 – 4000 m3 are often fitted with devices mounted through the top of the reactor.
106
Chapter 5 Anaerobic digestion Solid waste management Tjalfe G. Poulsen, Aalborg University, June 2003 In large reactors the mixing is often done using a combination of mechanical mixing devices and gas injection. Heating of the digester is usually done using heat exchangers (steel pipes) mounted on the walls of the reactor. It is important that mixing of the reactor contents near the heat exchangers is good to prevent the materials from burning onto the surfaces of the heat exchangers. Because the digester is the primary component of biogas plants it is important to ensure an effective control of the conditions within the reactor. This normally includes monitoring of several factors including:
• Incoming quantity of waste • Exiting quantity of waste • Concentration of VFA in the tank • Temperature and temperature
distribution in the tank • Gas production • pH in the tank • Volume of solid/liquid in the tank • Gas pressure at the top of the tank
The level of automatic control is individual for each plant and there are no general rules for systems for monitoring and control of the digestion process. There is a tendency in industrialized countries where hourly wages are high to make the level of automatic control as high as possible to minimize expenses for workers salaries and ensure stable process conditions (Christensen 1998).
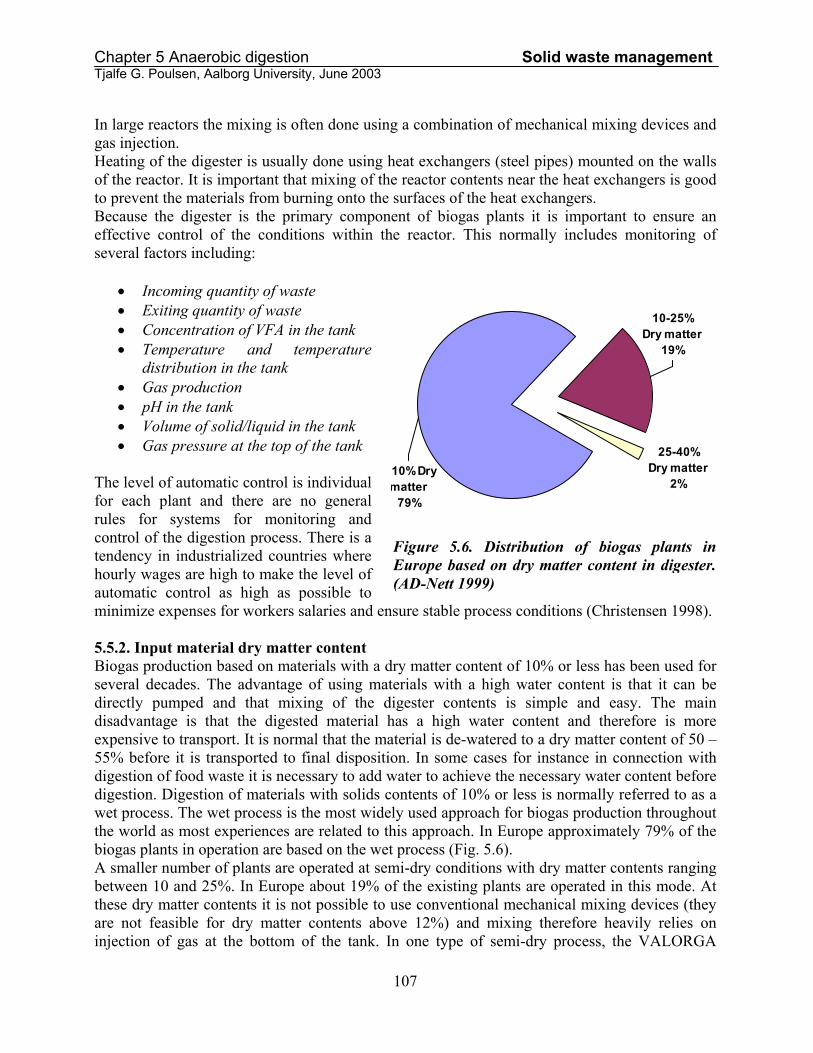
10% Dry matter
79%
25-40% Dry matter
2%
10-25% Dry matter
19%
Figure 5.6. Distribution of biogas plants inEurope based on dry matter content in digester.(AD-Nett 1999)
5.5.2. Input material dry matter content Biogas production based on materials with a dry matter content of 10% or less has been used for several decades. The advantage of using materials with a high water content is that it can be directly pumped and that mixing of the digester contents is simple and easy. The main disadvantage is that the digested material has a high water content and therefore is more expensive to transport. It is normal that the material is de-watered to a dry matter content of 50 – 55% before it is transported to final disposition. In some cases for instance in connection with digestion of food waste it is necessary to add water to achieve the necessary water content before digestion. Digestion of materials with solids contents of 10% or less is normally referred to as a wet process. The wet process is the most widely used approach for biogas production throughout the world as most experiences are related to this approach. In Europe approximately 79% of the biogas plants in operation are based on the wet process (Fig. 5.6). A smaller number of plants are operated at semi-dry conditions with dry matter contents ranging between 10 and 25%. In Europe about 19% of the existing plants are operated in this mode. At these dry matter contents it is not possible to use conventional mechanical mixing devices (they are not feasible for dry matter contents above 12%) and mixing therefore heavily relies on injection of gas at the bottom of the tank. In one type of semi-dry process, the VALORGA
107
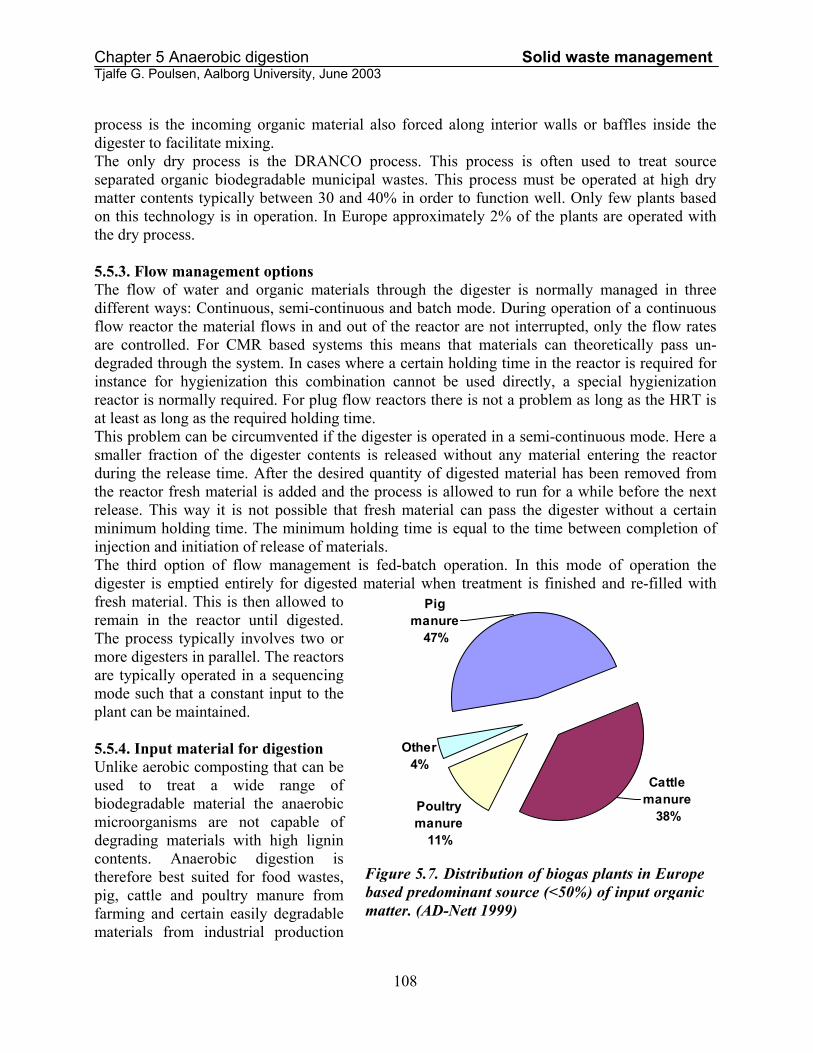
Chapter 5 Anaerobic digestion Solid waste management Tjalfe G. Poulsen, Aalborg University, June 2003 process is the incoming organic material also forced along interior walls or baffles inside the digester to facilitate mixing. The only dry process is the DRANCO process. This process is often used to treat source separated organic biodegradable municipal wastes. This process must be operated at high dry matter contents typically between 30 and 40% in order to function well. Only few plants based on this technology is in operation. In Europe approximately 2% of the plants are operated with the dry process. 5.5.3. Flow management options The flow of water and organic materials through the digester is normally managed in three different ways: Continuous, semi-continuous and batch mode. During operation of a continuous flow reactor the material flows in and out of the reactor are not interrupted, only the flow rates are controlled. For CMR based systems this means that materials can theoretically pass un-degraded through the system. In cases where a certain holding time in the reactor is required for instance for hygienization this combination cannot be used directly, a special hygienization reactor is normally required. For plug flow reactors there is not a problem as long as the HRT is at least as long as the required holding time. This problem can be circumvented if the digester is operated in a semi-continuous mode. Here a smaller fraction of the digester contents is released without any material entering the reactor during the release time. After the desired quantity of digested material has been removed from the reactor fresh material is added and the process is allowed to run for a while before the next release. This way it is not possible that fresh material can pass the digester without a certain minimum holding time. The minimum holding time is equal to the time between completion of injection and initiation of release of materials. The third option of flow management is fed-batch operation. In this mode of operation the digester is emptied entirely for digested material when treatment is finished and re-filled with fresh material. This is then allowed to remain in the reactor until digested. The process typically involves two or more digesters in parallel. The reactors are typically operated in a sequencing mode such that a constant input to the plant can be maintained. 5.5.4. Input material for digestion Unlike aerobic composting that can be used to treat a wide range of biodegradable material the anaerobic microorganisms are not capable of degrading materials with high lignin contents. Anaerobic digestion is therefore best suited for food wastes, pig, cattle and poultry manure from farming and certain easily degradable materials from industrial production
Other4%
Pig manure
47%
Poultry manure
11%
Cattle manure
38%
Figure 5.7. Distribution of biogas plants in Europebased predominant source (<50%) of input organicmatter. (AD-Nett 1999)
108
Chapter 5 Anaerobic digestion Solid waste management Tjalfe G. Poulsen, Aalborg University, June 2003 such as fats, oils or alcohols. Materials such as straw, park/garden wastes, paper and wood waste (sawdust) cannot be easily degraded anaerobically. When it comes to agricultural wastes such as pig, cattle manure digestion is often done using only a single type of waste. Pig and cattle manure are especially suitable for this type of treatment also pig and cattle manure constitute the main source of organic material in many regions of the world (Fig. 5.7). Digestion of other types of wastes with higher contents of dry matter such as food wastes and certain industrial wastes is often done as co-digestion where these wastes are mixed with low solids wastes such as manures. This is often done because it is difficult to get satisfactory conditions using pure wastes other than pig and cattle manure. Especially pig manure is well suited for co-digestion due to its high buffer capacity. In many cases co-digestion with manure can be the solution to a malfunctioning digestion process. In special cases such as the DRANCO process where a high solids content is required thickening materials such as straw or garden waste is often added to increase the solids content. These materials will not be significantly degraded through the process under normal conditions and can be recovered from the materials exiting the digester. 5.5.5. Biogas cleaning Raw biogas is a wet gas containing a range of compounds (Table 5.3). The gas must be cooled to condense the water vapor before the gas can be used. It is important that the gas transmission pipes can be drained, as they will otherwise be flooded with condensed water. Carbon dioxide is normally not removed apart from a small quantity that is dissolved in the condensation water. If the biogas is to be used in a boiler and there are no restrictions on SO2 emissions the gas can be used directly after the water vapor has been removed. In case there are restrictions on SO2 emissions the H2S must be removed from the biogas. If the gas is to be used in a gas motor H2S must also be removed to prevent corrosion of the motor. Removal of H2S is in general accomplished in two different ways: I) chemically, and II) biologically. The chemical process is based on addition of a solution containing dissolved iron to the feedstock. The iron reacts with H2S forming the insoluble mineral FeS. Removal of H2S and precipitation of FeS can also be achieved if the input material contains wastes with a high natural iron content. In such cases the amount of iron solution required can be reduced. Addition of iron is a relatively expensive solution and is therefore not widely used. Biological removal of H2S is achieved by adding a small amount of atmospheric air (2 – 8 volume %) to the biogas. Bacteria will then oxidize H2S to elementary sulfur, H2SO3 or H2SO4 depending on the oxygen concentration. The reaction takes place spontaneously on the walls of the reactor or on the surface of the liquid phase in the reactor. Because the oxidation products contain acids there is a risk of corrosion and the biological oxidation process is therefore often done in a separate reactor containing special porous material where the bacteria grow (typically plastic cubes or cylinders). The media is irrigated from the top to wash away the acids and accumulated elementary sulfur. The irrigation also supply nutrients for the bacteria. The liquid used for irrigation must have high alkalinity to neutralize the acids. The liquid fraction of digested pig manure is well suited for this purpose due to its high alkalinity. Typical quantity of gas treated is 10 m3 biogas per hour and m3 of reactor. The typical process temperature is 35 oC (Christensen 1998). The biological oxidation process will be effective if the amount of air injected is slightly higher than the stoichiometric amount required.
109
Chapter 5 Anaerobic digestion Solid waste management Tjalfe G. Poulsen, Aalborg University, June 2003
5.6. Economy and energy production The financial income of most biogas facilities in general comes from three sources. The most important source is sales of energy and to some degree the digested organic materials. In some countries additional income comes from subsidies from public sources often in the form of higher prices on the heat and electricity produced at biogas plants. Finally centralized plants treating municipal and industrial biodegradable wastes in some cases generate income from fees on the materials received at the plants. 5.6.1. Energy conversion Conversion of biogas to heat and power is a clean and environmentally friendly process. Only water and carbon dioxide is produced. The energy conversion itself does not contribute to the global loading of carbon dioxide to the atmosphere because the energy source is organic matter, which is CO2 neutral (the same amount of CO2 is released during degradation and gas combustion as was taken up during growth of plant tissue).
The energy content of methane is 27.5 MJ/kg which is approximately twice that of food wastes. Biogas with 65% methane has an energy content of 6.5 kWh per Nm3.
0
10000
20000
30000
40000
50000
60000
0 2000 4000 6000 8000
Reactor volume (m3)
Con
stru
ctio
n co
st (1
000
DK
K)
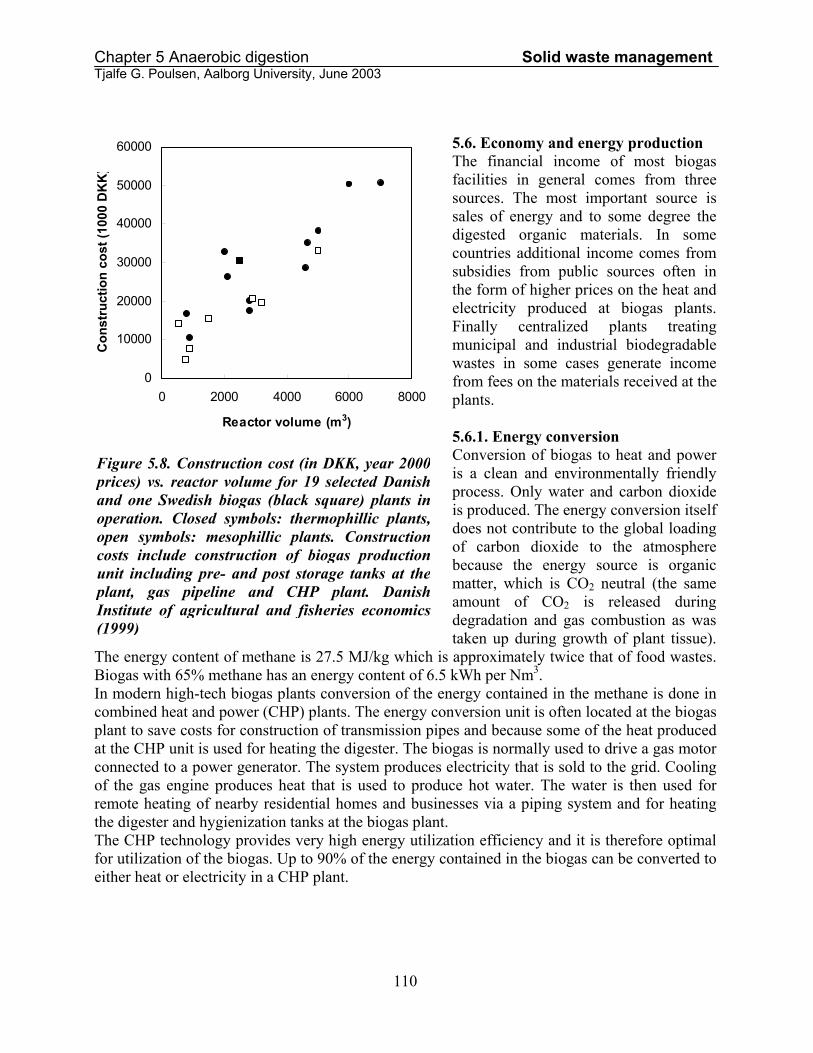
Figure 5.8. Construction cost (in DKK, year 2000prices) vs. reactor volume for 19 selected Danishand one Swedish biogas (black square) plants inoperation. Closed symbols: thermophillic plants,open symbols: mesophillic plants. Constructioncosts include construction of biogas productionunit including pre- and post storage tanks at theplant, gas pipeline and CHP plant. DanishInstitute of agricultural and fisheries economics(1999)
In modern high-tech biogas plants conversion of the energy contained in the methane is done in combined heat and power (CHP) plants. The energy conversion unit is often located at the biogas plant to save costs for construction of transmission pipes and because some of the heat produced at the CHP unit is used for heating the digester. The biogas is normally used to drive a gas motor connected to a power generator. The system produces electricity that is sold to the grid. Cooling of the gas engine produces heat that is used to produce hot water. The water is then used for remote heating of nearby residential homes and businesses via a piping system and for heating the digester and hygienization tanks at the biogas plant. The CHP technology provides very high energy utilization efficiency and it is therefore optimal for utilization of the biogas. Up to 90% of the energy contained in the biogas can be converted to either heat or electricity in a CHP plant.
110
Chapter 5 Anaerobic digestion Solid waste management Tjalfe G. Poulsen, Aalborg University, June 2003 Smaller quantities of methane is usually lost from the biogas plants and the CHP plant due to leaks in piping and pumps etc. These losses are typically on the order of 2% for the biogas plant and 3% for the CHP plant (Koch 2000). Greater losses may be encountered if the gas is transported over long distances for energy utilization away from the biogas plant. In modern plants approximately 36 - 40% of the energy contained in the biogas can be converted to electricity and about 50% to useful heat (hot water) yielding an energy utilization efficiency of 86 - 90%. Part of the power and heat generated is used to run the biogas plant this normally amounts to 10% of the heat and power generated. 5.6.2. Economy The cost of biogas production and organic waste treatment consists of capital costs (construction costs) and costs related to the operation and maintenance of the plant (O&M costs). The capital costs depend mostly upon the size of the plant and on whether energy conversion technology is included in the plant facilities. There is, however, no impact of the process temperature as shown in Fig. 5.8. The empirical relation between construction costs and reactor volume for the plants in Fig. 5.8 is: Cost in 1000 DKK= 5.6 + 8100.
0
2000
4000
6000
8000
10000
0 2000 4000 6000 8000Digester volume (m3)
Ope
ratio
n co
st (1
000
DK
K)
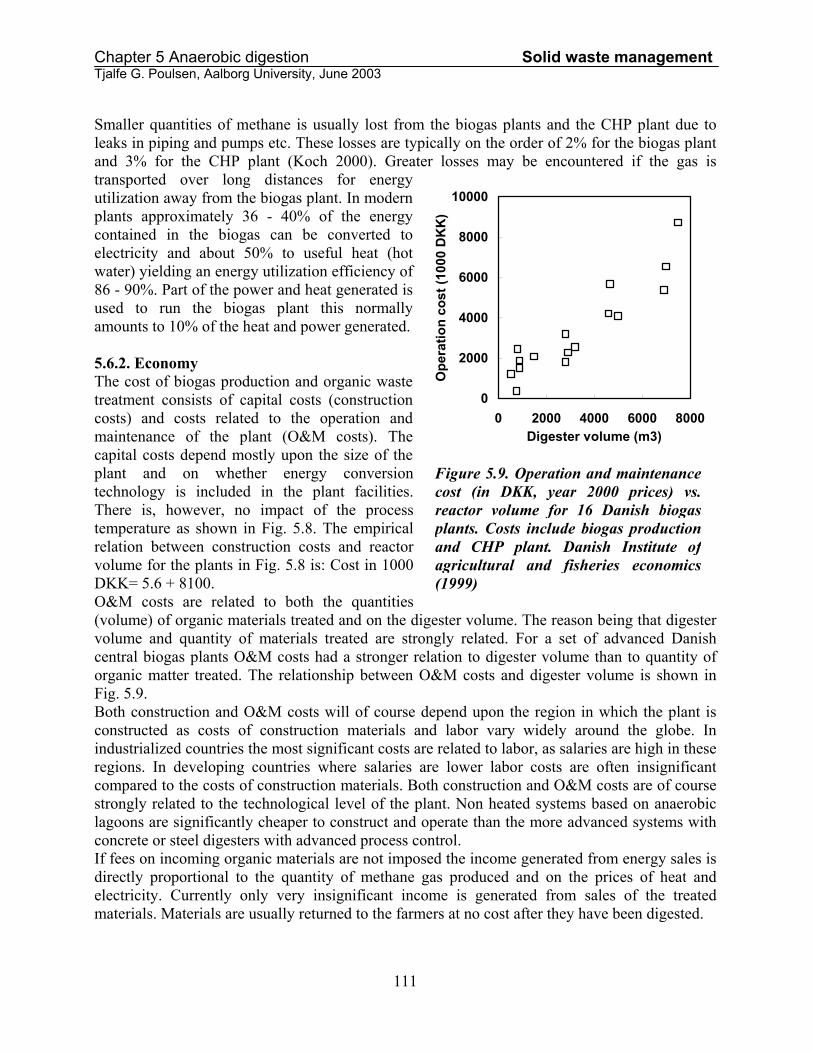
O&M costs are related to both the quantities (volume) of organic materials treated and on the digester volume. The reason being that digester volume and quantity of materials treated are strongly related. For a set of advanced Danish central biogas plants O&M costs had a stronger relation to digester volume than to quantity of organic matter treated. The relationship between O&M costs and digester volume is shown in Fig. 5.9.
Figure 5.9. Operation and maintenancecost (in DKK, year 2000 prices) vs.reactor volume for 16 Danish biogasplants. Costs include biogas productionand CHP plant. Danish Institute ofagricultural and fisheries economics(1999)
Both construction and O&M costs will of course depend upon the region in which the plant is constructed as costs of construction materials and labor vary widely around the globe. In industrialized countries the most significant costs are related to labor, as salaries are high in these regions. In developing countries where salaries are lower labor costs are often insignificant compared to the costs of construction materials. Both construction and O&M costs are of course strongly related to the technological level of the plant. Non heated systems based on anaerobic lagoons are significantly cheaper to construct and operate than the more advanced systems with concrete or steel digesters with advanced process control. If fees on incoming organic materials are not imposed the income generated from energy sales is directly proportional to the quantity of methane gas produced and on the prices of heat and electricity. Currently only very insignificant income is generated from sales of the treated materials. Materials are usually returned to the farmers at no cost after they have been digested.
111
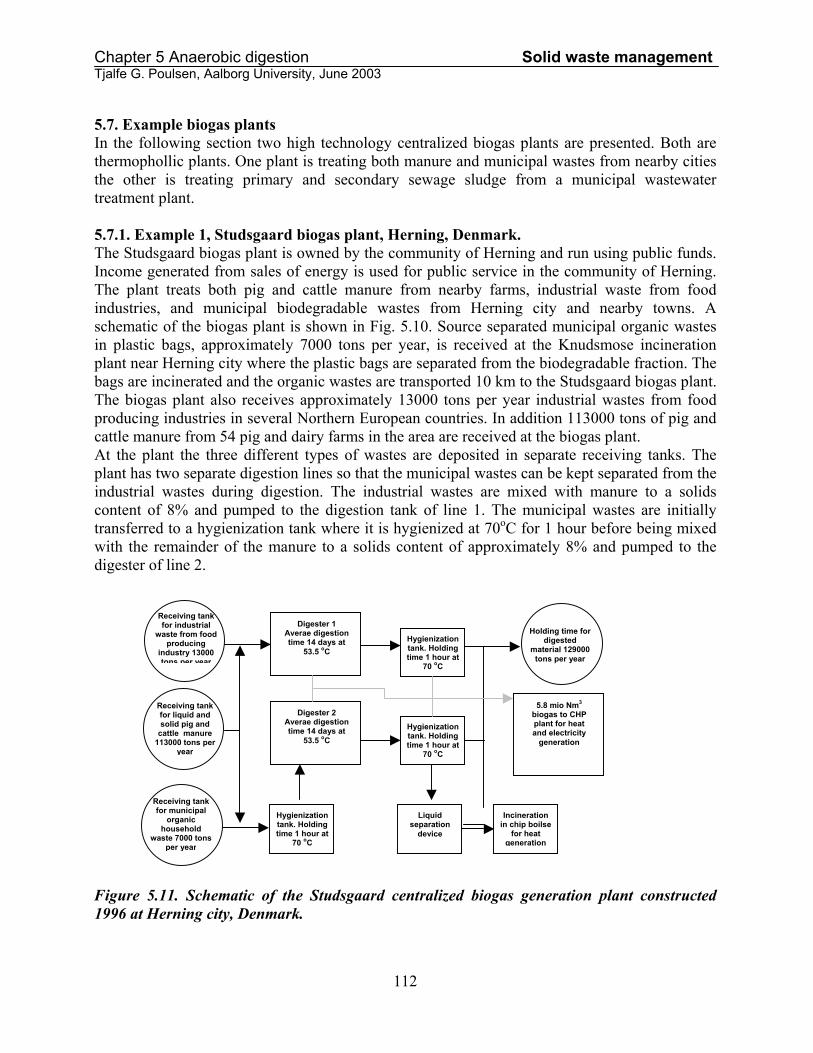
Chapter 5 Anaerobic digestion Solid waste management Tjalfe G. Poulsen, Aalborg University, June 2003 5.7. Example biogas plants In the following section two high technology centralized biogas plants are presented. Both are thermophollic plants. One plant is treating both manure and municipal wastes from nearby cities the other is treating primary and secondary sewage sludge from a municipal wastewater treatment plant. 5.7.1. Example 1, Studsgaard biogas plant, Herning, Denmark. The Studsgaard biogas plant is owned by the community of Herning and run using public funds. Income generated from sales of energy is used for public service in the community of Herning. The plant treats both pig and cattle manure from nearby farms, industrial waste from food industries, and municipal biodegradable wastes from Herning city and nearby towns. A schematic of the biogas plant is shown in Fig. 5.10. Source separated municipal organic wastes in plastic bags, approximately 7000 tons per year, is received at the Knudsmose incineration plant near Herning city where the plastic bags are separated from the biodegradable fraction. The bags are incinerated and the organic wastes are transported 10 km to the Studsgaard biogas plant. The biogas plant also receives approximately 13000 tons per year industrial wastes from food producing industries in several Northern European countries. In addition 113000 tons of pig and cattle manure from 54 pig and dairy farms in the area are received at the biogas plant. At the plant the three different types of wastes are deposited in separate receiving tanks. The plant has two separate digestion lines so that the municipal wastes can be kept separated from the industrial wastes during digestion. The industrial wastes are mixed with manure to a solids content of 8% and pumped to the digestion tank of line 1. The municipal wastes are initially transferred to a hygienization tank where it is hygienized at 70oC for 1 hour before being mixed with the remainder of the manure to a solids content of approximately 8% and pumped to the digester of line 2.
5.8 mio Nm3 biogas to CHP plant for heat and electricity
generation
Holding time for digested
material 129000 tons per year
Hygienization tank. Holding time 1 hour at
70 oC
Hygienization tank. Holding time 1 hour at
70 oC
Digester 2Averae digestion time 14 days at
53.5 oC
Digester 1Averae digestion time 14 days at
53.5 oC
Receiving tank for liquid and solid pig and
cattle manure 113000 tons per
year
Receiving tank for industrial
waste from food producing
industry 13000 tons per year
Liquid separation
device
Incineration in chip boilse
for heat generation
Hygienization tank. Holding time 1 hour at
70 oC
Receiving tank for municipal
organic household
waste 7000 tons per year
Figure 5.11. Schematic of the Studsgaard centralized biogas generation plant constructed 1996 at Herning city, Denmark.
112
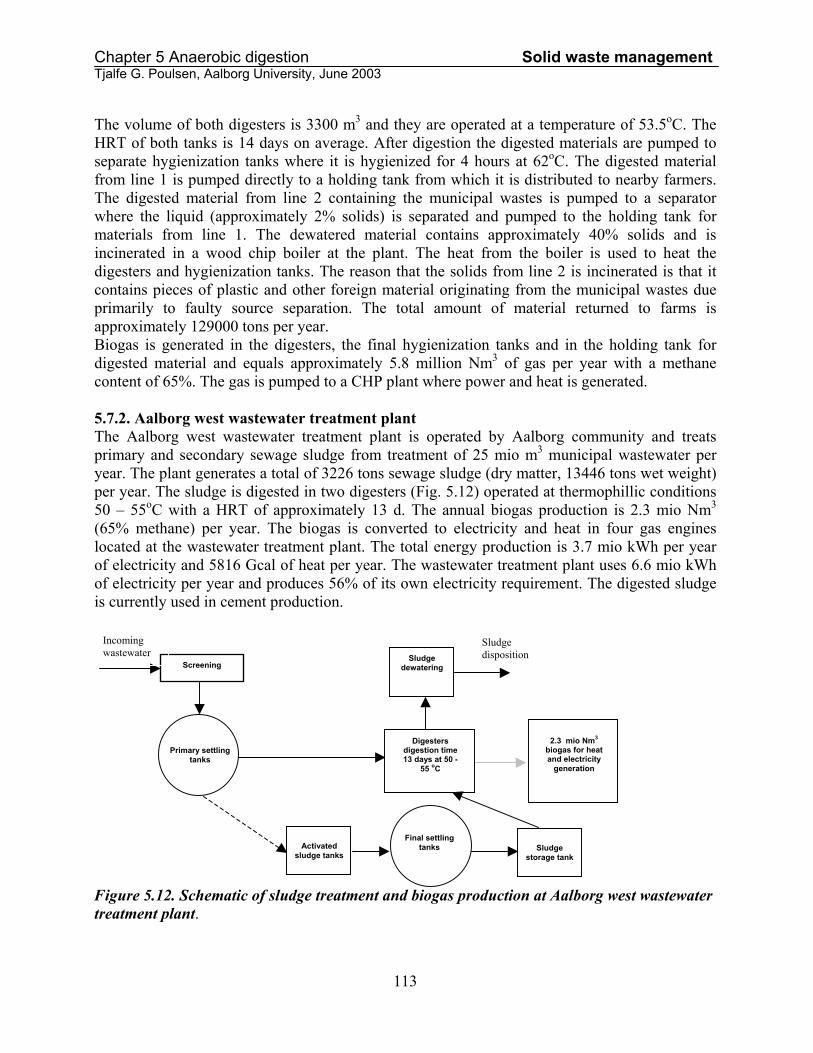
Chapter 5 Anaerobic digestion Solid waste management Tjalfe G. Poulsen, Aalborg University, June 2003 The volume of both digesters is 3300 m3 and they are operated at a temperature of 53.5oC. The HRT of both tanks is 14 days on average. After digestion the digested materials are pumped to separate hygienization tanks where it is hygienized for 4 hours at 62oC. The digested material from line 1 is pumped directly to a holding tank from which it is distributed to nearby farmers. The digested material from line 2 containing the municipal wastes is pumped to a separator where the liquid (approximately 2% solids) is separated and pumped to the holding tank for materials from line 1. The dewatered material contains approximately 40% solids and is incinerated in a wood chip boiler at the plant. The heat from the boiler is used to heat the digesters and hygienization tanks. The reason that the solids from line 2 is incinerated is that it contains pieces of plastic and other foreign material originating from the municipal wastes due primarily to faulty source separation. The total amount of material returned to farms is approximately 129000 tons per year. Biogas is generated in the digesters, the final hygienization tanks and in the holding tank for digested material and equals approximately 5.8 million Nm3 of gas per year with a methane content of 65%. The gas is pumped to a CHP plant where power and heat is generated. 5.7.2. Aalborg west wastewater treatment plant The Aalborg west wastewater treatment plant is operated by Aalborg community and treats primary and secondary sewage sludge from treatment of 25 mio m3 municipal wastewater per year. The plant generates a total of 3226 tons sewage sludge (dry matter, 13446 tons wet weight) per year. The sludge is digested in two digesters (Fig. 5.12) operated at thermophillic conditions 50 – 55oC with a HRT of approximately 13 d. The annual biogas production is 2.3 mio Nm3 (65% methane) per year. The biogas is converted to electricity and heat in four gas engines located at the wastewater treatment plant. The total energy production is 3.7 mio kWh per year of electricity and 5816 Gcal of heat per year. The wastewater treatment plant uses 6.6 mio kWh of electricity per year and produces 56% of its own electricity requirement. The digested sludge is currently used in cement production. Figure 5.12. Schematic of sludge treatment and biogas production at Aalborg west wastewater treatment plant.
Sludge disposition
Incoming wastewater
2.3 mio Nm3
biogas for heat and electricity
generation
Final settling tanks
Sludge dewatering
Sludge storage tank
Digesters digestion time 13 days at 50 -
55 oC
Activated
sludge tanks
Primary settling tanks
Screening
113

Chapter 5 Anaerobic digestion Solid waste management Tjalfe G. Poulsen, Aalborg University, June 2003 5.8. References AD-Nett 2000. The anaerobic digestion network. http://www.ad-nett.org. Chen, Y. R. and A. G. Hashimoto. 1978. Kinetics of methane fermentation. Biotechnology and bioengineering Symp. No. 8, pp 269-268. John Wiley & Sons 1978. Christensen, T. H. 1998. Affaldsteknologi (in Danish). Teknisk Forlag Copenhagen Danish Institute of agricultural and fisheries economics. 1999. Centralized biogas plants. Danish Institute of agricultural and fisheries economics. Dolfing, J. 1988. Acetogenesis. In: Zehnder A. J. B. (ed). Biology of anaerobic microorganisms. John Wiley & Sons. Hashimoto, A. G., V. H. Varel and Y. R. Chen. 1979. Factors affecting methane yield and production rate. ASAE paper No. 79-4583, ASAE, St. Joseph, MI 49085. Jensen, A. 1998. Personal communication and visit to the Studsgaard biogas plant. Koch, T. 2000. Personal communication and visit to Thomas Koch Energy Consulting Inc. Pokharel, R. K. and R. P. Yadu 1991. Application for biogas technology in Nepal: Problems and prospects. MIT (Mountain Infrastructure and Technology) discussion paper II. Kathmandu: International centre for integrated mountain development 1991, 27pp. Richard, T. 2000. The effect of lignin on biodegradability. http://www.cfe.cornell.edu/compost/calc/lignin.html Vogels, G. D., J. T. Keltjens, and C. van der Drift. 1988. Biochemistry of methane production. In: Zehnder A. J. B. (ed). Biology of anaerobic microorganisms. John Wiley & Sons.
114
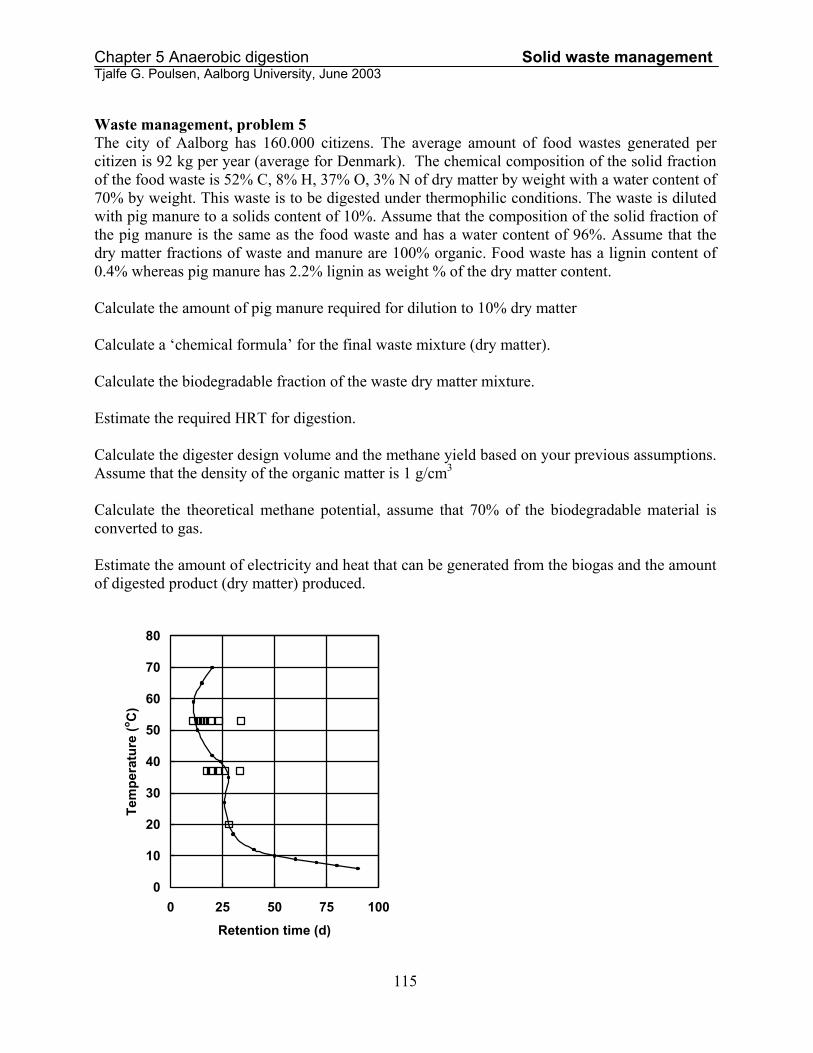
Chapter 5 Anaerobic digestion Solid waste management Tjalfe G. Poulsen, Aalborg University, June 2003 Waste management, problem 5 The city of Aalborg has 160.000 citizens. The average amount of food wastes generated per citizen is 92 kg per year (average for Denmark). The chemical composition of the solid fraction of the food waste is 52% C, 8% H, 37% O, 3% N of dry matter by weight with a water content of 70% by weight. This waste is to be digested under thermophilic conditions. The waste is diluted with pig manure to a solids content of 10%. Assume that the composition of the solid fraction of the pig manure is the same as the food waste and has a water content of 96%. Assume that the dry matter fractions of waste and manure are 100% organic. Food waste has a lignin content of 0.4% whereas pig manure has 2.2% lignin as weight % of the dry matter content. Calculate the amount of pig manure required for dilution to 10% dry matter Calculate a ‘chemical formula’ for the final waste mixture (dry matter). Calculate the biodegradable fraction of the waste dry matter mixture. Estimate the required HRT for digestion. Calculate the digester design volume and the methane yield based on your previous assumptions. Assume that the density of the organic matter is 1 g/cm3 Calculate the theoretical methane potential, assume that 70% of the biodegradable material is converted to gas. Estimate the amount of electricity and heat that can be generated from the biogas and the amount of digested product (dry matter) produced.
0
10
20
30
40
50
60
70
80
0 25 50 75 100
Retention time (d)
Tem
pera
ture
(o C)
115