4_main heating systems.docx
TRANSCRIPT

Prepared by BRE on behalf of the Department of Energy and Climate Change
December 2013
BRE report number 286733a
Report 4: Main heating systems

The EFUS has been undertaken by BRE on behalf of the Department of Energy and Climate Change (DECC).
Report editors and lead authors: Jack Hulme, Adele Beaumont and Claire Summers.
Project directed by: John Riley and Jack Hulme.
Data manager: Mike Kay.
Supporting authors and analysts: Mike Kay, Busola Siyanbola, Tad Nowak, Peter Iles, Andrew Gemmell, John Hart, John Henderson, Afi Adjei, Lorna Hamilton, Caroline Buchanan, Helen Garrett, Charlotte Turner, Sharon Monahan, Janet Utley, Sara Coward, Vicky Yan & Matt Custard.
Additional thanks to the wider team of reviewers and contributors at BRE, DECC and elsewhere, including GfK NOP Social Research, Gemini Data Loggers, Consumer Futures, G4S, Eon, British Gas, and for the input of the Project Steering Group and Peer Reviewers.

Executive Summary
The main aim of the 2011 Energy Follow-Up-Survey (EFUS) is to collect new data on patterns of household and dwelling energy use in order to update the current modelling assumptions about how energy is used in the home.
This report presents analysis of:
1. the data collected during the household interview on primary (main) space heating systems and usage
2. the results of the household heating patterns as determined from analysis of the EFUS temperature data
3. results from the collection of metered fuel consumption from the EFUS.
Analysis is based on the interview sample weighted to the national level, using a weighting factor specific to the interview sample. The results presented in this report are therefore representative of the English housing stock, with a population of 21.9 million households. The results of this analysis will be used to inform energy efficiency policy and to inform and update the assumptions in the BRE Domestic Energy Model (BREDEM) and the UK Standard Assessment Procedure (SAP).
The main conclusions resulting from the analysis are summarised below.
Heating Season
§ The majority of householders report that they start heating their home on a regular daily basis in October and finish sometime in March or April. The average (mean) length of the heating season is reported to be 5.6 months. These householder reported findings are supported by analysis of the temperature data.
§ Approximately 2% of households (the equivalent of 0.5 million households) report that they heat their homes daily throughout the year. A similar proportion report that they do not heat their homes at any time of the year.
Daily/Weekly heating patterns for households heating in a regular manner
§ The majority of households (16.0 million, 73%) state that they heat their homes in a regular manner, that is they turn their heating on and off at set times of the day, although this pattern can change for different days of the week and at weekends.
Centrally heated homes
§ 25% of households in centrally heated homes report that they do not have set daily patterns.
§ Almost 10% of centrally heated properties do not have a timer with which to control their heating system. A further 23% have a timer but do not use it to control the system.

§ Nearly 35% of households using a timer to control a central heating system in a regular manner report that they manually override the heating system to turn it off when it is timed to be on at least once every week or more.
§ The majority of regularly heated centrally heated households (70%) report that that they have their heating come on twice per day. A further 21% have their heating on once per day, accounting for 91% of all regularly centrally heated households.
§ From the analysis of the November 2011, December 2011 and January 2012 temperature data it can be seen that the majority of households (76%) maintain the same number of heating periods over these winter months.
§ 60% of households with a central heating system controlled by a timer to give a regular heating pattern report that they switch on their heating for an additional period of ‘boost’ heating at least once a week. This boost period is typically 1‐2 hours per day.
§ The average number of hours that the heating is on for a centrally heated household whose home is regularly heated on a daily basis (excluding any boost heating) is 7.5 hours. Those that have their heating on once per day, typically have it on for 14.5 hours whereas those that have it on twice per day have it on for approximately half that time, typically for 2 hours in the first period and 5 hours in the second period.
§ Analysis of the temperature data to derive timings of heating patterns results in a good agreement of the householder reported data. Using January 2012 as representative of a typical winter month, the temperature data shows that, for those households that heat once per day, the heating is typically on for just over 14 hours whereas those that heat twice per day typically have it on for approximately 2 hours in the first period and 6 hours in the second period during weekdays.
§ For centrally heated households, the median total number of hours of heating (including boost heating) is 8.7 hours according to the householder reported data. This compares to 9.4 hours according to the temperature data. The use of secondary heating seems likely to bring these two estimates closer. Further analysis to combine the main and secondary heating hours reported by the householder may help in understanding the differences.
§ Analysis of the temperature data indicates that the average (median) daily hours of heating increases by 1 hour between November 2011 and December 2011, and remains the same as December for January 2012.
§ The most common heating pattern, comprising between 32% (temperature logger data) and 39% (interview data) of centrally heated households heating their homes in a regular manner, is one in which heating is on twice daily, first at a ‘wakeup time’ for <4 hours and then at ‘home-time’ for 4-10 hours.
§ Results from the temperature logger data also corroborates the conclusion drawn from the analysis of the interview data in that although there is a shift in timings of heating at a weekend compared to a weekday for approximately 25% of the population, for the stock as

a whole, the number of hours of heating at weekends remains approximately the same as for weekdays.
§ Initial bivariate comparisons indicate that factors such as dwelling type, region, tenure, age of occupants and whether occupants are in during the day are likely to be predictor variables for the total number of heating hours. This could be explored further using a multivariate analysis to provide additional insights. It is of particular interest to note that households that are in during the day on weekdays report heating their homes for a median of 9.4 hours per day, compared to households that are out during the day on weekdays reporting heating of 8.0 hours per day. The median number of hours of heating reported by households that are in during the day is lower than often assumed values in many energy modelling applications. It is important to recognise, however, that many energy modelling applications are defined to aspirational, desirable or other standardised levels rather than attempting to modelling actual usage.
Non-centrally heated homes
§ For non-centrally heated households, the average (median) number of hours of heating on a weekday is 13.0 hours according to the householder reported data and 12.5 hours according to the temperature data. The average (median) number of hours of heating on a weekend day 13.0 hours according to both datasets.
Households heating in a non-regular manner
§ 27% of households (5.9 million) report that they do not heat their homes in a regular way, that is to say that they either do not use the heating regularly on a weekly basis or, if they do, they do not use it at regular times on a daily basis.
§ Initial bivariate comparisons suggest that factors determining whether a household will heat their home in a non-regular manner are likely to be the dwelling characteristics of type, floor area and heating system type and fuel, along with the household characteristics of tenure, household size, household income and under-occupancy status.
Extent of main heating
§ Around 65% of households (14.3 million households) have one or more rooms that are not heated by the main heating system. Of these, 82% have one or more rooms with no main heating, and 40% have one or more rooms with the main heating turned off.
§ The majority (68%) of ‘other’ rooms (cellars, attics, outbuildings etc. that are habitable and with a power supply from the home) are not heated by the main heating system. Conservatories, separate WCs, bedrooms, hallways and kitchens are more likely not to be heated by the main heating system than living rooms, dining rooms, studies and bathrooms.
§ Initial bivariate analyses suggest that the dwelling characteristics of dwelling age and type, the type of main heating and number of insulation measures are likely to be underlying factors determining whether a household has one or more rooms not heated by the main heating system.

§ The only significant difference in the likelihood of a certain household characteristic group having one or more rooms not heated by the main heating system is seen for fuel poverty status; households that are calculated to be fuel poor are more likely to have one or more rooms not heated by the main heating system compared to those households that are not fuel poor.
Achieved temperatures
§ The average temperature to which the thermostat is set is reported to be 20°C.
§ Using the temperature data it can be concluded that the average temperature achieved for the living room (zone 1) falls within the range of 19.7-20.4, with the average being 20.2°C, and the average temperature achieved for zone 2 falls within the range of 18.7-19.4, with the average being 19.1°C.
§ Using the temperature data, the temperatures achieved after a significant period of heating are higher among older households, and for households living in dwellings with at least some level of insulation present. This latter finding provides some evidence of occupant ‘takeback’ of energy savings following insulation.
Metered fuel consumption
§ 50% of households with mains gas central heating systems use between 10,000 and 20,000 kWh of gas per year. The median consumption is significantly lower for households heating in a non-regular manner compared to those heating in a regular way.
§ 50% of households using electrical heating systems (storage heaters and room heaters) use between 4,000 and 9,500 kWh of electricity per year.
The analysis has highlighted a number of areas when the SAP and typical BREDEM energy modelling assumptions differ from those reported by households and seen in the temperature data. Future development of these methodologies should consider whether these assumptions should be revised in light of these findings. It should, however, be recognised that assumptions used in energy models are often set at an aspirational standard (for health or warmth for example), or a standardised value for comparison, rather than attempting to model actual usage.
Although there are likely to be some inherent uncertainties in the temperature data due to the difficulty in determining the heating patterns accurately and also limitations in the ‘snapshot’ of responses given by householders in the interview survey, if the results from the householder reported data and the temperature loggers data are taken in combination the primary areas where SAP assumptions differ from those reported by households are:
§ The average (mean) length of the heating season, as derived from the householders’ interview responses is 5.6 months. There is no statistically significant difference between this and the mean heating season length derived from the temperature data, which is 5.7 months.
§ The results from both the household interview survey and the temperature data provide evidence that suggests that the 8 month heating season currently used in SAP (October to
May) may be an overestimate of at least 1 month, possibly 2 months, compared to actual heating seasons, although this could be influenced by the milder than usual spring temperatures recorded in 2011.
§ Currently, SAP 2009 implements a heating pattern of 9 hours for weekdays and 16 hours for weekends in the living room for all heating system types. The results presented in this report suggest that the weekend hours are being overestimated in SAP and that the weekend hours of heating should be the same as the weekday hours.
§ Analysis undertaken in this report suggests that the 9 hours of heating currently used in SAP remains a reasonable approximation for centrally heated dwellings. The results from this analysis do suggest that SAP may underestimate the number of hours of heating in non-centrally heated dwellings.
§ Households that are in during the day on weekdays report heating their homes for a longer period of time (median 9.4 hours per day) than households that are not in during the day on weekdays (median 8 hours per day). This difference is lower than the typically assumed standards in many energy modelling applications which attempt to account for household occupancy.
§ Currently, SAP 2009 implements a demand temperature of 21°C in zone 1 and 18-21°C in zone 2. The results from the temperature data generally support these modelling assumptions, although the zone 1 temperature used in SAP is approximately 0.8°C higher than the average living room achieved temperature from the EFUS temperature data.
§ The temperature data shows that for those households heating twice a day, the first period of heating is typically for a short interval and the time that the heating is on for in many households is not sufficient to bring the room temperatures to the required temperatures. This finding differs to the current SAP methodology which assumes the demand temperature is met during the shorter heating period.

Table of Contents 1 Introduction .............................................................................................................................. 1
2 Methodology ............................................................................................................................. 3
2.1 EFUS Interview Survey ........................................................................................................ 3
2.1.1 Data collection and processing ................................................................................... 3
2.1.2 Data Quality ............................................................................................................... 4
2.2 EFUS Temperature logger data ........................................................................................... 5
2.2.1 Data collection and processing ................................................................................... 5
2.2.2 Data quality ................................................................................................................ 7
2.3 Weighting Factors .............................................................................................................. 7
2.4 Calculating confidence intervals ......................................................................................... 8
3 Findings from the EFUS Interview Survey ................................................................................... 9
3.1 Heating Season .................................................................................................................. 9
3.1.1 General findings ......................................................................................................... 9
3.1.2 Influence of other factors ......................................................................................... 11
3.1.3 Households that heat all year or not at all ................................................................ 14
3.2 Households with central heating – systems used in a regular daily manner ...................... 15
3.2.1 Controls.................................................................................................................... 15
3.2.2 Daily/weekly heating patterns .................................................................................. 16
3.2.3 Boost heating ........................................................................................................... 22
3.2.4 Total main heating hours for households with central heating systems used in a
regular daily manner................................................................................................ 23
3.2.5 The influence of other factors ................................................................................... 24
3.3 Households without central heating who use it in a regular daily manner ........................ 29
3.3.1 Daily/weekly heating patterns .................................................................................. 29
3.4 Households that do not use their heating in a regular manner ......................................... 30
3.4.1 Typical weekly hours of heating for non-regular heaters ........................................... 30
3.4.2 The influence of other factors ................................................................................... 31
3.5 Thermostat settings in centrally heated households ......................................................... 35
3.6 Extent of main heating use ............................................................................................... 36
3.6.1 Characteristics of households with rooms not heated by the main heating system ... 38
4 Findings from the EFUS Temperature logger data .................................................................... 42
4.1 Heating Season ................................................................................................................ 42
4.1.1 Comparison with the householder reported data ..................................................... 44

4.2 Periods and hours of heating ............................................................................................ 44
4.2.1 Number of periods of heating ................................................................................... 44
4.2.2 Number of periods of heating – centrally heated homes and
non-centrally heated homes ..................................................................................... 45
4.2.3 Comparison with householder reported data ........................................................... 46
4.2.4 Number of hours of heating...................................................................................... 47
4.2.5 Comparison with the householder reported data ..................................................... 49
4.2.6 Time that heating comes on in centrally heated households ..................................... 50
4.2.7 Comparison with the householder reported data ..................................................... 53
4.3 Achieved temperatures .................................................................................................... 53
4.3.1 Achieved temperatures in different types of dwelling ............................................... 56
4.3.2 Achieved temperatures in different types of household ........................................... 58
4.3.3 Implications for SAP/BREDEM ................................................................................... 60
5 Findings from the EFUS Metered Consumption data ................................................................ 62
5.1 Gas consumption in households using gas central heating systems .................................. 62
5.2 Electricity consumption in households using electric storage heaters ............................... 64
5.3 Variation in consumption by householder reported heating season length ....................... 65
6 Conclusions ............................................................................................................................. 67
6.1 Implications for SAP ......................................................................................................... 71
Glossary .......................................................................................................................................... 74
References ...................................................................................................................................... 77

1
1 Introduction The main aim of the 2011 Energy Follow-Up Survey (EFUS) was to collect new data on domestic energy use, in order to update the current modelling assumptions about how energy is used in the home, and to inform energy efficiency policy. The 2011 EFUS consisted of a follow-up interview survey of a sub-set of households first visited as part of the 2010/2011 English Housing Survey (EHS). Additionally, sub-samples of these households were selected to have temperature loggers and electricity consumption monitors installed. A further stage of the EFUS was the compilation of gas and electricity consumption data from meter readings.
In this report on main heating patterns, analysis of the data collected during the household interview on main space heating systems and their use is presented (Section 3), along with an analysis of the data collected from the sub-sample of properties with temperature loggers, used as a tool to validate the conclusions drawn from the interview survey (Section 4). Gas and electricity meter readings on approximately half the sample were collected as part of the EFUS 2011 and these are combined with results from the interview survey component in Section 5 of this report.
A key component of this analysis process has been the linkage of the EFUS data to key dwelling and household descriptor variables collected in the interview and physical survey components of the 2010 English Housing Survey (EHS). In this report, and the majority of the companion reports in this EFUS series, simple bivariate comparisons between the variable under consideration and individual descriptor variables have been performed in order to provide preliminary results and identify bivariate trends. It should be recognised, however, that subsequent investigations using more sophisticated statistical analysis may assist in the interpretation of results.
The results of this analysis will be used to inform energy efficiency policy, and to inform and update the assumptions in the key energy modelling methodologies in use in the UK: the BRE Domestic Energy Model (BREDEM) and its derivative the UK Standard Assessment Procedure (SAP). These methodologies are extensively used to predict the annual energy consumption in dwellings; BREDEM includes estimates for space and water heating, lighting, electrical appliances and cooking energy use; whereas SAP includes space and water heating and lighting energy use. CO2 emissions can be deduced directly from energy use, and the prediction of housing-related CO2 emissions through to 2050 will continue to rely heavily on the SAP and BREDEM methodologies. In the current version of SAP used for building regulations (SAP2009) the calculation of the mean internal temperature is based on the heating patterns defined in Table 9 of the SAP document which are as follows:
For all heating system types and controls, the hours of heating for the living room are between 0700-0900 and 1600-2300 on weekdays (9 hours in total) and between 0700-2300 on weekends (16 hours). Elsewhere in the house, SAP 2009 uses two different patterns depending on the level of control of the heating system. For systems with time and temperature controls, including storage heaters and room heaters, the hours of heating are between 0700-0900 and 1800-2300 (7 hours in total) for every day of the week. For all systems with controls other than those stated above, the hours of heating are the same as for the living room i.e. 9 hours on weekdays and 16 hours at the weekend.
Specific questions that the SAP and BREDEM development teams were looking to be answered from the 2011 EFUS survey are:

2
§ What are the typical weekday and weekend heating patterns (i.e. number of hours on, number of periods on and timings on/off) for the main heating system?
§ What temperature do people report they set their thermostats to? Can any further information be obtained from the temperature data?
§ Analysis of demand temperatures has been carried out investigating two specific issues. Firstly, is there evidence of different temperatures in different household types; secondly, is there any evidence of different temperatures in dwellings with and without key energy efficiency measures (and if so, what can we conclude about levels of comfort).
Further analysis on the use of any secondary heating systems is addressed in the accompanying report on the households’ use of alternative and supplementary heating systems (entitled EFUS 2011 Secondary Heating Systems) which is complementary to this one, and should be read in conjunction in order to obtain a more complete view of household heating patterns.

3
2 Methodology
A summary of the methodology of particular relevance to this report is provided below. Additional details, including the full interview questionnaire, can be found in the EFUS 2011 Methodology report.
2.1 EFUS Interview Survey
2.1.1 Data collection and processing The EFUS 2011 interview survey was undertaken by interviewers from GfK NOP between December 2010 and April 2011. A total of 2,616 interviews were completed, drawn from a sample of addresses provided from the first three quarters of the 2010/11 English Housing Survey (EHS). When weighted, this resulted in a population of 21.9 million households. Further detailed information on the EFUS 2011 methodology can be found in the EFUS 2011 Methodology report.
The results presented in Section 3 have been produced using data collected from the ‘Primary Heating System’ section of the EFUS Interview Survey and the first two questions in the ‘Other Heating Systems’ section of the EFUS Interview Survey1. In this section, the householder was first asked to confirm what their main heating system was and the answer to this determined the routing of the subsequent questions. Households using a central heating system were asked one set of questions and households with a non-central heating system (i.e. storage heaters and individual room heaters) were asked a different set of questions. Prior to this split, two questions were asked of all householders regarding the number of months in the year that they used their primary heating system to heat their home every day. At this point, 5% of households (the equivalent of 1.2 million households) responded that they had no regular heating season and for these households, the interview was routed to the final question in the primary heating section to find out how many hours their main heating was on in a typical week in winter.
Although the interview survey was structured so that central heating and non-central heating systems were dealt with separately, the questions asked about the timings for both heating system types were identical. For both central and non-central heating sections, if the householder responded that they had no regular daily pattern for their heating, the interview was routed to the final question in the primary heating section which asked how many hours their main heating was on in a typical week in winter. Householders with central heating systems were also asked additional questions about the controls for the heating systems, whether any additional ‘boost’ heating was ever used and what temperature the thermostat was set to, if present (see Figure 1).
In conducting this analysis, derived variables were produced for the analysis of main heating from the interview survey. The reported on and off times in each heating period for the main heating system have been used to calculate the numbers of hours the system is on for each weekday and the weekend (i.e. subtracting the on-time from the off-time for each period provides the number of hours in each period). This has been done for households who use their heating in a regular manner
1 See survey questionnaire in the EFUS 2011 Methodology Report. The results in this report relate to responses given to questions q05 through to q32, and q33 and q34.

4
(i.e. on regular times on regular days of the week). These data are, where applicable, combined with the reported number of hours of boost heating to provide an estimate of the total weekly heating hours (where this has been done it is specified in the text). In some analysis, the data for regular heaters have also been combined with the weekly estimate of irregular heaters (where this has been done it is specified in the text). Heating season lengths have been calculated from the householders’ responses to questions q07 and q08 on the months in which the household begins and ends heating on a daily basis in a typical year.
Figure 1: Flow chart to show question routing
2.1.2 Data Quality The raw outputs from the interview survey were generally complete and considered good quality. Occasional problems resulted from confusion with the 24 hour clock or random input errors. For these cases, the approach has been to ‘correct’ the data as it was usually obvious what the response should have been. This was carried out for <0.5% of raw survey cases. Some further minor problems were encountered for the ‘boost’ heating questions asked of householders with central heating systems. For households that use some ‘boost’ heating at regular times of day, there is some uncertainty as to whether some householders understood what was meant by ‘boost heating’ as there were several instances in the dataset where the time periods that the ‘boost’ heating was on overlapped with the time periods that the main central heating was on. It is likely that some householders misunderstood the boost heating to be about supplementary heating (see secondary heating report for a definition of these). Whilst these cases have been corrected in the data (by setting the ‘boost’ heating variables to ‘not applicable’) it should be considered that the quality of this part of the data may be less reliable, although this only affected 1% of raw survey cases. There is also an inherent difficulty in attempting to collect information on heating patterns for those households with storage heaters. Storage heater systems are charged at night, and release heat slowly during the daytime often with minimal control options available to the occupant. As such they will often not have a clear heating pattern. For households with storage radiators the respondent was asked about the period when the storage radiators are giving out heat (rather than when they on and off times). Even this form of the question, however, can be difficult to answer for these types of system and the data should be interpreted in this context.
It should also be remembered that the analysis presented in this section is based on householders’ responses to questions rather than to actual timeclock or programmer settings recorded by inspection of these controls by the interviewers. There is therefore an inherent problem in

5
validating the quality of this data, although the cross analysis which has been attempted with the temperature logger data goes some way to achieving this.
2.2 EFUS Temperature logger data The results presented in Section 4 of this report have been produced using data collected from temperature loggers installed in a sub-sample of 823 households drawn from the original 2,616 households in which an interview survey was completed. The temperature survey attempted to collect data on room temperatures, which could then be used to inform assumptions on mean room temperatures for comparison with the SAP and BREDEM models (see EFUS 2011 Mean Household Temperatures report). The derivation of heating patterns and achieved temperatures from the temperature profiles was a secondary objective, done to provide some validation for the self-reported heating patterns information.
Further details of the temperature logger installation and retrieval process can be found in the EFUS 2011 Methodology report.
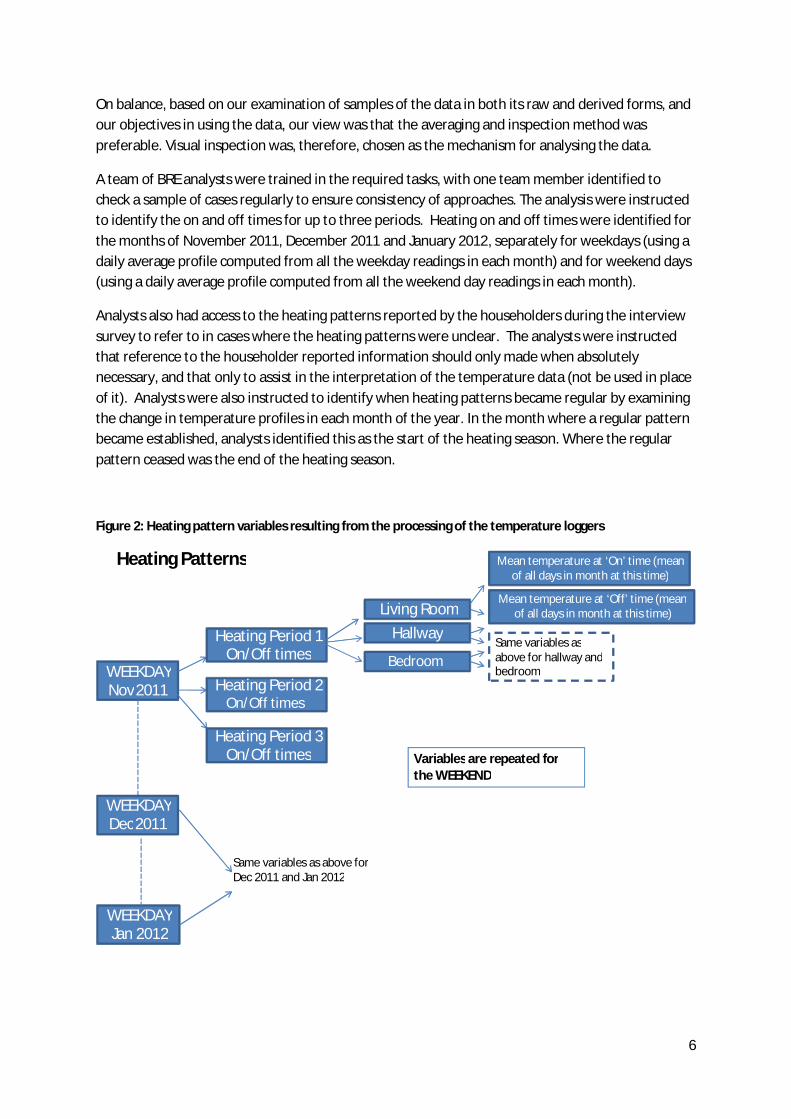
2.2.1 Data collection and processing The temperature data collected as part of the EFUS 2011 consists of temperature readings from up to three rooms collected every 20 minutes for a period of one year in a sample of 823 homes in England. To investigate heating patterns, the data was downloaded from the loggers and processed to form outputs suitable for analysis as outlined in Figure 2.
To interpret these data, two techniques were originally trialled: automated analysis of daily profiles, and visual inspection of monthly averages.
The automated analysis required the development and use of algorithms to search for inflexion points in daily temperature charts, and to determine when heating systems began to be used regularly. Visual inspection did the same, but relied upon the interpretation of the data by a team of BRE analysts by examining the charts to identify valid inflections and patterns in average profiles.
Following the initial trials on a sample of data, it became apparent that automated analysis could produce misleading results due to small variations in temperatures (usually resulting from temperature rises due to solar gain or hysteresis of the thermostat) and was also unable to deal successfully with data which showed a weak or inconclusive pattern. The algorithm needs to anticipate the shape and range of heating curves in order to identify them, which can lead to unpredictable results in the case of an unexpected pattern or patterns. These types of techniques have, however, produced data in previous analysis (e.g. Shipworth et. al, 2009) and have the advantage of being readily repeatable and relatively quick to implement.
Averaging and inspecting the data for trends in that the determination of a heating pattern requires a somewhat subjective judgement on behalf of the analyst (even if trained), is not as repeatable as an algorithmic approach and is labour-intensive. However, it also has the significant advantage that each case’s data are actually looked at, checked and considered by an analyst. This procedure is also aligned with both the objectives of the process (i.e. looking for typical use on a monthly basis, to be compared to householders responses, rather than for exceptional use) and is a technique commonly used in other work of this type (e.g. Kane, T et al., 2011).
6
On balance, based on our examination of samples of the data in both its raw and derived forms, and our objectives in using the data, our view was that the averaging and inspection method was preferable. Visual inspection was, therefore, chosen as the mechanism for analysing the data.
A team of BRE analysts were trained in the required tasks, with one team member identified to check a sample of cases regularly to ensure consistency of approaches. The analysis were instructed to identify the on and off times for up to three periods. Heating on and off times were identified for the months of November 2011, December 2011 and January 2012, separately for weekdays (using a daily average profile computed from all the weekday readings in each month) and for weekend days (using a daily average profile computed from all the weekend day readings in each month).
Analysts also had access to the heating patterns reported by the householders during the interview survey to refer to in cases where the heating patterns were unclear. The analysts were instructed that reference to the householder reported information should only made when absolutely necessary, and that only to assist in the interpretation of the temperature data (not be used in place of it). Analysts were also instructed to identify when heating patterns became regular by examining the change in temperature profiles in each month of the year. In the month where a regular pattern became established, analysts identified this as the start of the heating season. Where the regular pattern ceased was the end of the heating season.
Figure 2: Heating pattern variables resulting from the processing of the temperature loggers
Mean temperature at ‘On’ time (mean of all days in month at this time)
Same variables as above for hallway and bedroomWEEKDAY
Nov2011
WEEKDAY Dec2011
Heating Period 1 On/Off times
Same variables as above for Dec 2011 and Jan 2012
WEEKDAY Jan 2012
Living Room
Bedroom
Hallway
Heating Period 2 On/Off times
Heating Period 3 On/Off times
Mean temperature at ‘Off’ time (mean of all days in month at this time)
Variables are repeated for the WEEKEND
Heating Patterns

7
2.2.2 Data quality Determining heating patterns using monitored temperature data of this type is challenging and comes with an associated level of uncertainty. Training of the analytical team and checking procedures to ensure quality were implemented to ensure that the analysis was as objective and consistent as possible. However, in any analysis of this type, where patterns are unclear, analytical judgements need to be made. It is important to recognise the limitations of this analysis when interpreting the results.
Analysts reported that morning start times were clearer to identify because of the drop in temperature overnight. Finishing times were more difficult as temperatures sometimes continued to rise due to solar gains, or fall quite slowly due to high levels of insulation. It was also easier to determine finishing times in houses that cooled quickly. It was further considered that hysteresis of the thermostat could sometimes be mistaken for switching off the heating. Evening timings could also be difficult to determine in some cases. There were cases in which the indoor temperatures continued to rise throughout the day (possibly due to solar gains) but the rate of change increased in the evening which suggested that the heating had been turned on or the thermostat turned up. Evening finishing times were sometimes difficult to determine possibly due to people using manual adjustments when they went to bed. Analysts also reported that houses that were heated to lower temperatures were harder to analyse.
The heating season could also be difficult to identify. In some cases where the house was highly heated the central heating appeared to be on all year. It was also noted that December may well have been influenced by the Christmas holiday period, with households altering their usual patterns at this time.
An indication of the quality of the data was given by the analyst assigning a confidence rating (on a three-point scale) to their results. Lower confidence ratings were assigned when temperature profiles were not clear or consistent. For the sample as a whole, analysts assigned a low confidence rating to 22% of the sample and the highest confidence rating to 30% of the sample.
2.3 Weighting Factors The EFUS data have been scaled up to represent the national population (and to correct for non-response) using weighting factors. The results presented in this report are therefore representative of the English housing stock, with a population of 21.9 million households. For the EFUS Interview Survey, data were weighted back to the population targets for Government Office Region, dwelling type and tenure, using the rim weighting process. For the EFUS temperature logger sub-sample, a weighting factor was derived using logistic regression based on the profile of respondents for the Government Office Region, tenure, dwelling type and working status of household. See the EFUS 2011 Methodology report for full details of the weighting process.
Although the objective of the weighting factor is to provide totals that can be interpreted at the national level, readers should be aware that there may remain some uncorrected bias in the data (e.g. if the households that accepted temperature loggers differ from the population in a way that is not visible to the weighting procedure).
8
2.4 Calculating confidence intervals For the results pertaining to ‘heating season length’, the mean has been used to express central tendency as a histogram of the distribution of this variable showed the data to be normally distributed. However, an initial inspection of the histogram of the ‘number of hours of heating’ derived from the timings given by the householders, showed that the distribution was positively skewed and therefore throughout this report, median values have been used to express central tendency. Median values have also been used to express the central tendency of the metered consumption values as these were also positively skewed. The methods for calculating 95% confidence intervals of a percentage, mean and median values are described in the EFUS 2011 Methodology Report.
The confidence intervals around the statistics derived from the EFUS Interview Survey have been calculated using a design factor of 1.1. For the calculating of confidence intervals using data from the temperature logger sub-sample, a design factor of 1.2 has been used. For the analysis in Section 5 using the Metered Consumption sub-sample, a design factor of 1.1 has been used. Please refer to the EFUS 2011 Methodology report for further details.
For all outputs, results which are based on an unweighted sample size of less than 30 have been highlighted with an asterisk (*) and should be treated as insufficiently robust for further analysis or reporting.

9
3 Findings from the EFUS Interview Survey Approximately 90% of households (equivalent to 19.7 million households) use a central heating system to heat the majority of their home in the winter. The remaining 10% of households have systems that comprise individually controlled heaters in rooms. These are predominantly electric storage heaters (7%), with the remainder being gas or solid fuel fires or electric heaters (see Table 1).
Table 1: Main heating system
Sample size Number of
households (000s)
Percentage of households
(%)
95% C.I. (%)
Central heating 2356 19,691 89.9 (88.7,91.2) Storage radiators 180 1,448 6.6 (5.6,7.7)
Room heaters 80 754 3.4 (2.7,4.2) Total 2616 21,894 100.0 (100,100)
Base: All households in the EFUS Interview Survey (n=2616)
Section 3.1 presents analysis of the heating season data. The majority of households (73%, 16.0 million) heat their homes in a regular manner, that is they turn their heating on and off at set times of the day, although this pattern can change for different days of the week and at weekends. The analysis of how these regular heaters use their heating systems is presented in Section 3.2 for centrally heated households and Section 3.3 for non-centrally heated households. Factors specific to centrally heated homes – controls and boost heating, and thermostat set-points are also present in Section 3.2. The remaining 27% of households do not have set daily patterns for their heating. These households are discussed in more detail in Section 3.4.
For households that heat their homes in a regular manner, the EFUS interview asked householders how many times their heating comes on, on a typical Monday. The times that the heating was turned on and off, for each separate period, were recorded. From these responses, the number of hours for which the heating was on was calculated. A follow-up question asked if these timings changed on any other weekdays and at the weekends. Very few households reported a change in patterns on other weekdays. Only 2% of centrally heated households reporting a regular heating pattern changed the timings on other weekdays. The proportion was 3% for non-centrally heated households. However, 24% of centrally heated households reporting a regular heating pattern changed the timings at weekends, although the proportion was lower for non-centrally heated households at 10%. The analysis presented of the daily/weekly heating patterns is therefore based on the responses for a typical Monday for a weekday with the ‘Weekend’ heating pattern being analysed for centrally heated homes only, due to the small sample size of the non-centrally heated category.
3.1 Heating Season
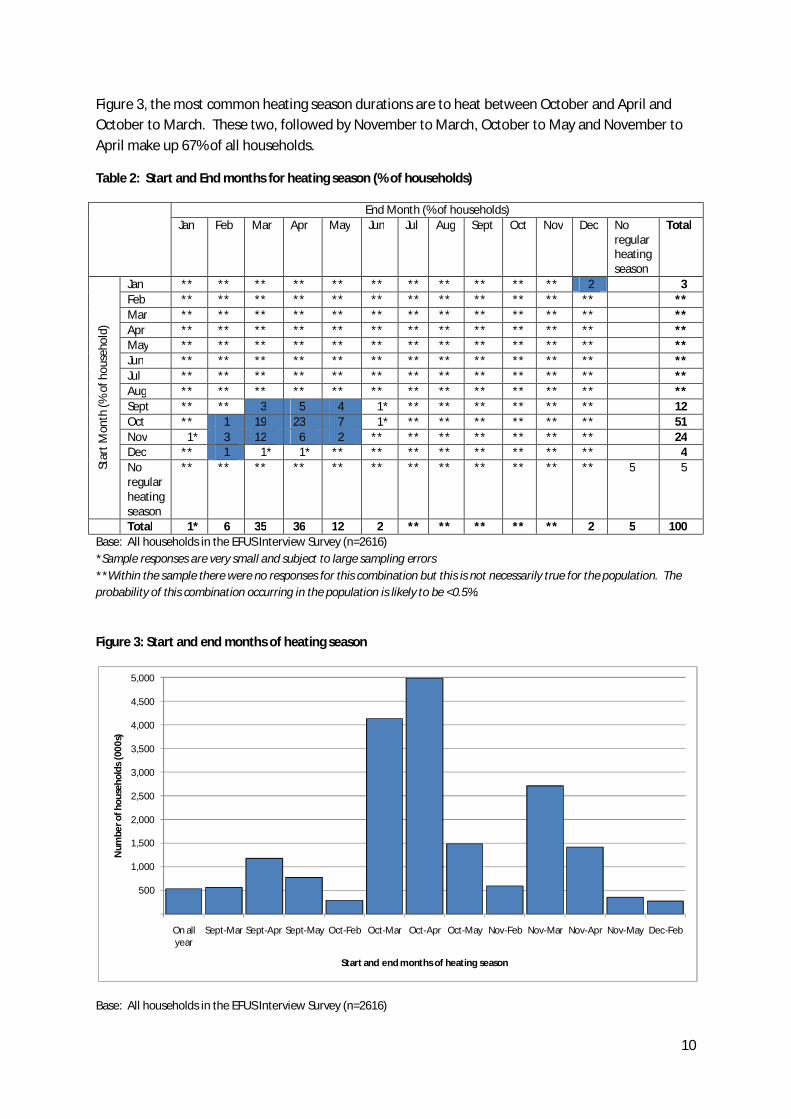
3.1.1 General findings Just over 50% of all households report that, in a typical year, they start heating their home on a regular daily basis in October. Nearly 90% of all households report that their heating season starts during the months of September to November. Around 71% of households finish using their heating system on a daily basis sometime during March or April. As can be seen in Table 2 and
10
Figure 3, the most common heating season durations are to heat between October and April and October to March. These two, followed by November to March, October to May and November to April make up 67% of all households.
Table 2: Start and End months for heating season (% of households)
End Month (% of households) Jan Feb Mar Apr May Jun Jul Aug Sept Oct Nov Dec No
regular heating season
Total
Star
t Mon
th (%
of h
ouse
hold
)
Jan ** ** ** ** ** ** ** ** ** ** ** 2 3 Feb ** ** ** ** ** ** ** ** ** ** ** ** ** Mar ** ** ** ** ** ** ** ** ** ** ** ** ** Apr ** ** ** ** ** ** ** ** ** ** ** ** ** May ** ** ** ** ** ** ** ** ** ** ** ** ** Jun ** ** ** ** ** ** ** ** ** ** ** ** ** Jul ** ** ** ** ** ** ** ** ** ** ** ** ** Aug ** ** ** ** ** ** ** ** ** ** ** ** ** Sept ** ** 3 5 4 1* ** ** ** ** ** ** 12 Oct ** 1 19 23 7 1* ** ** ** ** ** ** 51 Nov 1* 3 12 6 2 ** ** ** ** ** ** ** 24 Dec ** 1 1* 1* ** ** ** ** ** ** ** ** 4 No regular heating season
** ** ** ** ** ** ** ** ** ** ** ** 5 5
Total 1* 6 35 36 12 2 ** ** ** ** ** 2 5 100 Base: All households in the EFUS Interview Survey (n=2616) *Sample responses are very small and subject to large sampling errors **Within the sample there were no responses for this combination but this is not necessarily true for the population. The probability of this combination occurring in the population is likely to be <0.5%.
Figure 3: Start and end months of heating season
Base: All households in the EFUS Interview Survey (n=2616)
500
1,000
1,500
2,000
2,500
3,000
3,500
4,000
4,500
5,000
On all year
Sept-Mar Sept-Apr Sept-May Oct-Feb Oct-Mar Oct-Apr Oct-May Nov-Feb Nov-Mar Nov-Apr Nov-May Dec-Feb
Num
ber o
f hou
seho
lds
(000
s)
Start and end months of heating season

11
The average (mean) length of the heating season is 5.6 months with a reported range of 1 month (<1% of households) to 12 months (2.5% of households)2. The distribution of the length of the heating season is shown in Figure 4.
Figure 4: Distribution of heating season length
Base: All households in the EFUS Interview Survey (n=2616)
3.1.2 Influence of other factors The variations in average heating season length by the characteristics of the dwelling and household have been examined using the EHS data (Table 3). The 95% confidence intervals show the significance of the differences across categories. Detailed descriptions of the variables used or derived from the EHS and EFUS data can be found in the Glossary.
There is no obvious trend to the heating season length by region and the supposition that households in the colder northern regions would keep their heating on for longer does not appear to be confirmed in the data. Heating season lengths do, however, show some variation by dwelling type. Detached houses and bungalows (of all types) show heating season lengths that are significantly longer (at the 95% confidence level) than either flats or mid-terraces. This is likely to reflect a combination of their occupant types but may also reflect the relatively high heat losses from these dwelling types. There are no clear patterns in heating season length by household income, household type or in dwellings of different ages that can be ascertained with confidence.
2 The length of the heating season has been calculated as being from the middle of the reported start month to the middle of the reported end month e.g. if the householder reported that they turned it on in October and off in April then the heating season is 6 months. The uncertainty of this is +/- 1 month as the reality could be that the heating goes on at the beginning of October and off at the end of April, or vice versa.
1,000
2,000
3,000
4,000
5,000
6,000
1-3 months 4 months 5 months 6 months 7-9 months 10-12 months
Num
ber o
f hou
seho
lds
(000
s)

12
Table 3: Differences in the average heating season length between dwelling/household groups
Dwelling characteristic Characteristic category Sample size
Mean heating season length
(months)
95% CI mean heating season length (months)
Dwelling type End terrace 274 5.5 (5.2, 5.7) Mid terrace 478 5.4 (5.2, 5.6) Semi detached 715 5.6 (5.4, 5.7) Detached 419 5.9 (5.7, 6.0) Bungalow 244 6.0 (5.7, 6.2) Flat 486 5.5 (5.2, 5.6)
Dwelling type House or bungalow 2130 5.6 (5.5, 5.7) Flat 486 5.5 (5.2, 5.6)
Dwelling Age Pre 1919 488 5.5 (5.3, 5.6) 1919-1944 423 5.5 (5.3, 5.7) 1945-1964 600 5.5 (5.3, 5.6) 1965-1974 404 5.6 (5.4, 5.7) 1975-1980 185 5.7 (5.4, 5.9) 1981-1990 219 5.7 (5.5, 5.9) Post 1990 297 5.8 (5.5, 6.1)
Useable floor area < 50 m2 313 5.6 (5.3, 5.8) 50 to 69 m2 654 5.4 (5.2, 5.5) 70 to 89 m2 744 5.6 (5.4, 5.6) 90 to 109 m2 344 5.6 (5.4, 5.8) 110 to 139 m2 261 5.8 (5.6, 6.0) ≤140 m2 300 5.9 (5.6, 6.1)
Region - EHS order North East 168 5.6 (5.3, 5.9) North West 419 5.7 (5.5, 5.9) Yorkshire and the Humber
342 5.5 (5.3, 5.7)
East Midlands 216 5.9 (5.6, 6.1) West Midlands 237 5.7 (5.4, 5.9) East 311 5.5 (5.3, 5.7) London 268 5.4 (5.2, 5.6) South East 375 5.6 (5.4, 5.8) South West 280 5.4 (5.2, 5.6)
Urban or rural location? Urban 2356 5.6 (5.5, 5.6) Rural 260 5.9 (5.6, 6.1)
Type of heating system Central Heating 2356 5.6 (5.5, 5.6) Non-Central Heating 260 5.5 (5.2, 5.7)
Main fuel Mains gas 2173 5.6 (5.5, 5.6) Electricity 247 5.5 (5.1, 5.7) Other (bottled/bulk gas,solid,oil,communal)
196 6.0 (5.6, 6.3)
Are the walls of the dwelling insulated?
Insulated 1122 5.7 (5.5, 5.7) Not insulated 1494 5.6 (5.4, 5.6)
Loft insulation <50mm 177 5.6 (5.3, 5.9) 50-149mm 1038 5.6 (5.4, 5.6) 150+ mm 1083 5.7 (5.5, 5.7)
Is dwelling fully double glazed?
Yes 2005 5.6 (5.5, 5.7) No 611 5.6 (5.4, 5.7)
How many insulation measures does the dwelling have?
All 3 insulation measures 397 5.6 (5.3, 5.7) 2 insulation measures 751 5.7 (5.5, 5.8) 1 insulation measure 833 5.6 (5.4, 5.7) No insulation measures 317 5.6 (5.3, 5.7)
Energy efficiency (SAP09) rating
less than 30 83 5.6 (5.1, 6.0) 30 to 50 597 5.5 (5.3, 5.6) 51 to 70 1691 5.7 (5.5, 5.7) more than 70 245 5.5 (5.2, 5.7)
Base: All households in the EFUS Interview Survey (n=2616)

13
A driver for heating season length appeared to be whether there is anyone at home during weekdays. Households where occupants are generally at home on weekdays have a significantly longer (at the 95% confidence level) average heating season that those households who are not. The mean heating season for those at home is 5.8 months, the heating season for those not at home is 5.4 months.
The age of occupants in the dwelling is appears to have an influence on the typical heating season length. Households with at least one person of pensionable age present tend to have a significantly longer heating season length than households with no pensioners present.
There are no clear patterns in heating season length by tenure, household size, if children are present, household income and employment status, and households that are considered to be under-occupied that can be ascertained with confidence.
14
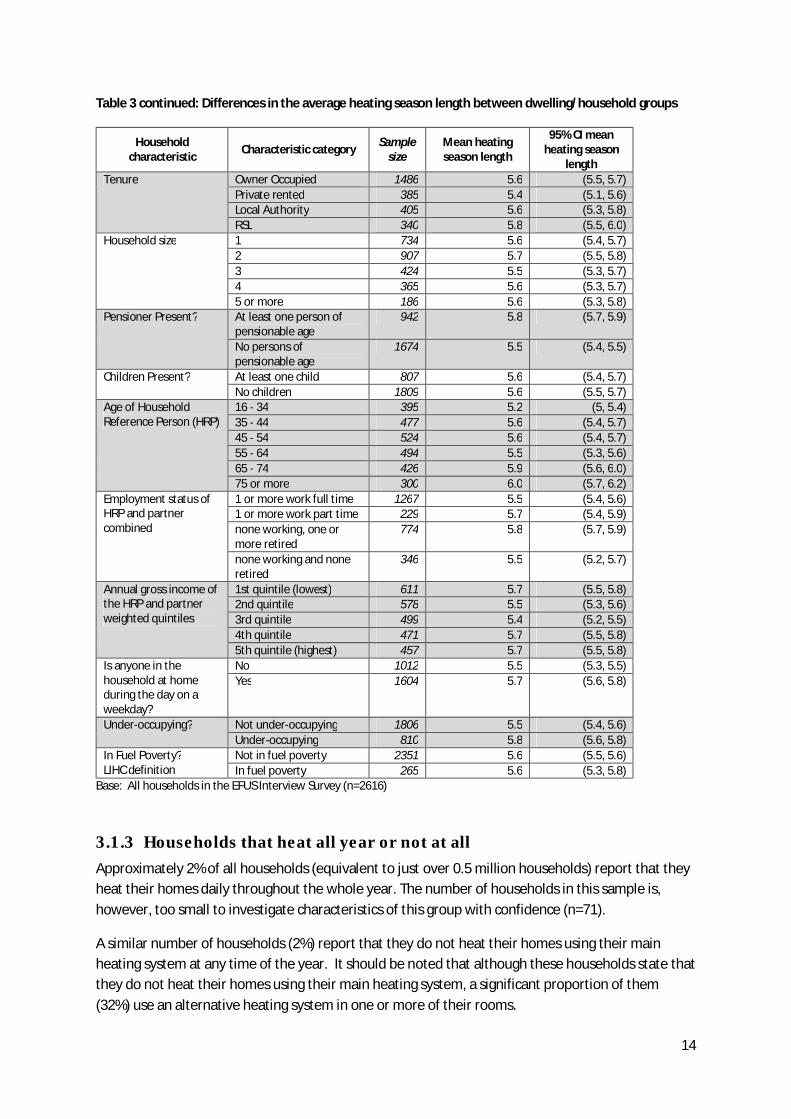
Table 3 continued: Differences in the average heating season length between dwelling/household groups
Household characteristic Characteristic category Sample
size Mean heating season length
95% CI mean heating season
length Tenure Owner Occupied 1486 5.6 (5.5, 5.7)
Private rented 385 5.4 (5.1, 5.6) Local Authority 405 5.6 (5.3, 5.8) RSL 340 5.8 (5.5, 6.0)
Household size 1 734 5.6 (5.4, 5.7) 2 907 5.7 (5.5, 5.8) 3 424 5.5 (5.3, 5.7) 4 365 5.6 (5.3, 5.7) 5 or more 186 5.6 (5.3, 5.8)
Pensioner Present? At least one person of pensionable age
942 5.8 (5.7, 5.9)
No persons of pensionable age
1674 5.5 (5.4, 5.5)
Children Present? At least one child 807 5.6 (5.4, 5.7) No children 1809 5.6 (5.5, 5.7)
Age of Household Reference Person (HRP)
16 - 34 395 5.2 (5, 5.4) 35 - 44 477 5.6 (5.4, 5.7) 45 - 54 524 5.6 (5.4, 5.7) 55 - 64 494 5.5 (5.3, 5.6) 65 - 74 426 5.9 (5.6, 6.0) 75 or more 300 6.0 (5.7, 6.2)
Employment status of HRP and partner combined
1 or more work full time 1267 5.5 (5.4, 5.6) 1 or more work part time 229 5.7 (5.4, 5.9) none working, one or more retired
774 5.8 (5.7, 5.9)
none working and none retired
346 5.5 (5.2, 5.7)
Annual gross income of the HRP and partner weighted quintiles
1st quintile (lowest) 611 5.7 (5.5, 5.8) 2nd quintile 578 5.5 (5.3, 5.6) 3rd quintile 499 5.4 (5.2, 5.5) 4th quintile 471 5.7 (5.5, 5.8) 5th quintile (highest) 457 5.7 (5.5, 5.8)
Is anyone in the household at home during the day on a weekday?
No 1012 5.5 (5.3, 5.5) Yes 1604 5.7 (5.6, 5.8)
Under-occupying? Not under-occupying 1806 5.5 (5.4, 5.6) Under-occupying 810 5.8 (5.6, 5.8)
In Fuel Poverty? LIHC definition
Not in fuel poverty 2351 5.6 (5.5, 5.6) In fuel poverty 265 5.6 (5.3, 5.8)
Base: All households in the EFUS Interview Survey (n=2616)
3.1.3 Households that heat all year or not at all Approximately 2% of all households (equivalent to just over 0.5 million households) report that they heat their homes daily throughout the whole year. The number of households in this sample is, however, too small to investigate characteristics of this group with confidence (n=71).
A similar number of households (2%) report that they do not heat their homes using their main heating system at any time of the year. It should be noted that although these households state that they do not heat their homes using their main heating system, a significant proportion of them (32%) use an alternative heating system in one or more of their rooms.

15
3.2 Households with central heating – systems used in a regular daily manner
3.2.1 Controls Of the households with central heating, approximately 10% do not have a timer with which to control the system. A further 23% have a timer but do not use it to control the system. Of households with central heating that do heat on a regular basis, the majority (83%) use a timer to control their heating system. However, 12% manually control their heating system by other means even though they have a timer present (Table 4).
Table 4: Controls for Central Heating systems
Sample size
ALL HOUSEHOLDS WITH CENTRAL HEATING
REGULAR HEATING NON-REGULAR HEATING
Number of households
(000s)
% of households
Sample size
Number of households
(000s)
% of households
Sample size
Number of households
(000s)
% of households
Central heating not used for regular annual heating
127 945 4.8 N/A N/A N/A 127 945 18.9
Timer that controls system
1414 12,353 62.7 1401 12,252 83.4 13 101* 2.0*
Timer present but heating switched manually when needed
336 2,593 13.2 131 1,012 6.9 205 1,581 31.6
Timer present but heating controlled using thermostat
211 1,685 8.6 85 665 4.5 126 1,020 20.4
Timer present but heating controlled by other means
*22 *171 *0.9 *8 *45 *0.3 *14 *126 *2.5
No controlling timer
239 1,891 9.6 87 686 4.7 152 1,204 24.1
Unknown if timer present
*7 *54 *0.3 *3 *26 *0.2 *4 *28 *0.6
Total 2356 19,691 100.0 1715 14,687 100.0 641 5,005 100.0 Base: All households in the EFUS Interview Survey with central heating (n=2356) *Sample responses are very small and subject to large sampling errors
It is interesting to note that of households using the timer to control a central heating system in a regular manner, nearly 35% report that they manually override the heating system to turn it off when it is timed to be on at least once a week or more.
16
3.2.2 Daily/weekly heating patterns
3.2.2.1 Weekdays
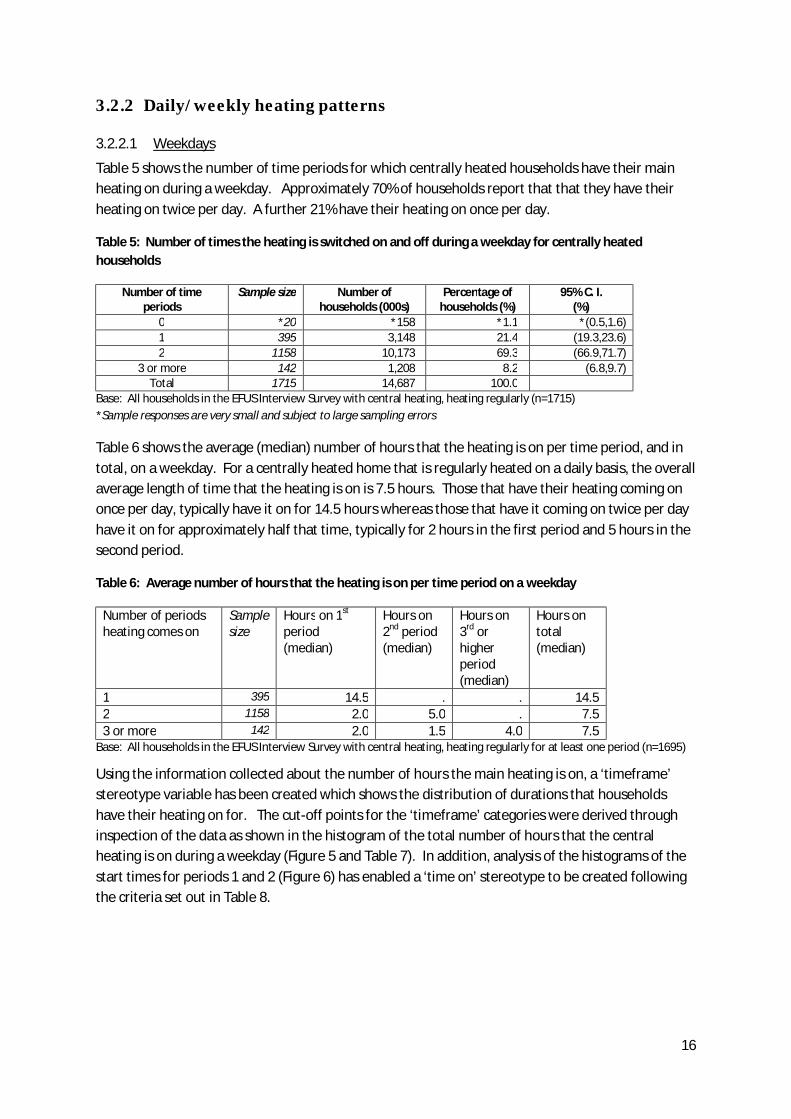
Table 5 shows the number of time periods for which centrally heated households have their main heating on during a weekday. Approximately 70% of households report that that they have their heating on twice per day. A further 21% have their heating on once per day.
Table 5: Number of times the heating is switched on and off during a weekday for centrally heated households
Number of time periods
Sample size Number of households (000s)
Percentage of households (%)
95% C. I. (%)
0 *20 *158 *1.1 *(0.5,1.6) 1 395 3,148 21.4 (19.3,23.6) 2 1158 10,173 69.3 (66.9,71.7)
3 or more 142 1,208 8.2 (6.8,9.7) Total 1715 14,687 100.0
Base: All households in the EFUS Interview Survey with central heating, heating regularly (n=1715) *Sample responses are very small and subject to large sampling errors
Table 6 shows the average (median) number of hours that the heating is on per time period, and in total, on a weekday. For a centrally heated home that is regularly heated on a daily basis, the overall average length of time that the heating is on is 7.5 hours. Those that have their heating coming on once per day, typically have it on for 14.5 hours whereas those that have it coming on twice per day have it on for approximately half that time, typically for 2 hours in the first period and 5 hours in the second period.
Table 6: Average number of hours that the heating is on per time period on a weekday
Number of periods heating comes on
Sample size
Hours on 1st period (median)
Hours on 2nd period (median)
Hours on 3rd or higher period (median)
Hours on total (median)
1 395 14.5 . . 14.5 2 1158 2.0 5.0 . 7.5 3 or more 142 2.0 1.5 4.0 7.5
Base: All households in the EFUS Interview Survey with central heating, heating regularly for at least one period (n=1695)
Using the information collected about the number of hours the main heating is on, a ‘timeframe’ stereotype variable has been created which shows the distribution of durations that households have their heating on for. The cut-off points for the ‘timeframe’ categories were derived through inspection of the data as shown in the histogram of the total number of hours that the central heating is on during a weekday (Figure 5 and Table 7). In addition, analysis of the histograms of the start times for periods 1 and 2 (Figure 6) has enabled a ‘time on’ stereotype to be created following the criteria set out in Table 8.

17
Figure 5: Histogram of the total number of hours that central heating is on, on a weekday
Base: All households in the EFUS Interview Survey with central heating, heating regularly (n=1715)
Table 7: Creation of ‘timeframe’ stereotypes
‘Timeframe’ § <4 hours § 4 to 10 hours § 11 to 16 hours § ≥17 hours

18
Figure 6: Start times that central heating comes on for Periods 1 and 2
Base: All households in the EFUS Interview Survey with central heating, heating regularly (n=1715)
Table 8: Creation of timing stereotypes
‘Time On’ § Wake up (0500-0800) § Daytime (0801-1459) § Home time (1500-1900) § Evening/Night (1901-0459)
The distribution of ‘heating patterns’ for households that have their heating on once per day is shown in Table 9. From these it can be seen that 38% of these households turn their heating on

19
when they wake up and have it on 11-16 hours, a further 16% turn it on in the evening and have it on for 17 or more hours, and a further 15% turn it on at ‘home time’ and have it on 4 to 10 hours.
Table 9: Weekday heating pattern for households heating once daily (%)
TIMEFRAME
<4 hours 4 to 10 hours
11 to 16 hours
(>=17 hours Total
Median number of hours
on
TIM
E O
N
Wake up (0500-0800) 9 3* 38 7 57 15.0 Daytime (0801-1159) 1* 2* 2* 0** 5* 10.0 Home time (1500-1900) 2* 15 1* 1* 20 5.0 Evening/Night (1901-0459) 1* 2* 0* 16 19 24.0 Total 12 23 42 24 100 14.5
Base: All households in the EFUS Interview Survey with central heating, heating once daily (n=395) *Sample responses are very small and subject to large sampling errors ** Within the sample there were no responses for this combination but this is not necessarily true for the population. The probability of this combination occurring in the population is likely to be <0.5%.
For the 69% of households using their heating twice a day, the majority (88%) turn their heating on for a period at ‘wake up time’ followed by a period at ‘home-time’. The ‘wake up’ period is typically for less than 4 hours with an average of 2 hours on. The ‘home time’ period is typically for a period of 4 to 10 hours, averaging 5 hours in duration (Table 10).
Table 10: Heating pattern for households heating twice daily, 1 period at wake-up and 2nd period at home-time (%)
TIMEFRAME
<4 hours 4 to 10 hours
11 to 16 hours
(>=17 hours Total
Median number of hours
on
TIM
E O
N Period 1 Wake up (0500-0900) 91 9 0* 0** 100 2.0
Period 2 Home time (1500-1900) 23 73 1* 3* 100 5.0
Base: All households in the EFUS Interview Survey with central heating, heating twice daily (n=1008) *Sample responses are very small and subject to large sampling errors ** Within the sample there were no responses for this combination but this is not necessarily true for the population. The probability of this combination occurring in the population is likely to be <0.5%.
From the analysis presented above it has been possible to create an ‘overall typical heating pattern’ variable to describe the heating patterns used by the centrally heated households that heat their homes in a regular manner. The results are shown in Table 11. From this it can been seen that the most common heating pattern, describing nearly 40% of centrally heated households heating their homes in a regular manner, is one in which the heating comes on twice daily, first at a ‘wakeup time’ for less than 4 hours and then at ‘home-time’ for between 4 to 10 hours.

20
Table 11: Overall typical heating pattern
Sample size
Number of households (000s)
Percentage of households (%)
Median number of hours on daily
On once daily, on at wake-up for 11-16 hours
147 1,203 8.2 15.0
On once daily, on in evening for >=17 hours
66 497 3.4 24.0
On once daily, on at home-time for 4-10 hours
53 481 3.3 5.0
Other once daily pattern
129 967 6.6 6.0
On twice daily, first period wakeup <4 hours, second period at home-time for <4 hours
240 2,077 14.1 4.3
On twice daily, first period wakeup for <4 hours, second period at home-time for 4-10 hours
639 5,779 39.4 7.5
Other twice daily 279 2,317 15.8 10.0 Other number of periods
162 1,366 9.3 7.5
Total 1715 14,687 100.0 7.5 Base: All households in the EFUS Interview Survey with central heating, heating regularly (n=1715).
3.2.2.2 Weekends
24% of households with central heating state that their heating patterns changes at the weekend compared to the weekdays. From the results shown in Table 12, it can be seen that at weekends there is a small decrease in the proportion of households heating their homes twice daily, and a corresponding increase in the number of households that heat their homes once daily or not at all, compared to the weekdays. The shift in the number of time periods used at weekends compared to weekdays can be investigated more thoroughly using the results presented in Table 13 in which the households for whom the number of periods remains unchanged for weekdays and weekends are highlighted in italics and the largest change is highlighted in bold. Just over 600,000 households (6% of households heating twice daily) changed from a twice-daily heating pattern during the week to a once-daily heating pattern at the weekend. However, even though there is a change in the number of periods that households heat their homes at weekends, the average number of hours that the heating is on per time period remains almost identical to that for weekdays and the overall average total hours for which the heating is on differs by only 0.5 hours, the average being 7.5 hours on a weekday and 8.0 hours on a weekend day (compare Table 14 and Table 6). This is rather different to what is currently assumed in SAP whereby the central heating is assumed to be on for 16 hours at a weekend3.
3 The exception is for central heating systems with time and temperature zone control, for which SAP assumes a heating period of 7 hours for all days.

21
Table 12: Number of times the heating is switched on and off during a weekend
Number of periods heating comes on
Sample size
Number of households (000s)
Weekend % Weekday % for comparison
0 32 233 1.6 1.1* 1 451 3,667 25.0 21.4 2 1074 9,415 64.1 69.3 3 or more 137 1,190 8.1 8.2 Unknown 21 *181 *1.2 Total 1715 14,687 100.0 100.00
Base: All households in the EFUS Interview Survey with central heating, heating regularly (n=1715). *Sample responses are very small and subject to large sampling errors
Table 13: Cross tabulation of the number of times the heating is switched on and off during the weekend, compared to the weekday
Number of times heating on, on a weekend (no. of households, 000s)
Number of times heating on, on a weekday (no. of households, 000s)
0 1 2 3 or more Total Unknown 0** 37* 122* 22* 181* 0 158* 40* 36* 0** 233 1 0** 2,999 605 63* 3,667 2 0** 65* 9,269 81* 9,415 3 or more 0** 7* 141* 1,042 1,190 Total 158* 3,148 10,173 1,208 14,687
Base: All households in the EFUS Interview Survey with central heating, heating regularly (n=1715). *Sample responses are very small and subject to large sampling errors ** Within the sample there were no responses for this combination but this is not necessarily true for the population. The probability of this combination occurring in the population is likely to be <0.5%.
Table 14: Average number of hours that the heating is on per time period on a weekend
Number of periods heating comes on
Sample size
Hours on 1st period (median)
Hours on 2nd period (median)
Hours on 3rd plus period (median)
Hours on total (median)
1 451 14.5 . . 14.5 2 1074 2.0 5.0 . 7.5 3 or more 137 2.0 1.5 4.0 8.0
Base: All households in the EFUS Interview Survey with central heating, heating regularly (n=1715).
For those centrally heated households heating their homes once daily at the weekends, there is a decrease in the proportion turning their heating on at home time for 4-10 hours and a corresponding increase in the proportion turning their heating on in the ‘day time’ time and keeping it on for 11-16 hours compared to the weekday pattern (Table 15, compare to Table 9). For those households that heat their homes twice daily at the weekends, the pattern is almost identical to weekdays.

22
Table 15: Weekend heating pattern for households heating once daily (%)
TIMEFRAME
<4 hours 4 to 10 hours 11 to 16
hours (>=17 hours Total
Median number of hours
on
TIM
E O
N
Wake up (0500-0800) 8 2* 40 7 57 15.0 Daytime (0801-1459) 2* 4* 8 0** 14 12.0 Home time (1500-1900) 1* 9 1* 1* 12 5.0 Evening/Night (1901-0459) 0* 1* 0* 15 17 24.0 Total 12 17 49 22 100 14.5
Base: All households in the EFUS Interview Survey with central heating, heating once daily (n=451). *Sample responses are very small and subject to large sampling errors ** Within the sample there were no responses for this combination but this is not necessarily true for the population. The probability of this combination occurring in the population is likely to be <0.5%.
From the responses given by the householders living in centrally heated homes it can be concluded that on the whole, householders maintain the same heating patterns (in terms of number of hours and timings) at weekends as they use during the week. In fact, if the average number of hours on a weekday and a weekend day that the heating is on, is compared for just those households that change their pattern between weekday and weekends, it is found that the average number of hours on at a weekend is only 1 hour greater than at weekdays (Table 16).
Table 16: Average number of hours heating is on for households that change their pattern at the weekends
Total number of hours on Monday Total number of hours on weekend
Mean 8.0 9.2 Median 7.0 8.0
Base: All households in the EFUS Interview Survey with central heating that change their pattern between weekdays and weekend days (n=380).
3.2.3 Boost heating Of those households with a central heating system controlled by a timer to give a regular heating pattern (equivalent to 12.2 million households), 26% never use the system to give a ‘boost’ of heat. However, almost 18% use a period of boost heating every day and in total just over 60% (7.5 million) of them manually switch on their heating for an additional period of ‘boost’ heating at least once a week (Table 17). Of the 7.5 million households that use some ‘boost’ heating regularly, almost one-quarter (1.8 million) turn it on for regular days of the week and at regular times of the day. The remaining 5.7 million frequent users use their ‘boost’ heating in an ‘ad-hoc’ manner, and, generally, for less than 7 hours per week (see Figure 7).
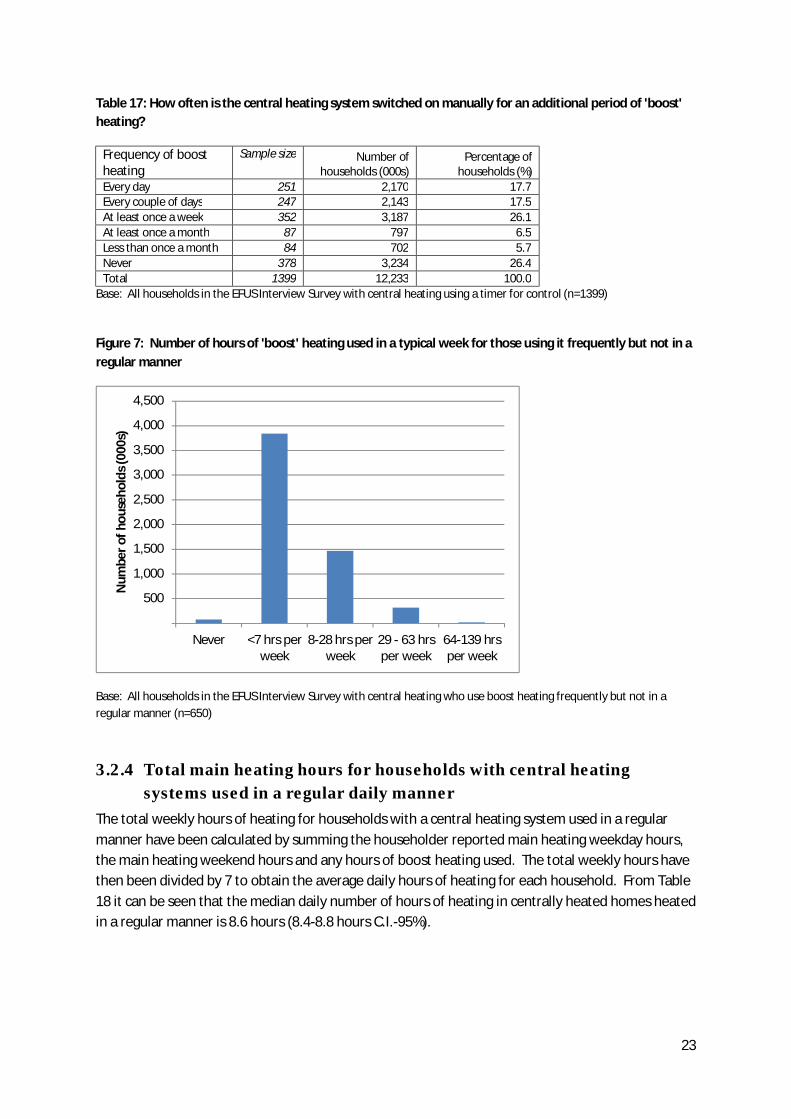
23
Table 17: How often is the central heating system switched on manually for an additional period of 'boost' heating?
Frequency of boost heating
Sample size Number of households (000s)
Percentage of households (%)
Every day 251 2,170 17.7 Every couple of days 247 2,143 17.5 At least once a week 352 3,187 26.1 At least once a month 87 797 6.5 Less than once a month 84 702 5.7 Never 378 3,234 26.4 Total 1399 12,233 100.0
Base: All households in the EFUS Interview Survey with central heating using a timer for control (n=1399)
Figure 7: Number of hours of 'boost' heating used in a typical week for those using it frequently but not in a regular manner
Base: All households in the EFUS Interview Survey with central heating who use boost heating frequently but not in a regular manner (n=650)
3.2.4 Total main heating hours for households with central heating systems used in a regular daily manner
The total weekly hours of heating for households with a central heating system used in a regular manner have been calculated by summing the householder reported main heating weekday hours, the main heating weekend hours and any hours of boost heating used. The total weekly hours have then been divided by 7 to obtain the average daily hours of heating for each household. From Table 18 it can be seen that the median daily number of hours of heating in centrally heated homes heated in a regular manner is 8.6 hours (8.4-8.8 hours C.I.-95%).
500
1,000
1,500
2,000
2,500
3,000
3,500
4,000
4,500
Never <7 hrs perweek
8-28 hrs perweek
29 - 63 hrsper week
64-139 hrsper week
Num
ber o
f hou
seho
lds (
000s
)

24
Table 18: Median number of hours that main heating is on, daily, including boost heating
Sample size Median 95% C.I. median Number of hours that main heating is on, daily, including boost
1715 8.6 (8.4, 8.8)
Base: All households in the EFUS Interview Survey with central heating used in a regular daily manner (n=1715)
3.2.5 The influence of other factors A number of dwelling and household factors derived from the EHS and EFUS have been reviewed to examine whether they have any impact on the total daily number of hours of heating by occupants in centrally heated homes. Table 19 shows the median and 95% confidence intervals of the median number of hours that the main heating is on, on a daily basis, including any boost heating used for the various categories within each dwelling characteristic group. The 95% confidence intervals show the significance of the differences across categories.
By comparing the overlap of the 95% confidence intervals it can be seen that households living in mid terraces heat on average for less time than households living in detached dwellings or bungalows. There is no significant difference in hours of heating between households living in flats as opposed to houses nor are there any significant differences between households living in different ages of dwellings.
There appears to be a relationship between the number of hours of heating and the floor area of dwellings, with households in smaller dwellings heating for less time than those in larger dwellings. However, as can be seen in Figure 8, this relationship does not extend to neither the smallest, nor the largest dwellings and the only statistically significant difference is that households living in dwellings with a floor area between 50-69m2 report using their heating for a shorter time than households living in dwellings with a floor area greater than 110m2. It is likely that there are additional factors influencing the heating patterns in households living in the smallest and largest dwellings and additional analysis would be necessary to investigate this.
There are also some differences in the median hours of heating between households living in different regions. In particular, households living in the East report on average higher daily hours of heating than households living in the North-West, Yorkshire and Humber, East Midlands and the South-West. There is no significant difference in hours of heating between households in rural versus urban areas. None of the factors relating to the fabric energy efficiency of the dwelling e.g. the presence of wall or loft insulation, or double glazing, show any significant differences between the categories.
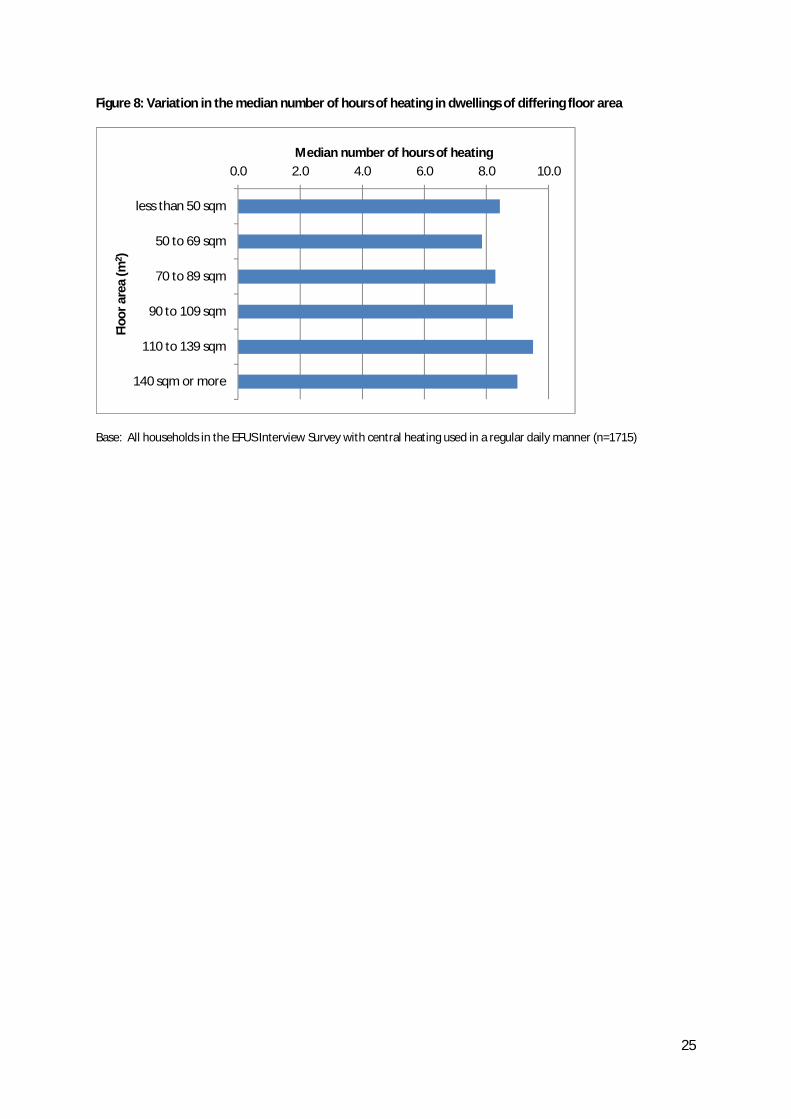
25
Figure 8: Variation in the median number of hours of heating in dwellings of differing floor area
Base: All households in the EFUS Interview Survey with central heating used in a regular daily manner (n=1715)
0.0 2.0 4.0 6.0 8.0 10.0
less than 50 sqm
50 to 69 sqm
70 to 89 sqm
90 to 109 sqm
110 to 139 sqm
140 sqm or more
Median number of hours of heating
Floo
r are
a (m
2 )

26
Table 19: Differences in the median number of hours that main heating is on, daily, including any boost between dwelling groups
Dwelling characteristic Characteristic category Sample
size
Median daily number of hours
(hours) 95% CI (hours)
Dwelling type End terrace 175 8.9 (8.2, 9.7) Mid terrace 312 7.8 (7.3, 8.3) Semi detached 519 8.5 (8.1, 8.9) Detached 351 9.0 (8.5, 9.5) Bungalow 154 9.4 (8.4, 10.4) Flat 204 8.3 (7.5, 9.1)
Dwelling type House or bungalow 1511 8.7 (8.5, 8.9) Flat 204 8.3 (7.5, 9.1)
Dwelling Age Pre 1919 325 8.4 (8, 8.9) 1919-1944 295 8.7 (8.1, 9.2) 1945-1964 382 8.5 (8.1, 8.9) 1965-1974 255 9.0 (8.4, 9.6) 1975-1980 107 8.0 (7.3, 8.7) 1981-1990 143 9.0 (8.2, 9.8) Post 1990 208 8.4 (7.7, 9.1)
Useable floor area < 50 m2 113 8.4 (7.3, 9.6) 50 to 69 m2 392 7.9 (7.4, 8.3) 70 to 89 m2 500 8.3 (7.9, 8.7) 90 to 109 m2 248 8.9 (8.3, 9.4) 110 to 139 m2 213 9.5 (8.8, 10.2) ≤140 m2 249 9.0 (8.4, 9.6)
Region - EHS order North East 105 8.8 (7.7, 9.9) North West 284 8.1 (7.6, 8.7) Yorks. and the Humber 207 8.0 (7.5, 8.5) East Midlands 156 7.5 (6.9, 8.2) West Midlands 152 8.4 (7.7, 9.2) East 193 10.0 (9.1, 10.9) London 172 8.5 (7.8, 9.2) South East 267 9.1 (8.6, 9.6) South West 179 8.1 (7.6, 8.7)
Is dwelling in an urban or rural location?
Urban 1543 8.6 (8.3, 8.8) Rural 172 8.5 (7.9, 9.1)
Type of heating system Central Heating 1715 8.6 (8.4, 8.8) Non-Central Heating N/A N/A N/A
Main fuel Mains gas 1578 8.6 (8.4, 8.8) Electricity 14 7.4 (4.9, 9.9) Other (bottled/bulk gas,solid,oil, communal)
123 8.8 (7.5, 10)
Are the walls of the dwelling insulated?
Insulated 732 8.5 (8.1, 8.9) Not insulated 983 8.6 (8.3, 8.9)
Loft insulation <50mm 108 7.1 (5.9, 8.4) 50-149mm 734 8.7 (8.4, 9) 150+ mm 735 8.8 (8.4, 9.1)
Is dwelling fully double glazed?
Yes 1309 8.5 (8.3, 8.7) No 406 8.9 (8.4, 9.3)
How many insulation measures does the dwelling have?
All 3 insulation measures 272 8.8 (8.1, 9.4) 2 insulation measures 511 8.5 (8.1, 8.9) 1 insulation measure 571 8.5 (8.1, 8.9) No insulation measures 223 8.9 (8.3, 9.5)
Energy efficiency (SAP09) rating
less than 30 24 10.0 (7.3, 12.7) 30 to 50 388 8.5 (8.1, 8.9) 51 to 70 1169 8.6 (8.4, 8.9) more than 70 134 8.0 (7.1, 8.9)
Base: All households in the EFUS Interview Survey with central heating used in a regular daily manner (n=1715)

27
Table 20 shows the median and 95% confidence intervals of the median number of hours that the main heating is on, on a daily basis, including any boost heating used for the various categories within each household characteristic group.
Table 20: Differences in the median number of hours that main heating is on, daily, including any boost between household groups
Household characteristic Characteristic category Sample
size Median (hours)
95% CI (hours)
Tenure Owner Occupied 1125 8.8 (8.5, 9.1) Private rented 215 7.3 (6.7, 7.8) Local Authority 203 8.5 (7.8, 9.2) RSL 172 8.6 (7.8, 9.4)
Household size 1 371 8.5 (8, 9) 2 645 8.7 (8.3, 9.1) 3 296 8.5 (8, 9) 4 273 9.0 (8.5, 9.5) 5 or more 130 8.0 (7.2, 8.8)
Pensioner Present? At least one person of pensionable age
581 10.0 (9.5, 10.5)
No persons of pensionable age 1134 8.0 (7.8, 8.2) Children Present? At least one child 597 8.7 (8.3, 9)
No children 1118 8.5 (8.2, 8.8) Age of HRP 16 - 34 253 7.1 (6.7, 7.6)
35 - 44 332 8.5 (8.1, 8.9) 45 - 54 372 8.1 (7.8, 8.5) 55 - 64 327 9.3 (8.8, 9.8) 65 - 74 262 10.0 (9.3, 10.7) 75 or more 169 10.4 (9.5, 11.3)
Employment status of HRP and partner combined
1 or more work full time 929 8.0 (7.8, 8.2) 1 or more work part time 155 9.0 (8.2, 9.7) none working, one or more retired 466 10.0 (9.4, 10.6) none working and none retired 165 8.5 (7.8, 9.2)
Annual gross income of the HRP and partner weighted quintiles
1st quintile (lowest) 301 9.0 (8.3, 9.7) 2nd quintile 342 8.5 (8, 9) 3rd quintile 330 8.6 (8.1, 9.1) 4th quintile 362 8.6 (8.1, 9.1) 5th quintile (highest) 380 8.5 (8.2, 8.8)
Is anyone in the household at home during the day on a weekday?
No 703 8.0 (7.7, 8.3) Yes 1012 9.4 (9, 9.7)
Under-occupying? Not under-occupying 1115 8.4 (8.1, 8.7) Under-occupying 600 9.0 (8.6, 9.4)
In Fuel Poverty? LIHC definition
Not in fuel poverty 1538 8.6 (8.4, 8.8) In fuel poverty 177 8.5 (7.7, 9.3)
Base: All households in the EFUS Interview Survey with central heating used in a regular daily manner (n=1715)
Owner occupiers report that they use their heating for more hours on a daily basis than households in the private rented sector. The age of householder is also related to the length of time that the heating is on for, with households in which the HRP is 65 years of age or older reporting that they use their heating for longer than households in which the HRP is between 16-54 years of age. This is supported by the finding that households with at least one pensioner present report using more hours of heating than households without any pensioners and that households which are

28
categorised as none working, one or more retired’ report that they heat their homes for longer than households that are categorised as ‘none working and none retired’ and those that are ‘one or more work full-time’. No significant differences in the average daily hours of heating is seen between households of differing number of occupants nor for households with or without children.
We might expect that households that are at home during the day would report using their heating system for longer. This is supported by the data, however the difference in total heating hours between the groups is not as great as might be expected. Figure 9 shows the spread of daily hours that central heating is onsplit by whether the household is in or out during the day. Households that are out during the day show a peak at around seven hours of heating per day; households that are in during the day show a peak at around 10 hours a day and a second smaller peak of households which are heating for around 16 hours. Households that are in during the day on weekdays report heating their homes a median of 9.4 hours per day, compared to households that are out during the day on weekdays reporting heating of 8.0 hours per day. These median values are lower than often assumed values in many energy modelling applications.
Figure 9: The total number of hours that central heating is on, daily, by whether the households is in or out during the day
Base: All households in the EFUS Interview Survey with central heating used in a regular daily manner (n=1715).
Several characteristics show no significant differences between groups. Households across the income quintiles, households that are considered to be under-occupying their home and households which are classified as fuel poor show no significant differences in the reported average hours of heating compared to their counterpart groups.

29
3.3 Households without central heating who use it in a regular daily manner
3.3.1 Daily/weekly heating patterns The analysis carried out for central heating systems has been repeated for those with non-central heating systems. As stated above, this is a relatively small group; only 10% of households (2.2 million households) do not have central heating. The analysis has been carried out for storage heaters only -the small sample size for households with room heaters precludes any further analysis of this group. Approximately 60% of these (1.3 million households) heat their homes in a regular manner. Table 21 shows the number of time periods for which households without central heating have their heating on during a weekday. For households with storage heaters, the majority (82%) report that they have their heating on once per day, for an average of 16 hours. The most typical patterns reported for storage heaters are that the heating is turned on in the evening and is either on for 4-10 hours or is on for 17 hours or more (Table 22). It should also be noted that although the interview question specifically asked households with storage heaters for the times that the system was actually giving out heat, rather than charging up, it seems likely that those households with the systems on for a 4-10 hours in the evening may have been reporting the charging time, as the systems may also be (or be perceived to be) giving out heat during this time. As discussed above there are some inherent problems in asking questions on heating patterns for homes with storage heaters and the data needs to be interpreted in this context. Due to these problems, and the relatively small sample sizes, all data on heating patterns in non-centrally heated dwellings should therefore be interpreted with caution.
Table 21: Number of times the heating is switched on and off during a weekday - non-central heating systems (storage heaters only)
Number of periods
Sample size
STORAGE HEATERS Number of households (000s)
Percentage of households (%)
0 15 109* 11.0* 1 100 808 81.8 2 8 57* 5.8* 3 or more 1 14* 1.4* Total 124 987 100
Base: All households in the EFUS Interview Survey with storage heaters, heating regularly (n=124) *Sample responses are very small and subject to large sampling errors

30
Table 22: Weekday heating pattern for households heating once daily (% of households) – storage heaters
TIMEFRAME
<4 hours 4 to 10 hours
11 to 16 hours
(>=17 hours Total
Median number of hours
on
TIM
E O
N
Wake up (0500-0800) 1* 4* 10* 4* 19* 14.0 Daytime (0801-11459) 1* 0** 5* 2* 8* 13.0 Home time (1500-1900) 1* 1* 0** 0** 2* 5.0 Evening/Night (1901-0459) 3* 27* 0** 42 72 24.0 Total 5* 32 15* 48 100 16.0
Base: All households in the EFUS Interview Survey with storage heating, heating once daily (n=100) *Sample responses are very small and subject to large sampling errors **Within the sample there were no responses for this combination but this is not necessarily true for the population. The probability of this combination occurring in the population is likely to be <0.5%.
Only 10% of households with non-central heating systems changed the timings at the weekends. The small sample size means that it is not possible to do any further analysis on these households.
3.4 Households that do not use their heating in a regular manner Approximately 27% (5.9 million households) do not heat their homes in a regular way, that is to say that they either do not use the heating regularly on a weekly basis or, if they do, they do not use it at regular times on a daily basis. The prevalence of non-regular heating is highest for households with room heaters and lowest for those with central heating (Table 23), however 85% (5.0 million households) of the non-regular heaters have a central heating system.
Table 23: Proportion of heating type used for non-regular heating
Heating system type
Does a household heat their home on a non-regular basis? Yes No
Sample size
Number of households with heating type (000s)
Proportion of heating type (%)
Sample size
Number of households with heating (000s)
Proportion of heating type (%)
Central heating 641 5,005 25 1715 14,687 75 Storage radiators 56 461 32 124 987 68 Room heaters 46 425 56 34 330 44 Total 743 5,891 27 1873 16,003 73
Base: All households in the EFUS Interview Survey (n=2616)
3.4.1 Typical weekly hours of heating for non-regular heaters The typical weekly hours of heating reported by non-regular heaters are shown in Table 24.

31
Table 24: Typical weekly heating pattern for non-regular heaters
Sample size
Number of households (000s)
Percentage of households (%)
Unknown 86 727 12.3 Never 20 171 2.9 <=7 hours per week 68 520 8.8 8-28 hours per week 229 1,732 29.4 29-63 hours per week 155 1,261 21.4 64-139 hours per week 125 1,001 17.0 >=140 hours per week 60 479 8.1 Total 743 5,891 100.0
Base: All households in the EFUS Interview Survey heating in an irregular manner (n=743)
3.4.2 The influence of other factors Analysis of the percentage of households within different dwelling and household characteristic groups heating in a non-regular manner highlights several statistically significant differences4 (Table 25 and Table 26). Households living in detached dwellings are less likely to heat their homes in a non-regular manner compared to any other dwelling type; although, households living in flats are more likely to heat their homes in a non-regular manner compared to all houses. The size of the dwelling also seems to be a determining factor. The likelihood of a household heating in a non-regular manner decreases with increasing floor areas (Figure 10)and households living in the smallest dwellings (<50 m2) and significantly more likely to be heating in a non-regular manner than households living in dwellings 70m2 or larger. There are no significant differences in the percentage of households heating in a non-regular manner in any of the categories relating to the insulation qualities of the dwellings. However, the results in Table 25 provide additional confirmation that the likelihood of a household heating in a non-regular manner is significantly higher for dwellings with room heaters compared to either central heating or storage heaters. Households using electricity as their main heating fuel are also more likely to heat in a non-regular manner compared to households using gas.
4 at the 95% confidence level

32
Table 25: Percentage (and 95% confidence intervals) of households within various dwelling characteristic groups that report using their heating in a non-regular manner
Dwelling characteristic Characteristic category Sample
size
% of characteristic category using non-
regular heating 95% CI
(%) Dwelling type End terrace 274 30 (24.3, 36.3)
Mid terrace 478 29 (24.3, 33.2) Semi detached 715 24 (20.2, 27) Detached 419 13 (9.4, 16.4) Bungalow 244 31 (24.5, 37.2) Flat 486 39 (34.2, 43.7)
Dwelling type House or bungalow 2130 24 (22.1, 26.1) Flat 486 39 (34.2, 43.7)
Dwelling Age Pre 1919 488 27 (22.4, 31) 1919-1944 423 25 (20.6, 29.7) 1945-1964 600 28 (24.3, 32.2) 1965-1974 404 28 (22.9, 32.5) 1975-1980 185 35 (27.1, 42.2) 1981-1990 219 25 (18.5, 31.1) Post 1990 297 23 (18.1, 28.7)
Useable floor area < 50 m2 313 41 (34.8, 46.7) 50 to 69 m2 654 32 (27.6, 35.4) 70 to 89 m2 744 28 (24.1, 31.2) 90 to 109 m2 344 22 (17.2, 26.9) 110 to 139 m2 261 18 (12.8, 23.1) ≤140 m2 300 17 (12.3, 21.7)
Region - EHS order North East 168 34 (26.2, 41.9) North West 419 24 (19.4, 28.4) Yorks. and the Humber 342 32 (26.6, 37.5) East Midlands 216 23 (16.9, 29.3) West Midlands 237 25 (18.5, 30.6) East 311 31 (25.1, 36.4) London 268 31 (24.6, 36.7) South East 375 24 (19.1, 28.6) South West 2356 27 (25.5, 29.4)
Is dwelling in an urban or rural location?
Urban 260 22 (16.4, 27.5) Rural 2356 25 (23.5, 27.3)
Type of heating system Central Heating 180 32 (24.4, 39.4) Non-Central Heating 80 56 (44.4, 68.3)
Main fuel Mains gas 2173 25 (23.3, 27.3) Electricity 247 38 (31.1, 44.4) Other 196 31 (23.8, 38.1)
Are the walls of the dwelling insulated?
Insulated 1122 27 (24.1, 29.9) Not insulated 1494 27 (24.4, 29.3)
Loft insulation <50mm 177 31 (23.6, 38.6) 50-149mm 1038 25 (21.7, 27.5) 150+ mm 1083 24 (21.3, 26.9)
Is dwelling fully double glazed?
Yes 2005 27 (25.1, 29.4) No 611 26 (22.2, 29.8)
How many insulation measures does the dwelling have?
All 3 insulation measures 397 24 (19.4, 28.7) 2 insulation measures 751 24 (21, 27.8) 1 insulation measure 833 27 (23.4, 30) No insulation measures 317 23 (17.7, 27.8)
Energy efficiency (SAP09) rating
less than 30 83 44 (31.8, 55.3) 30 to 50 597 25 (21.5, 29.1) 51 to 70 1691 26 (23.3, 27.9) more than 70 245 34 (27.8, 40.8)
Base: All households in the EFUS Interview Survey (n=2616)

33
Figure 10: Variation in the percentage of households heating in a non-regular manner by floor area
Base: all households in the EFUS Interview Survey (n=2616).
When examining the information on household characteristics (Table 26), it can be seen that owner occupiers are less likely to heat in a non-regular manner than any other tenure group. Households with children present are also less likely to heat in a non-regular manner compared to households without children, as are households that are considered to be under-occupying their dwelling compared to those not. Single person households are more likely to heat in a non-regular manner compared to households with 2, 3 or 4 occupants; as are households with no persons working and none retired compared to the other employment status groups. The likelihood of heating in a non-regular manner decreases with increasing incomes – households in the lowest income quintile are significantly more likely to be non-regular heaters than those in the 4th or 5th income quintiles (Figure 11).
0 10 20 30 40 50
less than 50 sqm
50 to 69 sqm
70 to 89 sqm
90 to 109 sqm
110 to 139 sqm
140 sqm or more
% of group heating their home in a non-regular manner
Floo
r are
a (m
2 )

34
Table 26: Percentage (and 95% confidence intervals) of households within various household characteristic groups that report using their heating in a non-regular manner
Household characteristic Characteristic category
Sample size
% of characteristic category using
non-regular heating 95% CI
Tenure Owner Occupied 1486 21 (19.1, 23.6) Private rented 385 34 (28.7, 39.1) Local Authority 405 43 (37.5, 48.1) RSL 340 37 (31.8, 43.1)
Household size 1 734 36 (32.2, 39.8) 2 907 22 (19.3, 25.3) 3 424 27 (22.3, 31.6) 4 365 21 (16.1, 25.2) 5 or more 186 27 (20.2, 34.2)
Pensioner Present? At least one person of pensionable age
942 29 (25.6, 31.9)
No persons of pensionable age
1674 26 (23.7, 28.3)
Children Present? At least one child 807 22 (18.8, 25.1) No children 1809 29 (26.8, 31.4)
Age of HRP 16 - 34 395 29 (24.3, 34.1) 35 - 44 477 25 (20.7, 29.2) 45 - 54 524 23 (18.6, 26.5) 55 - 64 494 27 (23, 31.7) 65 - 74 426 30 (24.9, 34.5) 75 or more 300 31 (25.1, 36.6)
Employment status of HRP and partner combined
1 or more work full time 1267 22 (20, 25) 1 or more work part time 229 27 (20.4, 33) none working, one or more retired
774 30 (26.6, 33.7)
none working and none retired
346 41 (35.4, 46.8)
Annual gross income of the HRP and partner weighted quintiles
1st quintile (lowest) 611 37 (32.5, 40.9) 2nd quintile 578 34 (30, 38.5) 3rd quintile 499 29 (24.9, 33.7) 4th quintile 471 18 (14.2, 21.9) 5th quintile (highest) 457 16 (12.6, 20.1)
Is anyone in the household at home during the day on a weekday?
No 1012 25 (21.6, 27.5) Yes 1604 29 (26.3, 31.1)
Under-occupying? Not under-occupying 1806 30 (27.2, 31.8) Under-occupying 810 22 (18.4, 24.6)
In Fuel Poverty? LIHC definition
Not in fuel poverty 2351 26 (24.4, 28.3) In fuel poverty 265 32 (26, 38.3)
Base: all households in the EFUS Interview Survey (n=2616).

35
Figure 11: Variation in the percentage of households heating in a non-regular manner by income quintile
Base: All households in the EFUS Interview Survey heating in an irregular manner (n=743)
3.5 Thermostat settings in centrally heated households Almost three-quarters of households (73%; 14.4 million households) living in a centrally heated dwelling have a working thermostat on the wall. Of these, the normal thermostat set point was reported for 95% of households. The average temperature to which the thermostat is reportedly set is 20°C, with the minimum reported being 8°C and the maximum 35°C. The distribution of thermostat set-points is shown in Figure 12, and statistics relevant to this variable are shown in Table 27. Although there are some apparent outliers in the data (see at the tail ends of the histogram), the 5% trimmed mean suggests that these values do not influence the data considerably. The interquartile range shows that 50% of households report that their thermostats are set to a temperature of between 18°C and 21°C. Shipworth et al, 2009 reported similar results: a mean temperature of 19°C and a median of 20°C reported by 164 respondents, with a standard deviation of 3°C.
0 5 10 15 20 25 30 35 40
1st quintile (lowest)
2nd quintile
3rd quintile
4th quintile
5th quintile (highest)
% of group heating their home in a non-regular manner
Inco
me
quin
tile

36
Figure 12: Reported thermostat set-points for centrally heated dwellings
Base: All households in the EFUS Interview Survey with central heating, with a thermostat (n=1763)
Table 27: Descriptive statistics for the variable 'What temperature is the thermostat set to?' NB all based on weighted sample.
Descriptive Statistics What temperature is the thermostat set to (°C)
Mean 20.1 95% confidence interval for mean: Lower Bound 20.1 95% confidence interval for mean: Upper Bound 20.1 5% Trimmed Mean* 19.9 Median 20.0 Std. Deviation 3.3 25 Percentile 18.0 50 Percentile 20.0 75 Percentile 21.0
Base: All households in the EFUS Interview Survey with central heating with a thermostat (n=1763) * this is the new mean value when the top and bottom 5 percent of cases are removed. It gives an idea of how much influence the outliers have, in this case the values are similar enough for the outliers to remain in the data file.
3.6 Extent of main heating use Almost 35% of all households (7.6 million households) report that they use their main heating system to heat all the rooms in their home. The remaining 65% of households (14.3 million households) have one or more rooms that are not heated by the main heating system. Using the information obtained during the EFUS interview survey about the total number of rooms in the household, the proportion of rooms not heated by the main heating system in each household has been calculated5 and the results for all households are shown in Figure 13. The majority of 5 Note that this is the proportion of rooms, with all rooms counted separately, not proportion of area. Whilst it would have been more accurate to account for the size of each room, this was not possible with the data available.
500
1,000
1,500
2,000
2,500
3,000
3,500
4,000
8 10 12 13 14 15 16 17 18 19 20 21 22 23 24 25 26 27 28 29 30 35
Num
ber o
f hou
seho
lds
(000
s)
Thermostat set point (degrees C)
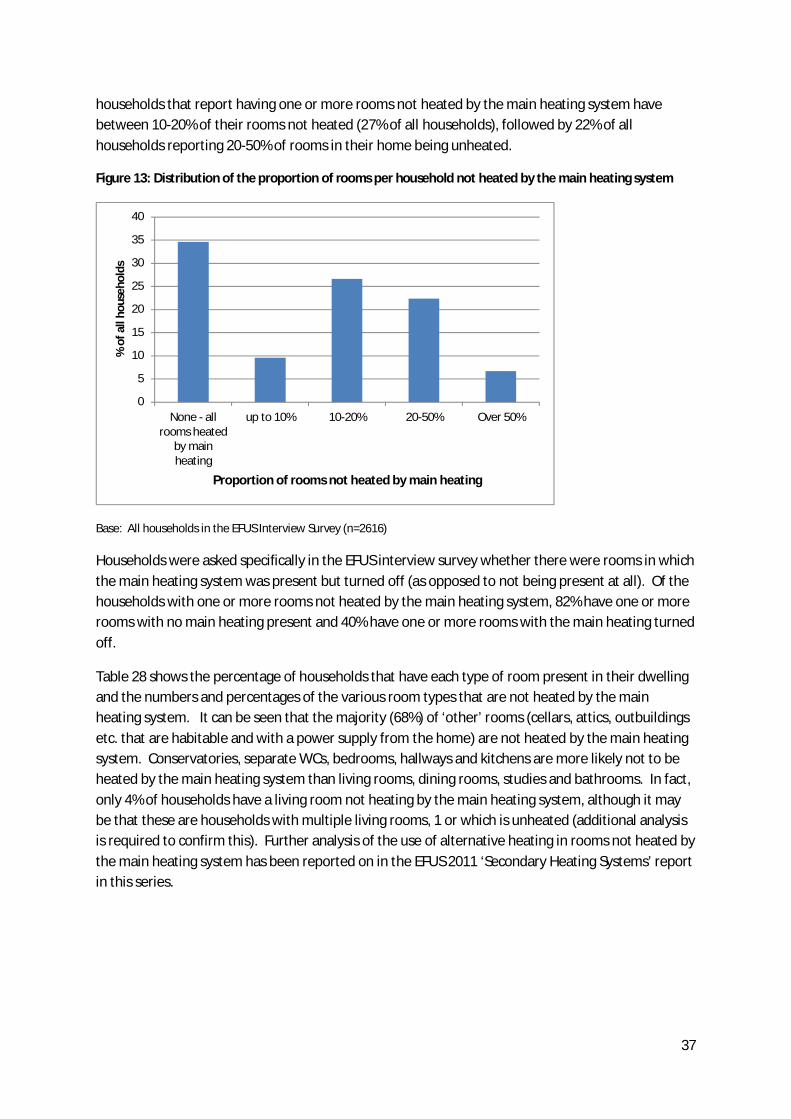
37
households that report having one or more rooms not heated by the main heating system have between 10-20% of their rooms not heated (27% of all households), followed by 22% of all households reporting 20-50% of rooms in their home being unheated.
Figure 13: Distribution of the proportion of rooms per household not heated by the main heating system
Base: All households in the EFUS Interview Survey (n=2616)
Households were asked specifically in the EFUS interview survey whether there were rooms in which the main heating system was present but turned off (as opposed to not being present at all). Of the households with one or more rooms not heated by the main heating system, 82% have one or more rooms with no main heating present and 40% have one or more rooms with the main heating turned off.
Table 28 shows the percentage of households that have each type of room present in their dwelling and the numbers and percentages of the various room types that are not heated by the main heating system. It can be seen that the majority (68%) of ‘other’ rooms (cellars, attics, outbuildings etc. that are habitable and with a power supply from the home) are not heated by the main heating system. Conservatories, separate WCs, bedrooms, hallways and kitchens are more likely not to be heated by the main heating system than living rooms, dining rooms, studies and bathrooms. In fact, only 4% of households have a living room not heating by the main heating system, although it may be that these are households with multiple living rooms, 1 or which is unheated (additional analysis is required to confirm this). Further analysis of the use of alternative heating in rooms not heated by the main heating system has been reported on in the EFUS 2011 ‘Secondary Heating Systems’ report in this series.
0
5
10
15
20
25
30
35
40
None - allrooms heated
by mainheating
up to 10% 10-20% 20-50% Over 50%
% o
f all
hous
ehol
ds
Proportion of rooms not heated by main heating
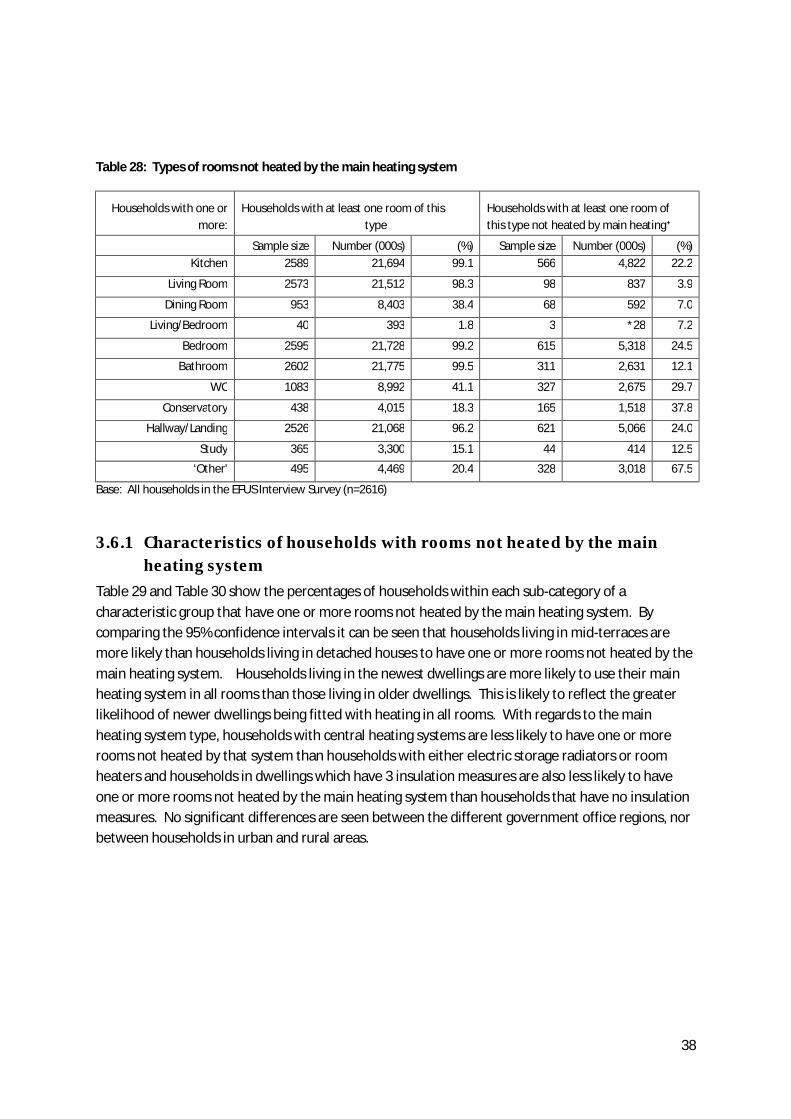
38
Table 28: Types of rooms not heated by the main heating system
Households with one or more:
Households with at least one room of this type
Households with at least one room of this type not heated by main heating⁺
Sample size Number (000s) (%) Sample size Number (000s) (%) Kitchen 2589 21,694 99.1 566 4,822 22.2
Living Room 2573 21,512 98.3 98 837 3.9
Dining Room 953 8,403 38.4 68 592 7.0
Living/Bedroom 40 393 1.8 3 *28 7.2
Bedroom 2595 21,728 99.2 615 5,318 24.5
Bathroom 2602 21,775 99.5 311 2,631 12.1
WC 1083 8,992 41.1 327 2,675 29.7
Conservatory 438 4,015 18.3 165 1,518 37.8
Hallway/Landing 2526 21,068 96.2 621 5,066 24.0
Study 365 3,300 15.1 44 414 12.5
‘Other' 495 4,469 20.4 328 3,018 67.5
Base: All households in the EFUS Interview Survey (n=2616)
3.6.1 Characteristics of households with rooms not heated by the main heating system
Table 29 and Table 30 show the percentages of households within each sub-category of a characteristic group that have one or more rooms not heated by the main heating system. By comparing the 95% confidence intervals it can be seen that households living in mid-terraces are more likely than households living in detached houses to have one or more rooms not heated by the main heating system. Households living in the newest dwellings are more likely to use their main heating system in all rooms than those living in older dwellings. This is likely to reflect the greater likelihood of newer dwellings being fitted with heating in all rooms. With regards to the main heating system type, households with central heating systems are less likely to have one or more rooms not heated by that system than households with either electric storage radiators or room heaters and households in dwellings which have 3 insulation measures are also less likely to have one or more rooms not heated by the main heating system than households that have no insulation measures. No significant differences are seen between the different government office regions, nor between households in urban and rural areas.

39
Table 29: Percentage (and 95% confidence intervals) of households within various dwelling characteristic groups that have one or more rooms not heated by the main heating system
Dwelling characteristic Characteristic category Sample size
% of characteristic
category with 1 or more rooms not heated by main heating
system
95% CI (%)
Dwelling type End terrace 274 63 (56, 69) Mid terrace 478 71 (67, 76) Semi detached 715 70 (66, 73) Detached 419 60 (55, 65) Bungalow 244 60 (53, 67) Flat 486 62 (57, 67)
Dwelling type House or bungalow 2130 66 (64, 68) Flat 486 62 (57, 67)
Dwelling Age Pre 1919 488 67 (63, 72) 1919-1944 423 66 (61, 71) 1945-1964 600 69 (65, 73) 1965-1974 404 67 (62, 72) 1975-1980 185 67 (59, 74) 1981-1990 219 62 (55, 69) Post 1990 297 55 (49, 61)
Useable floor area < 50 m2 313 65 (59, 70) 50 to 69 m2 654 63 (59, 67) 70 to 89 m2 744 67 (63, 70) 90 to 109 m2 344 67 (62, 73) 110 to 139 m2 261 64 (57, 70) ≤140 m2 300 68 (62, 74)
Region - EHS order North East 168 67 (59, 75) North West 419 66 (61, 71) Yorks. and the Humber 342 63 (58, 69) East Midlands 216 57 (50, 65) West Midlands 237 72 (65, 78) East 311 65 (59, 71) London 268 62 (55, 68) South East 375 66 (60, 71) South West 2356 65 (63, 67)
Is dwelling in an urban or rural location?
Urban 260 68 (62, 74) Rural 2356 63 (61, 65)
Type of heating system Central Heating 180 88 (83, 94) Non-Central Heating 80 90 (83, 98)
Main fuel Mains gas 2173 63 (60, 65) Electricity 247 87 (82, 91) Other (bottled/bulk gas,solid,oil,community scheme
196 69 (62, 76)
Are the walls of the dwelling insulated?
Insulated 1122 65 (61, 68) Not insulated 1494 66 (63, 69)
Loft insulation <50mm 177 72 (64, 79) 50-149mm 1038 69 (66, 72) 150+ mm 1083 62 (59, 66)
Is dwelling fully double glazed?
Yes 2005 64 (62, 66) No 611 70 (66, 74)
How many insulation measures does the dwelling have?
All 3 insulation measures 397 59 (54, 64) 2 insulation measures 751 65 (62, 69) 1 insulation measure 833 68 (64, 71) No insulation measures 317 71 (66, 77)

40
Energy efficiency (SAP09) rating
less than 30 83 82 (73, 91) 30 to 50 597 70 (66, 74) 51 to 70 1691 64 (61, 66) more than 70 245 58 (51, 65)
Base: All households in the EFUS Interview Survey (n=2616)
With regard to the characteristics of the households living in the dwellings, no significant differences are seen between the categories of any of the characteristic groups except for fuel poverty status; households that are calculated to be fuel poor are more likely to have one or more rooms not heated by the main heating system compared to those households that are not fuel poor.
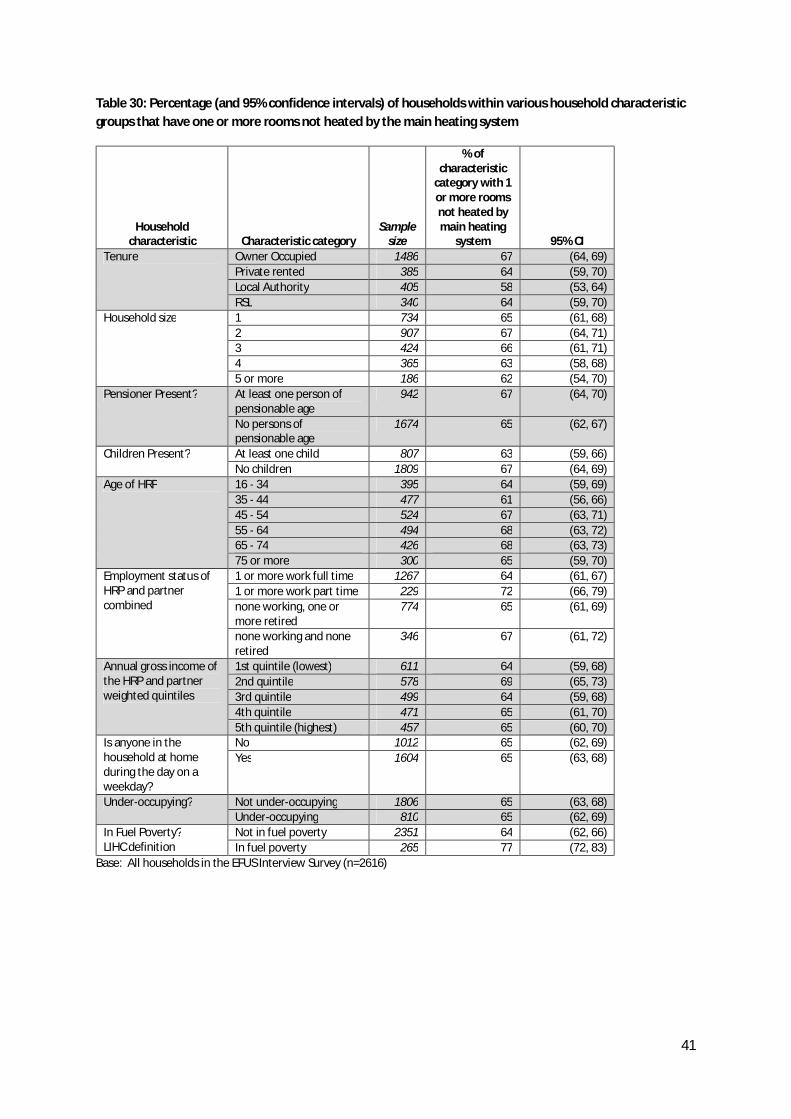
41
Table 30: Percentage (and 95% confidence intervals) of households within various household characteristic groups that have one or more rooms not heated by the main heating system
Household characteristic Characteristic category
Sample size
% of characteristic
category with 1 or more rooms not heated by main heating
system 95% CI Tenure Owner Occupied 1486 67 (64, 69)
Private rented 385 64 (59, 70) Local Authority 405 58 (53, 64) RSL 340 64 (59, 70)
Household size 1 734 65 (61, 68) 2 907 67 (64, 71) 3 424 66 (61, 71) 4 365 63 (58, 68) 5 or more 186 62 (54, 70)
Pensioner Present? At least one person of pensionable age
942 67 (64, 70)
No persons of pensionable age
1674 65 (62, 67)
Children Present? At least one child 807 63 (59, 66) No children 1809 67 (64, 69)
Age of HRP 16 - 34 395 64 (59, 69) 35 - 44 477 61 (56, 66) 45 - 54 524 67 (63, 71) 55 - 64 494 68 (63, 72) 65 - 74 426 68 (63, 73) 75 or more 300 65 (59, 70)
Employment status of HRP and partner combined
1 or more work full time 1267 64 (61, 67) 1 or more work part time 229 72 (66, 79) none working, one or more retired
774 65 (61, 69)
none working and none retired
346 67 (61, 72)
Annual gross income of the HRP and partner weighted quintiles
1st quintile (lowest) 611 64 (59, 68) 2nd quintile 578 69 (65, 73) 3rd quintile 499 64 (59, 68) 4th quintile 471 65 (61, 70) 5th quintile (highest) 457 65 (60, 70)
Is anyone in the household at home during the day on a weekday?
No 1012 65 (62, 69) Yes 1604 65 (63, 68)
Under-occupying? Not under-occupying 1806 65 (63, 68) Under-occupying 810 65 (62, 69)
In Fuel Poverty? LIHC definition
Not in fuel poverty 2351 64 (62, 66) In fuel poverty 265 77 (72, 83)
Base: All households in the EFUS Interview Survey (n=2616)

42
4 Findings from the EFUS Temperature logger data The temperature survey collected data on room temperatures, which could then be used to inform assumptions on mean room temperatures for comparison with the SAP and BREDEM models (see EFUS 2011 Mean Household Temperatures report). The derivation of heating patterns from the temperature profiles was a secondary objective, done to provide some validation for the self-reported heating patterns information. The methodology for this process is described in the methodology section above, and in the EFUS 2011 Methodology report.
4.1 Heating Season Analysis of the temperature data shows that just under half of all households start heating their homes in October, with just over 85% of households starting their heating season within the 3 month period of September to November (Table 31). Almost half of all households finish heating their home in March and almost a quarter more finish heating their homes in April.
Table 31: Start and end months for heating as determined by the temperature data (% of households)
Heating season start month (% of households excluding unknowns)
Heating season end month (% of households excluding unknowns)
January 8.6 0* February 0* 8.5 March ** 47.6 April 0* 23.6 May ** 9.9 June ** 2* July ** 0* August 0* ** September 14.3 0* October 45.2 ** November 26.7 ** December 4* 7.7
Base: All dwellings in EFUS 2011 temperature sample (not including unknown values) (n=747) *sample responses are very small and subject to large sampling errors ** Within the sample there were no responses for this combination but this is not necessarily true for the population. The probability of this combination occurring in the population is likely to be <0.5%.
As can be seen in Table 32, the most common heating season duration accounting for almost one quarter of all households is to heat between October and March. Analysis of the temperature data also suggests that approximately 8% of households have their heating on all year round (these are shown in Table 31 as starting in January and ending in December).

43
Table 32: Heating season start and end months as determined from the temperature data
End Month (% of households) Jan Feb Mar Apr May Jun Jul Aug Sept Oct Nov Dec Total
Star
t Mon
th (%
of h
ouse
hold
)
Jan ** 0* 0* 0* ** ** ** ** ** ** ** 8 9 Feb ** ** ** 0* ** ** ** ** ** ** ** ** 0* Mar ** ** ** ** ** ** ** ** ** ** ** ** ** Apr ** ** ** ** ** ** ** ** 0* ** ** ** 0* May ** ** ** ** ** ** ** ** ** ** ** ** ** Jun ** ** ** ** ** ** ** ** ** ** ** ** ** Jul ** ** ** ** ** ** ** ** ** ** ** ** ** Aug ** ** ** 0* 0* 0* ** ** ** ** ** ** 0* Sept ** 1* 4* 5 4 1* ** ** ** ** ** ** 14 Oct 0* 2* 24 14 4* 1* 0* ** ** ** ** ** 45 Nov 0* 4 17 4 1* 0* ** ** ** ** ** ** 27 Dec ** 2* 2* 1* 0* ** ** ** ** ** ** ** 4* Total 0* 9 48 24 10 2* 0* ** 0* ** ** 8 100
Base: All dwellings in EFUS 2011 temperature sample (not including unknown values)(n=747) *sample responses are very small and subject to large sampling errors ** Within the sample there were no responses for this combination but this is not necessarily true for the population. The probability of this combination occurring in the population is likely to be <0.5%.
The average (mean) length of the heating season as determined from the temperature data is 5.7 months. Almost 27% of households (5.8 million) have their heating on for 5 months and a further 24% of households (5.2 million) have their heating on for 6 months (Figure 14). It should be noted that the identification of the start/end of the heating season from the temperature data was one of the more difficult aspects of the analysis. This was due to the difficulty of identifying the shoulder months of the heating season, perhaps because of the heating starting midway through a month or being used on isolated colder days before being put on every day.
Figure 14: Distribution of heating season length
Base: All dwellings in EFUS 2011 temperature sample (not including unknown values) (n=747)
1,000
2,000
3,000
4,000
5,000
6,000
1-3 months 4 months 5 months 6 months 7-9 months 10-12 months
Num
ber o
f hou
seho
lds
(000
s)
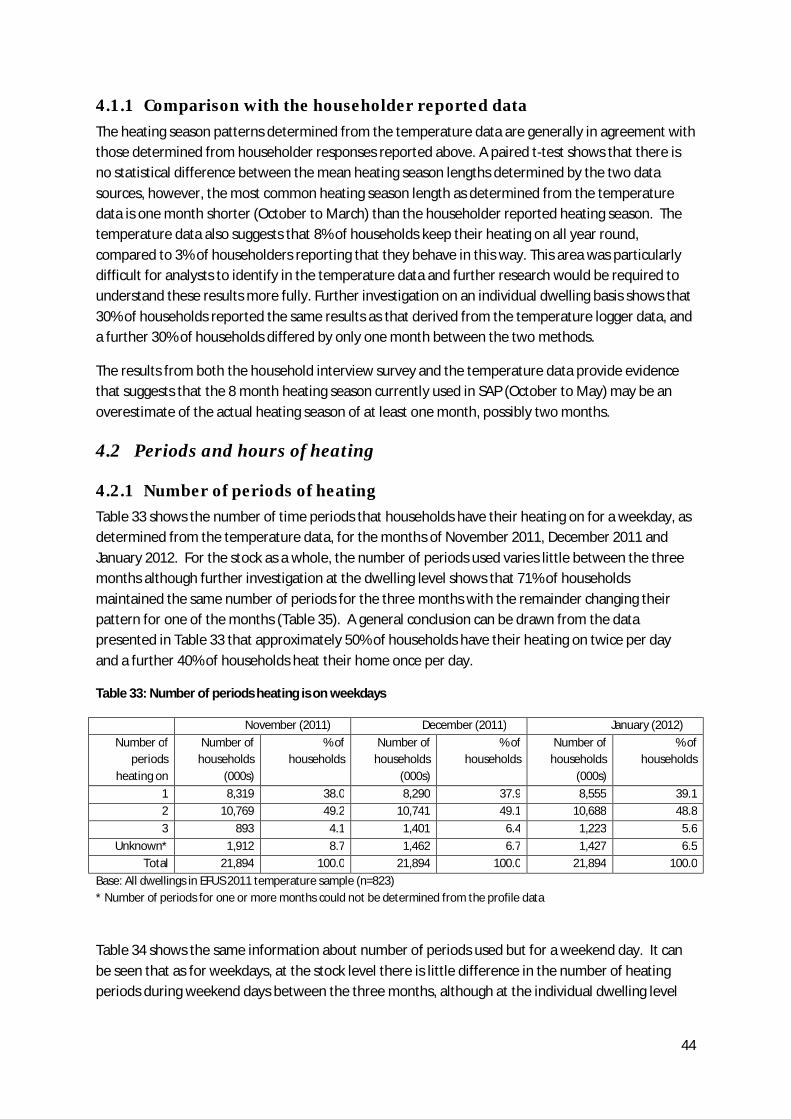
44
4.1.1 Comparison with the householder reported data The heating season patterns determined from the temperature data are generally in agreement with those determined from householder responses reported above. A paired t-test shows that there is no statistical difference between the mean heating season lengths determined by the two data sources, however, the most common heating season length as determined from the temperature data is one month shorter (October to March) than the householder reported heating season. The temperature data also suggests that 8% of households keep their heating on all year round, compared to 3% of householders reporting that they behave in this way. This area was particularly difficult for analysts to identify in the temperature data and further research would be required to understand these results more fully. Further investigation on an individual dwelling basis shows that 30% of households reported the same results as that derived from the temperature logger data, and a further 30% of households differed by only one month between the two methods.
The results from both the household interview survey and the temperature data provide evidence that suggests that the 8 month heating season currently used in SAP (October to May) may be an overestimate of the actual heating season of at least one month, possibly two months.
4.2 Periods and hours of heating
4.2.1 Number of periods of heating Table 33 shows the number of time periods that households have their heating on for a weekday, as determined from the temperature data, for the months of November 2011, December 2011 and January 2012. For the stock as a whole, the number of periods used varies little between the three months although further investigation at the dwelling level shows that 71% of households maintained the same number of periods for the three months with the remainder changing their pattern for one of the months (Table 35). A general conclusion can be drawn from the data presented in Table 33 that approximately 50% of households have their heating on twice per day and a further 40% of households heat their home once per day.
Table 33: Number of periods heating is on weekdays
November (2011) December (2011) January (2012) Number of
periods heating on
Number of households
(000s)
% of households
Number of households
(000s)
% of households
Number of households
(000s)
% of households
1 8,319 38.0 8,290 37.9 8,555 39.1 2 10,769 49.2 10,741 49.1 10,688 48.8 3 893 4.1 1,401 6.4 1,223 5.6
Unknown* 1,912 8.7 1,462 6.7 1,427 6.5 Total 21,894 100.0 21,894 100.0 21,894 100.0
Base: All dwellings in EFUS 2011 temperature sample (n=823) * Number of periods for one or more months could not be determined from the profile data
Table 34 shows the same information about number of periods used but for a weekend day. It can be seen that as for weekdays, at the stock level there is little difference in the number of heating periods during weekend days between the three months, although at the individual dwelling level

45
almost 25% of households change the number of heating periods used on a weekend day for at least one of the months (Table 35).
Table 34: Number of periods heating is on weekend days
November (2011) December (2011) January (2012) Number of
periods heating on
Number of households
(000s)
% of households
Number of households
(000s)
% of households
Number of households
(000s)
% of households
1 9,175 41.9 9,473 43.3 9,330 42.6 2 9,408 43.0 9,213 42.1 9,430 43.1 3 1,292 5.9 1,410 6.4 1,337 6.1
Unknown* 2,019 9.2 1,798 8.2 1,797 8.2 Total 21,894 100.0 21,894 100.0 21,894 100.0
Base: All dwellings in EFUS 2011 temperature sample (n=823) * Number of periods for one or more months could not be determined from the profile data Table 35: Variation in number of heating periods used on a weekday, and a weekend day, for the months of November 2011, December 2011 and January 2012
WEEKDAY WEEKEND DAY Number of
households (000s)
% of households
Number of households (000s)
% of households
All months have same number of heating periods
15,593 71.2 13,952 63.7
One month has different number to other 2
3,912 17.9 5,151 23.5
All 3 months have differing number of heating periods
97* 0.4* 233 1.1
Unknown** 2,291 10.5 2,557 11.7 Total 21,894 100.0 21,894 100.0 Base: All dwellings in EFUS 2011 temperature sample (n=823) *Sample responses are very small and subject to large sampling errors **Number of periods for one or more months could not be determined from the profile data
Comparing a weekday to a weekend day, at the stock level, a smaller proportion of households heat twice per day on a weekend day. At the individual dwelling level, just over half (56%) of all households maintain the same number of heating periods for weekdays and weekend days, for all three months. 7% of households change the number of periods that they use their heating on a weekday, compared to a weekend day, for all three months and the remaining households change their number of periods between weekdays and weekend days for one or two of the months only.
4.2.2 Number of periods of heating – centrally heated homes and non-centrally heated homes
A closer look at how the number of heating periods varies between households with central heating systems and non-central heating systems (Figure 15) shows that, taking January 2012 to be representative of a winter month, the majority of households with central heating systems have their heating on for two periods (52%) with a further 37% having the heating on once per day. For non-centrally heated households, the majority (56%) have their heating on once per day with only 14% of households have their heating on twice per day. It is also apparent from Figure 15 that the
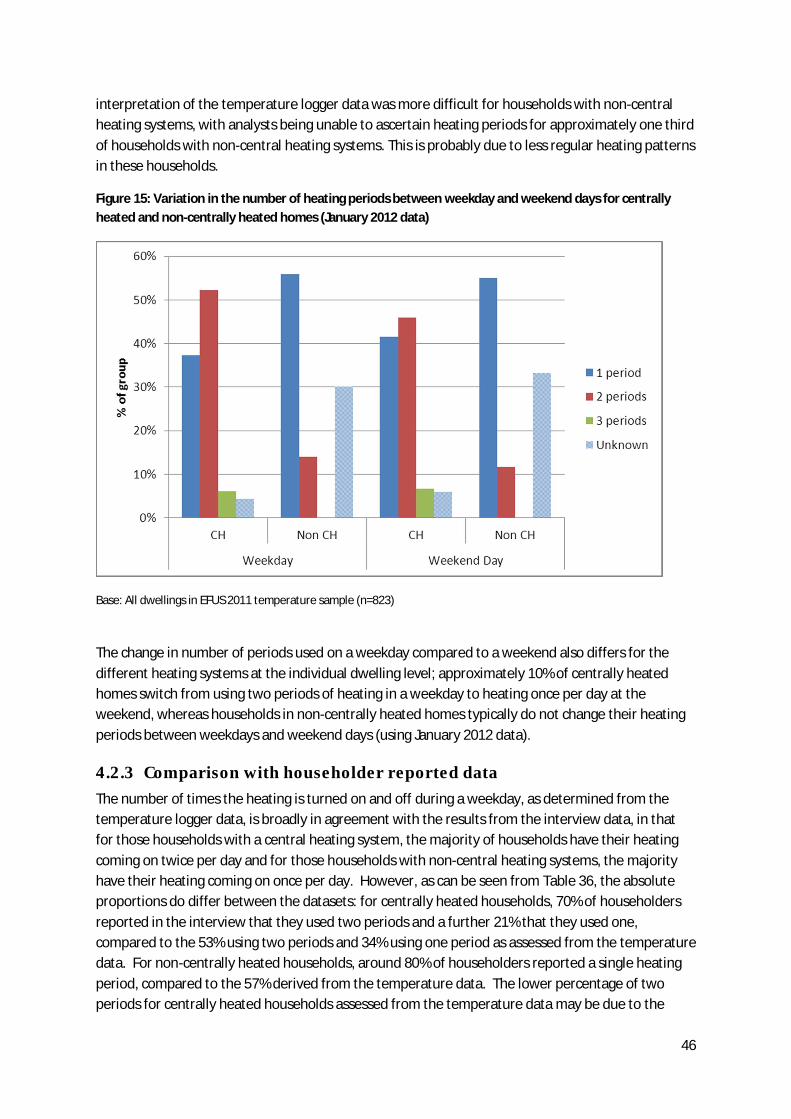
46
interpretation of the temperature logger data was more difficult for households with non-central heating systems, with analysts being unable to ascertain heating periods for approximately one third of households with non-central heating systems. This is probably due to less regular heating patterns in these households.
Figure 15: Variation in the number of heating periods between weekday and weekend days for centrally heated and non-centrally heated homes (January 2012 data)
Base: All dwellings in EFUS 2011 temperature sample (n=823)
The change in number of periods used on a weekday compared to a weekend also differs for the different heating systems at the individual dwelling level; approximately 10% of centrally heated homes switch from using two periods of heating in a weekday to heating once per day at the weekend, whereas households in non-centrally heated homes typically do not change their heating periods between weekdays and weekend days (using January 2012 data).
4.2.3 Comparison with householder reported data The number of times the heating is turned on and off during a weekday, as determined from the temperature logger data, is broadly in agreement with the results from the interview data, in that for those households with a central heating system, the majority of households have their heating coming on twice per day and for those households with non-central heating systems, the majority have their heating coming on once per day. However, as can be seen from Table 36, the absolute proportions do differ between the datasets: for centrally heated households, 70% of householders reported in the interview that they used two periods and a further 21% that they used one, compared to the 53% using two periods and 34% using one period as assessed from the temperature data. For non-centrally heated households, around 80% of householders reported a single heating period, compared to the 57% derived from the temperature data. The lower percentage of two periods for centrally heated households assessed from the temperature data may be due to the

47
difficulty in reading temperature differences particularly in the evenings when the second period is likely to have occurred (as noted in Section 2.2.2). However, it is just as likely that the differences arise from the limitations in the householder reported data; householders were asked to report their heating patterns for a ‘typical’ day in their heating season, but, as is suggested by the results from the temperature logger data, householders may not necessarily maintain the same heating patterns throughout their heating season.
Table 36: Comparison between the temperature logger data and household interview data of the percentages of households heating for different numbers of periods
Number of periods
Central Heating Non-Central Heating Temperature logger data6
Householder reported
interview data
Temperature logger data
Householder reported interview data
Storage heaters Room heaters 0 1.1* 11.0* 0** 1 33.5 21.4 56.5 81.8 79.7 2 52.6 69.3 11.1 5.8* 20.3* 3 5.5 8.2 0** 1.4* 0**
Unknown*** 8.5 32.4 Base: All dwellings in EFUS 2011 temperature sample for temperature logger data sample (n=823); all dwellings in EFUS 2011 Interview sample for householder reported data sample (n=2616) *Sample responses are very small and subject to large sampling errors ** Within the sample there were no responses for this combination but this is not necessarily true for the population. The probability of this combination occurring in the population is likely to be <0.5%. ***Number of periods for one or more months could not be determined from the profile data
Further investigation on the individual dwelling basis shows that for households for which information on the number of periods of heating is present in both datasets, almost 70% of cases report the same number of periods and a further 25% of cases differ by +/- 1 period.
4.2.4 Number of hours of heating Table 37 shows the average (median) number of hours that the heating is on for a weekday and a weekend day for each of the three months. It can be seen that there is a small increase in the average number of hours that the heating is on between November and December and a smaller increase between December and January for both weekdays and weekend days. Paired t-tests7 show that there is a statistically significant difference between the weekday hours of heating for November and both the other two months but not between December and January. One possible explanation for this is that the external conditions were considerably milder than average during November 2011 such that the monthly mean external temperature dropped by 3.5°C from November to December8. It can also be seen from the results that median heating hours on a weekend day were between 0.7 and 1.5 hours longer compared to the weekdays, for the months under consideration. Paired t-tests also show that there is a statistically significant difference between the weekday and weekend heating hours for November, December and January, although the mean difference for all three months was less than 0.75 hours.
6 Using an average of November 2011, December 2011 and January 2012. 7 Using unweighted data 8 See the EFUS 2011 ‘Mean Household Temperatures’ report in this series.
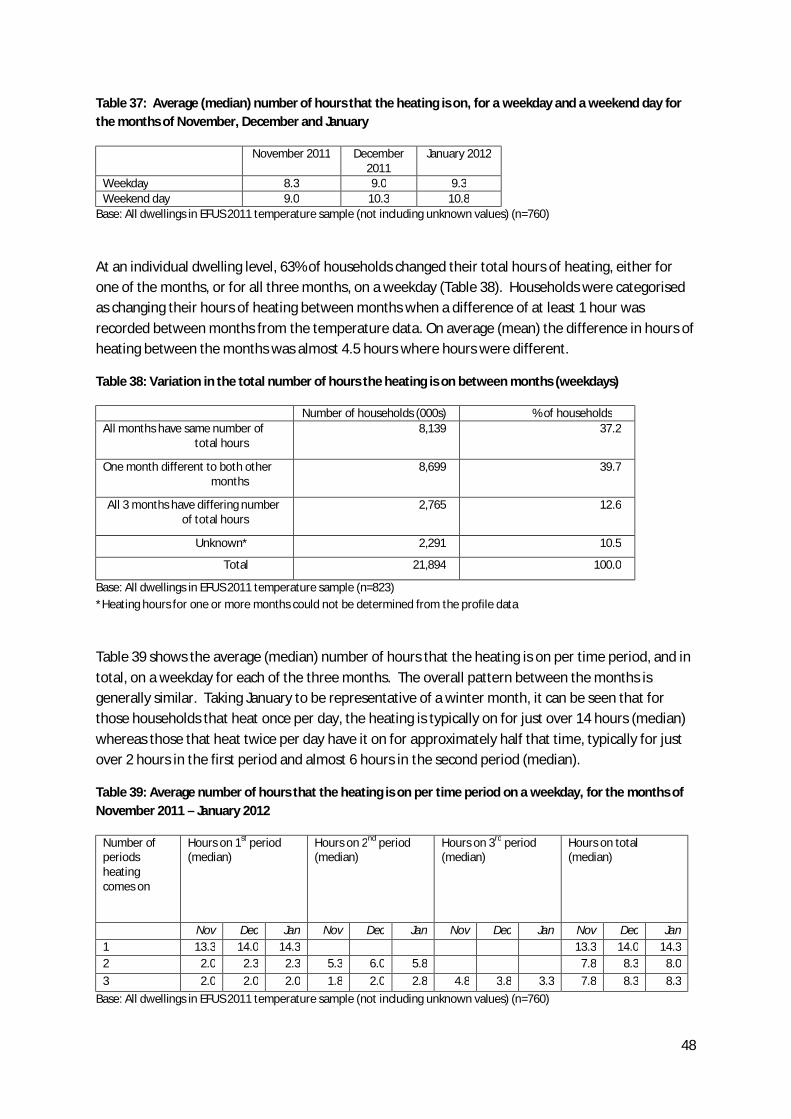
48
Table 37: Average (median) number of hours that the heating is on, for a weekday and a weekend day for the months of November, December and January
November 2011 December 2011
January 2012
Weekday 8.3 9.0 9.3 Weekend day 9.0 10.3 10.8
Base: All dwellings in EFUS 2011 temperature sample (not including unknown values) (n=760)
At an individual dwelling level, 63% of households changed their total hours of heating, either for one of the months, or for all three months, on a weekday (Table 38). Households were categorised as changing their hours of heating between months when a difference of at least 1 hour was recorded between months from the temperature data. On average (mean) the difference in hours of heating between the months was almost 4.5 hours where hours were different.
Table 38: Variation in the total number of hours the heating is on between months (weekdays)
Number of households (000s) % of households All months have same number of
total hours 8,139 37.2
One month different to both other months
8,699 39.7
All 3 months have differing number of total hours
2,765 12.6
Unknown* 2,291 10.5
Total 21,894 100.0
Base: All dwellings in EFUS 2011 temperature sample (n=823) *Heating hours for one or more months could not be determined from the profile data
Table 39 shows the average (median) number of hours that the heating is on per time period, and in total, on a weekday for each of the three months. The overall pattern between the months is generally similar. Taking January to be representative of a winter month, it can be seen that for those households that heat once per day, the heating is typically on for just over 14 hours (median) whereas those that heat twice per day have it on for approximately half that time, typically for just over 2 hours in the first period and almost 6 hours in the second period (median).
Table 39: Average number of hours that the heating is on per time period on a weekday, for the months of November 2011 – January 2012
Number of periods heating comes on
Hours on 1st period (median)
Hours on 2nd period (median)
Hours on 3rd period (median)
Hours on total (median)
Nov Dec Jan Nov Dec Jan Nov Dec Jan Nov Dec Jan 1 13.3 14.0 14.3 13.3 14.0 14.3 2 2.0 2.3 2.3 5.3 6.0 5.8 7.8 8.3 8.0 3 2.0 2.0 2.0 1.8 2.0 2.8 4.8 3.8 3.3 7.8 8.3 8.3
Base: All dwellings in EFUS 2011 temperature sample (not including unknown values) (n=760)

49
The same information, but for weekend days, is shown in Table 40. Paired t-tests9 show that there is no significant difference in the mean number of hours the heating is on during a weekday compared to the weekend for households that heat their homes once daily, or for three periods daily. For households that heat their homes twice daily, the statistical tests show that there is a significant difference in the mean number of hours the heating is on during a weekday compared to a weekend day for both the first and second periods, however the differences in the means for all three months are less than 20 minutes and are therefore considered to be within the bounds of uncertainty due to the temperature logger sampling interval.
Table 40: Average number of hours that the heating is on per time period on a weekend day, for the months of November 2011 – January 2012
Number of periods heating comes on
Hours on 1st period (median)
Hours on 2nd period (median)
Hours on 3rd period (median)
Hours on total (median)
Nov Dec Jan Nov Dec Jan Nov Dec Jan Nov Dec Jan 1 13.0 14.3 14.3 13.0 14.8 14.3 2 2.8 2.8 2.8 5.3 6.0 6.0 8.0 8.3 9.0 3 2.0 2.0 2.3 2.0 2.0 2.0 2.8 3.0 3.3 8.0 8.0 8.0
Base: All dwellings in EFUS 2011 temperature sample (not including unknown values) (n=760)
4.2.5 Comparison with the householder reported data An average of the November, December and January hours of heating has been calculated in order to compare the data obtained from the temperature loggers with the householder reported results from the interview data. This comparison has been carried out for those households that reported that they used their heating system in a regular daily manner and includes any boost heating used.
As can be seen from Table 41, the temperature data show that the average (median) number of hours that households heat their homes on a daily basis is 9.4 hours (9.0-9.8 C.I.-95%). By comparison, analysis of the householder provided information results in a median value of 8.7 hours (8.5-8.9 C.I.-95%).
Looking separately at weekdays and weekend days, the 95% confidence intervals show that there are statistically significant differences between the median number of hours derived from the two data sources for both. Households report an average shorter heating time of just under 1 hour for weekdays, and over 1 hour for weekend days compared to the timings derived from the temperature data (although the inability to apportion boost heating timings to the weekday / weekend data makes direct comparison difficult).
9 Using unweighted data

50
Table 41: Comparison of the average daily number of hours of heating reported by the temperature logger data and the householder interview data for all households, and centrally heated and non-centrally heated homes
Sample size
Temperature logger data Sample size
Householder reported interview data – regular heaters only
Median 95% C.I. of median
Median 95% CI of median
All households
All days 823 9.4 (9.0, 9.8) 1873 8.7** (8.5, 8.9) Weekdays 9.0 (8.6, 9.4) 8.0** (7.8, 8.2) Weekends 10.0 (9.6, 10.4) 8.3** (8, 8.5)
Centrally heated households
All days 754 9.3 (8.9, 9.6) 1715 8.6** (8.4, 8.8) Weekdays 9.0 (8.6, 9.4) 8.0** (7.8, 8.2) Weekends 10.0 (9.6, 10.4) 8.0** (7.7, 8.3)
Non-Centrally heated households
All days 69 12.9 (9.5, 16.3) 158 13.0 (10.7, 15.3) Weekdays 12.5 (9.0, 16) 13.0 (10.7, 15.3) Weekends 13.0 (9.6, 16.4) 13.0 (10.7, 15.3)
Base for temperature logger data: All dwellings in EFUS 2011 temperature sample (not including unknown values) Base for interview data: Households heating regularly; centrally heated households, non-centrally heated households. ** Weekday and weekend reported estimates do not include periods of irregular boost heating (typically reported weekly, and unable to apportion to weekdays / weekends). The “all days” estimates include all estimated times of boost heating.
Table 41 also shows the comparison of the average number of hours of heating for centrally heated homes and non-centrally heated homes as derived from the two datasets. For homes heated by a central heating system, there is a statistically significant difference between the median number of hours the heating is on reported by the householder compared to that derived from the temperature data for all days. Householders are, on average, reporting a shorter heating time of approximately 0.5 hours (paired t-test on unweighted sample, n=547). For non-centrally heated homes, there is no significant difference in the average number of hours of heating reported by the two datasets, mainly because the confidence intervals associated with those averages are large due to the small sample sizes for this group, particularly in the temperature logger data.
Further investigation on an individual case basis shows that for almost 20% of valid cases, the number of hours of heating derived from the temperature data is identical to that reported by the householders. A further 25% of cases vary by just +/-1 hour.
4.2.6 Time that heating comes on in centrally heated households Histograms of the start times for periods 1 and 2 as determined from the temperature data in centrally heated households, using January as a representative winter month are shown in Figure 16. As indicated by the red lines, the most typical times that the central heating is turned on is between 05:00 and 09:00 for the first period, and 15:00 and 18:00 for the second period. These timings are in good agreement with those reported by householders in the interview data in which householders with central heating used on a regular basis reported typical ‘on’ times for the first period between 05:00 and 08:00. The results from the temperature data do suggest a slightly longer duration of period 1 start times however this may simply be the result of a lag between the time the heating is switched on and the time it takes for the temperatures to increase.

51
Figure 16: Start times that central heating comes on for Periods 1 and 2 as determined from the temperature data
Base: All dwellings in EFUS 2011 temperature sample (not including unknown values) (n=775)
Equivalent timing stereotypes created during the analysis of the household interview data earlier in this report have been applied to the temperature logger data. The distribution of heating patterns for households that have their heating on once per day (as determined from the temperature data) is shown in Table 42. The results from the temperature data compare very well with the results reported by householders; using the results from both datasets we can conclude that 34-38% of households that use their heating once per day turn their heating on when they wake up and have it on all day, a further 16-21% turn it on in the evening and have it on all night and all day, and a further 15-17% turn it on at ‘home time’ and have it on for most of the evening.

52
Table 42: Weekday heating pattern data, as determined from the temperature logger data, for households heating once daily (% of households)
TIMEFRAME (Length of time on)
Short burst (<4 hr)
Sustained interval (4 to
10 hrs) On all day (11
to 16 hr)
On all day and night (>=17
hrs) Total
Median number of
hours on
TIM
E O
N Wake up (0500-0900)
1* 2* 34 5* 42 15.0
Daytime (0801-1159)
0** 5* 10* ** 16 12.8
Home time (1500-1900)
1* 17 ** ** 19 5.8
Evening/Night (1901-0459)
0** 2* ** 21 24 23.8
Total 2* 27 45 26 100 14.3 Base: centrally heated households in the temperature logger sample heating once daily (n=326) *Sample responses are very small and subject to large sampling errors ** Within the sample there were no responses for this combination but this is not necessarily true for the population. The probability of this combination occurring in the population is likely to be <0.5%.
For households using their heating twice a day, 75% turn their heating on for a period at ‘wake up time’ followed by a period at ‘home-time’, which is slightly lower but still comparable to the 88% derived from the householder reported data. The ‘wake up’ period is typically for a short burst with an average of 2 hours on. The ‘home time’ period is typically for a sustained interval, averaging 6 hours in duration; the latter being approximately 1 hour longer than the result obtained from the householder reported data (Table 43).
Table 43: Weekday heating pattern for households heating twice daily, 1 period at wake-up and 2nd period at home-time (% of households)
TIMEFRAME (Length of time on)
Short burst (<4 hr)
Sustained interval (4 to 9
hrs) On all day (10
to <20 hr)
On all day and night
(>=20 hrs) Total
Median number of
hours on
TIM
E O
N Period 1 Wake up
(0500-0900)
88 12* ** ** 100 2.3
Period 2 Home time
(1500-1900)
10* 90 ** ** 100 5.8
Base: centrally heated households in the temperature logger sample heating twice daily, 1st period at wake-up and 2nd at home-time (n=286). *Sample responses are very small and subject to large sampling errors ** Within the sample there were no responses for this combination but this is not necessarily true for the population. The probability of this combination occurring in the population is likely to be <0.5%.
As was done for the householder reported data, an ‘overall typical heating pattern’ has been created to describe the heating patterns used by centrally heated households, as determined by the temperature data. The results from the temperature data show that the most common heating

53
pattern, describing 32% of centrally heated households, is one in which the heating comes on twice daily, first at a ‘wakeup time’ for a short burst and then at ‘home-time’ for a sustained interval. This confirms the result derived from the householder reported data, although a slightly higher proportion of households (39%) reported this pattern than suggested by the monitored data.
4.2.7 Comparison with the householder reported data Analysis of the weekend timing stereotypes derived from the temperature data results in very similar conclusions being drawn to those made from the householder reported data. Both datasets suggest that there is a small decrease in the proportion of households heating their homes twice per day at the weekend compared to a weekday, with those households typically moving to a once daily pattern. The temperature logger data also confirms the shift in timings seen in the interview data for those centrally heated households heating their homes once daily. At the weekends, there is a decrease in the proportion turning their heating on at home time for a sustained interval and a corresponding increase in the proportion turning their heating on in the ‘day time’ time and keeping it on all day compared to the weekday pattern. For those households that heat their homes twice daily at the weekends, whereas the results from the interview data suggest that the pattern does not alter between weekdays and weekends, the results from the temperature data do suggest some variation in the timings that householders use. Approximately 10% of households change the timing of their second period of heat from coming on at ‘home time’ to coming on at ‘day time’ or ‘evening’.
4.3 Achieved temperatures The temperature that occupants require their heating systems to achieve is, in centrally heated households, usually determined by setting a thermostat. Results from the household interview survey were that the average thermostat setting in centrally heated households was reported to be 20°C, with 50% of all centrally heated households reporting a thermostat set point of between 18°C and 21°C (see Section 3.5 of this report).
The data collected from the temperature loggers have been used to provide an additional assessment of the temperatures achieved in households. For each period of heating, the mean temperature at the end of the heating period has been taken as representing the temperature achieved by a period of heating. The results are shown in Table 44 for the months of November 2011, December 2011 and January 2012, for the living room, hallway, bedroom and Zone 2 (computed as the mean of the hallway and bedroom for each household) for those households heating once per day and those households heating twice daily. The same information for a weekend day is shown in Table 45. The data is also shown graphically in Figure 17.
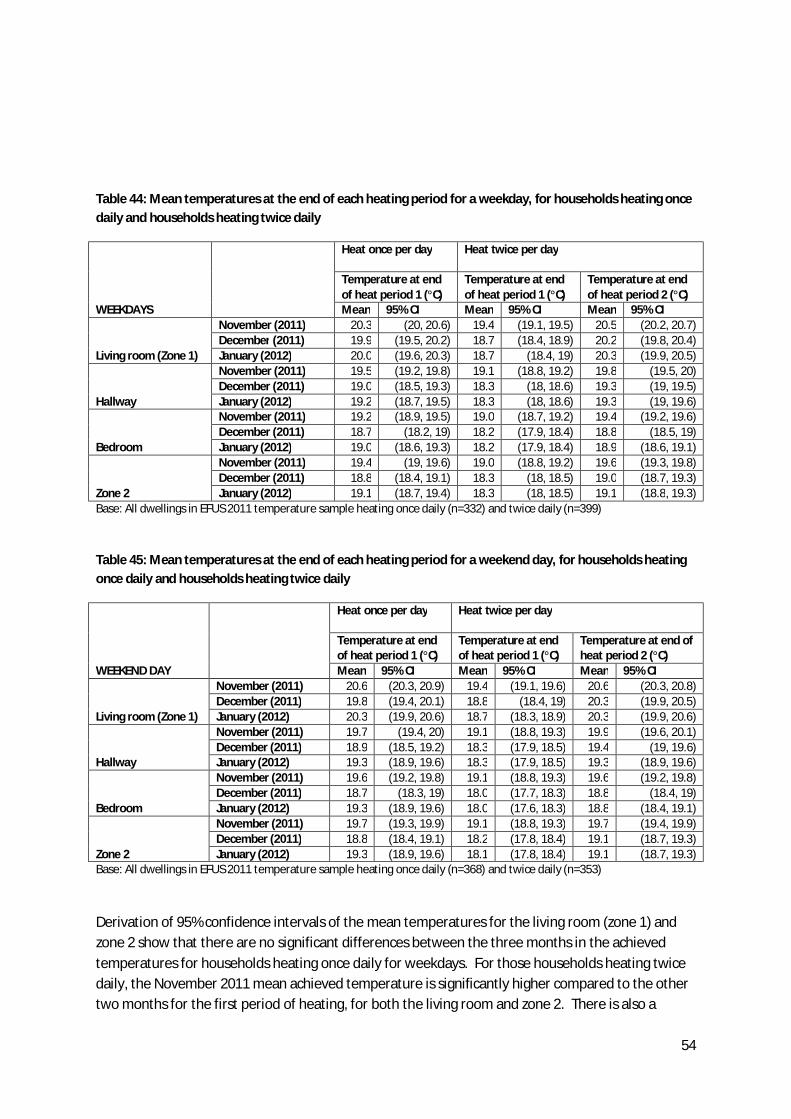
54
Table 44: Mean temperatures at the end of each heating period for a weekday, for households heating once daily and households heating twice daily
WEEKDAYS
Heat once per day
Heat twice per day
Temperature at end of heat period 1 (°C)
Temperature at end of heat period 1 (°C)
Temperature at end of heat period 2 (°C)
Mean 95% CI Mean 95% CI Mean 95% CI
Living room (Zone 1)
November (2011) 20.3 (20, 20.6) 19.4 (19.1, 19.5) 20.5 (20.2, 20.7) December (2011) 19.9 (19.5, 20.2) 18.7 (18.4, 18.9) 20.2 (19.8, 20.4) January (2012) 20.0 (19.6, 20.3) 18.7 (18.4, 19) 20.3 (19.9, 20.5)
Hallway
November (2011) 19.5 (19.2, 19.8) 19.1 (18.8, 19.2) 19.8 (19.5, 20) December (2011) 19.0 (18.5, 19.3) 18.3 (18, 18.6) 19.3 (19, 19.5) January (2012) 19.2 (18.7, 19.5) 18.3 (18, 18.6) 19.3 (19, 19.6)
Bedroom
November (2011) 19.2 (18.9, 19.5) 19.0 (18.7, 19.2) 19.4 (19.2, 19.6) December (2011) 18.7 (18.2, 19) 18.2 (17.9, 18.4) 18.8 (18.5, 19) January (2012) 19.0 (18.6, 19.3) 18.2 (17.9, 18.4) 18.9 (18.6, 19.1)
Zone 2
November (2011) 19.4 (19, 19.6) 19.0 (18.8, 19.2) 19.6 (19.3, 19.8) December (2011) 18.8 (18.4, 19.1) 18.3 (18, 18.5) 19.0 (18.7, 19.3) January (2012) 19.1 (18.7, 19.4) 18.3 (18, 18.5) 19.1 (18.8, 19.3)
Base: All dwellings in EFUS 2011 temperature sample heating once daily (n=332) and twice daily (n=399)
Table 45: Mean temperatures at the end of each heating period for a weekend day, for households heating once daily and households heating twice daily
WEEKEND DAY
Heat once per day
Heat twice per day
Temperature at end of heat period 1 (°C)
Temperature at end of heat period 1 (°C)
Temperature at end of heat period 2 (°C)
Mean 95% CI Mean 95% CI Mean 95% CI
Living room (Zone 1)
November (2011) 20.6 (20.3, 20.9) 19.4 (19.1, 19.6) 20.6 (20.3, 20.8) December (2011) 19.8 (19.4, 20.1) 18.8 (18.4, 19) 20.3 (19.9, 20.5) January (2012) 20.3 (19.9, 20.6) 18.7 (18.3, 18.9) 20.3 (19.9, 20.6)
Hallway
November (2011) 19.7 (19.4, 20) 19.1 (18.8, 19.3) 19.9 (19.6, 20.1) December (2011) 18.9 (18.5, 19.2) 18.3 (17.9, 18.5) 19.4 (19, 19.6) January (2012) 19.3 (18.9, 19.6) 18.3 (17.9, 18.5) 19.3 (18.9, 19.6)
Bedroom
November (2011) 19.6 (19.2, 19.8) 19.1 (18.8, 19.3) 19.6 (19.2, 19.8) December (2011) 18.7 (18.3, 19) 18.0 (17.7, 18.3) 18.8 (18.4, 19) January (2012) 19.3 (18.9, 19.6) 18.0 (17.6, 18.3) 18.8 (18.4, 19.1)
Zone 2
November (2011) 19.7 (19.3, 19.9) 19.1 (18.8, 19.3) 19.7 (19.4, 19.9) December (2011) 18.8 (18.4, 19.1) 18.2 (17.8, 18.4) 19.1 (18.7, 19.3) January (2012) 19.3 (18.9, 19.6) 18.1 (17.8, 18.4) 19.1 (18.7, 19.3)
Base: All dwellings in EFUS 2011 temperature sample heating once daily (n=368) and twice daily (n=353)
Derivation of 95% confidence intervals of the mean temperatures for the living room (zone 1) and zone 2 show that there are no significant differences between the three months in the achieved temperatures for households heating once daily for weekdays. For those households heating twice daily, the November 2011 mean achieved temperature is significantly higher compared to the other two months for the first period of heating, for both the living room and zone 2. There is also a
55
significant difference between November and the other two months for the second period of heating in zone 2 (although not in zone 1). It is likely that this is due to the milder weather experienced in November 2011 compared to the following two months.
Using the results for January 2012 as being representative of a typical winter month, the 95% confidence intervals of the mean temperatures for the individual rooms show that the average temperature achieved is significantly higher in the living room compared to both the hallway and the bedroom, for those households heating once daily. For those households heating for two periods per day, there is no significant difference in achieved temperatures in any of the rooms for the first period, but for the second period of heating the achieved temperature in the living room is significantly higher than either the hallway or bedroom.
It is also clear from Figure 17 below that for those households heating twice daily, there is a difference between the temperatures achieved during the first heating period compared to the second heating period and the 95% confidence intervals shows that this difference is significant for all three rooms. It is likely that, as the first period of heating is typically for a short interval, the time that the heating is on for in many households is not sufficient to bring the room temperatures up to the required temperatures. This finding is a departure from current SAP and BREDEM methodology which assumes the ‘demand' temperature is met during the shorter heating period.
Comparing the weekday to the weekend achieved temperatures, the 95% confidence intervals show that there is no significant difference between the weekday and weekend temperatures in any of the rooms, for both households heating once daily and those heating twice per day.

56
Figure 17: Graphs of the mean temperatures at the end of each heating period for a weekday and a weekend day, for households heating once daily and households heating twice daily
Base: All dwellings in EFUS 2011 temperature sample heating once daily (n=305) and twice daily (n=402)
4.3.1 Achieved temperatures in different types of dwelling Table 46 shows the mean achieved temperature and the two-tailed 95% confidence intervals of the achieved temperatures for the various categories across a range of dwelling characteristics. For these purposes, the achieved temperature for each household has been taken to be the 3 month weekday average of either the temperature reached at the end of heating period 1 for households heating once daily or the temperature reached at the end of heating period 2 for households heating twice daily.
17.017.518.018.519.019.520.020.521.0
Nov Dec Jan Nov Dec Jan Nov Dec Jan Nov Dec Jan
Living room Hallway Bedroom Zone 2
Tem
pera
ture
(°C)
Weekday
Heat once per day Temperature at end of heat period 1
Heat twice per day Temperature at end of heat period 1
Heat twice per day Temperature at end of heat period 2
17.017.518.018.519.019.520.020.521.0
Nov Dec Jan Nov Dec Jan Nov Dec Jan Nov Dec Jan
Living room Hallway Bedroom Zone 2
Tem
pera
ture
(°C)
Weekend day
Heat once per day Temperature at end of heat period 1
Heat twice per day Temperature at end of heat period 1
Heat twice per day Temperature at end of heat period 2

57
Table 46: Mean achieved temperatures at the end of period 1 for those heating once per day, and the end of period 2 for those heating twice per day, across different dwelling types
Dwelling characteristic
Characteristic category
Living Room Zone 2 N (raw sample
size)
Mean achieved temp(°C)
95% CI Achieved temp (°C)
Mean achieved temp (°C)
95% CI of Achieved temp (°C)
Dwelling type End terrace 83 20.0 (19.4, 20.4) 19.1 (18.5, 19.6) Mid terrace 124 20.5 (20.1, 20.9) 19.2 (18.8, 19.5) Semi detached 244 19.9 (19.5, 20.2) 19.0 (18.7, 19.3) Detached 143 19.8 (19.4, 20.1) 18.9 (18.6, 19.2) Bungalow 101 20.6 (20.2, 21) 19.6 (19, 20) Flat 128 20.6 (20.1, 21) 19.3 (18.8, 19.8)
Dwelling type house or bungalow 692 20.1 (19.9, 20.2) 19.1 (18.9, 19.2) flat 128 20.6 (20.1, 21) 19.3 (18.8, 19.8)
Dwelling Age Pre 1919 127 19.6 (19.1, 19.9) 18.2 (17.8, 18.6) 1919-1944 127 20.1 (19.6, 20.5) 19.1 (18.7, 19.5) 1945-1964 209 20.2 (19.9, 20.5) 19.0 (18.7, 19.3) 1965-1974 137 20.3 (19.9, 20.6) 19.3 (18.8, 19.6) 1975-1980 66 21.0 (20.3, 21.6) 20.2 (19.5, 20.8) 1981-1990 79 20.5 (20, 20.9) 19.6 (19.2, 19.9) Post 1990 75 20.1 (19.5, 20.5) 19.6 (19.1, 19.9)
Useable floor area
< 50 m2 89 20.6 (20, 21) 19.4 (18.8, 20) 50 to 69 m2 197 20.4 (20, 20.7) 19.2 (18.8, 19.5) 70 to 89 m2 213 20.0 (19.6, 20.3) 19.1 (18.7, 19.3) 90 to 109 m2 119 20.3 (19.9, 20.6) 19.2 (18.9, 19.4) 110 to 139 m2 95 20.1 (19.6, 20.4) 19.1 (18.7, 19.4) >=140 m2 110 19.7 (19.3, 20.1) 19.0 (18.5, 19.3)
Region - EHS order
North East 57 20.2 (19.5, 20.8) 19.0 (18.3, 19.7) North West 130 19.8 (19.3, 20.2) 18.7 (18.2, 19.2) Yorks & Humber 106 19.8 (19.2, 20.2) 18.6 (18, 19.1) East Midlands 79 20.7 (20.1, 21.1) 19.1 (18.5, 19.5) West Midlands 71 20.1 (19.4, 20.6) 18.8 (18.2, 19.3) East 112 20.4 (19.9, 20.7) 19.4 (18.9, 19.7) London 62 20.5 (19.8, 21.1) 20.0 (19.4, 20.5) South East 125 20.2 (19.8, 20.5) 19.3 (18.9, 19.5) South West 81 20.1 (19.6, 20.5) 19.1 (18.6, 19.5)
Urban or rural location?
Urban 722 20.2 (20, 20.3) 19.2 (19, 19.3) Rural 101 20.0 (19.5, 20.3) 18.6 (18.1, 19)
Type of heating system
Central Heating 754 20.2 (19.9, 20.3) 19.2 (19, 19.3) Non-Central Heating 69 20.2 (19.6, 20.8) 18.1 (17.4, 18.7)
Main heating fuel Mains gas 687 20.1 (19.9, 20.2) 19.2 (19, 19.3) Electricity 66 20.3 (19.7, 20.8) 18.1 (17.4, 18.7) Other 70 20.6 (19.9, 21.1) 19.3 (18.6, 19.9)
Are the walls of the dwelling insulated?
Insulated 139 20.4 (20.1, 20.6) 19.3 (19, 19.5) Not insulated 88 20.0 (19.7, 20.2) 19.0 (18.7, 19.2)
Loft insulation <50mm 48 19.3 (18.4, 20.1) 19.2 (18.5, 19.8) 50-149mm 335 20.2 (19.9, 20.4) 19.1 (18.8, 19.3) 150+ mm 355 20.2 (19.9, 20.4) 19.1 (18.8, 19.3)
Is dwelling fully double glazed?
Yes 639 20.4 (20.2, 20.5) 19.3 (19.1, 19.4) No 184 19.4 (19, 19.8) 18.7 (18.3, 19)
How many insulation measures does the dwelling have?
All 3 insulation measures
139 20.0 (19.6, 20.3) 19.0 (18.6, 19.3)
2 insulation measures
246 20.7 (20.4, 21) 19.4 (19.1, 19.6)
1 insulation measure
265 20.2 (19.9, 20.5) 19.2 (18.9, 19.4)
No insulation measures
88 18.7 (18.2, 19.1) 18.3 (17.8, 18.7)
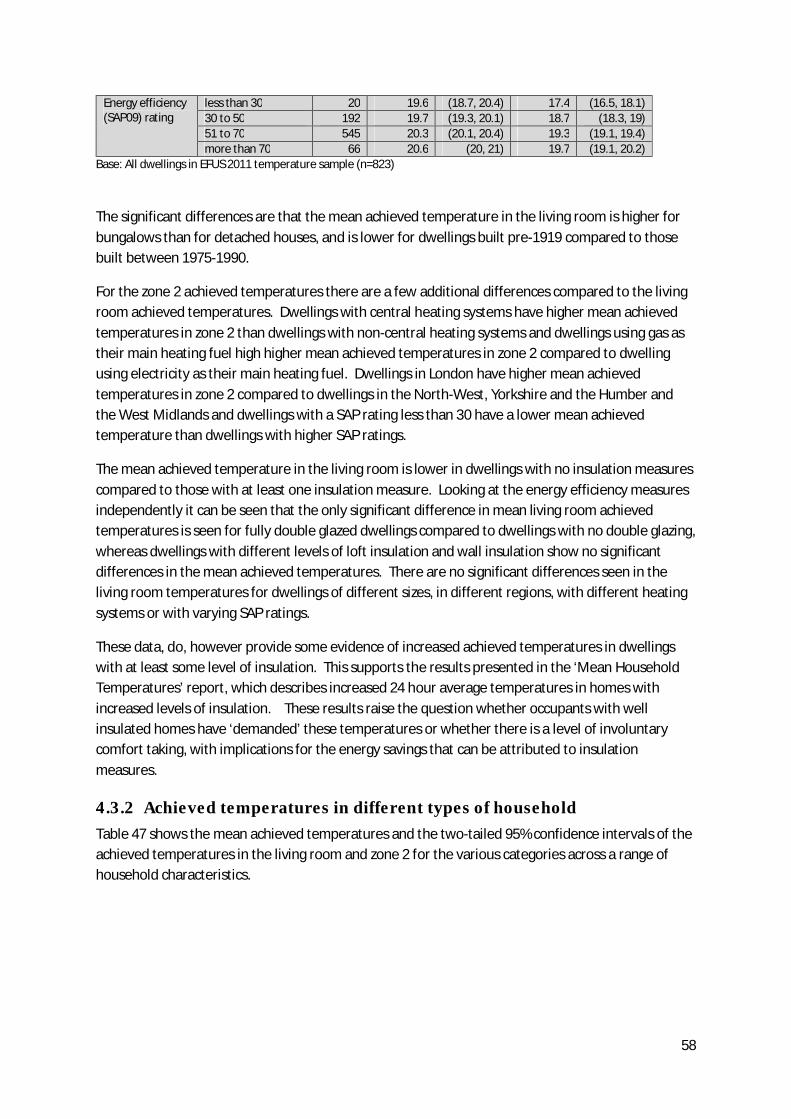
58
Energy efficiency (SAP09) rating
less than 30 20 19.6 (18.7, 20.4) 17.4 (16.5, 18.1) 30 to 50 192 19.7 (19.3, 20.1) 18.7 (18.3, 19) 51 to 70 545 20.3 (20.1, 20.4) 19.3 (19.1, 19.4) more than 70 66 20.6 (20, 21) 19.7 (19.1, 20.2)
Base: All dwellings in EFUS 2011 temperature sample (n=823)
The significant differences are that the mean achieved temperature in the living room is higher for bungalows than for detached houses, and is lower for dwellings built pre-1919 compared to those built between 1975-1990.
For the zone 2 achieved temperatures there are a few additional differences compared to the living room achieved temperatures. Dwellings with central heating systems have higher mean achieved temperatures in zone 2 than dwellings with non-central heating systems and dwellings using gas as their main heating fuel high higher mean achieved temperatures in zone 2 compared to dwelling using electricity as their main heating fuel. Dwellings in London have higher mean achieved temperatures in zone 2 compared to dwellings in the North-West, Yorkshire and the Humber and the West Midlands and dwellings with a SAP rating less than 30 have a lower mean achieved temperature than dwellings with higher SAP ratings.
The mean achieved temperature in the living room is lower in dwellings with no insulation measures compared to those with at least one insulation measure. Looking at the energy efficiency measures independently it can be seen that the only significant difference in mean living room achieved temperatures is seen for fully double glazed dwellings compared to dwellings with no double glazing, whereas dwellings with different levels of loft insulation and wall insulation show no significant differences in the mean achieved temperatures. There are no significant differences seen in the living room temperatures for dwellings of different sizes, in different regions, with different heating systems or with varying SAP ratings.
These data, do, however provide some evidence of increased achieved temperatures in dwellings with at least some level of insulation. This supports the results presented in the ‘Mean Household Temperatures’ report, which describes increased 24 hour average temperatures in homes with increased levels of insulation. These results raise the question whether occupants with well insulated homes have ‘demanded’ these temperatures or whether there is a level of involuntary comfort taking, with implications for the energy savings that can be attributed to insulation measures.
4.3.2 Achieved temperatures in different types of household Table 47 shows the mean achieved temperatures and the two-tailed 95% confidence intervals of the achieved temperatures in the living room and zone 2 for the various categories across a range of household characteristics.

59
Table 47: Mean achieved temperatures at the end of period 1 for those heating once per day, and the end of period 2 for those heating twice per day, by household characteristics
Household characteristic
Characteristic category
Living Room Zone 2
N (raw sample size)
Mean achieved temperature (°C)
95% CI Achieved temp (°C)
Mean achieved temperature (°C)
95% CI of Achieved temp (°C)
Tenure
Owner Occupied 524 20.0 (19.8, 20.2) 19.1 (18.9, 19.2) Private rented 64 19.9 (19.3, 20.4) 18.7 (18.0, 19.3) Local Authority 128 21.2 (20.7, 21.7) 19.9 (19.3, 20.4) RSL 107 20.7 (20.2, 21.1) 19.5 (19.0, 19.9)
Household size
1 237 19.9 (19.5, 20.2) 18.6 (18.2, 18.9) 2 303 20.3 (20.0, 20.6) 19.3 (19.0, 19.4) 3 123 20.3 (19.9, 20.6) 19.4 (19.0, 19.7) 4 114 20.1 (19.6, 20.4) 19.5 (19.1, 19.7) 5 or more 46 20.0 (19.4, 20.6) 19.3 (18.7, 19.8)
Pensioner Present?
At least one person of pensionable age
337 20.9 (20.6, 21.1) 19.5 (19.2, 19.7)
No persons of pensionable age
486 19.8 (19.5, 19.9) 19.0 (18.7, 19.1)
Children Present? At least one child 222 20.0 (19.7, 20.2) 19.4 (19.1, 19.6) No children 601 20.2 (20.0, 20.4) 19.0 (18.8, 19.2)
Age of HRP (years)
16 - 34 70 19.7 (19.1, 20.2) 19.2 (18.6, 19.6) 35 - 44 125 19.7 (19.3, 20.0) 19.0 (18.5, 19.3) 45 - 54 187 19.8 (19.4, 20.1) 18.9 (18.5, 19.1) 55 - 64 181 20.1 (19.6, 20.4) 19.0 (18.6, 19.3) 65 - 74 171 20.8 (20.4, 21.1) 19.3 (18.9, 19.6) 75 or more 89 21.7 (21.1, 22.1) 20.1 (19.5, 20.6)
Employment status of HRP and partner combined
1 or more work full time
373 19.7 (19.5, 19.9) 19.0 (18.7, 19.2)
1 or more work part time
71 20.4 (19.9, 20.9) 18.9 (18.3, 19.4)
none working, one or more retired
283 21.0 (20.7, 21.2) 19.6 (19.2, 19.8)
none working and none retired
96 19.9 (19.3, 20.4) 19.0 (18.4, 19.5)
Annual gross income of the HRP and partner weighted quintiles
1st quintile (lowest) 185 20.5 (20.1, 20.9) 19.2 (18.7, 19.6) 2nd quintile 192 20.4 (20.0, 20.7) 18.8 (18.4, 19.1) 3rd quintile 158 20.4 (20.0, 20.7) 19.3 (18.9, 19.6) 4th quintile 155 19.8 (19.4, 20.1) 19.4 (19.1, 19.6) 5th quintile (highest)
133 19.7 (19.3, 20.0) 19.0 (18.6, 19.3)
Is anyone in the household at home during the day on a weekday?
No 285 19.7 (19.4, 19.9) 18.9 (18.6, 19.1)
Yes
538 20.5 (20.3, 20.6) 19.3 (19.1, 19.5)
Under-occupying?
Not under-occupying
524 20.4 (20.1, 20.6) 19.5 (19.2, 19.6)
Under-occupying 299 19.8 (19.4, 20.0) 18.6 (18.3, 18.8) In Fuel Poverty? LIHC definition
Not in fuel poverty 741 20.2 (20, 20.3) 19.2 (19, 19.3) In fuel poverty 82 19.9 (19.3, 20.4) 18.4 (17.8, 18.9)
Base: All dwellings in EFUS 2011 temperature sample (n=823)
An assessment of the confidence intervals shows that the achieved temperatures in the living room are higher in local authority dwellings than in owner occupied or private rented dwellings. There
60
appears to be no statistical difference in the achieved temperatures across households of differing sizes, nor between households with and without children, nor between households considered to be fuel poor compared to those who are not.
However, there is a clear pattern of higher achieved temperatures in the living room among older households. Households with at least one person of pensionable age have statistically higher achieved temperatures than households without. Further to this, households with the youngest HRPs (Household Reference Person) show mean achieved temperatures of 19.7°C, whereas households with the oldest HRPs show mean achieved temperatures of up to 21.7°C. Additionally, households in the employment status group ‘none working, 1 or more retired’ have higher achieved temperatures in the living room compared to those in the ‘none working, none retired’ group.
There is an inverse relationship between incomes and achieved temperatures in the living room. Households in the lowest income quintile have on average higher achieved temperatures than households in the highest income quintile. Households that report being ‘in during the day’ have higher mean achieved temperatures than households that are out during the day. Also, those households considered to be under-occupying their homes have higher mean achieved temperatures compared to those that are not under-occupiers.
Some of the variation in achieved temperatures across categories in the living room is also seen in zone 2. For example, households in local authority dwellings have higher mean achieved zone 2 temperatures than owner occupiers, households with a pensioner present have higher mean achieved zone 2 temperatures than younger households and households considered to be under-occupying their homes have higher mean achieved temperatures compared to those that are not under-occupiers. There are some differences seen for zone 2 achieved temperatures that are not seen in the living rooms: single person households have lower zone 2 achieved temperatures compared to households with 2 or 4 persons; there are no statistical differences in the mean achieved temperatures across the different income quintiles, however, households considered to be in fuel poverty have lower mean achieved temperatures in zone 2 compared to households not in fuel poverty.
A greater temperature requirement for older households is generally not taken into account in energy modelling (with the exception of Fuel Poverty Modelling in Scotland where a higher temperature standard is set for the oldest households). In light of these findings, in may be appropriate to assume different temperatures for households of different ages within other energy modelling methodologies.
4.3.3 Implications for SAP and BREDEM The SAP calculation uses a demand temperature of 21°C in the living area (zone 1). For the rest of the dwelling (zone 2) the demand temperature is dependent on the Heat Loss Parameter (HLP) of the dwelling and the level of control of the heating system in the dwelling; however the calculation results in zone 2 demand temperatures of between 18°C and 21°C.
Based on the observations described above, in order to calculate a proxy for ‘demand’ temperatures from the temperature logger data to compare to those used in SAP/BREDEM, the average of the temperature at the end of heating period 1 (for those households heating once per day) and the

61
temperature at the end of heating period 2 (for those households heating twice per day) on a weekday, using the average of the three months of data, has been calculated. This has been done for the living room (zone 1) and zone 2. The results are shown in Table 48. If the lowermost and uppermost limits of the 95% confidence intervals from column (a) and (b) are taken, it can be concluded that the average ‘demand’ temperature for the living room (zone 1) falls within the range of 19.7-20.4°C, with the average being 20.2°C, and the average ‘demand’ temperature for zone 2 falls within the range of 18.7-19.4°C, with the average being 19.1°C.
Table 48: Mean temperatures in zone 1 and zone 2 for comparison to SAP
(a) Heat once per day - temperature at end of heat period 1 (°C)
(b) Heat twice per day - temperature at end of heat period 2 (°C)
Average (mean) of (a) and (b) (°C)
Mean 95% CI Mean 95% CI Mean Living room (Zone 1)
3 month average, weekday
20.0
(19.7, 20.3)
20.3
(20, 20.4)
20.2
Zone 2 3 month average, weekday
19.0
(18.7, 19.3)
19.2
(19, 19.4)
19.1
Base: All dwellings in EFUS 2011 temperature sample heating once or twice daily (n=707)
These results generally show a good match with the current SAP assumptions regarding demand temperatures, although the SAP zone 1 demand temperature of 21°C appears set approximately 0.8°C too high when taking into account the above confidence intervals. The zone 2 results fall in the middle of the possible SAP range (18-21°C), providing some support to the current modelling assumptions, however further analysis looking at heat loss perimeter and heating controls (which determine the zone 2 temperature in SAP) by temperature achieved would provide some additional insights into these provisional findings.

62
5 Findings from the EFUS Metered Consumption data A total of 2,616 interviews were completed as part of the interview survey and just over half of these (1,345 cases) made up the subset of dwellings that had meter readings recorded during the EFUS10. This section of the report describes the gas and electricity consumption of these households relevant to use of main heating systems.
The analysis of the metered consumption data concerning the heating systems and heating patterns used by households has been carried out split by fuel: first an analysis of metered gas consumption has been done for households using gas central heating systems looking separately at those households using a regular heating pattern and those using a non-regular heating pattern. This is followed by the analysis of the metered electricity consumption for households using electric storage heaters. No differentiation between regular and non-regular heaters has been made for this section due to limitations of sample size. Finally, the variation in metered gas consumption by heating season length is reported.
It should be noted that in the discussion that follows, the metered consumption values are for the total consumption of gas or electricity in the households. There is no accurate way of apportioning the consumption to the various end uses of each fuel i.e. space heating, water heating, cooking or lights and appliances. However, as the energy consumed by space heating is by far the greatest proportion of household energy use then it is reasonable to assume that any patterns seen in the total gas or electricity consumption generally reflects the patterns of consumption for space heating.
5.1 Gas consumption in households using gas central heating systems The median annualised gas consumption for households using mains gas central heating systems is 14,200 kWh. There is, however, a wide range of consumption values, with the minimum being 300 kWh and the maximum 76,500 kWh. As can be seen from the histogram in Figure 18, there is considerable positive skew which results in a mean value of 16,500 kWh. 50% of households with mains gas central heating systems use between 10,000 and 20,000 kWh of gas per year; the lowest and highest 10% of households use less than 6,200 kWh and more than 28,800 kWh per year, respectively.
10 See EFUS 2011 Methodology report and EFUS 2011 Metered Fuel Consumption report for more details on the methodology used to collect and calculate the metered consumption data,.

63
Figure 18: Histogram of gas consumption for households using mains gas as their primary heating fuel
Base: All households in the EFUS meter reading sample with mains gas central heating (n=1167).
5.1.1 Households using regular versus non-regular heating patterns The analysis reported on above shows that the majority of centrally heated households (75%) report using their heating in a regular daily pattern with the remainder using it on a non-regular daily basis. Table 49 shows the gas consumption statistics for these two groups of households. It can be seen that the median consumption is significantly lower (at the 95% significance level) for households heating in a non-regular manner compared to those heating in a regular way.
Table 49: Households using mains gas as their primary heating fuel in a boiler with central heating
Households using a regular heating pattern (annualised gas consumption,
kWh) (n=886)
Households using a non-regular heating pattern (annualised gas
consumption, kWh) (n=281) Median 14,700 12,300
Minimum 1,200 300 Maximum 76,500 75,700
95% CI of the median+ (14200, 15300) (11100, 13400) Base: All households in the EFUS meter reading sample with mains gas central heating (n=1167) +95% confidence intervals around a median value have been calculated following the method described by McGill et al, 1978 using a Design Factor of 1.1. See the EFUS 2011 Methodology Report for further details
Table 50 shows the median annualised gas consumption for gas centrally heated households by number of heating periods. It can be seen from the 95% confidence intervals that there is no significant difference between the different groups. This is a somewhat surprising result as on average, households heating once per day report having their heating on approximately twice as long as those heating twice per day. Further analysis shows little direct correlation between reported heating hours and consumption. It seems likely that considering number of heating patterns or hours alone is too simple to explain differences in consumption. The inter-relationship of factors relating to heating season length, achieved temperatures, dwelling size, dwelling fabric
0.0
2.0
4.0
6.0
8.0
10.0
12.0
14.0
% o
f hou
seho
lds w
ith g
as ce
ntra
l hea
ting
Final annualised gas consumption (kWh)

64
energy efficiency and the consumption by other end uses will need to be considered. It is suggested that future work could look at a multiple regression analysis of consumption with key variables available from the EFUS datasets in order to try to understand the reasons for this lack of correlation.
Table 50: Median gas consumption for households heating for different number of periods
Number of heating periods Sample size Median annualised gas consumption (kWh)
95% C.I. of median+
1 189 14,000 (12700, 15300) 2 619 14,800 (14100, 15500)
3 or more 69 15,900 (13800, 17900) Base: All households in the EFUS meter reading sample with mains gas central heating (n=1167) +95% confidence intervals around a median value have been calculated following the method described by McGill et al, 1978 using a Design Factor of 1.1. See the Methodology Report for further details
The most common heating pattern, describing nearly 40% of households with central heating used in a regular daily manner, is one in which the heating comes on twice daily, first at a ‘wake up’ time for <4 hours and then at ‘home time’ for 4-10 hours. The median annual gas consumption for households using this heating pattern is 15,500 kWh or 160 kWh/m2.
5.2 Electricity consumption in households using electric storage heaters
The small sample size for homes with main heating from electricity restricts the amount of analysis that is possible for these homes. The average (median) annualised electricity consumption for households using electrical heating systems (storage heaters and room heaters) is 6,700 kWh, with the minimum being 400 kWh and the maximum 32,500 kWh. 50% of these households use between 4,000 and 9,500 kWh; the lowest and highest 10% of households use less than 3,000 kWh and more than 16,000 kWh, respectively. For households using storage heaters only, the median consumption is 6,700 kWh. Figure 19 shows the histogram of consumption values for households using storage heaters.

65
Figure 19: Histogram of electricity consumption for households using electric storage heaters as their primary heating system
Base: All households in the EFUS meter reading sample with electric storage heating (n=78)
As described above, the majority of households with electric storage heaters as their primary heating system, that use them in a regular daily manner, report that they turn their heating on once per day, for an average of 16 hours. However, as was found for gas consumption in gas centrally heated households, there is no obvious correlation between the mean electricity consumption and heating hours11.
5.3 Variation in consumption by householder reported heating season length
The variation in average gas consumption by the heating season length as reported by households during the interview survey is shown in Table 51. The analysis has been carried out for households that heat regularly using a mains gas boiler system with radiators. Sample size constraints preclude doing the same analysis for electricity consumption. The median gas consumption increases as the reported heating season length increases, although not all differences are statistically significant.
11 It should be noted that the sample size is small (n=42) for this group and therefore the statistics are subject to large sampling errors.
0.0
2.0
4.0
6.0
8.0
10.0
12.0
14.0
% o
f hou
seho
lds w
ith e
lect
ric st
orag
e he
ater
s
Final annualised electricity consumption (kWh)

66
Table 51: Average metered gas consumption by banded heating season length for households heating regularly with a gas central heating system
Sample size Median 95% CI of median+ 1-3 months 54 11,200 (9100, 13300)
4 months 121 13,223 (11400, 15000) 5 months 226 13,862 (12800, 14900) 6 months 270 15,592 (14600, 16600)
7-9 months 188 16,777 (15200, 18300) 10-12 months 25 16,934 (14600, 19200)
Base: All households in the EFUS meter reading sample with mains gas central heating (n=1167) +95% confidence intervals around a median value have been calculated following the method described by McGill et al, 1978 using a Design Factor of 1.1. See the EFUS 2011 Methodology Report for further details

67
6 Conclusions The EFUS 2011 interview survey has returned valuable information on how households report using their main heating systems along with room temperature data that enables some validation of the householder reported information and provides information on the temperatures achieved in dwellings at the end of heating periods. Analysis has been carried out to determine reported heating seasons, weekday and weekend heating patterns and reported thermostat settings for centrally heated households. Additionally, the typical heating patterns reported to be used by households with non-central heating systems (namely electric storage heaters) used in a regular manner has been presented, alongside an initial analysis on the characteristics of households who report that they use their heating system irregularly, and the reported weekly hours of heating for these households. Many of these findings are those as reported by the household and should be interpreted in this context – there is always the potential for responses to be biased in some way (for example, the starting month for heating may be reported less accurately by households being interviewed towards the end of the survey period) or be mis-reported - however the additional analysis of heating patterns using the temperature logger data provides a method for validating the reported results and largely confirms them.
The results of this analysis should be interpreted alongside that presented in the EFUS 2011 ‘Secondary Heating Systems’ report which is part of this series. This is particularly relevant for the results presented here on the reported extent of use of the main heating system. Analysis in this report looks at the proportions of dwellings not heated by the main heating system, further analysis of the use of alternative heating in rooms not heated by the main heating system is reported on in the ‘Secondary Heating Systems’ report.
The temperature that occupants require their heating systems to achieve is, in centrally heated households, usually determined by setting a thermostat. Householders in centrally heated households were asked the temperature that they typically set their thermostat to. An additional assessment of the temperatures achieved in households has also been made using the data collected from the temperature loggers.
Finally, an analysis of the metered consumption data concerning the heating systems and heating patterns used by households has been carried out. It should be noted that there are limitations to this analysis – the information collected from the survey is not sufficient to provide an accurate way of apportioning the consumption to the various end uses of each fuel i.e. space heating, water heating, cooking or lights and appliances. However, as the energy consumed by space heating is by far the greatest proportion of household energy use then it has been assumed that the patterns seen in the total gas or electricity consumption reflect the patterns of consumption for space heating.
The main conclusions resulting from the analysis are summarised below.
§ The majority of householders report that they start heating their home on a regular daily basis in October and finish sometime in March or April. The average (mean) length of the heating season is reported to be 5.6 months. These householder reported findings are supported by analysis of the temperature data.

68
§ Approximately 2% of households (the equivalent of 0.5 million households) report that they heat their homes daily throughout the year. A similar proportion report that they do not heat their homes at any time of the year.
Daily/Weekly heating patterns
Table 52 provides a summary of the key findings reported by households in answer to questions about the heating patterns used with their main heating systems.
Table 52: Summary of the key findings reported by households with respect to the heating patterns used
Type of main heating system
Regularity of heating
Number of heating periods Boost heating (asked of households with CH controlled by timer to give regular
heating) (12.2m households; n=1399)
Daily heating hours
Centrally
Heated
19.7m households
(90%)
(n=2356)
Regular heating 14.7m
households (75%)
(n=1715)
0 heating periods
*1% (n=20)
Use boost heating at least once per week?
Yes 7.5m households
(61%) n=850)
95% C.I. of median daily heating hours
8.4-8.8
(Householder responses)
8.8-9.5
(Temperature data derived)
1 heating periods
21% (n=395)
2 heating periods
69% (n=1158)
No 3.2m households
(26%) n=378)
3+ heating periods
8% (n=142)
Non-regular heating
5m households (25%)
(n=641)
Heating periods N/A
N/A Use boost heating?
N/A N/A 95% C.I. of median daily heating hours
4.0-5.1
(Householder responses)
9.8-11.3
(Temperature data derived)
N/A N/A
Non-Centrally heated
2.2m
households (10%)
(n=260)
Regular heating 1.3m
households (60%)
(n=158)
0 heating periods
*8% (n=15)
Use boost heating?
N/A N/A 95% C.I. of median daily heating hours
10.7-15.3
(Householder responses)
9.1-16.5 (Temperature data
derived)
1 heating periods
81% (n=128)
2 heating periods
*9% (n=14)
N/A N/A
3+ heating periods
*1% (n=1)
Non-regular heating
0.9m households
(40%)
(n=102)
Heating periods N/A
N/A Use boost heating?
N/A N/A 95% C.I. of median daily heating hours
2.3-4.6
(Householder responses)
15.6-23.4
(Temperature data derived)
N/A N/A
Base: All dwellings in EFUS 2011 Interview Survey / Temperature survey representing 21.9 million households in England (n=2616 for interview data, n = 823 for temperature data).

69
Daily/Weekly heating patterns for households heating in a regular manner
§ The majority of households (16.0 million, 73%) state that they heat their homes in a regular manner, that is they turn their heating on and off at set times of the day, although this pattern can change for different days of the week and at weekends.
Centrally heated homes
§ 25% of households in centrally heated homes report that they do not have set daily patterns.
§ Almost 10% of centrally heated properties do not have a timer with which to control their heating system. A further 23% have a timer but do not use it to control the system.
§ Nearly 35% of households using a timer to control a central heating system in a regular manner report that they manually override the heating system to turn it off when it is timed to be on at least once every week or more.
§ The majority of regularly heated centrally heated households (70%) report that that they have their heating come on twice per day. A further 21% have their heating on once per day, accounting for 91% of all regularly centrally heated households.
§ From the analysis of the November 2011, December 2011 and January 2012 temperature data it can be seen that the majority of households (76%) maintain the same number of heating periods over these winter months.
§ 60% of households with a central heating system controlled by a timer to give a regular heating pattern report that they switch on their heating for an additional period of ‘boost’ heating at least once a week. This boost period is typically 1‐2 hours per day.
§ The average number of hours that the heating is on for a centrally heated household whose home is regularly heated on a daily basis (excluding any boost heating) is 7.5 hours. Those that have their heating on once per day, typically have it on for 14.5 hours whereas those that have it on twice per day have it on for approximately half that time, typically for 2 hours in the first period and 5 hours in the second period.
§ Analysis of the temperature data to derive timings of heating patterns results in a good agreement of the householder reported data. Using January 2012 as representative of a typical winter month, the temperature data shows that, for those households that heat once per day, the heating is typically on for just over 14 hours whereas those that heat twice per day typically have it on for approximately 2 hours in the first period and 6 hours in the second period during weekdays.
§ For centrally heated households, the median total number of hours of heating (including boost heating) is 8.7 hours according to the householder reported data. This compares to 9.4 hours according to the temperature data. The use of secondary heating seems likely to bring these two estimates closer. Further analysis to combine the main and secondary heating hours reported by the householder may help in understanding the differences.

70
§ Analysis of the temperature data indicates that the average (median) daily hours of heating increases by 1 hour between November 2011 and December 2011, and remains the same as December for January 2012.
§ The most common heating pattern, comprising between 32% (temperature logger data) and 39% (interview data) of centrally heated households heating their homes in a regular manner, is one in which heating is on twice daily, first at a ‘wakeup time’ for <4 hours and then at ‘home-time’ for 4-10 hours.
§ Results from the temperature logger data also corroborates the conclusion drawn from the analysis of the interview data in that although there is a shift in timings of heating at a weekend compared to a weekday for approximately 25% of the population, for the stock as a whole, the number of hours of heating at weekends remains approximately the same as for weekdays.
§ Initial bivariate comparisons indicate that factors such as dwelling type, region, tenure, age of occupants and whether occupants are in during the day are likely to be predictor variables for the total number of heating hours. This could be explored further using a multivariate analysis to provide additional insights. It is of particular interest to note that households that are in during the day on weekdays report heating their homes for a median of 9.4 hours per day, compared to households that are out during the day on weekdays reporting heating of 8.0 hours per day. The median number of hours of heating reported by households that are in during the day is lower than often assumed values in many energy modelling applications. It is important to recognise, however, that many energy modelling applications are defined to aspirational, desirable or other standardised levels rather than attempting to modelling actual usage.
Non-centrally heated homes
§ For non-centrally heated households, the average (median) number of hours of heating on a weekday is 13.0 hours according to the householder reported data and 12.5 hours according to the temperature data. The average (median) number of hours of heating on a weekend day 13.0 hours according to both datasets.
Households heating in a non-regular manner
§ 27% of households (5.9 million) report that they do not heat their homes in a regular way, that is to say that they either do not use the heating regularly on a weekly basis or, if they do, they do not use it at regular times on a daily basis.
§ Initial bivariate comparisons suggest that factors determining whether a household will heat their home in a non-regular manner are likely to be the dwelling characteristics of type, floor area and heating system type and fuel, along with the household characteristics of tenure, household size, household income and under-occupancy status.

71
Extent of main heating
§ Around 65% of households (14.3 million households) have one or more rooms that are not heated by the main heating system. Of these, 82% have one or more rooms with no main heating, and 40% have one or more rooms with the main heating turned off.
§ The majority (68%) of ‘other’ rooms (cellars, attics, outbuildings etc. that are habitable and with a power supply from the home) are not heated by the main heating system. Conservatories, separate WCs, bedrooms, hallways and kitchens are more likely not to be heated by the main heating system than living rooms, dining rooms, studies and bathrooms.
§ Initial bivariate analyses suggest that the dwelling characteristics of dwelling age and type, the type of main heating and number of insulation measures are likely to be underlying factors determining whether a household has one or more rooms not heated by the main heating system.
§ The only significant difference in the likelihood of a certain household characteristic group having one or more rooms not heated by the main heating system is seen for fuel poverty status; households that are calculated to be fuel poor are more likely to have one or more rooms not heated by the main heating system compared to those households that are not fuel poor.
Achieved temperatures
§ The average temperature to which the thermostat is set is reported to be 20°C.
§ Using the temperature data it can be concluded that the average temperature achieved for the living room (zone 1) falls within the range of 19.7-20.4, with the average being 20.2°C, and the average temperature achieved for zone 2 falls within the range of 18.7-19.4, with the average being 19.1°C.
§ Using the temperature data, the temperatures achieved after a significant period of heating are higher among older households, and for households living in dwellings with at least some level of insulation present. This latter finding provides some evidence of occupant ‘takeback’ of energy savings following insulation.
Metered fuel consumption
§ 50% of households with mains gas central heating systems use between 10,000 and 20,000 kWh of gas per year. The median consumption is significantly lower for households heating in a non-regular manner compared to those heating in a regular way.
§ 50% of households using electrical heating systems (storage heaters and room heaters) use between 4,000 and 9,500 kWh of electricity per year.
6.1 Implications for SAP The analysis has highlighted a number of areas when the SAP and typical BREDEM energy modelling assumptions differ from those reported by households and seen in the temperature data. Future

72
development of these methodologies should consider whether these assumptions should be revised in light of these findings. It should, however, be recognised that assumptions used in energy models are often set at an aspirational standard (for health or warmth for example), or a standardised value for comparison, rather than attempting to model actual usage.
Although there are likely to be some inherent uncertainties in the temperature data due to the difficulty in determining the heating patterns accurately and also limitations in the ‘snapshot’ of responses given by householders in the interview survey, if the results from the householder reported data and the temperature loggers data are taken in combination the primary areas where SAP assumptions differ from those reported by households are:
§ The average (mean) length of the heating season, as derived from the householders’ interview responses is 5.6 months. There is no statistically significant difference between this and the mean heating season length derived from the temperature data, which is 5.7 months.
§ The results from both the household interview survey and the temperature data provide evidence that suggests that the 8 month heating season currently used in SAP (October to May) may be an overestimate of at least 1 month, possibly 2 months, compared to actual heating seasons, although this could be influenced by the milder than usual spring temperatures recorded in 2011.
§ Currently, SAP 2009 implements a heating pattern of 9 hours for weekdays and 16 hours for weekends in the living room for all heating system types. The results presented in this report suggest that the weekend hours are being overestimated in SAP and that the weekend hours of heating should be the same as the weekday hours.
§ Analysis undertaken in this report suggests that the 9 hours of heating currently used in SAP remains a reasonable approximation for centrally heated dwellings. The results from this analysis do suggest that SAP may underestimate the number of hours of heating in non-centrally heated dwellings.
§ Households that are in during the day on weekdays report heating their homes for a longer period of time (median 9.4 hours per day) than households that are not in during the day on weekdays (median 8 hours per day). This difference is lower than the typically assumed standards in many energy modelling applications which attempt to account for household occupancy.
§ Currently, SAP 2009 implements a demand temperature of 21°C in zone 1 and 18-21°C in zone 2. The results from the temperature data generally support these modelling assumptions, although the zone 1 temperature used in SAP is approximately 0.8°C higher than the average living room achieved temperature from the EFUS temperature data.
§ The temperature data shows that for those households heating twice a day, the first period of heating is typically for a short interval and the time that the heating is on for in many households is not sufficient to bring the room temperatures to the required temperatures. This finding differs to the current SAP methodology which assumes the demand temperature is met during the shorter heating period.

73
74
Glossary Age of dwelling: This is the date of construction of the oldest part of the dwelling.
Recorded by surveyors in the EHS physical survey.
Age of HRP: The Household Reference Person (HRP) is the person in whose name the dwelling is owned or rented or who is otherwise responsible for the accommodation. In the case of joint owners and tenants, the person with the highest income is taken as the HRP. Where incomes are equal, the older is taken as the HRP. This procedure increases the likelihood that the HRP better characterises the household’s social and economic position. The age of the HRP is derived from householder responses to q167/168/169/170 in the EFUS 2011 Interview survey for new households and from variables obtained from the EHS Interview survey for households that had not changed since the earlier EHS interview.
Annual gross income of the HRP and partner weighted quintiles:
This is the annual income of the Household Reference Person and (any) partner. This includes income from private sources (regular employment, self-employment, government schemes, occupational pensions, private pensions and other private income), state benefits/allowances and tax credits, as collected on the EHS survey (this includes housing benefit/Local Housing Allowance but excludes council tax benefit and Support for Mortgage Interest) and interest from savings. It is a gross measure i.e. income before Income Tax or National Insurance deductions.
Children Present: Anyone in the household who is 16 years old or younger. Derived from householder responses to q167/168/169/170 in the EFUS 2011 Interview survey for new households and from variables obtained from the EHS Interview survey for household that had not changed since the EHS interview.
Dwelling insulation: The number of insulation measures where positive responses for ‘Fully double glazed’, ‘Insulated walls’ and having loft insulation greater than 200mm count as insulation measures.
Dwelling type: Classification of dwelling on the basis of the surveyors’ inspections during the EHS physical survey.
Employment status of HRP and Partner combined:
Information on employment status was not re-collected as part of the EFUS and is as reported in the EHS interview survey (and some households may have changed status in the period between the two interviews).
Fuel Poverty – LIHC definition:
Under the Low Income High Cost definition a household is considered to be fuel poor where:
• They have required fuel costs that are above average (the national median level)
• Were they to spend that amount, they would be left with a residual income below the official poverty line.
Please refer to the following documents for more information. https://www.gov.uk/government/uploads/system/uploads/attachment

75
_data/file/66570/6406-fuel-poverty-changing-the-framework-for-measureme.pdf https://www.gov.uk/government/uploads/system/uploads/attachment_data/file/226988/fuel_poverty_stats_methodology_handbook_2013.pdf
Fully double glazed: Derived from the ‘dblglaz4’ variable as measured by surveyors in the EHS physical survey. Fully double glazed is ‘entire house double glazed’. Not fully double glazed is anything less than fully double glazed.
Household size: Number of persons in the household, banded into 5 groups, derived from the ‘hhsizex’ variable from the EHS Interview survey.
In during the day: See the EHS interview documentation for full details of occupancy questions asked as part of the EHS (question ‘Hmwtht’). A household has been classified as being ‘in during a weekday’ if they indicate being generally in the house on weekdays during the winter, for any period between 9am and 5pm. It should be noted that this information was not re-collected as part of the EFUS, and some households occupancy patterns may have changed in the interval between the two interview surveys.
Insulated walls: Derived from the ‘wallinsx’ variable as measured by surveyors in the EHS physical survey. ‘Insulated’ are ‘cavity with insulation’; ‘Not insulated’ includes ‘cavity without insulation’ and ‘other’ wall types.
Loft insulation: Banded variable of ‘loftinsx’, the level of loft insulation recorded by surveyors in the EHS physical survey.
Main fuel: As determined by surveyors in the EHS physical survey. Grouped into ‘mains gas’, ‘electricity’ and ‘other’, which includes bottled gas, bulk gas, solid fuels, oil and community schemes.
Pensioner Present: Anyone in the household who is 65 or over (male) or 60 or over (female). Derived from householder responses to q167/168/169/170 in the EFUS 2011 Interview survey for new households and from variables obtained from the EHS Interview survey for households that had not changed since the EHS interview.
Region: Government Office Region that the dwelling is located in. Obtained from the EHS.
Rurality: Is the dwelling in a rural (village or isolated hamlet) or urban (urban or town or fringe) location. Derived from the ‘rumorph’ variable in the EHS.
SAP rating: The energy cost rating as determined by Government’s Standard Assessment Procedure (SAP) and is used to monitor the energy efficiency of dwellings. It is an index based on calculated annual space and water heating costs for a standard heating regime and is expressed on a scale of 1 (highly inefficient) to 100 (highly efficient with 100
76
representing zero energy cost).
Tenure: Derived from householder responses to q01 in the EFUS 2011 Interview survey.
Type of heating: Central heating or non-central heating. Determined from householder responses to Q06 in EFUS 2011 interview survey. Non-central heating includes storage radiators, gas fires, electric heaters, coal/wood/ smokeless fuel fires or stoves and other.
Under-occupying: A household is considered to be under-occupying if the dwelling is more than large enough for the number (and type) of occupants living there. For the full definition of under occupancy, see the fuel poverty methodology handbook, which is available at: http://www.decc.gov.uk/assets/decc/Statistics/fuelpoverty/614-fuel-poverty-methodologyhandbook.pdf
Useable floor area: The total usable internal floor area of the dwelling as measured by the surveyor in the EHS physical survey, rounded to the nearest square metre. It excludes integral garages, balconies, stores accessed from the outside only and the area under partition walls. Grouped into 5 categories.

77
References McGill, R, Tukey, J.W. and Wayne, A. 1978. Variations of Box plots. The American Statistician, 32 (1) pp.12-16.
Shipworth, Michelle, Firth, Steven K., Gentry, Michael I., Wright, Andrew J., Shipworth, David T. and Lomas, Kevin J.(2009) 'Central heating thermostat settings and timing: building demographics', Building Research & Information, 38: 1, 50 — 69.
Kane, T, Firth, SK, Lomas, KJ, Allinson, D, Irvine, K (2011) Variation of indoor temperatures and heating practices in UK dwellings. In Chiana, T and Moran, F (ed) Conference on “Buildings Don’t Use Energy, People Do?” – Domestic Energy Use and CO2 Emissions in Existing Dwellings, Bath, UK, pp.2-10, ISBN: 978-0-86197-175-6.